Article

Characteristics of Urban Flood Resilience Evolution and Analysis of Influencing Factors: A Case Study of Yingtan City, China

1
Key Laboratory of Urban Stormwater System and Water Environment, Ministry of Education, Beijing University of Civil Engineering and Architecture, Beijing 100044, China
2
CAUPD (Beijing) Planning & Design Consultants Co., Ltd., Beijing 100044, China
3
Municipal Institute of City Management, Beijing 100028, China
4
China Railway Construction Network Information Technology Co., Ltd., Beijing 100043, China
*
Authors to whom correspondence should be addressed.
Water 2024, 16(6), 834; https://doi.org/10.3390/w16060834
Submission received: 7 February 2024 / Revised: 27 February 2024 / Accepted: 9 March 2024 / Published: 13 March 2024
(This article belongs to the Special Issue Urban Flood Mitigation and Sustainable Stormwater Management)

Abstract

:
Intense climate change and rapid urbanization have increased the risk of urban flooding, seriously affecting urban economic and social stability. Enhancing urban flood resilience (UFR) has required a new solution to cope with urban flood disasters. In this study, taking Yingtan city as an example, a system of indicators for evaluating UFR was constructed, with 17 representative indicators, comprising three subsystems: socio-economic, ecological, and infrastructural. A hybrid model combining Fuzzy Analytic Hierarchy Process (FAHP), Entropy Weight Method (EWM), and Technique for Order Preference by Similarity to Ideal Solution (TOPSIS) was applied, to develop an index-based measurement to compare and evaluate UFR, and Gray Relational Analysis (GRA) was used to discover the main factors affecting UFR. In addition, the natural discontinuous method was innovatively used to divide the UFR grade interval into levels, and the grade change was evaluated based on the TOPSIS method. The results showed that (1) From 2010 to 2022, the UFR in Yingtan City increased by 80.69%, and the factors affecting UFR were highly correlated with urban infrastructure development; however, the ecological resilience in the subsystem showed a fluctuating downward trend because of the influence of the surface area of lakes and rivers; (2) The grades of UFR for Yingtan City increased from Level III (2010 and 2016) to Level IV (2022), with local financial expenditures and the age structure of the population being the main factors currently limiting the development of UFR. The study provides a theoretical basis for the construction of an indicator system for assessing the UFR of Yingtan and proposes practical improvement directions for UFR.

1. Introduction

In the past few decades, the urbanization process in various countries around the world has maintained a rapid growth trend, and the proportion of impermeable surfaces is gradually increasing, inevitably leading to an increased risk of flooding in urban centers due to extreme rainfall [1]. At the same time, the occurrence of urban meteorological disasters has intensified due to climate change, which is mainly characterized by global warming [2]. More than 100 major flood disasters occur globally every year, causing huge losses to human life and property in flood-affected cities and seriously affecting urban economic and social stability [3]. It is estimated that the direct economic losses caused by floods in China from 1990 to 2018 came to over CNY 4 trillion [4]. China is the one of the countries in the world with a high incidence of floods and waterlogging, and devastating flood disasters have occurred in recent years, such as the flooding in Beijing city in 2012 [5] and in Zhengzhou city in 2021 [6].
Much research has been conducted in the last few years on flood hazards and disaster reduction methods, using approaches such as flood strategies [7] and flood risk simulation [8]. Considering the changing precipitation patterns and the damage caused by heavy rainfall in recent years, traditional safety concepts and disaster prevention measures are no longer sufficient to meet the needs of current and future urban development. The assessment and improvement of urban resilience are attracting a great deal of attention from researchers [9], and the concept of resilience has been widely used in many fields and disciplines. In 1973, a Canadian scholar first introduced the concept of resilience into the field of ecology [10]. Resilient cities refer to cities that have a strong ability to resist and absorb external interference, to quickly adapt to environmental changes, to maintain functional and system structure stability, and to promote rapid recovery in the face of disasters. There are new opportunities for urban flood prevention and disaster reduction by building resilient cities. The concept of urban flood resilience (UFR) has been proposed: responding to flood disasters with urban resilience construction, which enables a city to quickly restore its original socio-economic characteristics after a flood, thereby avoiding casualties and reducing economic losses [11].
Based on the concept of the resilient city, many assessment methods have been proposed to evaluate and analyze UFR; these include index systems, system function curves, and quantitative modeling. Index-based resilience assessment is the most commonly used method [12]. In addition, UFR has been studied by many scholars, using more sophisticated models such as the PSR framework, the socio-economic-natural complex ecosystem [13], and the system dynamics model [14]. Many models have also been built based on local demand for evaluating urban flood resistance capacity [15,16]. It is believed that UFR is closely related to a city’s economic development level. As the driving force for urban development, economic level directly affects urban infrastructure investment, flood control, disaster relief investment, per capita income, and industrial structure [17]. At the social level, as citizens are the main implementers of the concept of urban resilience, it is particularly important to actively mobilize citizen participation, integrate resources, break down psychological barriers, and form a collaborative management mechanism for a whole society. The age distribution, learning ability, and employment status of residents provide support for urban economic development, which has an important impact on disaster resistance and is directly related to a city’s resilience to floods. The infrastructure level is the key to ensuring the normal operation of a city during disasters: urban drainage networks, road conditions, and green coverage are considered important factors that affecting urban resilience [13]. However, there is currently no standard method suitable for assessing the UFR of any city since it is affected by many factors.
To understand the level of urban flood resistance, it is usually necessary to select multiple relevant indicators from different perspectives, to construct an evaluation framework. In the absence of standards for these indicators, multi-criteria decision-making (MCDM) methods can serve as a comprehensive evaluation or goal-ranking technique [18]. Numerous existing studies have used MCDM to explore urban flood issues. For instance, Lee et al. constructed an MCDM tool based on socio-economic development and climate change in a certain area of Seoul, South Korea to assess local flood vulnerability [19]. Sanaz Hadian et al. drew a flood risk map of Mazandaran Province, Iran, based on MCDM and analyzed the local residents’ ability to cope with flood disasters [20]. Kelly et al. developed a large-scale flood risk assessment tool based on MCDM and analyzed flood risks in Australia [21]. From past research, it can be seen that MCDM can be flexibly applied according to regional characteristics and research purposes. For multi-criteria decision making, the determination of indicator weights is very important. In previous studies, subjective weighting methods have been frequently used [22,23], but subjective weighting methods (such as AHP) are just improvements on the basis of hierarchical evaluation methods. Since they rely on the subjective scoring matrix of the respondents, their evaluation results are still relatively subjective [24]. On the other hand, EWM is an objective weighting method that assigns weights to indicators based on the amount of information they contain. This study adopts a method combining FAHP and EWM to reduce the subjective influence of the fuzzy hierarchical evaluation method. In addition, understanding the main factors limiting the development of flood resilience is a prerequisite for improving resilience levels. Previous studies have used the Geographical Detector Model to find indicators that restrict the development of flood resilience on a spatial scale [25]. GRA is a data analysis method that measures the geometric correspondence between factors [26]. This study uses the GRA method to explore the limiting factors of flood resilience on a temporal scale.
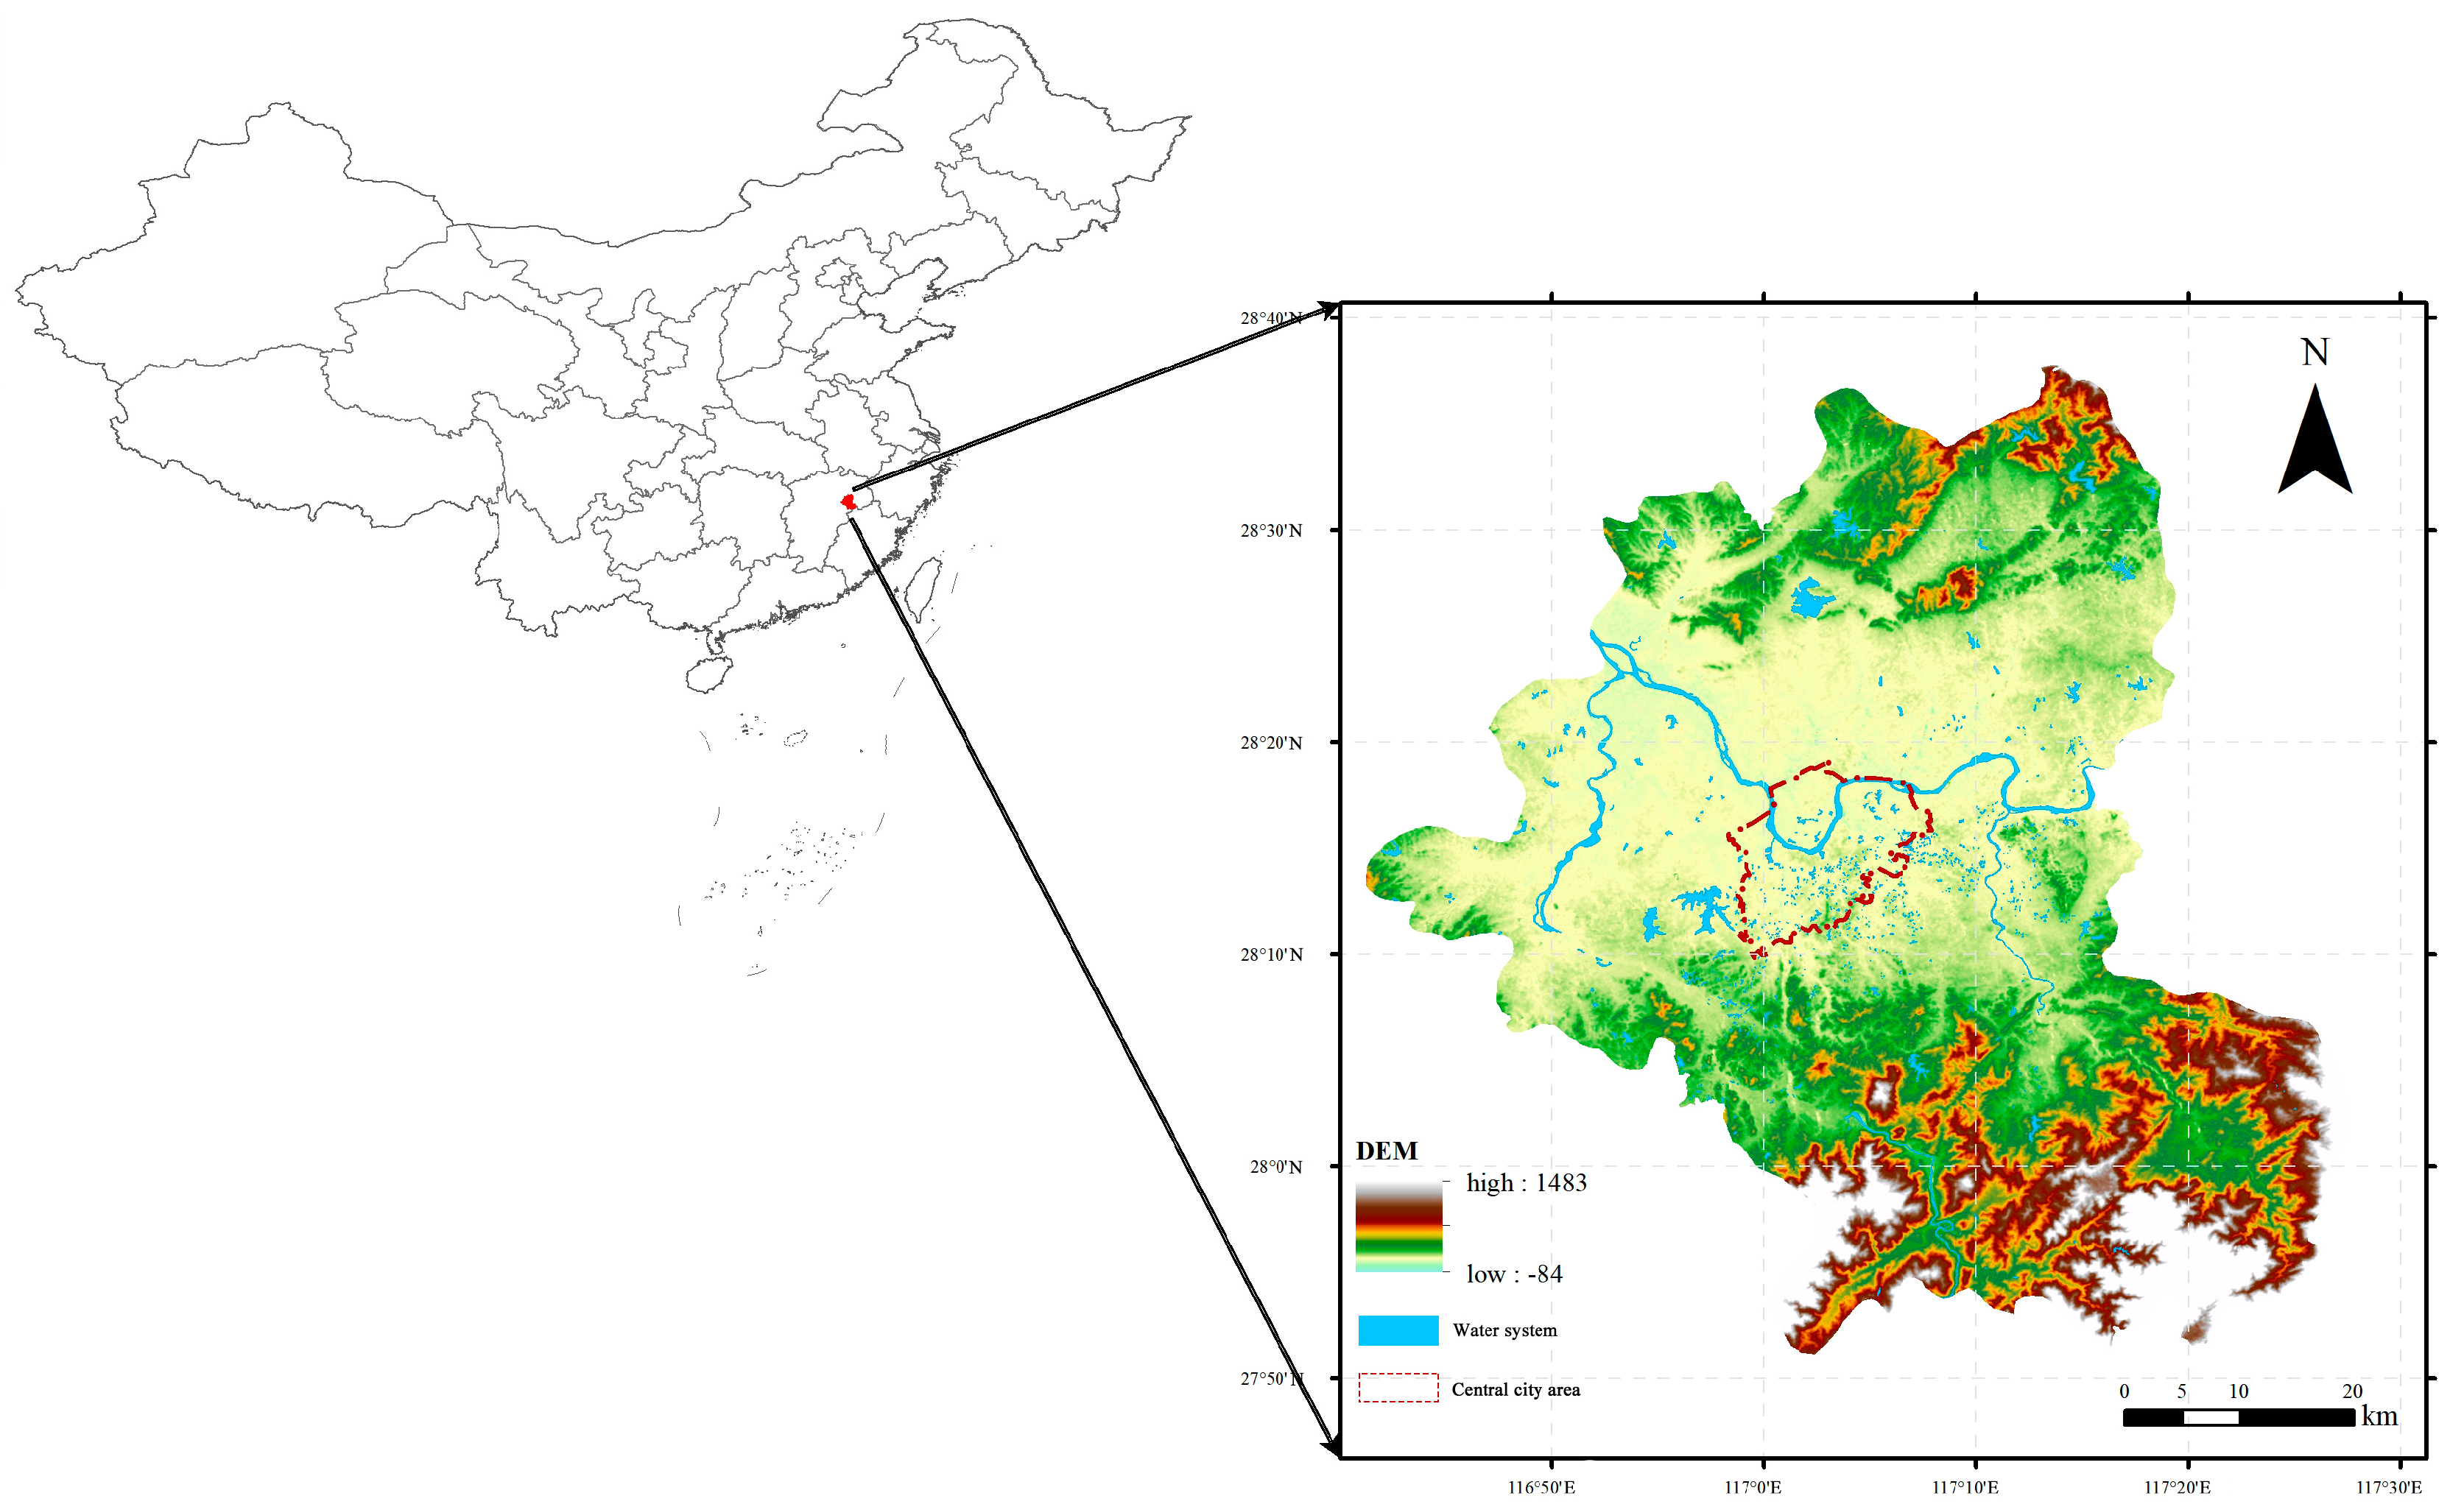
This study selected Yingtan City as the research subject. In 2022, Lee et al. conducted a study on the ecological resilience of the middle Yangtze River urban agglomeration, in which the ecological resilience of Yingtan City was at a moderate level [27]. In the same year, Yao et al. found that the sensitivity to flash floods in the northeastern part of Jiangxi Province was high, and Yingtan City, located in this region, was susceptible to flash floods [28]. At present, scholars have conducted a small amount of research on the resilience and flood disasters of Yingtan City, but the amount of research on the flood resilience of Yingtan City is relatively low. As part of the first batch of sponge city demonstration cities in China, it is crucial for it to implement the concept of flood resilience.
Previous studies have constructed various evaluation frameworks in search of standard assessment methods [29,30], but, due to the characteristics of the research area and the internal complexity of flood resilience, there are still gaps in flood resilience research from different perspectives and regions [31]. This study constructed an evaluation framework from three dimensions: social recovery, ecological recovery, and infrastructure recovery, using FAHP–EWM and TOPSIS as the measurement methods for UFR. The prominent contributions of this study are to quantify the urban flood resilience capacity by integrating indicators of socio-economic recovery, ecological recovery, and infrastructure recovery in Yingtan City and to find factors that restrict flood resilience from a temporal scale. In addition, under the guidance of the constructed evaluation framework, this study divided the levels of various indicators based on statistical data from all cities in China and further used the TOPSIS method to evaluate the flood resistance capacity of Yingtan City in the target year, which better guided the future development of Yingtan City’s flood resistance capacity. This is another contribution. The research results aim to construct an applicable flood risk analysis strategy, providing theoretical support for the improvement of flood resilience in Yingtan City.
The rest of this article is organized as follows. Section 2 introduces the study area and data. Section 3 describes the basic approach and the analysis steps of UFR evaluation. Then, in Section 4, we analyze the evolution characteristics of UFR in Yingtan from 2010 to 2022 and the UFR grades in three different years, utilizing the TOPSIS method.

2. Study Area and Data Sources

2.1. Study Area

Yingtan City, situated in the northeastern part of Jiangxi Province (Figure 1), stands at the crossroads where the Wuyi Mountains transition into the Poyang Lake Plain. Spanning coordinates from 27°35′–28°41′ N to 116°41′–117°30′ E, the city covers an area of 3556.7 square kilometers, encompassing Yuehu District, Guixi City, and Yujiang County. As of 2022, the city boasted a population of 1.155 million people and a GDP of CNY 123.76 billion. Yingtan City has numerous reservoirs. The city center is located in the middle and lower reaches of the Xinjiang River, where floods are mainly discharged through the Xinjiang River and its tributaries. The current flood control engineering system is primarily based on dikes. The large reservoirs that have been built upstream are all located in the upper reaches of the Xinjiang River. Since the city center of Yingtan is not within the catchment area controlled by the upstream reservoirs, the regulation capacity of the upstream reservoirs has a relatively small impact on the peak flow of the important flood control sections in the city. The Wuhu Reservoir, located downstream to the west of the city center, along with its tributaries and the lakes and wetlands formed on the west side, can absorb the incoming water from the city. The northeastern region where Yingtan City is located is one of the three major storm centers in Jiangxi Province, and it has suffered from flood disasters multiple times in history. In the 74 years since 1949, Yingtan City has experienced 10 significant flood disasters, with a total direct economic loss of nearly CNY 10 billion. The most severe incident occurred from 16 to 20 June 2010, when a storm triggered a flash flood, causing a rapid rise in river levels. The disaster affected 571,000 people citywide, and more than 200,000 houses were flooded. The direct economic loss from this disaster reached as high as CNY 6.846 billion.
Since the advent of China’s reform and opening up, rapid urbanization has given rise to a spectrum of challenges. Urban systems have become increasingly susceptible to both natural disasters and societal crises, each capable of posing a potentially destructive threat to the city. In response, China introduced the concept of sponge cities to fortify urban resilience against flood disasters. Yingtan City secured its position as one of the pioneering demonstration cities for sponge city construction in 2021. This endeavor encompasses a broad spectrum, spanning from high-level planning and project design to on-site construction, with a primary focus on infrastructure and low-impact development to address these challenges. However, the socio-economic framework and ecological equilibrium of the city also serve as pivotal factors in mitigating floods. Hence, it remains crucial to delve into Yingtan City’s flood resilience from a holistic perspective.

2.2. Data Sources

This study collected urban construction, socioeconomic, and other related data related to Yingtan City from 2010 to 2022. The data were sourced from the China City Statistical Yearbook https://data.cnki.net/ (accessed on 11 October 2023), China Urban Construction Statistical Yearbook https://www.mohurd.gov.cn/ (accessed on 11 October 2023), and Yingtan City National Economic and Social Development Statistical Bulletin https://data.cnki.net/ (accesseed on 11 October 2023), which contain information provided by relevant units in Yingtan City. For individual missing data, interpolation and supplementation were carried out based on adjacent years. Specifically, the population age structure indices for 2013, 2014, and 2018 were obtained through interpolation.

3. Methodology

3.1. Overall Framework
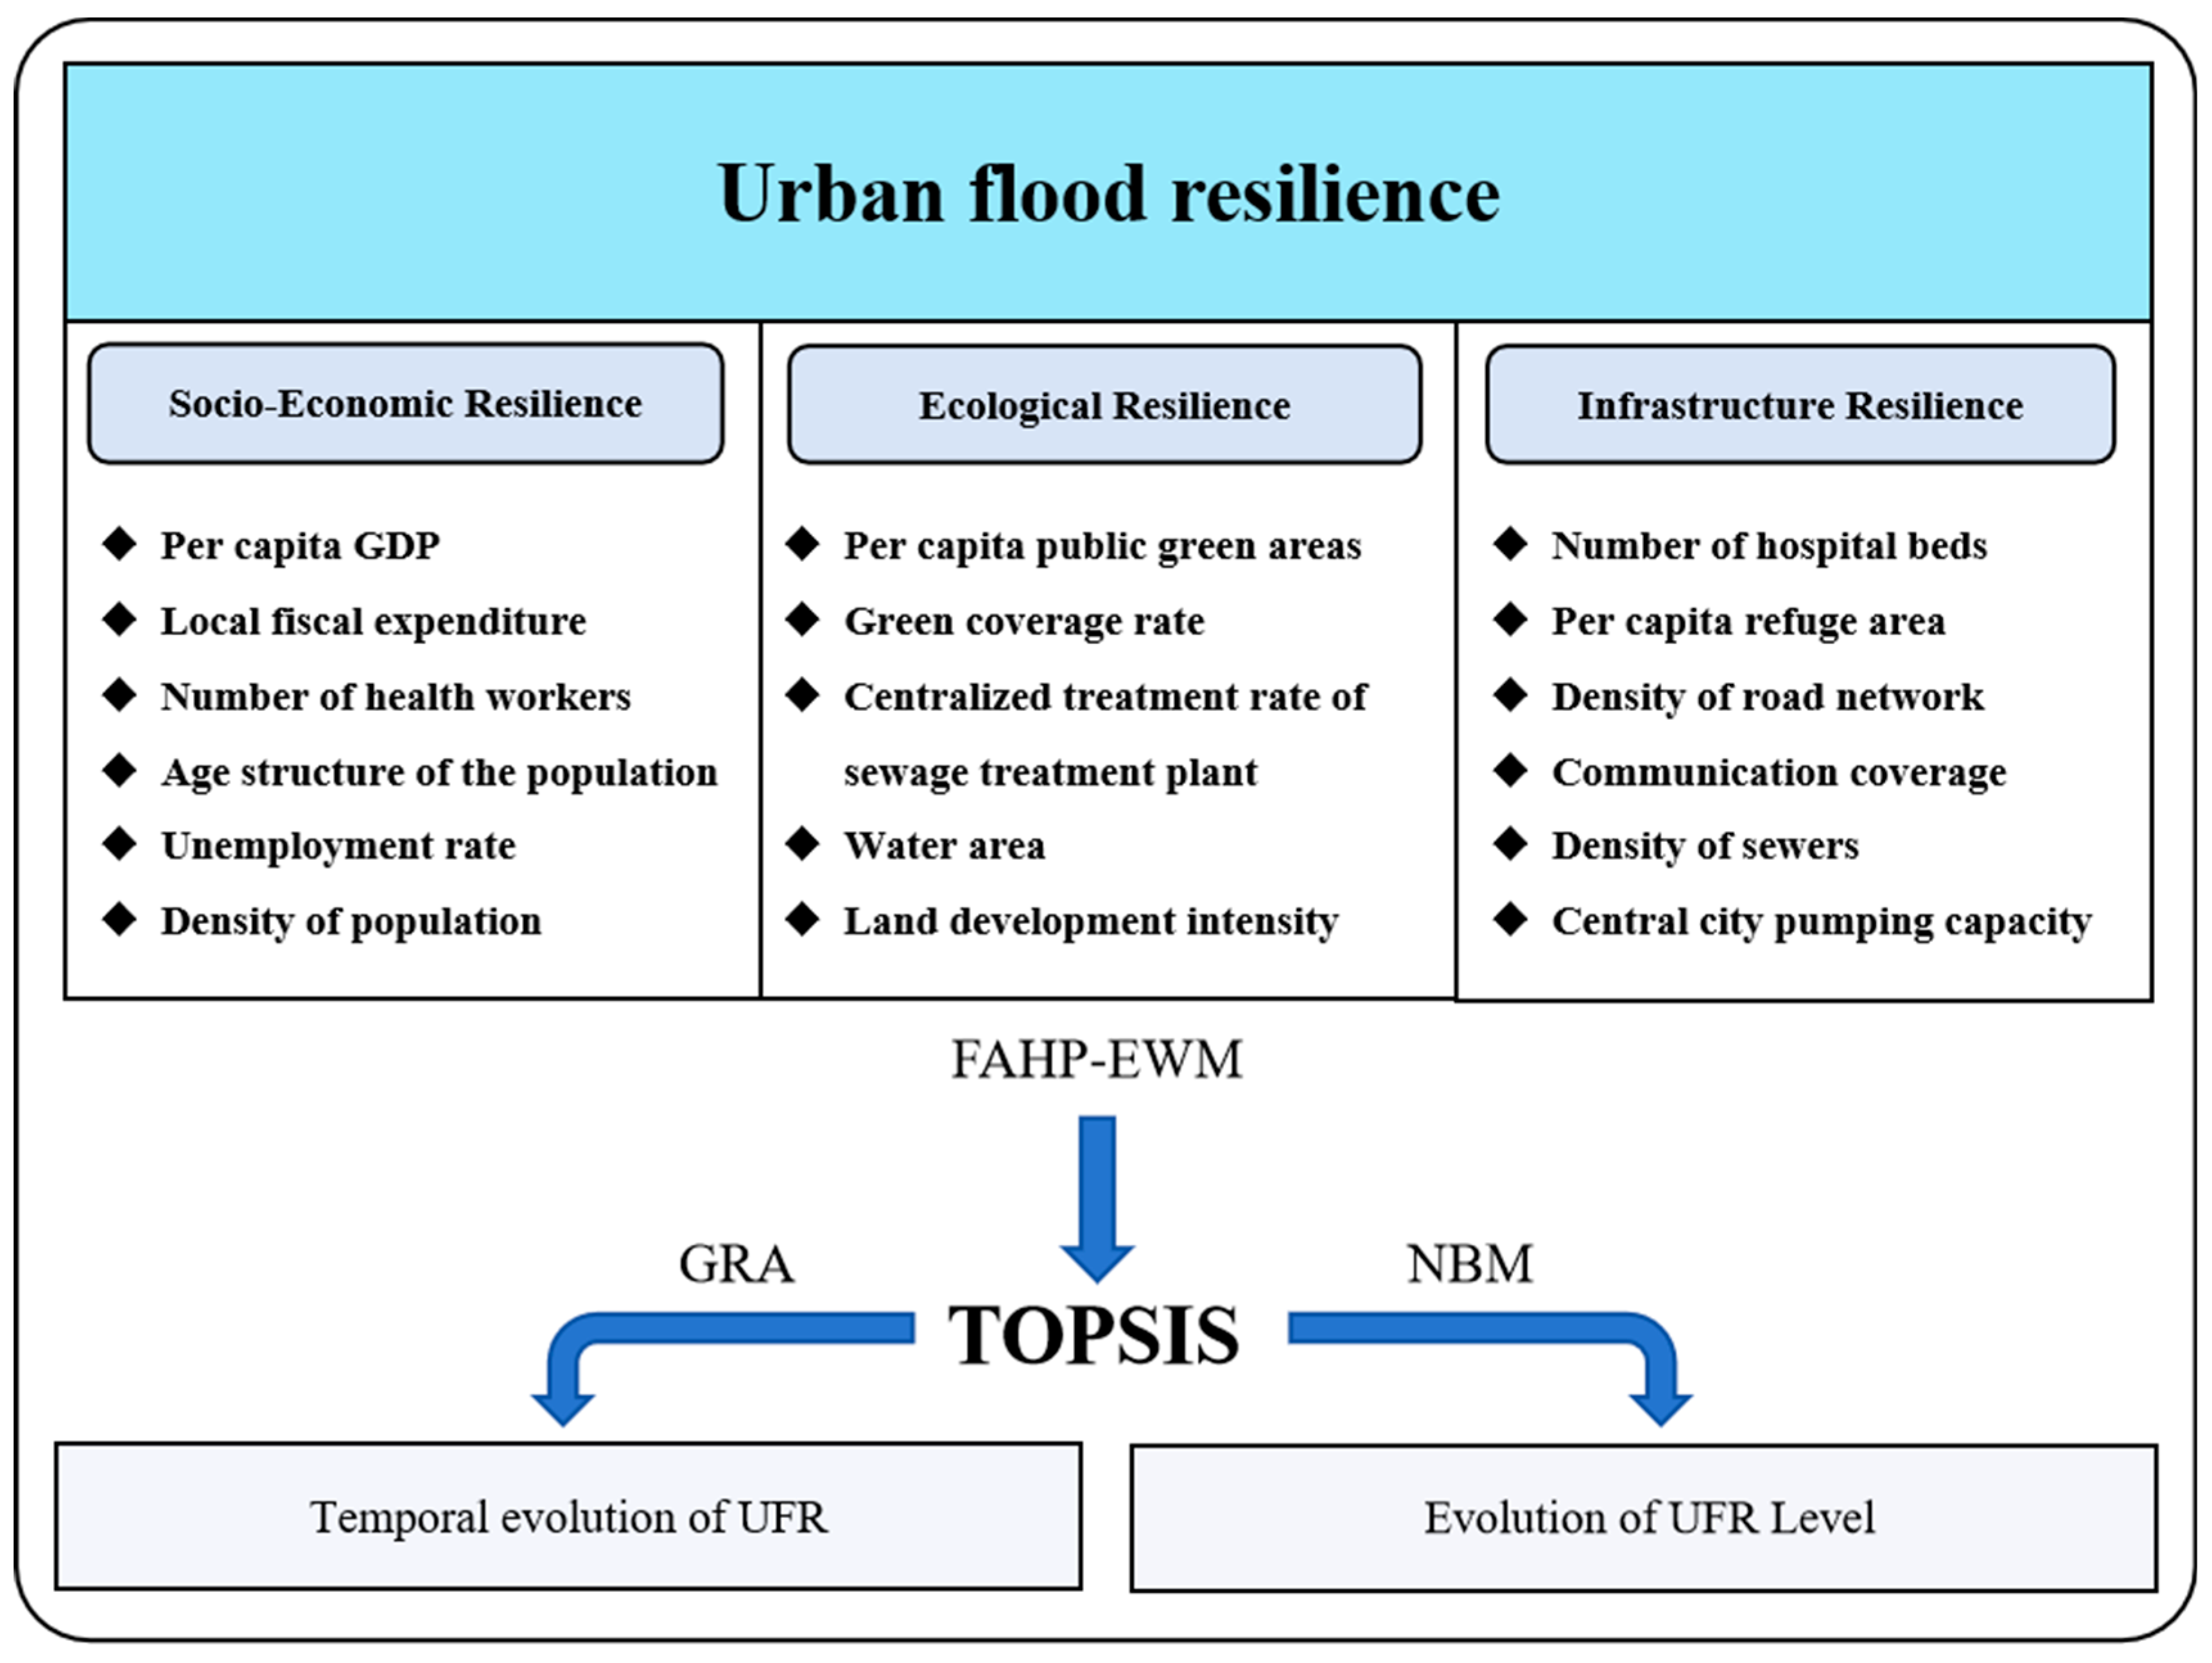
As shown in 
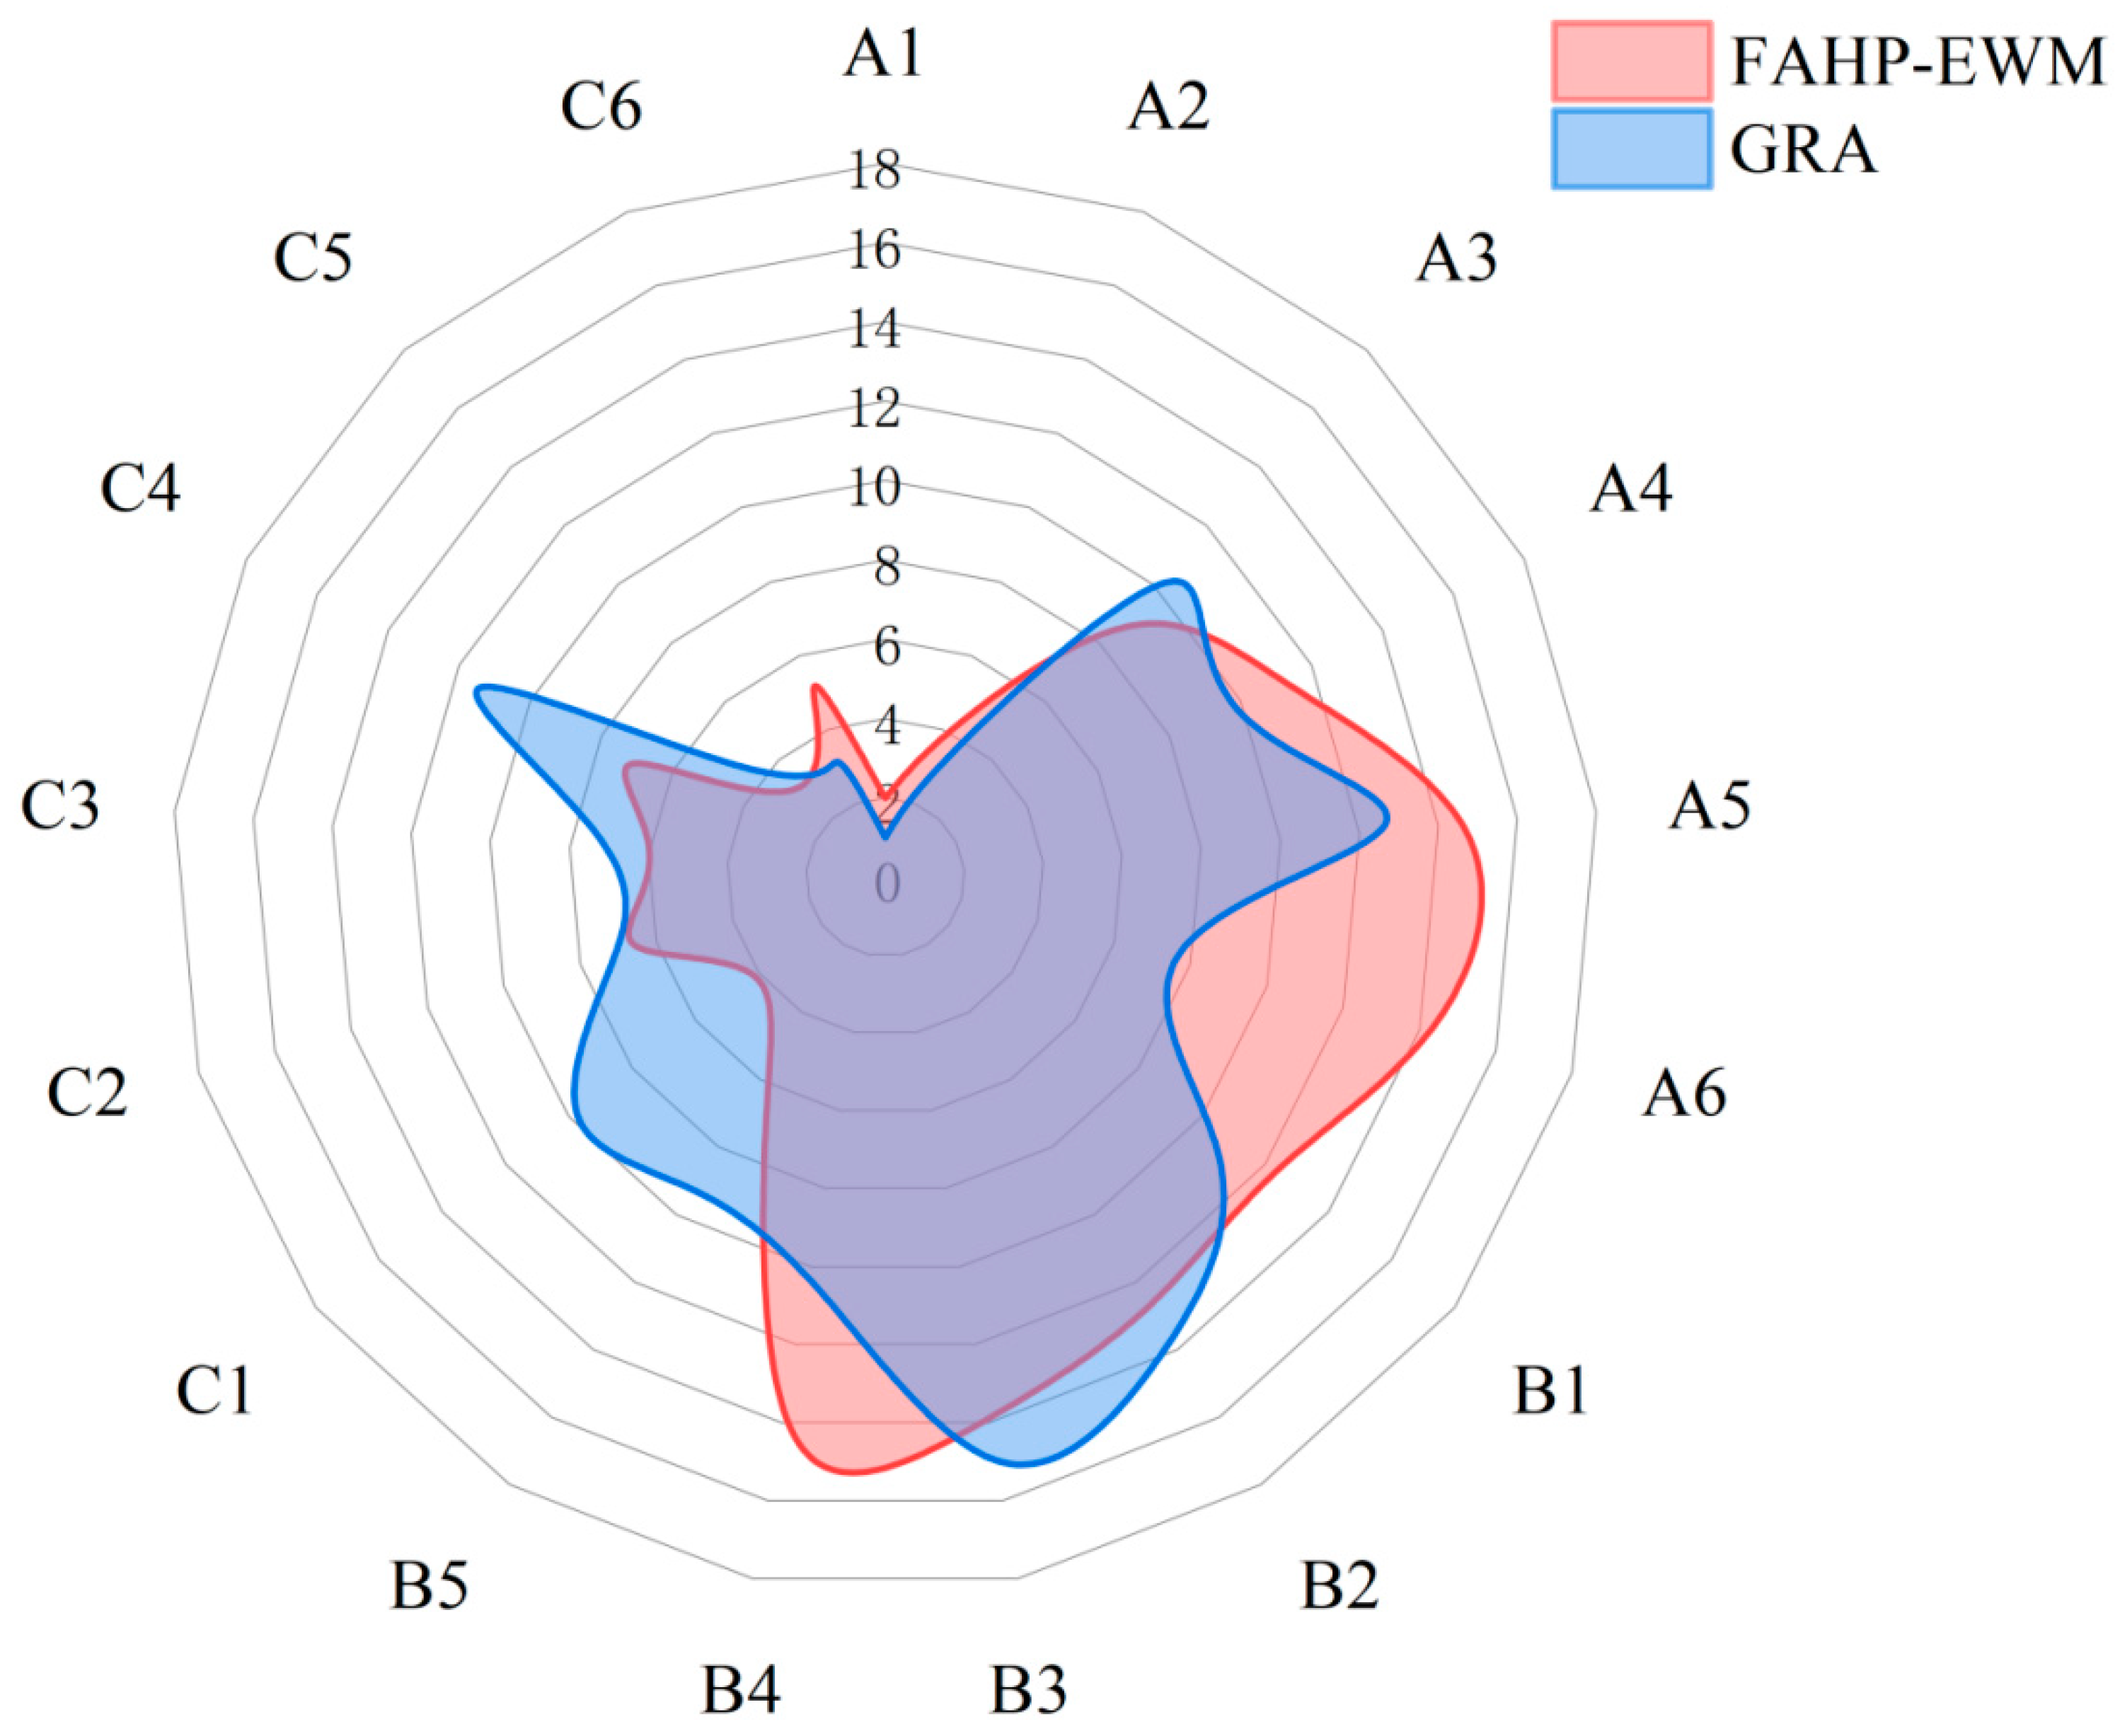
Figure 2, this article establishes an overall assessment system for UFR based on the UFR evaluation framework. The content is divided into three parts: (1) the construction of the UFR evaluation framework, consisting of three primary indicators—social resilience, ecological resilience, and infrastructure resilience—and 17 secondary indicators; (2) the use of Gray Correlation Analysis to validate the rationality of the UFR evaluation framework’s indicator weights, along with an analysis of the contributions of indicators to regional UFR; (3) an analysis of the temporal evolution characteristics of UFR in Yingtan City and an assessment of the changes in UFR levels there, based on the Technique for Order Preference by Similarity to Ideal Solution method.
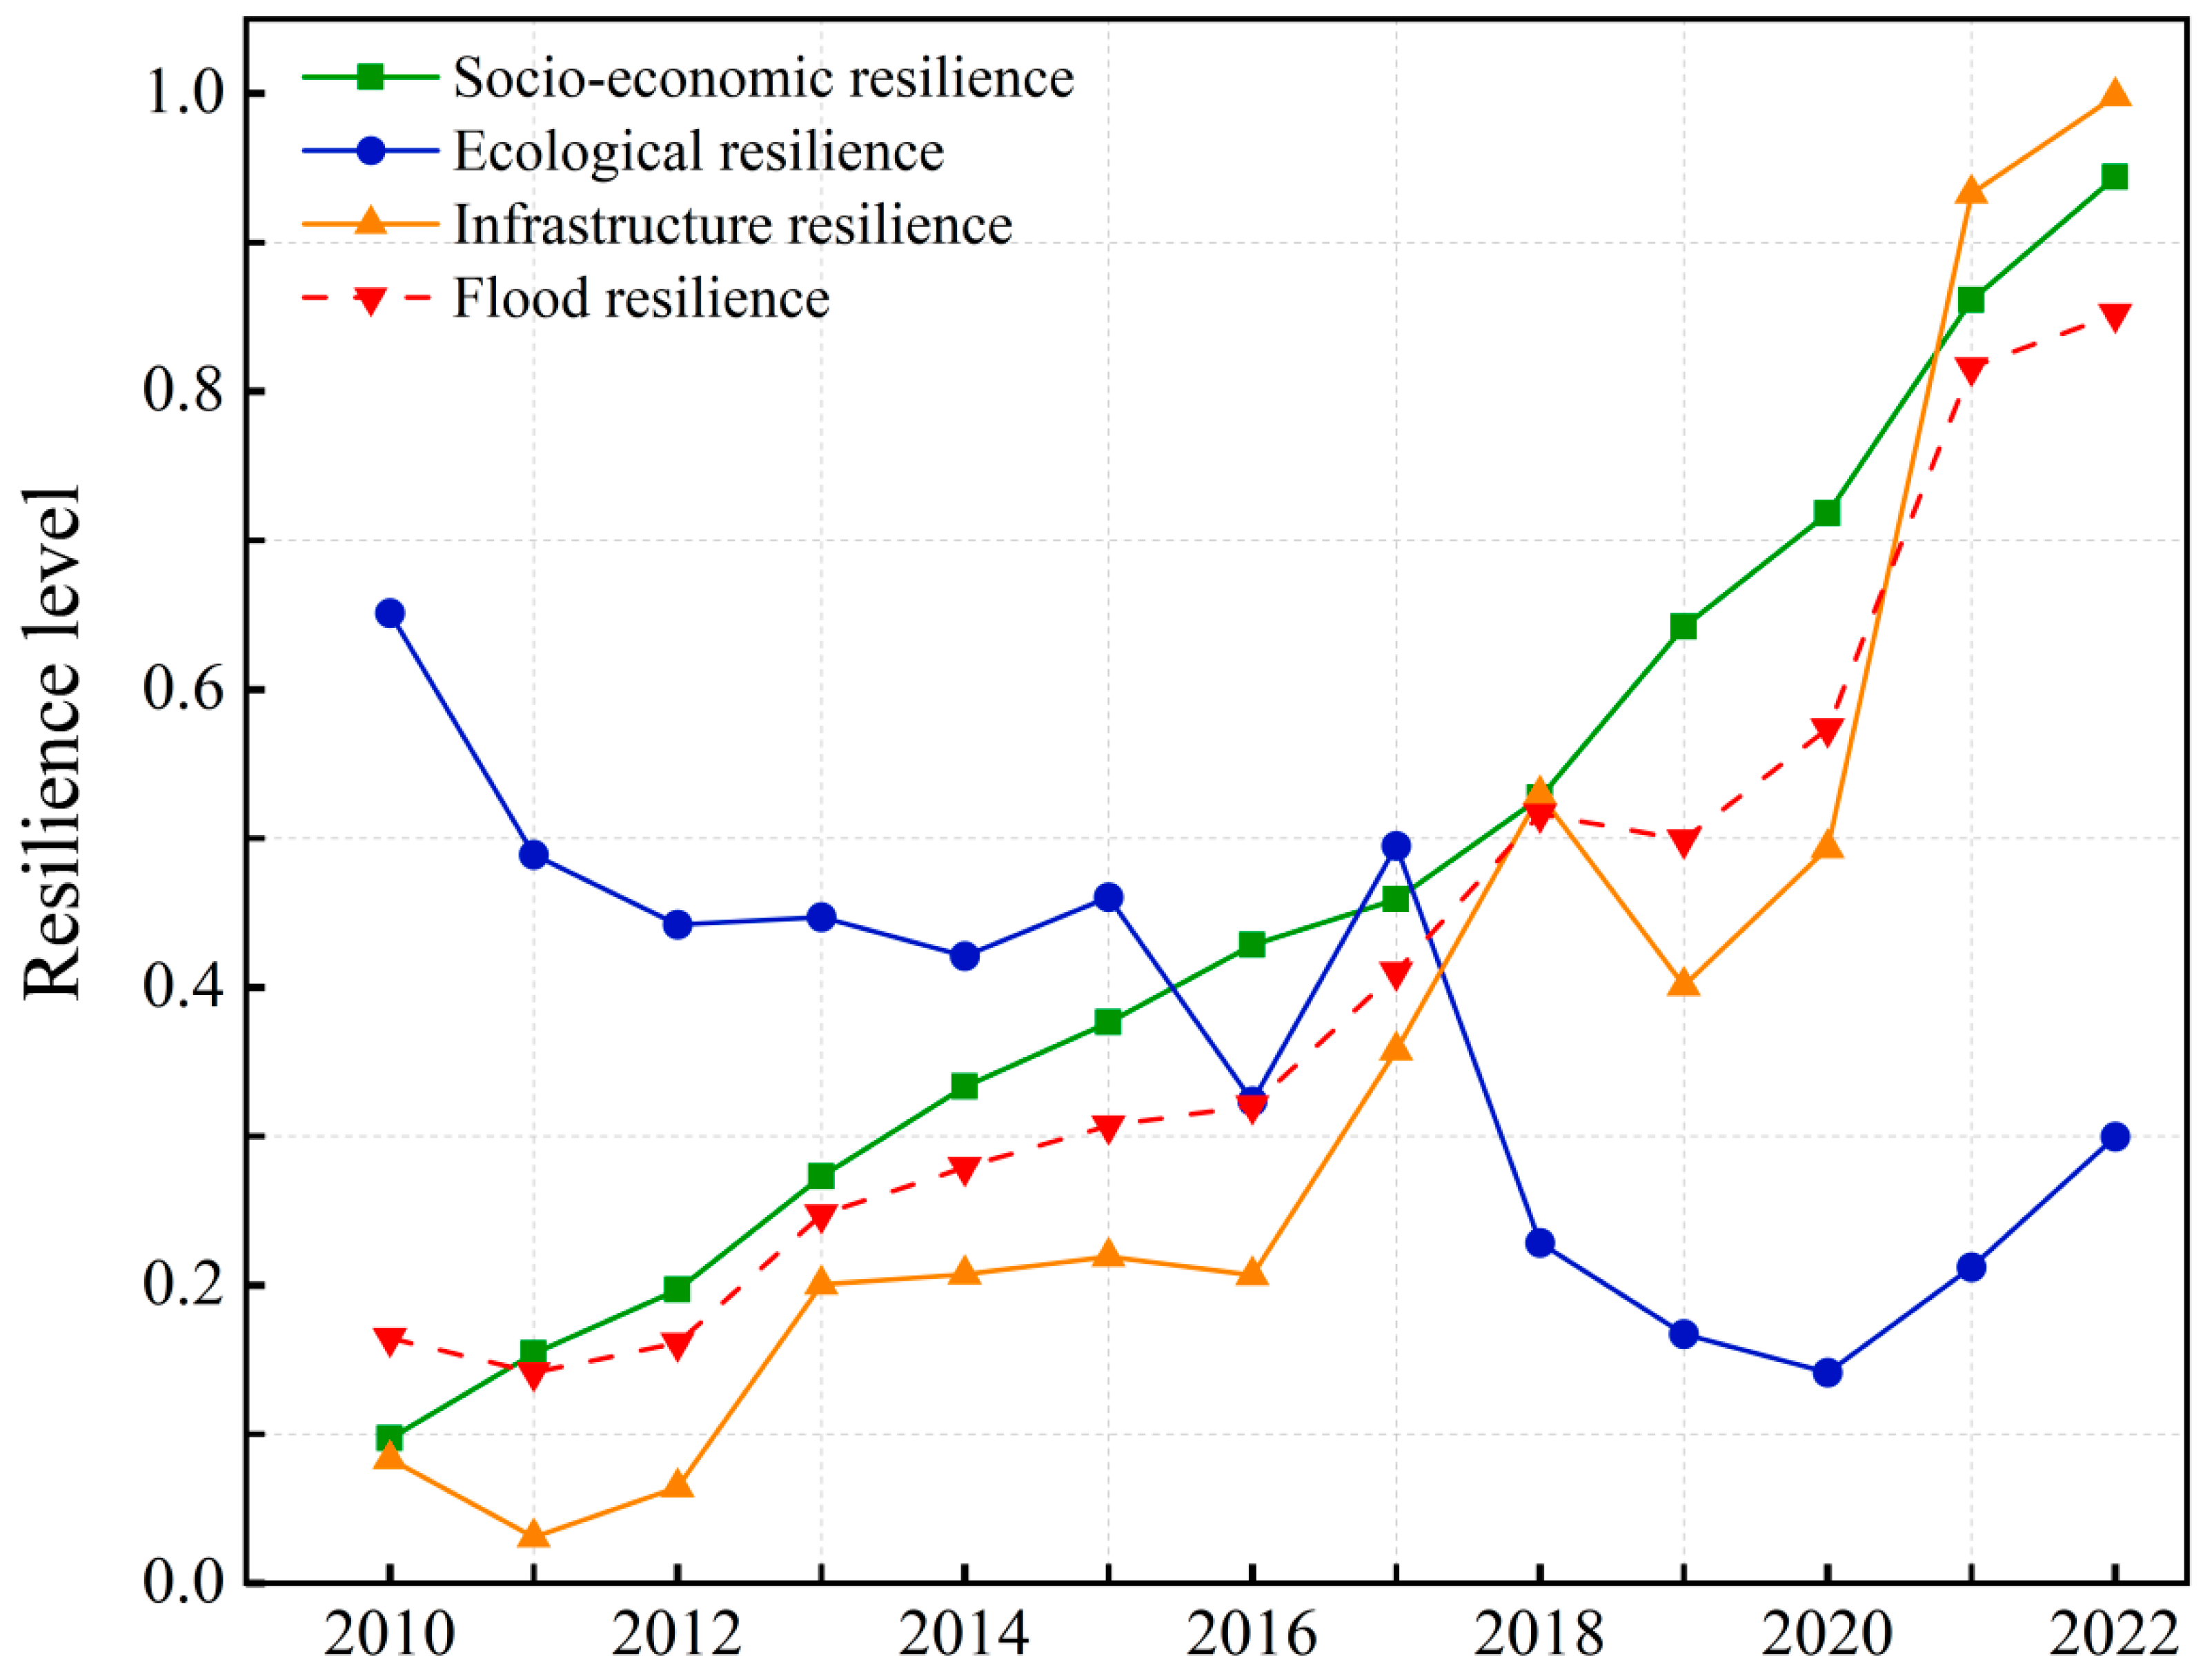
Firstly, a UFR assessment indicator system was established, comprising three subsystems: socio-economic resilience, ecological resilience, and infrastructure resilience. Subsequently, a combined subjective–objective approach (FAHP–EWM) was employed to assign weights to 17 secondary indicators. On this basis, the evolution characteristics of flood resilience levels in Yingtan City from 2010 to 2022 were explored using the TOPSIS and GRA methods. In addition, to better guide the future development of flood resilience in Yingtan City, we applied the Natural Breaks Method (NBM) to divide the resilience levels into three annual intervals. Subsequently, the TOPSIS method was used to assess the flood resilience level for the target years in Yingtan City.

3.2. Index System for UFR

3.2.1. Primary Indicators

Currently, the concept of urban safety resilience is underdeveloped, and its connotations and domain extensions remain ambiguous [32]. Scholars’ assessments of urban rain-flood resilience involve various aspects such as ecology, society, economy, environment, and climate. However, there is still no standardized evaluation system [3,33]. Drawing on previous research, it has been found that, when cities are unable to maintain their current state in the face of challenges, the social and economic structures have the flexibility to create entirely new systems [34]. At the same time, social and economic conditions are directly related to the resilience and recovery capabilities of cities in coping with flood disasters [35]. The selection of social-economic resilience serves as a crucial dimension within the UFR assessment framework. Some studies have indicated that the dimensions of urban ecological resilience and infrastructure resilience are of significant importance in assessing the recovery capability from flood events [36]. Urban areas with ecological vulnerabilities are highly susceptible to flooding and waterlogging [37,38,39], highlighting the crucial impact of ecology on the recovery capacity from urban waterlogging. Urban ecological resilience, with its connotations of ecological resources and environmental restoration, is a suitable dimension for assessment. Furthermore, when floods occur, urban infrastructure plays a direct role in the discharge of rainwater. Some scholars have utilized hydraulic models for scenario simulations, relying on urban infrastructure parameters to assess urban waterlogging risk [40,41]. We have chosen infrastructure resilience as one of the assessment dimensions, as it is closely associated with urban waterlogging recovery capabilities. This study considers social resilience, ecological resilience, and infrastructure resilience as primary indicators, allowing for a more comprehensive analysis of the contribution of each dimension to UFR and the constraints of each subsystem’s indicators.

3.2.2. Secondary Indicators

In order to accurately assess the UFR level of Yingtan City, this study referred to the “Guidelines for the Evaluation of Safety Resilient Cities” (GB_T 40947-2021) and the other relevant literature. Based on the actual conditions of the study area, indicators highly correlated with Yingtan City’s UFR were selected. Subsequently, the Delphi Expert Survey Method was used to conduct a questionnaire survey on experts in relevant fields to screen indicators. The questionnaire is detailed in Table S1. This study invited experts from the fields of urban planning, emergency management, and urban water services. Their professional knowledge and experience could comprehensively cover all aspects of the research, and they had a deep understanding of the actual situation in Yingtan City. Their evaluation results ensured the comprehensiveness and accuracy of the results. While ensuring the accuracy and comprehensiveness of the evaluation results, excessive expert opinions may lead to redundancy of information, which may affect the clarity and operability of the evaluation results [42]. Therefore, this study selected a total of five experts for indicator screening. The details of the expert group can be found in Table S2. Ultimately, the experts, considering the three major attributes of urban rain-flood resilience and following the principles of scientific validity, relevance, representativeness, and feasibility, conducted a detailed assessment and screening of the indicators. Finally, 17 secondary evaluation indicators representing urban socio-economic resilience, ecological resilience, and infrastructure resilience were selected, establishing the UFR assessment indicator system for Yingtan City. The reasons for selecting each secondary indicator are as follows.
As shown in Table 1, after expert evaluation and screening, six indicators—per capita GDP (A1), local fiscal expenditure (A2), number of healthcare workers per 10,000 population (A3), percentage of population aged over 60 and under 18 (A4), unemployment rate (A5), and density of population (A6)—were selected to characterize the socio-economic resilience of the city. Regional post-disaster recovery or reconstruction relies on local financial inputs, and regions with strong economic dynamics are better equipped to deal with challenges. For instance, the GDP volume in Zhengzhou City during the pre-, mid-, and post-incident stages of the 2021 flood disaster exhibited a systematic change [43], indicating that per capita GDP and local fiscal expenditure can largely reflect local flood recovery capabilities. Density of population was considered due to its positive correlation with flood risk; higher population density tends to lower resilience levels [44]. In regions with a higher proportion of socially vulnerable groups, the proportion of flooded areas in the floodplain tends to increase [45]. Conversely, an increase in the number of individuals covered by health insurance can mitigate this risk. Previous research has utilized the population age structure index and the number of healthcare workers to assess socio-economic resilience [46]. The ecological resilience (Table 1) was assessed by combining five indicators: per capita public green area (B1), green coverage rate of the built-up area (B2), the centralized treatment rate of the sewage treatment plant (B3), the surface area of lakes and rivers (B4), and land development intensity (B5). In urban development, different types of landscape exhibit significant differences in runoff generated during rainfall events [47]. In highly developed regions, extensive areas of impermeable surfaces increase the risk of urban flooding. In contrast, green spaces, as the primary permeable ground in cities, effectively reduce the runoff coefficient during rainfall events, thereby decreasing the probability of flood occurrence [48]. Therefore, the three secondary indicators of per capita public green area, the green coverage rate of the built-up area, and the land development intensity play a significant role in UFR. Urban water bodies possess natural storage capacity and are indispensable indicators in waterlogging studies. Regions with a higher water area tend to have a lower flood risk index [49]. Additionally, the urban centralized treatment rate of the sewage treatment plant reflects the construction of sewage treatment facilities and the level of urban sewage management. Given its attributes related to both infrastructure and ecology, and to balance the number of elements in each primary indicator, sewage collection rate was included in the ecological resilience dimension. The assessment of urban infrastructure resilience (Table 1) was conducted by combining six indicators: number of hospital beds per ten thousand population (C1), per capita refuge area (C2), density of road network in built district (C3), communication coverage (C4), density of sewers in built district (C5), and central city pumping capacity (C6). Density of sewers and pumping capacity are crucial indicators representing the capability to discharge rainwater effectively [50,51]. In urban areas, rainfall-induced flooding directly impacts the traffic condition of roads. Road density is highly correlated with flood risk [52]. However, roads can also serve as drainage channels after extreme rainfall, accelerating the discharge of accumulated water. Simultaneously, the recovery of transportation functions in high-density road areas significantly expedites the reconstruction process. Communication coverage, per capita refuge area, and the number of hospital beds per 10,000 population were selected from an emergency perspective. Per capita refuge area includes urban parks, green spaces, and elevated open squares that can be used as areas to mitigate flood disasters [53].
Based on the positive and negative impacts of the 17 indicators on UFR, positive and negative indices were assigned. Positive indices represent a positive correlation with the level of UFR, while negative indices indicate a negative correlation. This assessment resulted in a total of 13 positive indicators and 4 negative indicators.

3.3. Subjective and Objective Weight Calculation Method

The FAHP–EWM method has been validated to improve the accuracy of results in previous studies [54]. Online survey questionnaires were administered to five experts in construction, meteorology, emergency management, and related fields, obtaining initial score judgment matrices for the primary and secondary indicators in the UFR assessment framework. Subsequently, FAHP was used to calculate the relatively subjective weight values, and EWM was employed to determine the final objective weights of the indicators.
The calculation steps of the Fuzzy Analytic Hierarchy Process (FAHP) are as follows:
(1)
Constructing Judgment Matrix:
Following the hierarchy model, construct fuzzy judgment matrices layer by layer based on expert scores. Each element in the matrix represents the fuzzy relationship of the ith element relative to the jth element in the lower layer. In each layer, elements are compared pairwise according to the 0.1~0.9 scale method, using the adjacent elements in the upper layer as criteria to construct the fuzzy judgment matrix:
A = a 11 a 12 a 1 n a 21 a 22 a 21 a n 1 a n 1 a n n
(2)
Constructing the Fuzzy Consistency Judgment Matrix:
r i j = k = 1 n a i k k = 1 n a j k 2 n + 0.5 ,     ( i , j = 1 ,   2 ,   ,   n )
(3)
Calculating Subjective Weights for Each Evaluation Criterion:
W F j = ( w 1 , w 2 , , w i )
where w i is the weight of the i th criterion, and the weight calculation formula is as follows:
w i = k = 1 n r i k 1 n a 1 2 a + 1 n ,      ( i = 1 ,   2 ,   ,   n )
among a = n 1 2
(4)
Consistency Index Check:
When the consistency index (CI) is I ( R ,   W * ) α , the judgment matrix can be classified as a fuzzy consistent judgment matrix. Typically, a threshold value denoted as ‘ α ’ is used, and it is commonly set to α = 1 :
I R ,   W * = 1 n 2 i = 1 n j = 1 n r i j + w i j 1 α
The calculation steps of the Entropy Weight Method (EWM) are as follows:
(1)
Build the Initial Assessment Matrix:
Construct the initial matrix with m objects and n indicators:
X = x i j m × n
(2)
Standardization of Indicator Data:
Due to significant differences in the nature and units of various indicators, to eliminate the influence of different units, the range method is used to standardize the data.
For positive indicators, the standardization formula is as follows:
x i j = x i j min x i j max x i j min x i j
For negative indicators, the standardization formula is as follows:
x i j = max x i j x i j max x i j min x i j
In the formulas, x i j represents the original data of the j th indicator for the i th unit, and x i j represents the standardized data for the j th indicator of the i th unit after processing;
(3)
Calculate the Information Entropy Value ( e j ):
p i j = x i j i = 1 n x i j
e j = i = 1 n p i j ln p i j ln n , i = 1 , 2 m ;   j = 1 , 2 n
In the formula, p i j represents the proportion of the j th indicator for the i th. e j is the information entropy for the jth indicator. The larger the entropy value ( e j ) for a particular indicator, the smaller its weight in the evaluation; conversely, a smaller entropy value implies a larger weight;
(4)
Calculate the Objective Weights W E j = ( w 1 , w 2 , , w j ) for Each Evaluation Criterion:
W E j = ( w 1 , w 2 , , w j )
where w j is the weight for the j th indicator. The weight calculation formula is as follows:
w j = 1 e j j = 1 m 1 e j
among 0 ≤ wj ≤ 1;
(5)
Determine the Comprehensive Weight of Indicators:
W = w F j w E j j = 1 n w F j w E j
In the formula, W is the comprehensive weight for the corresponding indicator, WEj is the weight obtained from the entropy weight method, and WFj is the weight obtained from the fuzzy analytic hierarchy process.

3.4. TOPSIS Comprehensive Evaluation Method

The fundamental idea of TOPSIS is based on a set of evaluation criteria, an established ideal solution, and a negative ideal solution [55]. The method calculates the distances between each alternative solution and the ideal and the most negative solutions. This computation results in a comprehensive score for each alternative solution. Considering the advantages of TOPSIS in the field of Multiple Attribute Decision Making (MADM), this study adopts TOPSIS as the evaluation method for assessing the UFR of Yingtan City from 2010 to 2022. The specific steps are as follows:
(1)
Define the multi-objective decision-making problem:
A i = x i 1 , , x i j , , x i n ,   i = 1 , , m ;   j = 1 , , n
(2)
Standardization of attribute properties:
x i j = x i j min x i j max x i j min x i j
x i j = max x i j x i j max x i j min x i j
where x i j represents positive indicators and x i j represents negative indicators;
(3)
Vector normalization of indicator data after processing:
R = r i j = x i j i = 1 m x i j 2 ,   i = 1 , , m ;   j = 1 , , n
(4)
Calculate the Weighted Normalized Decision Matrix:
V = R W = v i j = w j r i j ,   i = 1 , , m ;   j = 1 , , n
(5)
Determine the Positive Ideal Solution A + and Most Negative Solution A :
A + = v 1 + , v 2 + , , v j + , , v n + , = max i   v i j j J + , min i   v i j j J i = 1 , 2 , , m
A = v 1 , v 2 , , v j , , v n , = min i   v i j j J + , max i   v i j j J i = 1 , 2 , , m
where J + = j = 1,2 , , n | j represents positive indicators and J = j = 1,2 , , n | j represents negative indicators;
(6)
Calculate the Euclidean distance to the Positive Ideal Solution D i + and Most Negative Solution D i :
D i + = j = 1 n v i j v j + 2 ,   i = 1 , , m
D i = j = 1 n v i j v j 2 ,   i = 1 , , m
(7)
Calculate the proximity of the evaluation object to the most extreme solutions, i.e., the relative closeness between the evaluation object and the most positive and negative solutions. The calculation formula is
C i + = D i D i + + D i ,   i = 1 , , m
The urban resilience assessment results are expressed using the fitness degree, with a range of values from 0 to 1. When the value is closer to 1, the degree indicates closer proximity to the positive ideal point, implying a higher level of urban resilience. Conversely, when the value is closer to 0, it indicates closer proximity to the most negative solution, suggesting a lower level of urban resilience.

3.5. Gray Relational Analysis

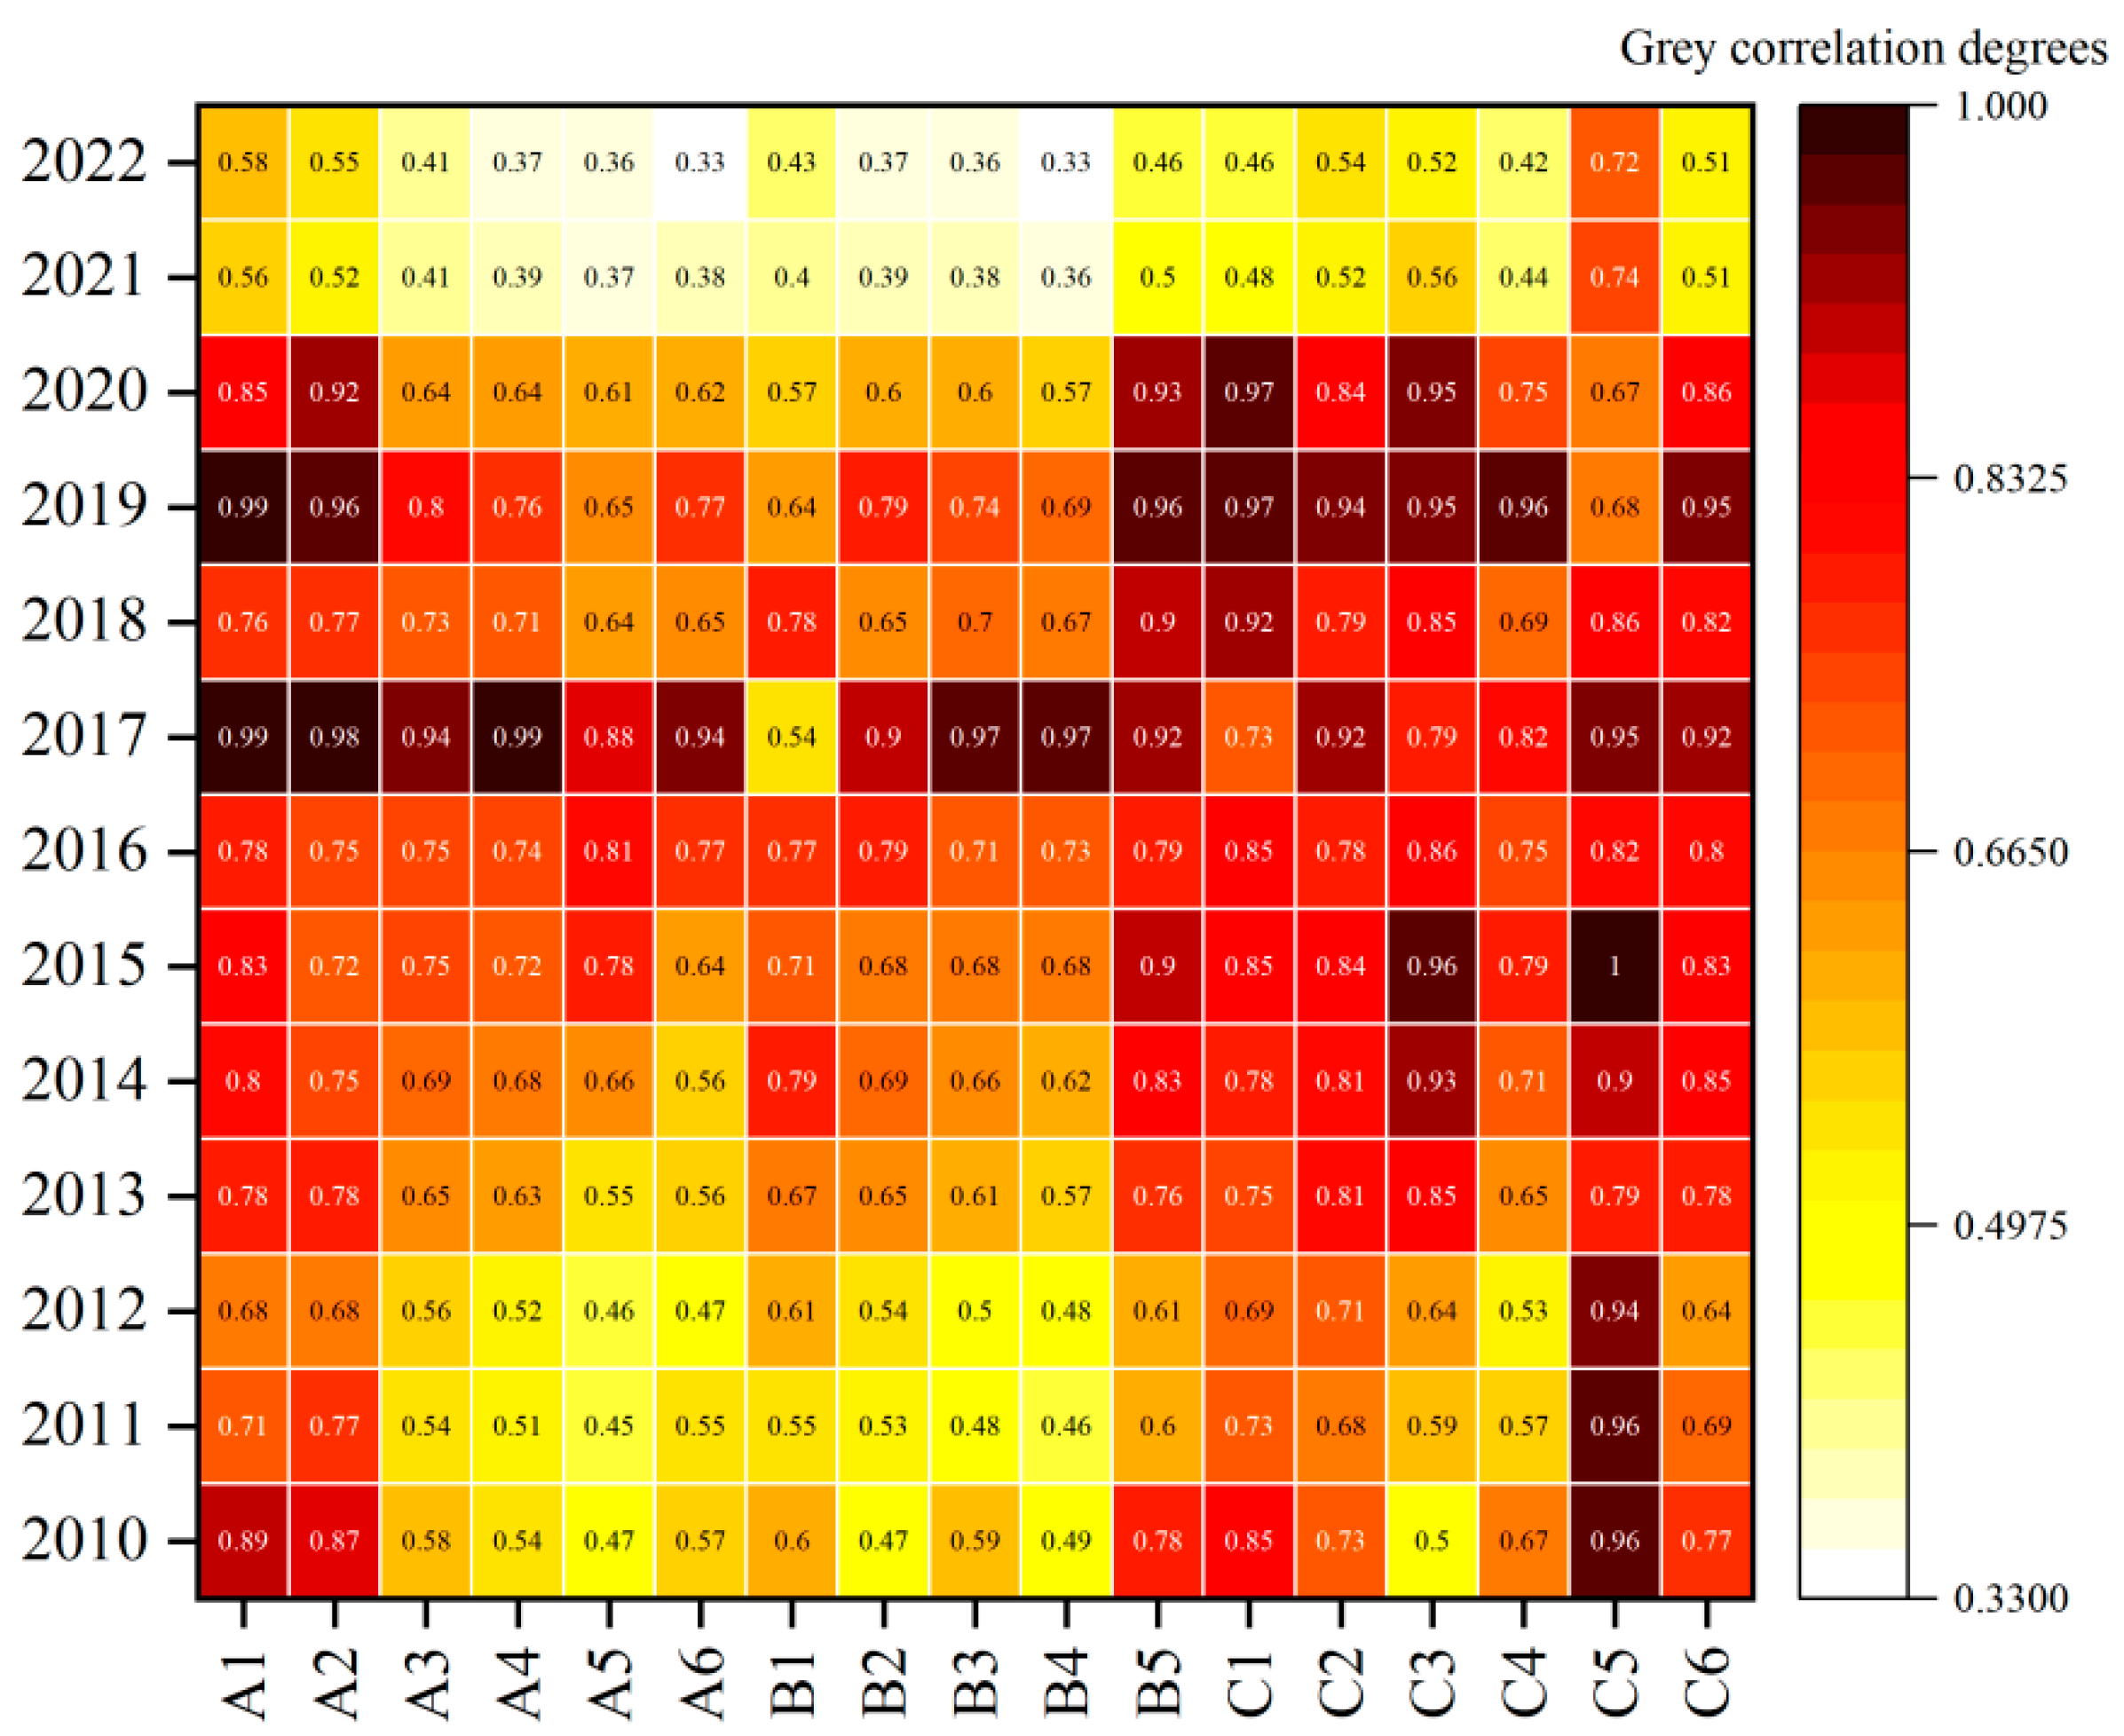
Gray Relational Analysis (GRA) is a multi-criteria decision-making method based on gray system theory. It is commonly used to analyze the correlation or measure the contribution of evaluation factors to evaluation results in uncertain and fuzzy multi-criteria data [56]. In this study, Gray Relational Analysis is employed to diagnose the important factors that influence UFR based on the geometric correspondence data among various indicators. A gray relational degree of an indicator in UFR greater than 0.5 indicates a close correlation. Additionally, indicators with a gray relational degree greater than 0.7 are considered significant factors that influence UFR [57].

3.6. Resilience Level Assessment

3.6.1. UFR Level Classification

The Natural Breaks Method is a univariate method based on cluster analysis. In cases where the number of classes is predetermined, it iteratively calculates data breakpoints between categories to minimize differences within the same category and maximize differences between different categories. This method has been effective in vulnerability zoning along coastlines and resilience-level assessments [58,59]. In this study, statistical yearbook data were collected for Chinese prefecture-level cities and some county-level cities, from 2010 to 2022. Given that indicators may fluctuate over different years, yearly data for each indicator in the assessment framework were selected and outliers were removed. Subsequently, NBM was applied to classify indicators such as population density and per capita GDP for all cities (as recorded in the statistical yearbook) in China. For indicators not recorded in the statistical yearbook, classification was based on national standards and technical specifications. A total of five levels were classified, with Level 1 indicating low resilience to floods, Level 2 indicating relatively low resilience, Level 3 indicating average resilience, Level 4 indicating relatively high resilience, and Level 5 representing high resilience. To assess the resilience levels of Yingtan city in 2010, 2016, and 2022, three classification interval tables were generated. The classification interval for 2010 is provided below (Table 2), and the classification intervals for other years are detailed in Supplementary Table S3 and Table S4. Using the assigned values corresponding to Levels I to V, each indicator was assigned a five-level indicator value, as shown in Table 3.

3.6.2. Establishment of Resilience-Level Evaluation Model

(1)
Constructing the Initial Evaluation Matrix A, based on the Indicator Level Values in Table 3:
A = 1 1 1 1 1 1 1 1 1 1 1 1 1 1 1 1 1 2 2 2 2 2 2 2 2 2 2 2 2 2 2 2 2 2 3 3 3 3 3 3 3 3 3 3 3 3 3 3 3 3 3 4 4 4 4 4 4 4 4 4 4 4 4 4 4 4 4 4 5 5 5 5 5 5 5 5 5 5 5 5 5 5 5 5 5
(2)
Calculating the comprehensive weight values of the 17 evaluation indicators according to FAHP–EWM:
After obtaining the weight of each indicator, the Ci of the five levels is calculated based on Equations (12)–(21). A higher relative closeness value, closer to 5, indicates a better performance. The results for Ci are presented in Table 4;
(3)
Establishing UFR level standards based on calculated relative closeness values for each level, as shown in Table 5.

4. Evaluation Index Set Analysis Results

4.1. Indicator Correlations

The gray correlation degrees of various dimensional indicators in Yingtan City were computed. The results, as depicted in Figure 3, highlight that, among the three primary evaluation indicators, the correlation between urban socio-economic resilience and urban rain-flood resilience stands out as the strongest, scoring a high gray correlation degree of 0.921. Following closely is urban infrastructure resilience, demonstrating a degree of 0.808, while urban ecological resilience exhibits the weakest correlation at 0.521. In the realm of secondary evaluation indicators, several indicators—such as per capita GDP (A1), local fiscal expenditure (A2), land development intensity (B5), the number of hospital beds per 10,000 population (C1), per capita refuge area (C2), density of road network in built district (C3), density of sewers in built district (C5), and central city pumping capacity (C6)—all display gray correlation degrees surpassing 0.75. Meanwhile, the remaining indicators also show significant correlation, exceeding 0.58. This signifies a robust connection between these evaluation indicators and the UFR of Yingtan City. Additionally, a comparison between the comprehensive ranking of gray correlation degrees and the comprehensive weight ranking obtained from FAHP–EWM reveals an alignment between the two (Figure 3). This alignment serves to further validate the rationality behind the selection of evaluation system indicators and the assignment of weights.

4.2. Temporal Evolution of UFR

Based on the judgment matrix formed by the experts’ scoring of the indicators, the subjective weights were first calculated (Equations (1)–(4)), then the objective weights were calculated through the Entropy Weight Method (EWM) (Equations (5)–(10)). Subsequently, the comprehensive weights of the indicators were determined by combining the subjective and objective weight values (Equation (11)). All weight matrices had a consistency indicator less than 0.1, passing the consistency test. Ultimately, the scores for socio-economic, ecological, and infrastructure resilience for each research unit were obtained (Table S3). Integrating the weight outcomes of the 17 indicators and the statistical data (Table S4), on the basis of the TOPSIS method, the yearly UFR was charted in Yingtan City from 2010 to 2022, encompassing socio-economic resilience, ecological resilience, and infrastructure resilience of subsystems. Furthermore, coupling the analysis of indicator GRA across dimensions allowed a deeper investigation into the primary drivers impacting resilience variations. Figure 4 visually depicts the temporal evolution characteristics of flood resilience in the research area.

4.2.1. Urban Flood Resilience

As illustrated in Figure 4, Yingtan City’s overall UFR exhibited an upward trajectory from 2010 to 2022. The resilience increased from 0.1646 in 2010 to 0.8522 in 2022, marking an impressive 80.69% surge. Examining the average gray correlation degree of UFR (Figure 3), density of sewers in the built district (C5) emerged with the highest degree at 0.84, closely followed by per capita GDP (A1) at 0.78. Several indicators demonstrated gray correlation degrees exceeding 0.7, including local fiscal expenditure (A2), land development intensity (B5), number of hospital beds per 10,000 population (C1), per capita refuge area (C2), density of road network in built district (C3), and central city pumping capacity (C6). These findings emphasize these indicators as pivotal factors driving the enhancement of flood resilience in Yingtan City. However, it is noteworthy that, in both 2011 and 2019, UFR experienced slight declines. Figure 5 shows that, in 2011, the indicator with the highest gray correlation was C5. Upon analysis of statistical data and computations (Table S4), the reduction in drainage pipe network density by 0.12 km/km2 compared to 2010 was the primary contributor to the 2011 UFR decline. In 2019, substantial disparities were observed in the gray correlation degree values among different indicators (Figure 5). Notably, indicators with higher gray correlation degrees were predominantly centered around infrastructure resilience. Overall, delayed progress in infrastructure development stood out as the primary reason behind the slight dip in flood resilience in 2019.

4.2.2. Socio-Economic Resilience

As depicted in Figure 4, between 2010 and 2022, the socio-economic resilience of Eagle Lake maintained its growth trend, as it increased by a total of almost 90%. The per capita GDP (A1) and local fiscal expenditure (A2) stand as pivotal metrics in measuring a city’s economic growth potential and explaining the regional recovery capability after flooding. Based on the gray correlation information (Table 6), A1 and A2 consistently rank among the top in gray correlation degree, of the six indicators, over the years. This suggests a significant impact of A1 and A2 on Yingtan City’s socio-economic resilience. Additionally, indicators such as the number of healthcare workers per 10,000 population (A3), percentage of the population aged over 60 and under 18 (A4), unemployment rate (A5), and density of population (A6) displayed a notable increase in gray correlation degrees from 2010 to 2017. However, these indicators exhibited a gradual decline from 2017 to 2022, indicating their advancement to relatively higher levels in 2017.

4.2.3. Ecological Resilience

As shown in Figure 4, from 2010 to 2020, Yingtan City experienced a decline in ecological resilience, dropping from 0.65 to 0.14. However, by 2022, it rebounded to 0.3, indicating a pattern of initial decrease followed by a subsequent recovery, resulting in an overall decline of 58%. The surface area of lakes and rivers (B4) represents a city’s innate water storage capacity during flood disasters. Gray correlation analyses from 2010 to 2020 (Table 7) highlight B4 as having the highest gray correlation degree, followed by the green coverage rate of built-up area (B2) and the centralized treatment rate of the sewage treatment plant (B3). This suggests that B2, B3, and B4 primarily contributed to the decline in ecological resilience. Between 2020 and 2022, though, there was an uptick in resilience. During this period, B4 ranked highest in gray correlation degree, followed by the centralized collection rate of the sewage treatment plant (B3), boasting a gray correlation degree of 0.73 (Table 7). B3 reflects the concentration of sewage collection in a city, also indicating the city’s pipeline construction capacity. For Yingtan City, lacking a fully segregated drainage system, B3 remains a pivotal factor in this resurgence. An intriguing observation is the upward fluctuation in resilience in 2017. During that year, the indicator with the highest gray correlation degree was per capita green area (B1). B1 reflects changes in the runoff coefficient of urban underlying surface, which, when increased, helps reduce internal flooding. This highlights that B1 primarily drove this fluctuation.

4.2.4. Infrastructure Resilience

As shown in Figure 4, the overall trend in infrastructure resilience from 2010 to 2022 depicted a consistent upward trajectory, marking a notable cumulative increase of 91.62%. To delineate this trend further, it was segmented into three distinct phases: a period of gradual growth, followed by fluctuations, and culminating in a phase of rapid advancement. Between 2010 and 2016, infrastructure resilience demonstrated a slow but steady ascent. Analyses of average correlation degrees for each indicator (Table 8) revealed that the density of sewers in the built district (C5) held the highest gray correlation degree, at 0.81. Given its role as the primary conduit for urban precipitation discharge, the drainage pipe network could effectively address urban flood disasters. Hence, C6 stands as the most critical factor influencing the gradual enhancement of infrastructure resilience. Over time, indicators such as the number of hospital beds per 10,000 population (C1), per capita refuge area (C2), communication coverage (C4), and central city pumping capacity (C6) displayed gradual increases in gray correlation degree, showcasing their growing impact on infrastructure resilience. From 2016 to 2020, infrastructure resilience experienced fluctuations. Gray correlation analyses (Table 8) indicated that indicators C1, C2, C3, C5, and C6 boasted correlation degrees surpassing 0.8, while C4 stood at 0.77, underscoring the significant influence of all these indicators on infrastructure resilience. Between 2020 and 2022, a rapid upsurge in infrastructure resilience was observed. Gray correlation analyses (Table 8) highlighted C6 as the most influential factor, boasting the highest gray correlation degree, while the other five indicators also contributed actively to the resilience enhancement.

5. Evolution of UFR Level

Considering the minimal fluctuation in resilience levels between consecutive years within the study period, the analysis focused on three specific years in Yingtan City to assess flood resilience grades. The flood resilience indicators for the assessment years are denoted as U1, U2, and U3, corresponding to 2010, 2016, and 2022, respectively. Referring to Table 2, Table S5, and Table S6 and statistical data (Table S4) allows for the determination of individual indicator levels, as presented in Table 9. In this evaluation model, Level V of flood resilience is regarded as the most desirable, while Level I represents the least favorable scenario. Hence, using an evaluation model to analyze the years under assessment involves determining the values of various indicators for each year. Then, Equations (12)–(21) are used to calculate how closely the indicator value sequence of this assessment matches the most ideal and worst solutions, as shown in Table 10. These results are compared against the grading standards provided in Table 5 to determine the flood resilience level of the entity being evaluated.
After conducting our calculations, we determined the flood resilience alignment in Yingtan City for the years 2010, 2016, and 2022. In 2010, the proximity was 0.3439, categorizing it as Level III. By 2016, this proximity had increased to 0.3971, remaining at Level III, yet showing a noticeable rise. Moving to 2022, the flood resilience level’s proximity reached 0.6061, now positioned at Level IV. These findings indicate a gradual improvement in flood resilience from 2010 to 2016, followed by a swift advancement from 2016 to 2022. This trend aligns with the temporal evolution observed in the previous section on flood resilience levels.
Analyzing the data (Table 9) regarding flood resilience indicator levels spanning from 2010 to 2022, notable shifts are evident in three key metrics within Yingtan City: per capita GDP (A1), communication coverage (C4), and the density of sewers in the built district (C5). The increase in A1 values mirrors the city’s levels of livelihood capital, marking a pivotal aspect for fortifying urban resilience against flood risks. This rise aligns with the steady growth of Yingtan’s key economic sector—the copper industry—propelling the city’s per capita GDP to a leading national position. The surge in C4 values also signifies China’s rapid strides in information technology. Yingtan City has achieved an advanced level of mobile communication, furnishing an efficient conduit for disseminating crucial information during flood emergencies. In 2021, as Yingtan was designated a model sponge city, local authorities implemented various projects, including rainwater and sewage diversion reforms alongside extensive drainage network construction. These efforts were aimed at addressing urban flooding issues. Consequently, Yingtan City quickly advanced to a leading national position in terms of its C5 level. Moreover, as of 2022, local fiscal expenditure (A2) and percentage of the population aged over 60 and under 18 (A4) in Yingtan City continued to lag behind. Areas such as the number of healthcare workers per 10,000 population (A3), the surface area of lakes and rivers (B4), and the density of road networks in the built district (C3) still hold prospects for improvement.

6. Discussion and Conclusions

6.1. Comparison with Other Research

Urban flood resilience assessment, as a new method of urban risk management, enhances the city’s ability to adapt to changes in the external environment. However, a city is a complex system that includes social, economic, and environmental aspects [60]. Urban resilience is also the result of the interaction of various factors, for which there is still a lack of a consistent comprehensive evaluation framework. For example, Xia et al. used the EWM–TOPSIS method to analyze the resilience changes of the Yangtze River Delta urban agglomeration from the “Socio-Economic-Ecological-Infrastructure” dimension [25]. Liu et al. explored the spatiotemporal evolution rules of urban resilience in more than 30 provincial capitals in China from the “Socio-Economic-Technological-Ecological” perspective based on econometric models [61]. Building on existing research, this study selected indicators highly related to floods from the perspective of flood resilience and constructed a comprehensive evaluation framework for flood resilience. Comparing the results of this study with previous research, the flood resilience level of Yingtan City shows an annual upward trend, which is consistent with the conclusion that the resilience level of most cities in China has been on the rise over the past 20 years [25]. Due to global climate change and the increase in extreme weather, from 2010 to 2020, the ecological recovery capacity of Yingtan City fluctuated significantly and showed an overall downward trend, indicating poor ecological recovery capacity; this is similar to the research results of Ji et al. [26]. In the subsequent analysis of influencing factors, we confirmed previous research conclusions that local fiscal expenditure and the population age structure index significantly impact urban flood resilience [33,62].

6.2. Improvement Strategy

Through the UFR evaluation framework, relevant departments such as the water management department and disaster management agencies in Yingtan City can understand the local level of flood resilience construction and the contribution of each indicator to the regional flood resistance capacity, providing a basis for disaster prevention. According to the evaluation results of flood resilience levels, the current performance of Yingtan in local fiscal expenditure and population age structure still poses challenges to the enhancement of UFR. Simultaneously, there is room for further optimization in the number of healthcare technicians per 10,000 people, watershed area, and road density in built-up areas. In addition, the correlation between urban infrastructure and flood resilience in Yingtan City is the highest. However, as a systematic evaluation, urban flood resilience assessment has difficulty quantifying the details in some indicators, and the impacts of management, maintenance, and emergency dispatch on resilience outcomes need to be considered. For instance, leakage or blockage in the stormwater pipe system can lead to a decrease in flood resilience [63], and the optimized allocation of flood control infrastructure resources during the flood process can reduce flood risk [64]. To address these challenges, the Yingtan government should adopt the following improvement measures:
(1)
The structure of fiscal expenditure needs optimization. By improving the efficiency of public services, unnecessary expenditures can be reduced. Priority should be given to ensuring investment in critical areas such as infrastructure construction, education, and healthcare. In particular, efforts should be intensified in the construction of flood control and disaster relief facilities, urban infrastructure transformation, and technological innovation;
(2)
The population age structure requires adjustment. Fertility policies should be optimized to increase the number of young people, and talent introduction should be enhanced to enrich the population structure. At the same time, emergency management departments need to pay attention to the number and distribution of vulnerable populations. In the event of a flood disaster, pre-set emergency plans should be implemented to minimize the loss of life and property to the greatest extent possible;
(3)
The water management department of Yingtan City should establish a comprehensive maintenance system for the stormwater pipe system, conducting regular inspections and maintenance to ensure the normal operation of the stormwater pipe system. The emergency management department should ensure the optimized allocation of emergency flood drainage resources during the flood process to reduce flood risk.

6.3. Limitations

Firstly, the assessment of UFR in China is still in the exploratory stage, and a unified and mature set of indicators has not yet been established. Therefore, the assessment framework and indicator selection in this study unavoidably suffer from some shortcomings. Secondly, there are many types of MCDM methods; the FAHP–EWM–TOPSIS method chosen in this study still has shortcomings. FAHP mainly considers the importance comparison between upper- and lower-level indicators, but neglects the cross-relationships among the indicators. Meanwhile, TOPSIS fails to consider the relative importance of positive and negative ideal solutions in decision making. Thirdly, this study only considered the period from 2010 to 2022, without simulating future UFR. This oversight may result in a lack of precise data support when formulating UFR enhancement plans in the future. To address these issues, we plan to further deepen our research going forward. Firstly, we will refine the indicator system to ensure the accuracy of the assessment results. Secondly, in future research, the Analytic Network Process (ANP) combined with the VlseKriterijumska Optimizacija I Kompromisno Resenje (VIKOR) method can be attempted to address these shortcomings. Lastly, we can apply predictive models to forecast the development of future flood resilience, providing precise data for cities to formulate targeted enhancement plans.

6.4. Conclusions

This article establishes an assessment framework and indicator system for the UFR of Yingtan City, covering three aspects: urban socio-economic resilience, ecological resilience, and infrastructure resilience, using a total of 17 indicators. By calculating the changes in flood resilience levels in Yingtan from 2010 to 2022 and the variations in flood resilience grades over three years, we analyzed the temporal evolution characteristics of flood resilience and its subsystem dimensions in Yingtan city. Specific conclusions are drawn as follows:
(1)
In accordance with previous research on resilience assessment methods and considering national regulations and expert recommendations, indicators that can represent a city’s ability to resist floods were selected. A three-level indicator system was constructed, with the first-level indicator UFR, the second-level indicators being socio-economic resilience, ecological resilience, and infrastructure resilience, and a total of 17 third-level indicators. The gray relational degrees of all evaluation indicators were greater than 0.58, indicating that the selection of indicators was reasonable;
(2)
From 2010 to 2022, the UFR level of Yingtan City steadily increased, showing an overall improvement of 80.69%. In terms of subsystem dimensions, while ecological resilience exhibited a fluctuating downward trend, both socio-economic resilience and infrastructure resilience showed clear growth trends. The factors influencing Yingtan City’s UFR are primarily concentrated in the density of the urban pipe network, per capita GDP, local fiscal expenditures, land development intensity, the number of medical institution beds per 10,000 people, the density of the urban road network, per capita refuge area, and emergency drainage capacity;
(3)
This study employed the natural breaks method, based on statistical data from all cities in China, to set the grade intervals of each indicator for the assessment years. Subsequently, the flood resilience grades for Yingtan City in the years 2010, 2016, and 2022 were calculated. The flood resilience grades were categorized as Level III in 2010 and 2016, and Level IV in 2022, indicating a continuous improvement in Yingtan City’s flood resilience grades. The trend of flood resilience at a time scale was reviewed, and it can be concluded that the method used in this study is feasible.

Supplementary Materials

The following are available online at https://www.mdpi.com/article/10.3390/w16060834/s1, Table S1: Questionnaire of expert, Table S2: Expert background, Table S3: Calculation of the final combined weight of the 5 experts’ questionnaires, Table S4: Statistical data of various indicators in Yingtan City from 2010 to 2022, Table S5: Classification of flood resilience index of Yingtan City in 2016, Table S6: Classification of flood resilience index of Yingtan City in 2022.

Author Contributions

D.Y.: Conceptualization, Writing—review and editing, Funding acquisition. H.W.: Methodology, Formal analysis, Writing—original draft. C.W.: Conceptualization, Writing—review and editing, Funding acquisition. C.Y.: Writing—review and editing. L.X.: Formal analysis, Investigation, Methodology. C.Z.: Investigation, Methodology. J.W.: Formal analysis, Methodology. Y.K.: Writing—review and editing, Writing—original draft. All authors have read and agreed to the published version of the manuscript.

Funding

This work is supported by the National Natural Science Foundation of China (52170097), Beijing Natural Science Foundation (9222017), the Project of Construction and Support for high-level Innovative Teams of Beijing Municipal Institutions (BPHR20220108), the Open Research Fund of State Environmental Protection Key Laboratory for Lake Pollution Control (2022HPYB-06), and the Fundamental Research Funds for the Central Public-interest Scientific Institution (2022YSKY-02).

Data Availability Statement

All data generated or analyzed during this study are included in this published article and its supplementary information files.

Conflicts of Interest

C.W., C.Z. and J.W. are employed by CAUPD (Beijing) Planning & Design Consultants Co., Ltd.; L.X. is employed by China Railway Construction Network Information Technology Co., Ltd. The authors declare no conflicts of interest.

References

  1. Gao, Y.Q.; Chen, J.H.; Luo, H.; Wang, H.Z. Prediction of hydrological responses to land use change. Sci. Total Environ. 2020, 708, 134998. [Google Scholar] [CrossRef]
  2. Gu, L.; Chen, J.; Yin, J.B.; Slater, L.J.; Wang, H.M.; Guo, Q.; Feng, M.Y.; Qin, H.; Zhao, T.T.G. Global Increases in Compound Flood-Hot Extreme Hazards under Climate Warming. Geophys. Res. Lett. 2022, 49, e2022GL097726. [Google Scholar] [CrossRef]
  3. Zhu, S.Y.; Li, D.Z.; Huang, G.Y.; Chhipi-Shrestha, G.; Nahiduzzaman, K.M.; Hewage, K.; Sadiq, R. Enhancing urban flood resilience: A holistic framework incorporating historic worst flood to Yangtze River Delta, China. Int. J. Disaster Risk Reduct. 2021, 61, 102355. [Google Scholar] [CrossRef]
  4. Wu, J.D.; Han, G.Y.; Zhou, H.J.; Li, N. Economic development and declining vulnerability to climate-related disasters in China. Environ. Res. Lett. 2018, 13, 034013. [Google Scholar] [CrossRef]
  5. Zhang, X.X.; Sheng, W.F.; Qi, S.Z. Hazards and reflection on Fangshan District extreme rainstorm of July 21, 2012, the urban mountainous region of Beijing, North China. Nat. Hazards 2018, 94, 1459–1461. [Google Scholar] [CrossRef]
  6. Liu, X.; Zhou, P.; Lin, Y.C.; Sun, S.W.; Zhang, H.L.; Xu, W.Q.; Yang, S.D. Influencing Factors and Risk Assessment of Precipitation-Induced Flooding in Zhengzhou, China, Based on Random Forest and XGBoost Algorithms. Int. J. Environ. Res. Public Health 2022, 19, 16544. [Google Scholar] [CrossRef]
  7. Nahiduzzaman, K.M.; Aldosary, A.S.; Rahman, M.T. Flood induced vulnerability in strategic plan making process of Riyadh city. Habitat Int. 2015, 49, 375–385. [Google Scholar] [CrossRef]
  8. Cassel, M.A.; Hinsberger, M. Flood partnerships: A participatory approach to develop and implement the Flood Risk Management Plans. J. Flood Risk Manag. 2017, 10, 164–172. [Google Scholar] [CrossRef]
  9. McClymont, K.; Morrison, D.; Beevers, L.; Carmen, E. Flood resilience: A systematic review. J. Environ. Plan. Manag. 2019, 63, 1151–1176. [Google Scholar] [CrossRef]
  10. Holling, C.S. Resilience and Stability of Ecological Systems. Annu. Rev. Ecol. Syst. 1973, 4, 1–23. [Google Scholar] [CrossRef]
  11. Saikia, P.; Beane, G.; Garriga, R.G.; Avello, P.; Ellis, L.; Fisher, S.; Leten, J.; Ruiz-Apilánez, I.; Shouler, M.; Ward, R.; et al. City Water Resilience Framework: A governance based planning tool to enhance urban water resilience. Sustain. Cities Soc. 2022, 77, 103497. [Google Scholar] [CrossRef]
  12. Zhang, Y.; Yue, W.C.; Su, M.R.; Teng, Y.M.; Huang, Q.Y.; Lu, W.W.; Rong, Q.Q.; Xu, C. Assessment of urban flood resilience based on a systematic framework. Ecol. Indic. 2023, 150, 110230. [Google Scholar] [CrossRef]
  13. Huang, G.; Li, D.; Zhu, X.; Zhu, J. Influencing factors and their influencing mechanisms on urban resilience in China. Sustain. Cities Soc. 2021, 74, 103210. [Google Scholar] [CrossRef]
  14. Li, W.; Jiang, R.; Wu, H.; Xie, J.; Zhao, Y.; Song, Y.; Li, F. A System Dynamics Model of Urban Rainstorm and Flood Resilience to Achieve the Sustainable Development Goals. Sustain. Cities Soc. 2023, 96, 104631. [Google Scholar] [CrossRef]
  15. Chen, N.C.; Yao, S.; Wang, C.; Du, W.Y. A Method for Urban Flood Risk Assessment and Zoning Considering Road Environments and Terrain. Sustainability 2019, 11, 2734. [Google Scholar] [CrossRef]
  16. Zhong, M.; Lin, K.R.; Tang, G.P.; Zhang, Q.; Hong, Y.; Chen, X.H. A Framework to Evaluate Community Resilience to Urban Floods: A Case Study in Three Communities. Sustainability 2020, 12, 1521. [Google Scholar] [CrossRef]
  17. Ghasemzadeh, B.; Zarabadi, Z.S.S.; Majedi, H.; Behzadfar, M.; Sharifi, A. A Framework for Urban Flood Resilience Assessment with Emphasis on Social, Economic and Institutional Dimensions: A Qualitative Study. Sustainability 2021, 13, 7852. [Google Scholar] [CrossRef]
  18. Li, Z.; Zhang, X.; Ma, Y.; Feng, C.; Hajiyev, A. A multi-criteria decision making method for urban flood resilience evaluation with hybrid uncertainties. Int. J. Disaster Risk Reduct. 2019, 36, 101140. [Google Scholar] [CrossRef]
  19. Lee, G.; Choi, J.; Jun, K.S. MCDM Approach for Identifying Urban Flood Vulnerability under Social Environment and Climate Change. J. Coast. Res. 2017, 79, 209–213. [Google Scholar] [CrossRef]
  20. Hadian, S.; Afzalimehr, H.; Soltani, N.; Tabarestani, E.S.; Pham, Q.B. Application of MCDM methods for flood susceptibility assessment and evaluation the impacts of past experiences on flood preparedness. Geocarto Int. 2022, 37, 16283–16306. [Google Scholar] [CrossRef]
  21. Kelly, M.; Schwarz, I.; Ziegelaar, M.; Watkins, A.B.; Kuleshov, Y. Flood Risk Assessment and Mapping: A Case Study from Australia’s Hawkesbury-Nepean Catchment. Hydrology 2023, 10, 26. [Google Scholar] [CrossRef]
  22. Akter, M.; Jahan, M.; Kabir, R.; Karim, D.S.; Haque, A.; Rahman, M.; Salehin, M. Risk assessment based on fuzzy synthetic evaluation method. Sci. Total Environ. 2019, 658, 818–829. [Google Scholar] [CrossRef] [PubMed]
  23. Aksoy, H. Flood Risk Analysis with AHP and the Role of Forests in Natural Flood Management: A Case Study from the North of Türkiye. Kastamonu Univ. J. For. Fac. 2023, 23, 282–297. [Google Scholar] [CrossRef]
  24. Wang, G.P.; Liu, Y.; Hu, Z.Y.; Lyu, Y.L.; Zhang, G.M.; Liu, J.F.; Liu, Y.; Gu, Y.; Huang, X.C.; Zheng, H.; et al. Flood Risk Assessment Based on Fuzzy Synthetic Evaluation Method in the Beijing-Tianjin-Hebei Metropolitan Area, China. Sustainability 2020, 12, 1451. [Google Scholar] [CrossRef]
  25. Xia, C.H.; Zhai, G.F. The spatiotemporal evolution pattern of urban resilience in the Yangtze River Delta urban agglomeration based on TOPSIS-PSO-ELM. Sustain. Cities Soc. 2022, 87, 104223. [Google Scholar] [CrossRef]
  26. Ji, J.; Wang, D.Y. Evaluation analysis and strategy selection in urban flood resilience based on EWM-TOPSIS method and graph model. J. Clean. Prod. 2023, 425, 138955. [Google Scholar] [CrossRef]
  27. Lee, C.-C.; Yan, J.; Li, T. Ecological resilience of city clusters in the middle reaches of Yangtze river. J. Clean. Prod. 2024, 443, 141082. [Google Scholar] [CrossRef]
  28. Yao, J.; Zhang, X.; Luo, W.; Liu, C.; Ren, L. Applications of Stacking/Blending ensemble learning approaches for evaluating flash flood susceptibility. Int. J. Appl. Earth Obs. Geoinf. 2022, 112, 102932. [Google Scholar] [CrossRef]
  29. Arvidsson, B.; Johansson, J. Flood risk assessments-Exploring maturity and challenges in Sweden. J. Flood Risk Manag. 2024. [Google Scholar] [CrossRef]
  30. Shah, M.A.R.; Rahman, A.; Chowdhury, S.H. Sustainability assessment of flood mitigation projects: An innovative decision support framework. Int. J. Disaster Risk Reduct. 2017, 23, 53–61. [Google Scholar] [CrossRef]
  31. Bulti, D.T.; Girma, B.; Megento, T.L. Community flood resilience assessment frameworks: A review. Sn Appl. Sci. 2019, 1, 1663. [Google Scholar] [CrossRef]
  32. Datola, G. Implementing urban resilience in urban planning: A comprehensive framework for urban resilience evaluation. Sustain. Cities Soc. 2023, 98, 104821. [Google Scholar] [CrossRef]
  33. Cao, F.F.; Xu, X.F.; Zhang, C.L.; Kong, W.B. Evaluation of urban flood resilience and its Space-Time Evolution: A case study of Zhejiang Province, China. Ecol. Indic. 2023, 154, 110643. [Google Scholar] [CrossRef]
  34. Galderisi, A. Urban resilience: A framework for empowering cities in face of heterogeneous risk factors. J. Fac. Archit. 2014, 11, 36–58. [Google Scholar]
  35. Ji, J.; Chen, J.F. Urban flood resilience assessment using RAGA-PP and KL-TOPSIS model based on PSR framework: A case study of Jiangsu province, China. Water Sci. Technol. 2022, 86, 3264–3280. [Google Scholar] [CrossRef]
  36. Lianxiao; Morimoto, T.; Tong, S.Q.; An, C.; Bao, Y.H.; Fei, G. Evaluating Regional Flood Disaster Resilience Based on the DROP Model and TOPSIS Method: A Case Study of the Katsushika Ward, Tokyo. Nat. Hazards Rev. 2022, 23, 04022018. [Google Scholar] [CrossRef]
  37. Leta, B.M.; Adugna, D. Characterizing the level of urban Flood vulnerability using the social-ecological-technological systems framework, the case of Adama city, Ethiopia. Heliyon 2023, 9, e20723. [Google Scholar] [CrossRef] [PubMed]
  38. Chang, H.; Pallathadka, A.; Sauer, J.; Grimm, N.B.; Zimmerman, R.; Cheng, C.; Iwaniec, D.M.; Kim, Y.; Lloyd, R.; McPhearson, T.; et al. Assessment of urban flood vulnerability using the social-ecological-technological systems framework in six US cities. Sustain. Cities Soc. 2021, 68, 102786. [Google Scholar] [CrossRef]
  39. Aroca-Jiménez, E.; Bodoque, J.M.; García, J.A. An Integrated Multidimensional Resilience Index for urban areas prone to flash floods: Development and validation. Sci. Total Environ. 2023, 894, 164935. [Google Scholar] [CrossRef] [PubMed]
  40. Zhao, L.; Zhang, T.; Fu, J.; Li, J.; Cao, Z.; Feng, P. Risk Assessment of Urban Floods Based on a SWMM-MIKE21-Coupled Model Using GF-2 Data. Remote Sens. 2021, 13, 4381. [Google Scholar] [CrossRef]
  41. Bonnefond, M. Hydraulic modeling as a condition of resilient urban projects in flood-prone area? Houille Blanche-Rev. Int. Eau 2018, 104, 25–33. [Google Scholar] [CrossRef]
  42. Okoli, C.; Pawlowski, S.D. The Delphi method as a research tool: An example, design considerations and applications. Inf. Manag. 2004, 42, 15–29. [Google Scholar] [CrossRef]
  43. Li, F.; Wang, Q.; Hu, W.; Liu, J.; Zhang, X. Rapid assessment of disaster damage and economic resilience in relation to the flooding in Zhengzhou, China in 2021. Remote Sens. Lett. 2022, 13, 651–662. [Google Scholar] [CrossRef]
  44. Rahman, M.; Ningsheng, C.; Mahmud, G.I.; Islam, M.M.; Pourghasemi, H.R.; Ahmad, H.; Habumugisha, J.M.; Washakh, R.M.A.; Alam, M.; Liu, E.; et al. Flooding and its relationship with land cover change, population growth, and road density. Geosci. Front. 2021, 12, 101224. [Google Scholar] [CrossRef]
  45. Oke, O.; Dougherty, E.; Rasmussen, K.L.; Morrison, R.R.; Carter, E. Spatial distribution of socio-demographic and housing-based factors in relation to flash and slow-rise flooding hazards in the U.S. Environ. Res. Lett. 2023, 18, 054016. [Google Scholar] [CrossRef]
  46. Chen, X.S.; Jiang, S.L.; Xu, L.S.; Xu, H.G.; Guan, N.N. Resilience assessment and obstacle factor analysis of urban areas facing waterlogging disasters: A case study of Shanghai, China. Environ. Sci. Pollut. Res. 2023, 30, 65455–65469. [Google Scholar] [CrossRef] [PubMed]
  47. Xu, C.; Rahman, M.; Haase, D.; Wu, Y.; Su, M.; Pauleit, S. Surface runoff in urban areas: The role of residential cover and urban growth form. J. Clean. Prod. 2020, 262, 121421. [Google Scholar] [CrossRef]
  48. Li, C.; Liu, M.; Hu, Y.; Shi, T.; Qu, X.; Walter, M.T. Effects of urbanization on direct runoff characteristics in urban functional zones. Sci. Total Environ. 2018, 643, 301–311. [Google Scholar] [CrossRef]
  49. Bu, J.H.; Peng, C.; Li, C.H.; Wang, X.; Zhang, Y.; Yang, Z.W.; Cai, Y.P. A method for determining reasonable water area ratio based on flood risk and cost-effectiveness in Rainy City. Environ. Earth Sci. 2020, 79, 450. [Google Scholar] [CrossRef]
  50. Wang, S.; Jiang, R.; Yang, M.; Xie, J.; Wang, Y.; Li, W. Urban rainstorm and waterlogging scenario simulation based on SWMM under changing environment. Environ. Sci. Pollut. Res. 2023, 30, 123351–123367. [Google Scholar] [CrossRef]
  51. Liu, Y.; Zhao, W.; Wei, Y.; Sebastian, F.S.M.; Wang, M. Urban waterlogging control: A novel method to urban drainage pipes reconstruction, systematic and automated. J. Clean. Prod. 2023, 418, 137950. [Google Scholar] [CrossRef]
  52. Chen, P.; Zhang, J.; Jiang, X.; Liu, X.; Bao, Y.; Sun, Y. Scenario Simulation-Based Assessment of Trip Difficulty for Urban Residents under Rainstorm Waterlogging. Int. J. Environ. Res. Public Health 2012, 9, 2057–2074. [Google Scholar] [CrossRef]
  53. Ekaputra, R.A.; Lee, C.; Kee, S.-H.; Yee, J.-J. Emergency Shelter Geospatial Location Optimization for Flood Disaster Condition: A Review. Sustainability 2022, 14, 12482. [Google Scholar] [CrossRef]
  54. Sun, N.; Li, C.L.; Guo, B.Y.; Sun, X.K.; Yao, Y.K.; Wang, Y. Urban flooding risk assessment based on FAHP-EWM combination weighting: A case study of Beijing. Geomat. Nat. Hazards Risk 2023, 14, 2240943. [Google Scholar] [CrossRef]
  55. Yoon, K. A Reconciliation Among Discrete Compromise Solutions. J. Oper. Res. Soc. 1987, 38, 277–286. [Google Scholar] [CrossRef]
  56. Kuo, T. A review of some modified grey relational analysis models. J. Grey Syst. 2017, 29, 70–77. [Google Scholar]
  57. Zhu, J.; Zhang, S.; Chen, Y.; Zhang, L. A Hierarchical Clustering Approach Based on Three-Dimensional Gray Relational Analysis for Clustering a Large Group of Decision Makers with Double Information. Group Decis. Negot. 2015, 25, 325–354. [Google Scholar] [CrossRef]
  58. Cao, C.; Zhu, K.; Cai, F.; Qi, H.S.; Liu, J.H.; Lei, G.; Mao, Z.J.; Zhao, S.H.; Liu, G.; Su, Y. Vulnerability Evolution of Coastal Erosion in the Pearl River Estuary Great Bay Area Due to the Influence of Human Activities in the Past Forty Years. Front. Mar. Sci. 2022, 9, 847655. [Google Scholar] [CrossRef]
  59. Ruan, J.E.; Chen, Y.B.; Yang, Z.W. Assessment of temporal and spatial progress of urban resilience in Guangzhou under rainstorm scenarios. Int. J. Disaster Risk Reduct. 2021, 66, 102578. [Google Scholar] [CrossRef]
  60. Khan, A.; Aslam, S.; Aurangzeb, K.; Alhussein, M.; Javaid, N. Multiscale modeling in smart cities: A survey on applications, current trends, and challenges. Sustain. Cities Soc. 2022, 78, 103517. [Google Scholar] [CrossRef]
  61. Liu, L.; Lei, Y.; Fath, B.D.; Hubacek, K.; Yao, H.; Liu, W. The spatio-temporal dynamics of urban resilience in China’s capital cities. J. Clean. Prod. 2022, 379, 134400. [Google Scholar] [CrossRef]
  62. Lodi, C.; Marin, G.; Modica, M. The public finance response to floods of local governments in Italy*. J. Environ. Manag. 2023, 332, 117352. [Google Scholar] [CrossRef] [PubMed]
  63. Wu, J.H.; Liu, Z.H.; Liu, T.X.; Liu, W.; Liu, W.L.; Luo, H.B. Assessing urban pluvial waterlogging resilience based on sewer congestion risk and climate change impacts. J. Hydrol. 2023, 626, 130230. [Google Scholar] [CrossRef]
  64. Ogie, R.I.; Holderness, T.; Dunn, S.; Turpin, E. Assessing the vulnerability of hydrological infrastructure to flood damage in coastal cities of developing nations. Comput. Environ. Urban Syst. 2018, 68, 97–109. [Google Scholar] [CrossRef]
Figure 1. Geographic location of the study area.
Water 16 00834 g001
Figure 2. Overall assessment system for UFR.
Water 16 00834 g002
Figure 3. Ranking of indicators in the FAHP–EWM and GRA methods.
Water 16 00834 g003
Figure 4. The urban flooding resilience of each dimension from 2010 to 2022.
Water 16 00834 g004
Figure 5. Change in gray correlation degree of UFR index in Yingtan City from 2010 to 2022.
Water 16 00834 g005
Table 1. Evaluation index system of UFR of Yingtan City.
Target LayerCriterion LayerIndex LayerUnitSerial NumberNature
Urban flood resilienceSocio-economic resilience (A)Per capital GDPCNY/personA1+
Local fiscal expenditure10,000 CNYA2+
Number of healthcare workers per 10,000 populationpersonA3+
Percentage of population aged over 60 and under 18%A4
Unemployment rate%A5
Density of populationpersons/km2A6
Ecological resilience (B)Per capita public green areasm2B1+
Green coverage rate of built-up area%B2+
Centralized treatment rate of sewage treatment plant%B3+
Surface area of lakes and riverskm2B4+
Land development intensity%B5
Infrastructure resilience (C)Number of hospital beds per 10,000 populationsheetC1+
Per capita refuge aream2C2+
Density of road network in built districtkm/km2C3+
Communication coverage%C4+
Density of sewers in built districtkm/km2C5+
Central city pumping capacitym3/sC6+
Table 2. Classification of flood resilience index of Yingtan City in 2010.
Secondary IndexUnitLevel 1Level 2Level 3Level 4Level 5
Per capita GDP (A1)CNY/person5304~19,75019,750~33,13733,137~52,48052,480~83,42583,425~175,125
Local fiscal expenditure (A2)100 million CNY12.19~173.76173.76~403.33403.33~977.32977.32~2061.512061.51~3302.89
Number of healthcare workers per 10,000 population (A3)person0~2525~3030~3535~40>40
Percentage of population aged over 60 and under 18 (A4)%>2520~2515~2010~150~10
Unemployment rate (A5)%16.77~27.867.85~16.774.59~7.852.81~4.590~2.81
Density of population (A6)person/km28409~15,2175883~84093671~58831893~3671137~1893
Per capita public green areas (B1)m20.43~7.117.11~11.2111.21~15.5015.50~23.3023.30~41.92
Green coverage rate of built-up area (B2)%1.92~18.8018.80~29.2229.22~36.7136.71~43.1943.19~57.89
Centralized treatment rate of sewage treatment plant (B3)%0.27~28.8428.84~52.2852.28~71.3471.34~86.3586.35~100
Surface area of lakes and rivers (B4)km20~77~99~1111~13>13
Land development intensity (B5)%15.75~41.677.23~15.752.82~7.231.05~2.820.02~1.05
Number of hospital beds per 10,000 population (C1)sheet12.72~24.1424.14~32.9132.91~45.5145.51~64.6764.67~110.85
Per capita refuge area (C2)m20~0.50.5~1.51.5~2.52.5~3.5>3.5
Density of road network in built district (C3)km/km21.26~4.994.99~7.097.09~9.809.80~14.3814.38~23.60
Communication coverage (C4)%50~6060~7070~8080~9090~100
Density of sewers in built district (C5)km/km20~4.944.94~8.138.13~12.1112.11~20.4520.45~40.76
Central city pumping capacity (C6)m3/s0~22~1010~5050~200>200
Table 3. Index level values.
Index LevelA1A2A3A4A5A6B1B2B3B4B5C1C2C3C4C5C6
I11111111111111111
II22222222222222222
III33333333333333333
IV44444444444444444
V55555555555555555
Table 4. Relative proximity of flood resilience ratings.
UFR RatingDiDi+Ci
I00.15320
II0.03830.11490.2500
III0.07660.07660.500
IV0.11490.03830.7500
V0.153201
Table 5. UFR grade standard.
UFR RatingCi
I0 ≤ Ci < 0.25
II0.25 ≤ Ci < 0.5
III0.5 ≤ Ci < 0.75
IV0.75 ≤ Ci < 1
VCi = 1
Table 6. Gray correlation degree of socio-economic resilience.
IndexGray Correlation Degree of Rising Period (2010–2022)
Per capita GDP (A1)0.78
Local fiscal expenditure (A2)0.77
Number of healthcare workers per 10,000 population (A3)0.65
Percentage of population aged over 60 and under 18 (A4)0.63
Unemployment rate (A5)0.59
Density of population (A6)0.60
Table 7. Gray correlation degree of ecological resilience.
IndexGray Correlation Degree during Rising Period (2010–2020)Gray Correlation Degree during Declining Period (2020–2022)
Per capita public green areas (B1)0.690.60
Green coverage rate of built-up area (B2)0.720.68
Centralized treatment rate of sewage treatment plant (B3)0.720.73
The surface area of lakes and rivers (B4)0.750.82
Land development intensity (B5)0.610.52
Table 8. Gray correlation degree of infrastructure resilience.
IndexGray Correlation Degree during Slow-Rise Period (2010–2016)Gray Correlation Degree during Choppy Period (2016–2020)Gray Correlation Degree during Rapid-Rise Period (2020–2022)
Number of hospital beds per 10,000 population (C1)0.690.800.56
Per capita refuge area (C2)0.680.820.58
Density of road network in built district (C3)0.710.860.59
Communication coverage (C4)0.620.770.51
Density of sewers in built district (C5)0.810.880.70
Central city pumping capacity (C6)0.680.830.58
Table 9. UFR index values.
ObjectA1A2A3A4A5A6B1B2B3B4B5C1C2C3C4C5C6
U121314435445242113
U231313334545251313
U341314445535453544
Table 10. Results of relative proximity calculations.
ObjectDiDi+Ci
U10.05820.11100.3439
U20.06730.10220.3971
U30.09600.06240.6061
Disclaimer/Publisher’s Note: The statements, opinions and data contained in all publications are solely those of the individual author(s) and contributor(s) and not of MDPI and/or the editor(s). MDPI and/or the editor(s) disclaim responsibility for any injury to people or property resulting from any ideas, methods, instructions or products referred to in the content.

