Article

Flood Modeling in a Composite System Consisting of River Channels, Flood Storage Areas, Floodplain Areas, Polder Areas, and Flood-Control-Protected Areas

1
China Institute of Water Resources and Hydropower Research, Beijing 100038, China
2
Key Laboratory of Water Conservancy and Water Resources of Anhui Province, Water Resources Research Institute of Anhui Province and Huaihe River Water Resources Commission, Ministry of Water Resources, Hefei 230088, China
*
Author to whom correspondence should be addressed.
Water 2024, 16(6), 825; https://doi.org/10.3390/w16060825
Submission received: 29 January 2024 / Revised: 3 March 2024 / Accepted: 11 March 2024 / Published: 12 March 2024
(This article belongs to the Special Issue Hydrometeorological Hazard and Risk Assessment)

Abstract

:
The Linhuaigang flood control project (LFCP), situated on the Huaihe River, China, uses the river channels upstream of the LFCP, together with the hinterland areas outside the channels, to retain and store fluvial floodwaters that exceed the downstream channel’s discharge capacity. The hinterland areas are split into seven flood storage areas, three floodplain areas, eight polder areas, and three flood-control-protected areas, and they are connected to the river in various ways. A coupled hydrodynamic model was established to simulate the hydrodynamic and water volume exchange between the river channels and the hinterland areas. The flood storage area, under the control of a flood diversion sluice, was simulated with a 2D hydrodynamic model, and the inflow process initiated by the flood diversion sluice was simulated as a control structure. The polder area was generalized as a reservoir that would be filled in several hours once put into use because of its small size. The uncontrolled inflow process between the flood-control-protected areas and the channel was simulated by means of a dam break model, which could simulate levee breaching. The flooding within the flood-control-protected area, which represents a vast space, was simulated with a 2D hydrodynamic model. The floodplain area was laterally connected to the river channel along the river levee. The difference between the simulated and the measured flood peak water stage did not exceed 0.2 m in 2003 and 2007, indicating that the accuracy of the model was relatively high. In the scenario of a design flood with a return period of 100 years, the flood storage areas and the LFCP were used in the following order: Mengwa, Qiujiahu, Nanrunduan, Shouxihu, Jiangtanghu, Chengxihu, Chengdonghu, and the LFCP. When the Huaihe River encounters a flood with a return period of 1000 years that exceeds the design standard, the highest water stage upstream of the LFCP and Zhengyangguan shall not exceed 29.30 m and 27.96 m after the use of all the flood storage areas, floodplain areas, and flood-control-protected areas. The results of this research can provide technical support for the flood risk management of the LFCP.

1. Introduction

Fluvial flooding poses a great risk to lives and property, especially in eastern China due to the monsoon climate conditions [1,2,3]. Flood control structural measures, i.e., reservoirs, artificial levees (embankments), flood storage areas (also called flood detention areas or flood detention regions in the literature), and drainage pumping stations, comprise a flood control system and play a synergistic role in mitigating flood risk in the hinterland beyond the levees [3]. According to the linkage to the river, the hinterland could be classified as the flood storage area, flood-control-protected area (also called the levee flood protection zone in the literature), polder area, and floodplain area [4,5,6]. As the key flood control project, the flood storage area is used to temporarily store some of the floodwaters to reduce the rising rate of the water stage in the channel. It is usually achieved with a flood sluice between the flood storage area and the river [7,8,9]. The flood-control-protected area, which contains riverside cities (or industrial and mining areas), is essential to protect high-density populations and GDP within the area [10]. The levees of the flood-control-protected area are designed and constructed to defend against fluvial flooding with a high return period [11]. The polder area is a small area surrounded by low-standard levees, and its land cover is farmland or rural settlements. The levees around the polder area with low design and construction standards are quite susceptible to breaking during a flood event. Occasionally, administrators initiatively break levees of the polder area to reduce the water stage in the river and thus make the flood-control-protected area safe [12]. A floodplain is the area near the river channel that a fluvial flood inundates, with the water stage rising in the river. The flood routing in the composite flood control structural system, consisting of river channels, flood storage areas, floodplain areas, polder areas, and flood-control-protected areas, is very complex due to the hydrodynamic interaction among subsystems [13]. Moreover, the hydrograph in the river channel in the composite system is different from that in the individual river system, thereby affecting the operation of flood storage areas and other flood control measures [6,14,15,16].
Hydrodynamic models are commonly used in flood inundation modeling [17,18] and flood hazard mapping [19]. The coupled one-dimensional–two-dimensional (1D–2D) hydrodynamic model is extensively used to simulate flooding in river channels and outside the channels (e.g., flood storage areas, floodplain areas, and flood-control-protected areas) [20]. The coupled 1D–2D model links the 1D model and 2D model, while the 1D model simulates flooding in the channel, and the 2D model simulates flood inundation outside the channel [18,21]. Hence, the coupled 1D–2D hydrodynamic model can compensate for the disadvantages of the 1D and 2D models when used separately, i.e., the 1D model cannot provide the inundation area in a 2D domain, while the 2D model is very time-consuming. Typically, the coupled 1D–2D hydrodynamic model can provide distributed flood hazard factors (e.g., inundation depth, duration, flow velocity) for flood hazard mapping [22,23,24,25,26]. Previous studies have focused on part of the composite system, e.g., the flood storage area–channel system [8,27,28,29], the floodplain–channel system [30], or the flood-control-protected area–channel system [6,22,24,26,31,32]. In other studies, the coupled model was adopted for flood modeling in the flood storage area–channel system, and the impact of flood storage area operation on the peak water stage and peak flow on the river channel was examined [8,27,28]. However, there are few studies on the entire composite system that use the coupled 1D–2D model.
The middle reaches of the Huaihe River are one of the areas in China that are prone to recurring floods [13]. The Huainan City, Bengbu City, and Cinan Feizuo flood-control-protected areas [10] that lie on the Huaihe River downstream of Zhengyangguan are prioritized areas for protection during the catastrophic flood period. The Linhuaigang flood control project (LFCP) is one of the key projects in flood control in the Huaihe River Basin. Various kinds of areas upstream of Zhengyangguan, including seven flood storage areas, three floodplain areas, eight polder areas, and three flood-control-protected areas, together with the LFCP, have been constructed to retain and store the fluvial floodwater that exceeds the downstream channel’s discharge capacity [33]. With the joint operation of these various measures, the flood control standard of the Huaihe River downstream of Zhengyangguan is sufficiently improved to be able to cope with a flood with a return period of 100 years. Wu et al. [34] adopted a coupled 1D–2D model to construct a flood control operation model of the LFCP under the design flood scenario. The flood inundation of areas under the exceeding standard flood scenario is relatively unknown.
Under these circumstances, this study proposes a framework for the setup of the flood model in the composite system, which consists of river channels, flood storage areas, floodplain areas, polder areas, and flood-control-protected areas, under the hydrological conditions of the design or exceeding control standard flood. We used a coupled 1D–2D hydrodynamic model to set up the flood model and simulated the flood inundation in all the areas, along with the real-time interaction among all the subareas. We selected the flood inundation area of the LFCP in the Huaihe River as the study area. Section 2 describes the study area, the framework for the setup of the flood model, the model inputs, and the simulated scenarios. Section 3 provides the results of the verification of the flood model in the study area, as well as the flooding in the river, the flood storage area, the flood-control-protected area, and the floodplain. The key insights and essential findings of this research are discussed in Section 4, and the conclusions are provided in Section 5.

2. Materials and Methods
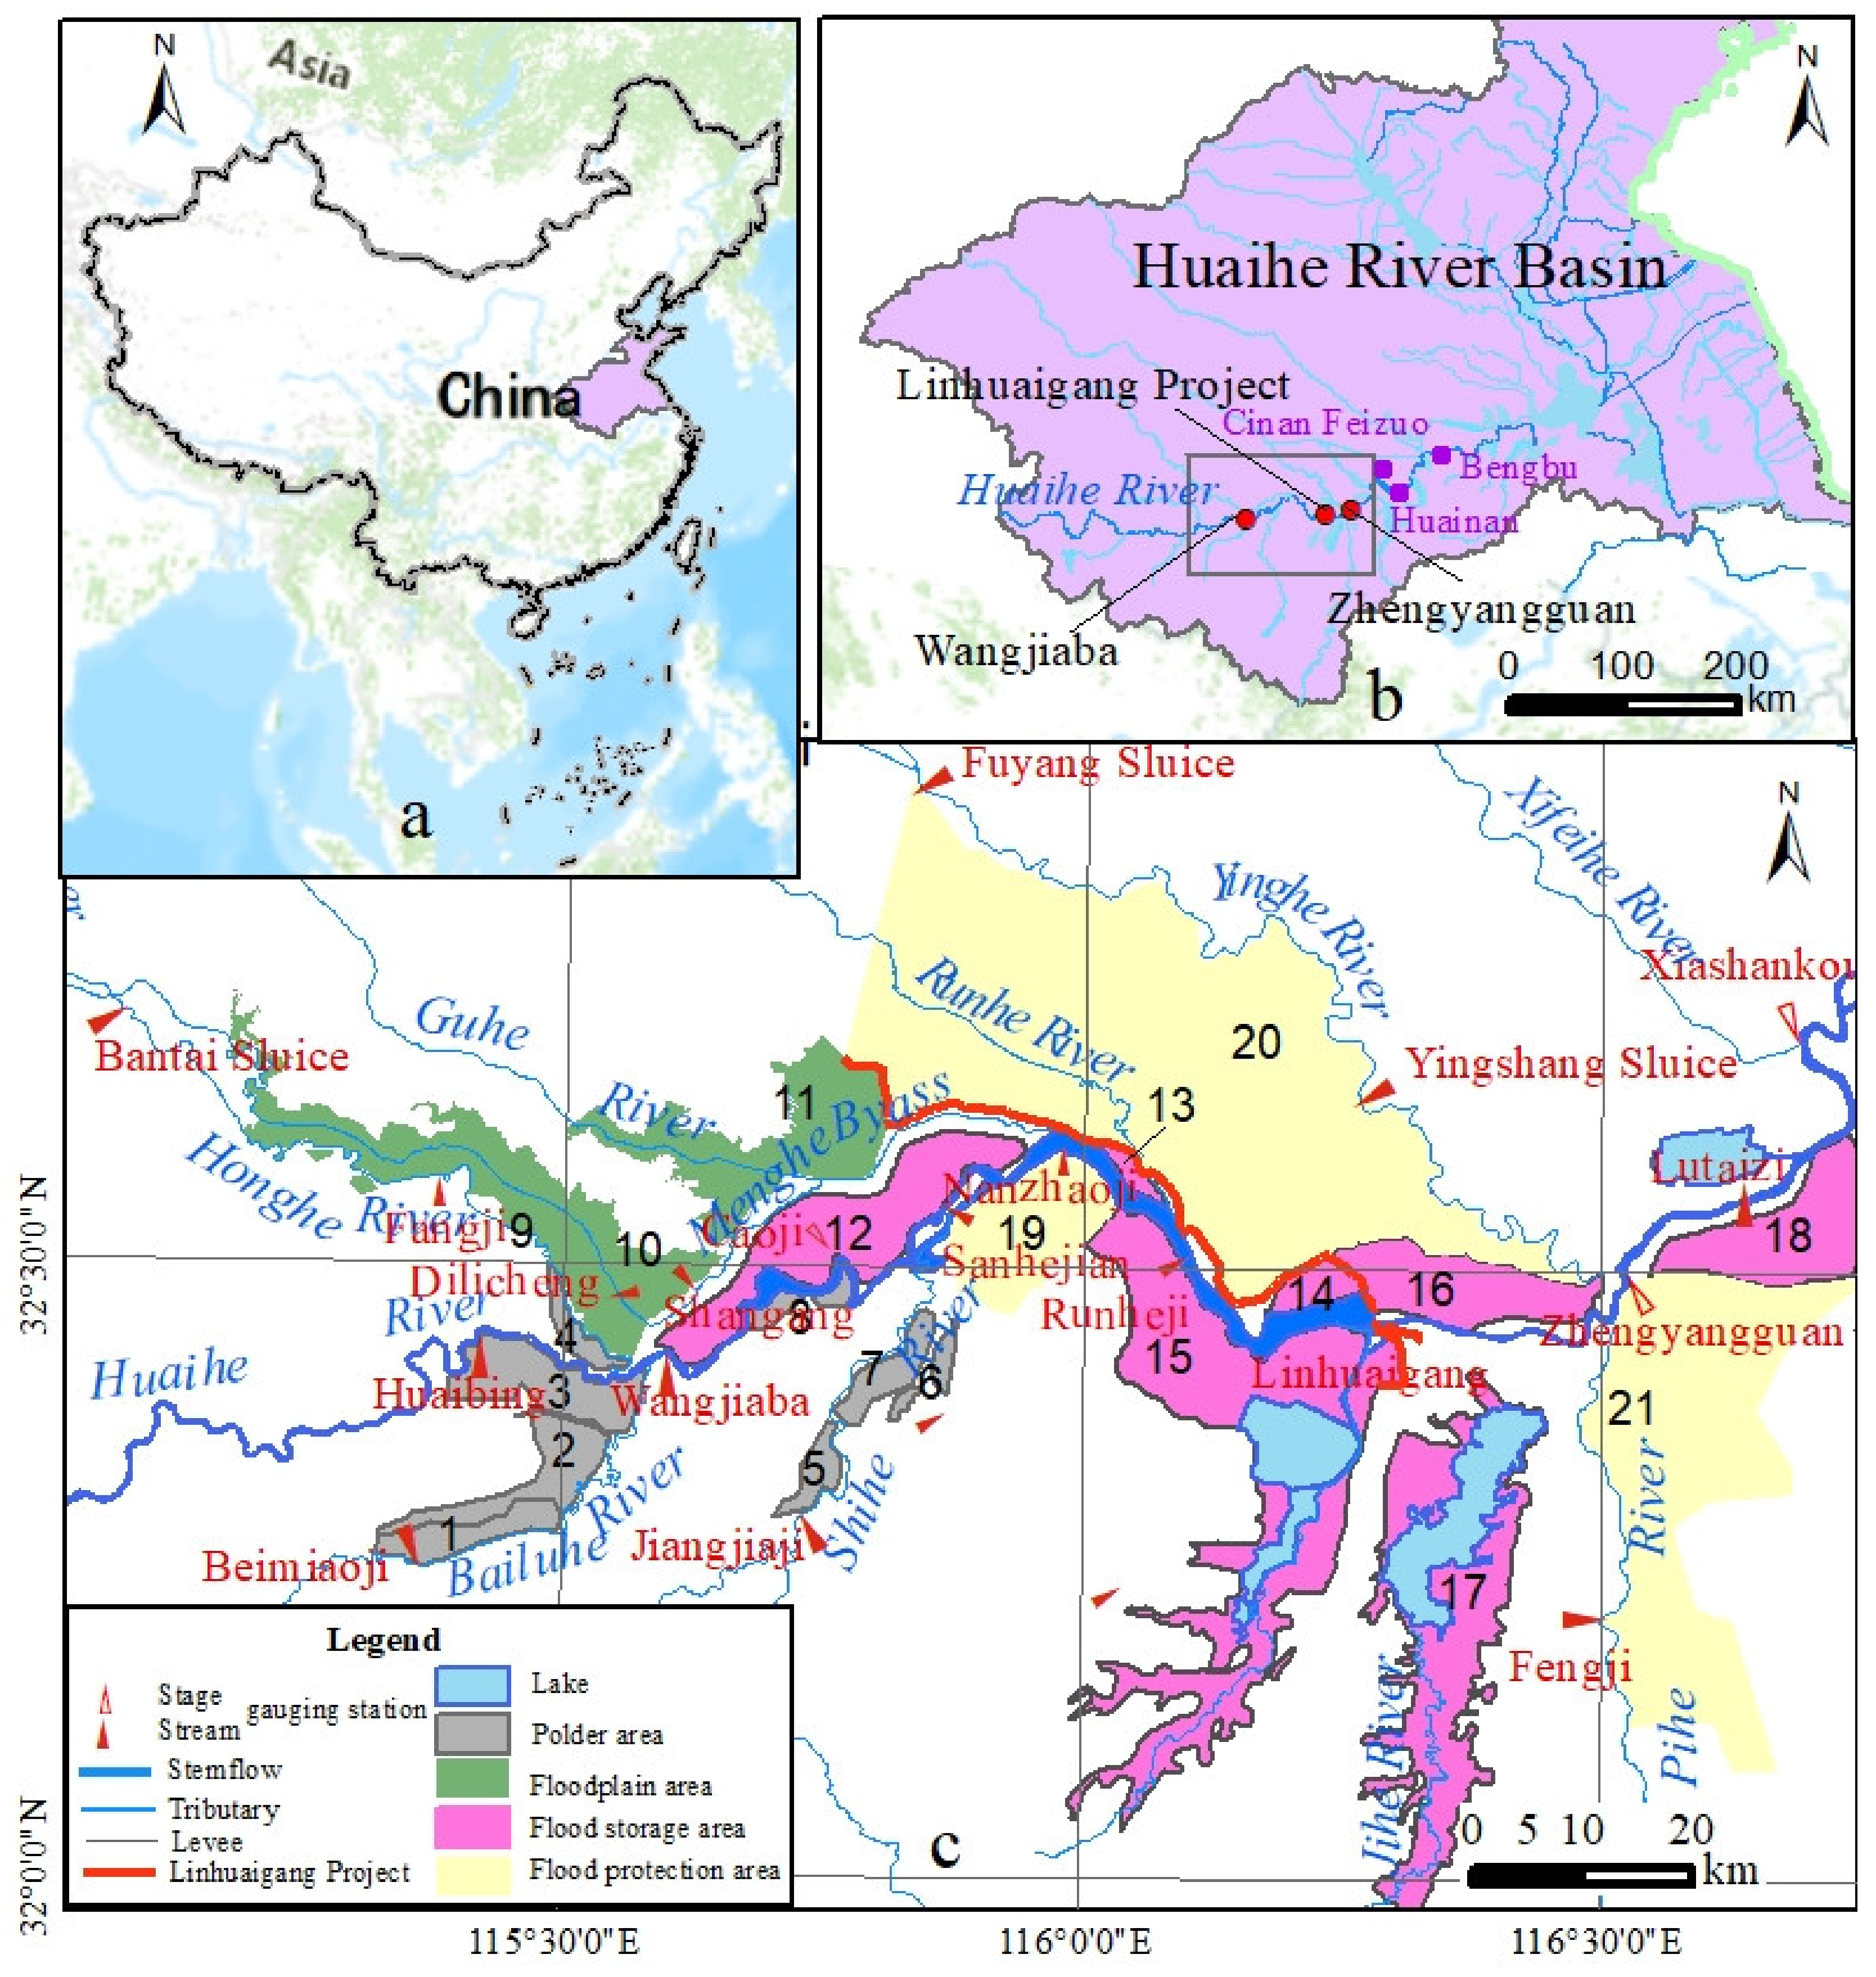
2.1. Study Area

The study area is located in the upper and middle reaches of the Huaihe River Basin (Figure 1). The Wangjiaba is the demarcation of the upper and middle reaches of the Huaihe River, and controlling flooding downstream of the Wangjiaba is most arduous in the basin. Zhengyangguan is a critical node of flood control, and the floodwaters from the Huaihe River and its tributaries are concentrated at Zhengyangguan to form a long-duration and high-stage flood, which will threaten the safety of the city downstream of Zhengyangguan (i.e., the Huainan City, Bengbu City, Cinan Feizuo flood-control-protected areas) [35]. The purpose of the LFCP (which lies in the Wangjiaba–Zhengyangguan reach) is to control the peak stage at Zhengyangguan. As shown in Figure 1c, the study area is complex in composition, comprising seven flood storage areas, three floodplain areas, eight polder areas, three flood-control-protected areas, and the LFCP, together with twelve river channels. The twelve river channels are the Huaihe River, Bailuhe River, Honghe River, Honghe Bypass, Menghe Bypass, Yinghe River, Shihe River, Pihe River, Guhe River, Runhe River, Fenghe River, and Jihe River. The seven flood storage areas, namely, Mengwa, Qiujiahu, Nanrunduan, Chengxihu, Chengdonghu, Jiangtanghu, and Shouxihu, are arranged along the Huaihe River. Three floodplain areas, Hongwa, Difuduan, and Guhewa, are on the left bank of the Menghe Bypass. The eight polder areas are Lixiangpu, Qisi, Gudui, Wanggang, Laoliji, Yangou–Jiamiao–Xuji, Chenda, and Daqiao. The three flood-control-protected areas are Linwangduan, Yingyou, and Zhengnanhuai. The Linwangduan is located upstream of the LFCP, while the Yingyou and Zhengnanhuai are located downstream of the LFCP. The LFCP is designed to cope with a 100-year flood and is checked with a 1000-year flood. The construction of the LFCP was completed in 2005.

2.2. Framework for the Setup of the Flood Model

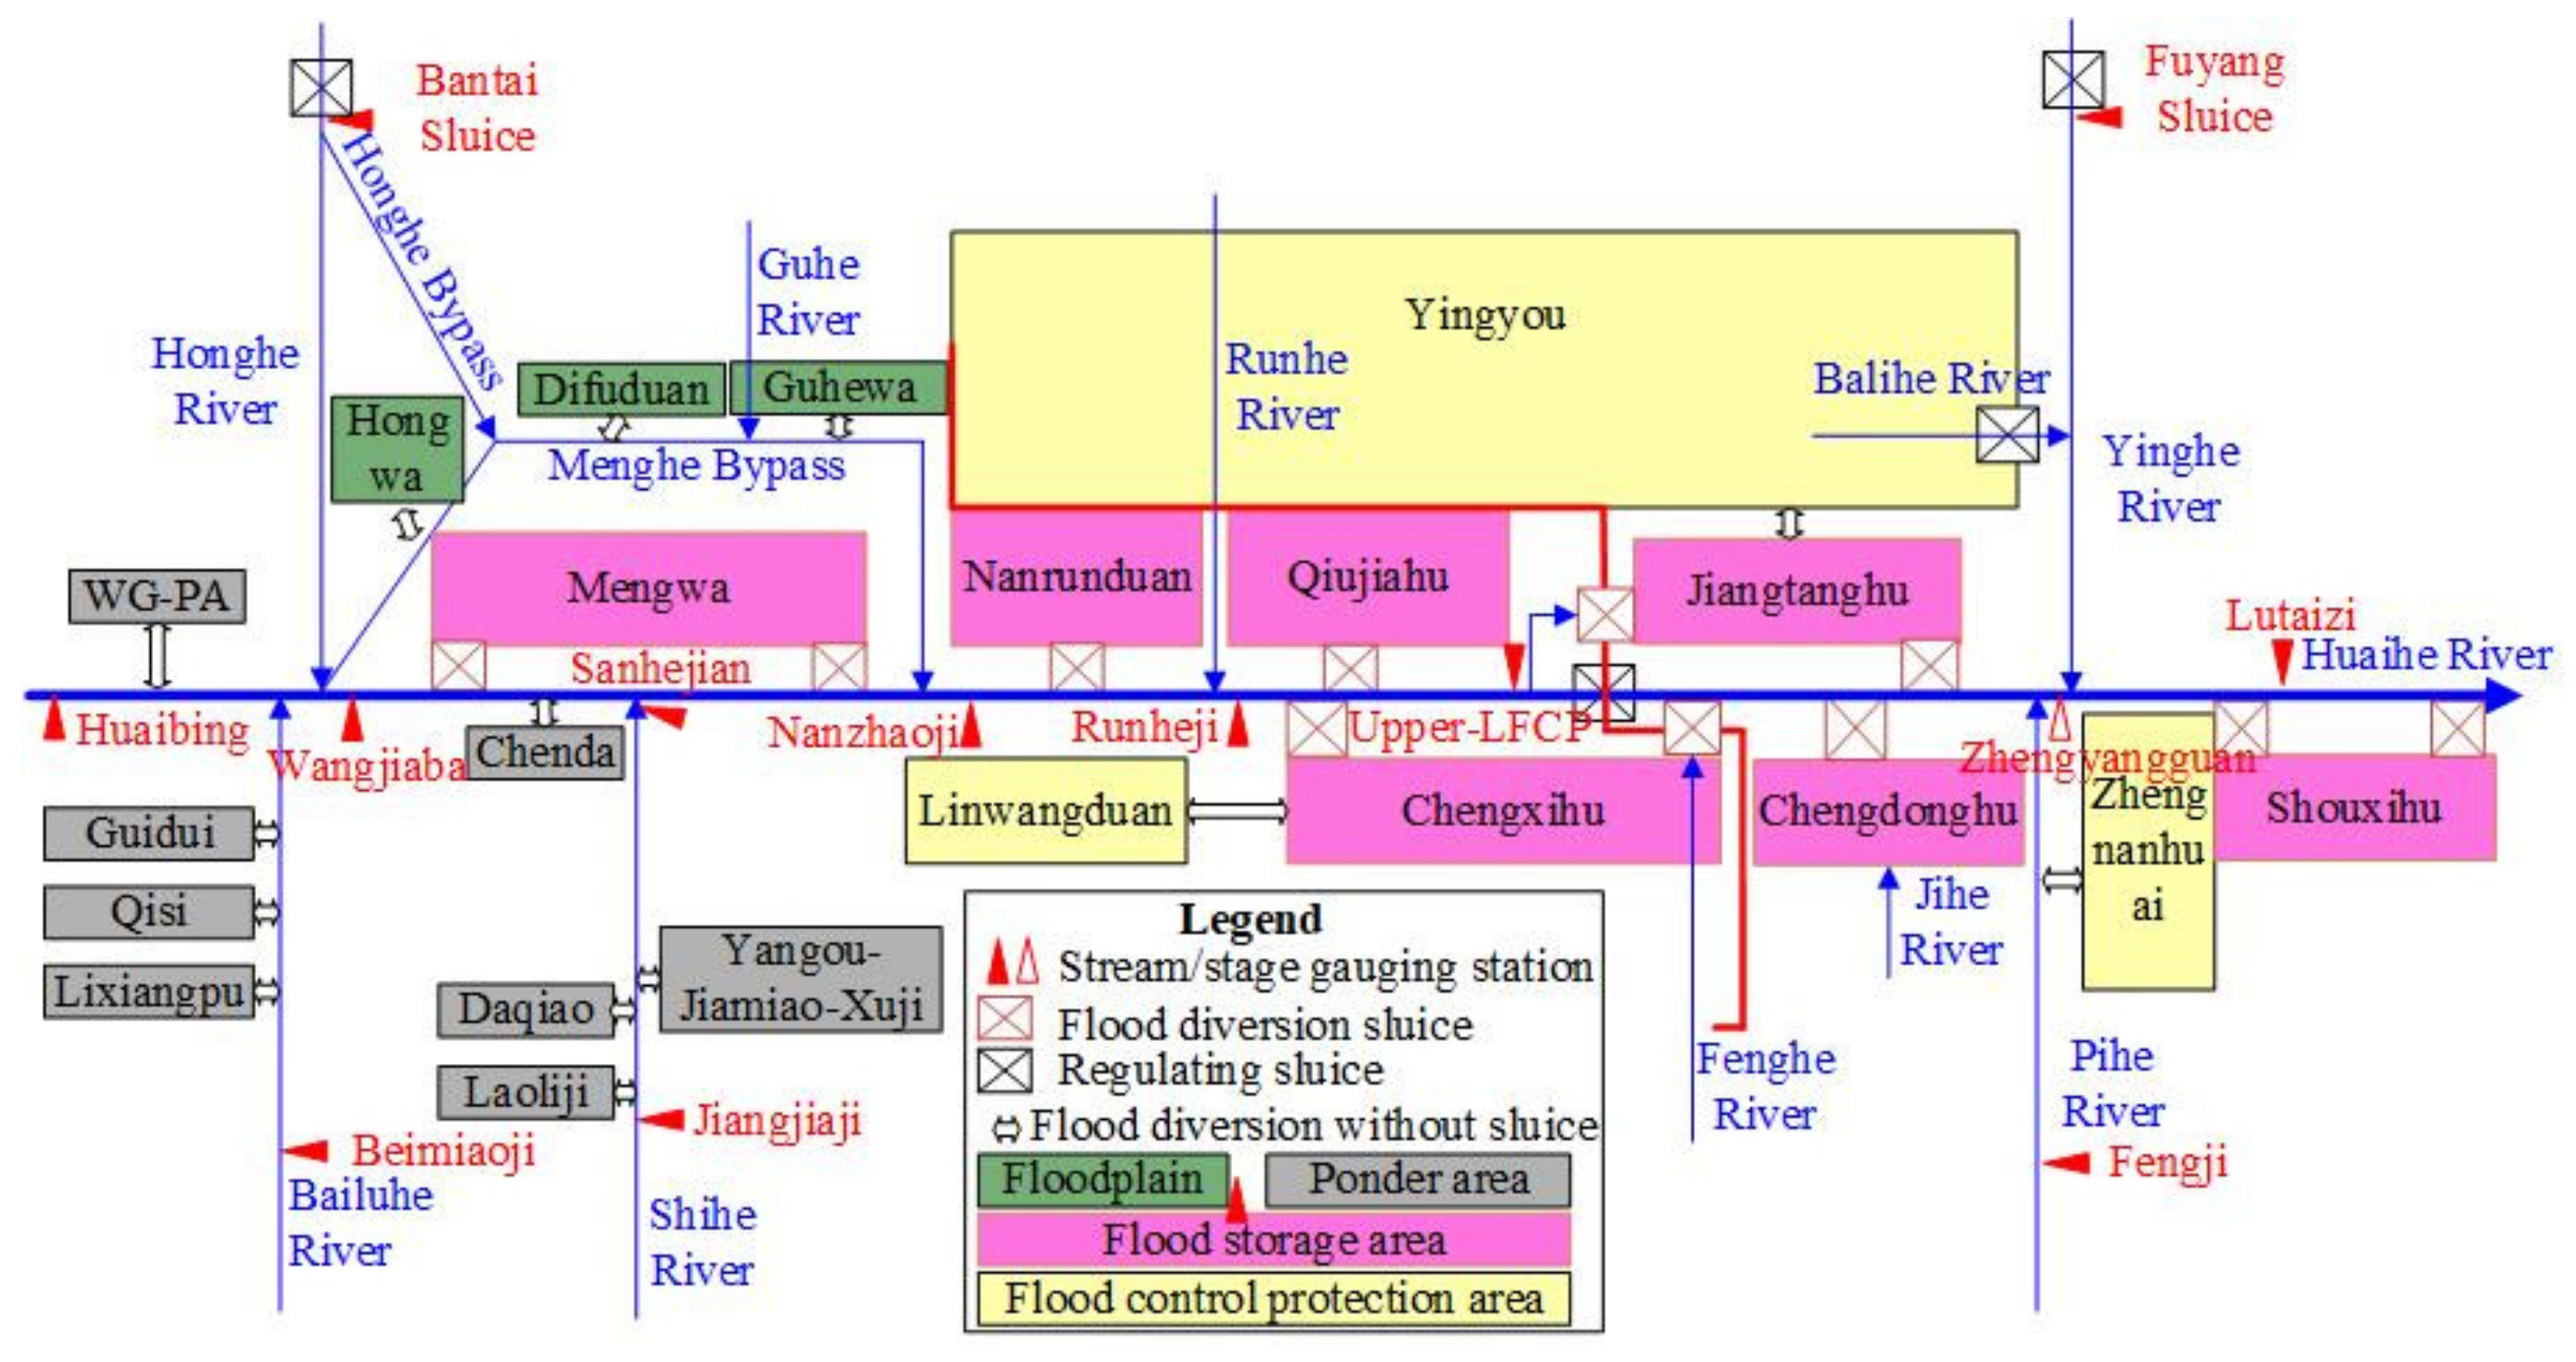
2.2.1. Model Generalization

The topological structure of the model area is shown in Figure 2. The generalization of channels, flood storage areas, floodplain areas, polder areas, and flood-control-protected areas in the flood model are listed in Table 1. The flood model covered the area affected by the operation of the LFCP under the maximum magnitude flood scenario, including the stemflow (the Huaihe River) and tributary channels, as well as the flood storage areas, floodplain areas, polder areas, and flood-control-protected areas. The flooding in the system was simulated from 1 July to 15 August, and the duration was 46 days, which could completely cover the duration of the riverine flood.
The hydrodynamic models for flood inundation calculation are divided into 0D, 1D, and 2D. The 1D model has high computational efficiency but cannot obtain information about flood inundation characteristics such as inundation depth, flood velocity, and inundation duration, making it suitable for river flood calculation. The 2D model’s calculation efficiency is less than the 1D model’s, but it can obtain flood inundation feature information [19]. In our study, the 1D model was used to simulate and calculate the flood-routing process of river channels, and the 2D model was used to calculate the flood inundation process of flood storage areas, floodplain areas, and flood-control-protected areas. Meanwhile, the 1D and 2D models were combined to handle the water volume and hydrodynamic interaction between the river channel and the areas outside the river channel by using MIKE FLOOD (Danish Hydraulic Institute, Hørsholm, Denmark). In addition, small polder areas would reach full capacity in a short period of time after entering the floodwaters, and there was no need to obtain information about flood risk factors in the polder areas. Therefore, the polder areas were generalized in a 0D model. If the size of a polder area was large enough to form an obvious water level difference among different positions within the area, the generalized method in a 0D model would not be suitable and could lead to significant errors.

2.2.2. Flood Routing Modeling in the River Channels

The flood routing in river channels was calculated with a 1D model, using the 6-point center Abbott–Ioncscu scheme, discretizing the 1D Saint Venant Equations (1) and (2) and solving the discrete equations with the pursuit method [36].
Q x + B z t = q
Q t + x Q 2 A + g A Z x + Q Q K 2 = 0
where t is the time coordinate, x is the coordinates along the river channel, Q is the discharge, Z is the water stage, A is the area of the overflow section, B is the water surface width, K is the flow modulus, g is the gravitational acceleration, and q is the side inflow discharge.
Table 1 lists the river channels modeled. As shown in the topological structure of the model area in Figure 2, both ends of the Menghe Bypass were connected to the Huaihe River; hence, it was not necessary to set the boundaries for them. The upstream end of the river channel, except the Menghe Bypass, was at the stream gauging station (SGS), which was set as the boundary with the type of inflow time series. At the lower end of the Huaihe River was the Xiashankou SGS, and the boundary was set as the relationship between the water stage and discharge. All of the downstream ends of the tributary channels were connected to the Huaihe River; hence, it was not necessary to set the boundaries for them. The length of the simulated tributary channels was 525.84 km in total. The upper boundary of the model was the given hydrograph, and the measured one in a typical flood season was used to validate the flood analysis model, while the designed one was used in the scenario analysis.
Figure 3 shows a schematic diagram of the LFCP in the 1D model. The LFCP was a combined project composed of barrages, levees, sluices, and a ship lock. The LFCP discharged the floodwaters downstream by using three independent sluice projects, i.e., the flood diversion sluice, the regulating sluice with a deep hole, and the regulating sluice with a low hole [33]. The flood diversion sluice of the Jiangtanghu flood storage area located on the left side of the channel was used to divert some floodwater to the flood storage area, and it was closed initially and opened during the flooding. The regulating sluice with a deep hole and the regulating sluice with a low hole were fully open until it was necessary to reduce the discharge to control the water stage at Zhengyangguan. The water stage at Zhengyangguan (or discharge at Lutaizi) was the control parameter in the operating LFCP. Usually, the regulating sluices of the LFCP open entirely except during catastrophic flood periods. When encountering catastrophic floods, after all the flood storage areas had been put into use, the water stage at Zhengyangguan still exceeded 26.4 m, or the discharge at Lutaizi exceeded 10,000 m3/s, the regulating sluices of the LFCP were activated to control the discharge from the Huaihe River to control the rising rate of the downstream water stage. The characteristics of each project were discontinuous but formed an organic whole, so the operation of regulating sluices of the LFCP and other flood control measures were linked by the control of the water stage at Zhengyangguan (or discharge at Lutaizi).

2.2.3. Floodwater Storage Modeling in the Polder Areas

We generalized each of the eight polder areas as fictitious reservoirs similar to the 0D model. During the catastrophic flood periods, all the levees in the polder areas with low flood control standards were likely to break (natural failure or artificial blasting) or overflow. After the polder areas were put into use, the fluvial floodwater from the channel filled them instantaneously, and the water stage in the polder areas and the channels was synchronous. The polder areas were linked to the river channel as a simple mode (side structure and fictitious reservoir) in the flood model. The fictitious reservoir was characterized by the relationship between the water stage and storage capacity.

2.2.4. Flood Inundation Modeling in the Areas Outside the Channels

The flood inundation in the flood storage areas, flood-control-protected areas, and floodplain areas was calculated in the 2D model. The river channels split the model area in the 2D model into five spatially discontinuous regions. The first region was between the Honghe River and Honghe Bypass and only contained the Hongwa floodplain. The second part covered Difuduan, Guhewa, Yingyou, Nanruanduan, Qiujiahu, and Jiangtanghu and was on the left side of the Honghe Bypass, Menghe Bypass, and Huaihe River and the right side of the Yinghe River. The third region was Mengwa, enclosed by the Menghe Bypass and Huaihe River. The fourth region covered Linwangduan, Chengxihu, and Chengdonghu, situated on the right of the Huaihe River and the left side of the Pihe River. The fifth region covered Shouxihu and Zhengnanhuai and was on the right of the Huaihe River and the left side of the Pihe River. The levees further split the region into several units. The 2D model area was the outside of the river levees and was discretized to unstructured mesh. The crests of the inner threadiness structures (such as railways, highways, and inner river levees) were above the ground, which would prevent flood inundation, and their effects on flood inundation were simulated. The maximum, average, and minimum grid areas in the 2D model were 177,380 m2, 46,626 m2, and 1766 m2, respectively. The total number of grids was 110,137. The maximum simulation time was set to 2 s.

2.2.5. Interaction Modeling between the River Channels and the Areas Outside the Channels

A coupled approach to link the 1D model and 2D model by using MIKE FLOOD (version 2014) was adopted to simulate the real-time water volume and momentum exchange between the river channels and the areas outside the channels (the flood storage areas, flood-control-protected areas, and floodplain areas) [36].
The flood diversion sluice controlled the discharge of the fluvial floodwater into the flood storage area, and there were artificial and fixed channels upstream and downstream of the sluice. A virtual river channel was created to represent the channel (artificial in the flood storage area or temporarily formed in the flood-control-protected area) in the 1D model. One side of the virtual river channel was linked to the river channel, and the other side was linked to the 2D model. The flood diversion sluice (or the levee breach) was described as the control structure on the virtual river channel. Flood diversion sluice design values were adopted for the geometric parameters, such as gate width, number of gates, and gate crest level. The control strategy of the sluice in the flood model was determined by using the contingency plan of the flood storage area.
The levee breach was the linkage between the river channel and the flood-control-protected area (and polder area), and it formed a temporary channel after the levee breaching. The situation and the geometric parameters of the breach were estimated by using the historical levee breach database for the basin. A control strategy of breaching was supposed, in which once the water stage exceeded the project flood stage in the linked river channel, the levee breached to the final width instantaneously along the levee and gradually formed with fixed speed in the vertical plane.
The water exchanger between the river channel and floodplain areas was distributed along the river channel through the common boundary between them. Three lateral linkages between the floodplain areas (Hongwa, Difuduan, Guhewa) and the Menghe Bypass were generated to simulate the flow through the boundary. The whole lateral linkage extent covered the intersection of the floodplain area and the linked river channel. The overflow went both ways [37]. While the water stage in the river channel was higher than the elevation of the riverbank, overflow occurred from the river channel onto the floodplain area. While the water stage in the river channel dropped below the elevation of the riverbank, overflow occurred from the floodplain into the river channel.

2.3. Model Inputs

2.3.1. Bathymetry

The bathymetric data for all the river channels listed in Table 1 were the measured terrain data since 2010, with an average space of 200 m to 400 m among cross-sections. The total number of cross-sections was 2430. The terrain data used in the 1D model covered the whole cross-section (i.e., both the riverbed and bench) and did not contain data for terrain outside the river channel.
The bathymetry used in the 2D model was a pre-processed DEM. The original DEM of the area outside the river with a spatial resolution of 5 m, which covered all the floodplain areas, flood-control-protected areas, and flood storage areas in the study area, was provided by the Anhui Bureau of Surveying and Mapping. Because the crown of threadiness structures (such as railways, highways, and inner river levees) was above the ground and described in the original DEM, an error bathymetry, which could not reflect the ground terrain, was interpolated by directly using the original DEM [35]. We adopted the DEM that excluded the areas around the structures to interpolate the bathymetry.
The bathymetry in the polder areas was simplified as the relationship between the water stage and storage capacity and was acquired from the contingency plan of the polder areas. The relationship between the water stage and storage capacity was an effective alternative to the DEM and was pre-processed from the DEM by previous researchers.

2.3.2. Measured Hydrographs Used for Model Parameter Calibration

In the model parameter calibration phase, measured hydrographs at the SGSs (positions shown in Figure 1c) were used. Measured hydrographs were provided by the Anhui Provincial Hydrological Bureau. For the parameter calibration of the 1D model, we used the measured discharge data at the Huaibing SGS, Baitai Sluice SGS, Beimiaoji SGS, Wangjiaba SGS, and Jiangjiaji SGS along with the measured water stage data at the Fangji SGS, Dilicheng SGS, Shangang SGS, Jiangjiaji SGS, Fuyang Sluice SGS, Wangjiaba SGS, Sanhejian SGS, Nanzhaoji SGS, Runheji SGS, Upper-LFCP SGS, Lower-LFCP SGS, and Zhengyangguan SGS during the flood seasons in 2003 and 2007. For the parameter calibration of the 2D model, we used the measured discharge data through the Wangjiaba flood diversion sluice along with the measured water stage at the Caoji SGS during the operation of the Mengwa flood storage area in 2003 and 2007.

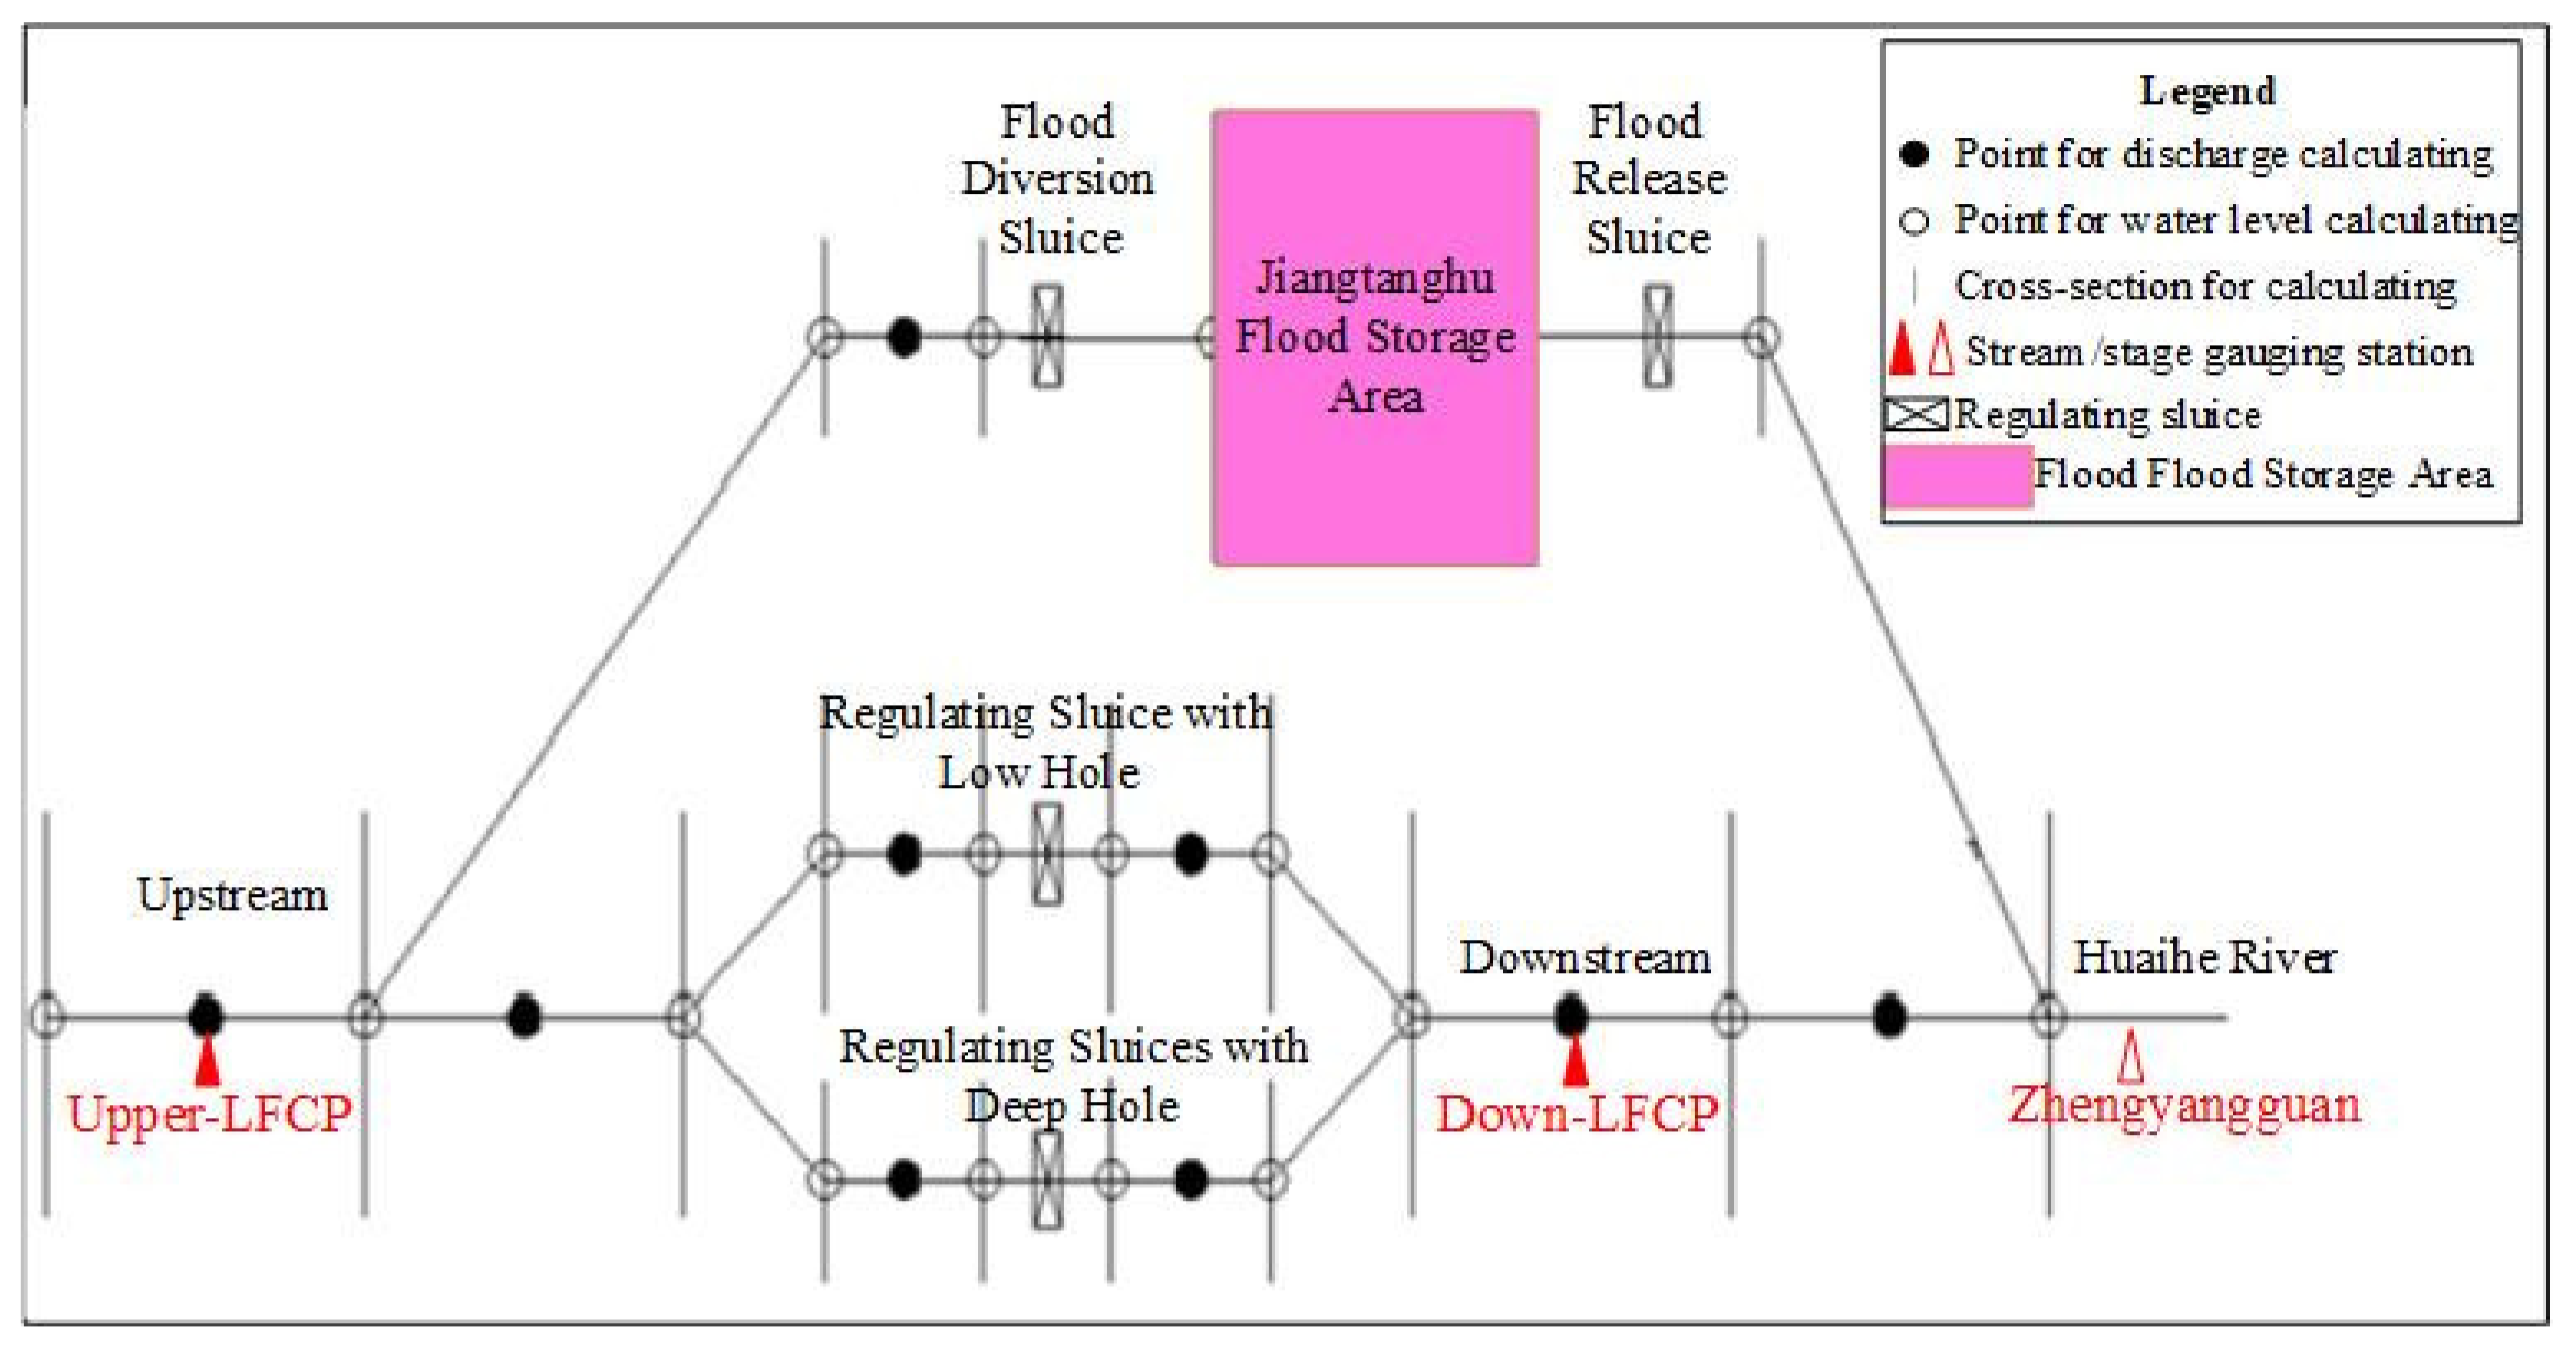
2.3.3. Flood Control Structural Measure Conditions and Operation Rules

In the model parameter calibration phase, the operation of flood control structural measures was based on that of real ones in 2003 and 2007. In 2003, major floods occurred in the Huaihe River, Shihe River, Pihe River, Honghe River, and Yinghe River. The return periods of the maximum 30-day flood volume at Wangjiaba, Runheji, and Zhengyangguan were 11 years, 13 years, and 15 years, respectively [38]. Some flood storage areas, i.e., Mengwa, Tangduohu (part of the Jiangtanghu flood storage area), and Qiujiahu, were put into use to store floodwater, while other flood storage areas were not used. In 2007, major floods occurred in the Huaihe River, Honghe River, and Shihe River. The return periods of the maximum 30-day flood volume at the Wangjiaba, Runheji, and Zhengyangguan were 17 years, 13 years, and 13 years. Mengwa, Nanrunduan, Qiujiahu, and Jiangtanghu were put into use, and other flood storage areas were not used [39].
The contingency plan stipulated the operation rule of flood control structural measures, i.e., when the water stage at the control node in the river reached the control condition, a flood control structural measure should be put into use. In the scenario analysis, we adopted the operation rules of flood control structural measures according to the contingency plan.

2.3.4. Design Flood Hydrographs

Figure 4 plots the design flood hydrographs of subregions used in the flood models. The maximum 30-day flood volume and peak discharge of subregions are listed in Table 2. The hydrographic conditions in the flood model adopted the previous design flood hydrograph result, which was used in the design of the LFCP and was widely used in the flood control project planning in the area. The design flood hydrograph was based on the precipitation conditions in 1954 and current project conditions. The flood in 1954 was the severest basin flood event since the establishment of the People’s Republic of China. The flood hydrograph at the upstream ends of the model branches and the internal flood’s in-line injection to the model branches were designed with different return periods. The hydrographs were provided by the Huai River Water Resources Commission of Ministry of Water Resources and had been previously used in the design of the LFCP. Because we did not obtain sufficient data (e.g., long series of hydrological data, flood control measure conditions, and regulating rules) for the design flood calculation, we did not calculate and re-check the design flood hydrographs.
Floods in the middle reaches of the Huaihe River were characterized by large amounts of floodwater and long durations of high water stage (lasting for several months) [13]. In the flood season, the fluvial floods from the upper reaches of the Huaihe River and its tributaries initially surged down to form a flood peak at Wangjiaba (position shown in Figure 1b). Due to the curvature and small slope of the riverbed, the channel in the reach had a low discharge capacity [13]. Along with the floods from the tributaries that originated from the southern mountainous injecting to the reach, the water stage in the channel increased rapidly and threatened the flood-control-protected areas. With the regulation and slow release of the flood storage areas, the peak stage at Zhengyangguan (position shown in Figure 1b) was high for a month [33].
The design flood regional composition was such that the maximum 30-day flood volume at the LFCP and Zhengyangguan had the same frequency. During the 100-year flood, the maximum 30-day flood volume at Wangjiaba, the LFCP, and Zhengyangguan was 16.8 billion m3, 25 billion m3, and 38.6 billion m3, respectively. During the 1000-year flood, the maximum 30-day flood volume at Wangjiaba, the LFCP, and Zhengyangguan was 25.1 billion m3, 37.4 billion m3, and 59.5 billion m3, respectively.
The design hydrographs were calculated by amplifying a typical flood event in 1954 and 1968. The actual flood in 1954, with a return period of about 40 years, was the severest basin flood event in the past 70 years, and the maximum 30-day flood was the biggest [39]. In the 1954 flood, the 15-day flood volume accounted for 63.2% of the 30-day flood volume, which was less than the mean value. For the actual flood in 1968, a typical upstream regional flood, the 15-day flood volume accounted for 81.0% of the 30-day flood volume, which was more detrimental to the LFCP’s safety. Therefore, the typical flood event in 1954 was used to generate design hydrographs, while the maximum 15-day flood volume of the design hydrographs was amplified with the 1968 flood event with the same frequency, and the other parts of the design hydrographs were reduced to guarantee that the 30-day flood volume was in accordance with the design flood volume.
The design flood region comprised three types of subregions. The first type was from the upstream catchment of the cross-section at the upper boundary of the 1D model, which was set as the boundary in the 1D model. This type included the upstream catchment of Huaibing on the Huaihe River, Beimiaoji on the Bailuhe River, Bantai Sluice on the Honghe River, Bantai Sluice on the Honghe Bypass, Jiangjiaji on the Shihe River, Fuyang Sluice on the Yinghe River, and Fengji on the Pihe River. The second type was the inter-zone between sections, and the inflow did not contain the area outside the river channel, which was set as the liner boundary in the 1D model. This type contained Huaibing to Wangjiaba, Wangjiaba to Nanzhaoji, Nanzhaoji to Linhuaigang, Linhuaigang to Zhengyangguan, Jiangjiaji to Sanhejian, Fuyang Sluice to Zhengyangguan, and Fengji to Zhengyangguan. The third type was the area outside the river channels, and the flow process was added to the 2D model. This type included Guhe River, Runhe River, Mengwa, Chengxihu (Fenghe River), Chengdonghu (Jihe River), Linwangduan, Zhengnanhuai, and Yingyou (Balihe River).

2.4. Scenario Settings

Five scenarios (Table 3) were set based on the needs of the analysis. The flood models for different scenarios were exclusively and consistently in agreement, except for the hydrographic condition or the LFCP operation condition. Firstly, S1 (LFCP not used) and S2 (LFCP used) were set to test whether the flood model could exactly simulate the use of the LFCP and quantitatively analyze the influence of the LFCP on the flooding in the design flood condition. Secondly, S2, S3, S4, and S5, with different hydrographic conditions from the design flood (100-year flood) to the check flood (1000-year flood), were set to test whether the flood model was appropriate for multiple hydrographic conditions.

3. Results

3.1. Verification of the Rationality of the Flood Model

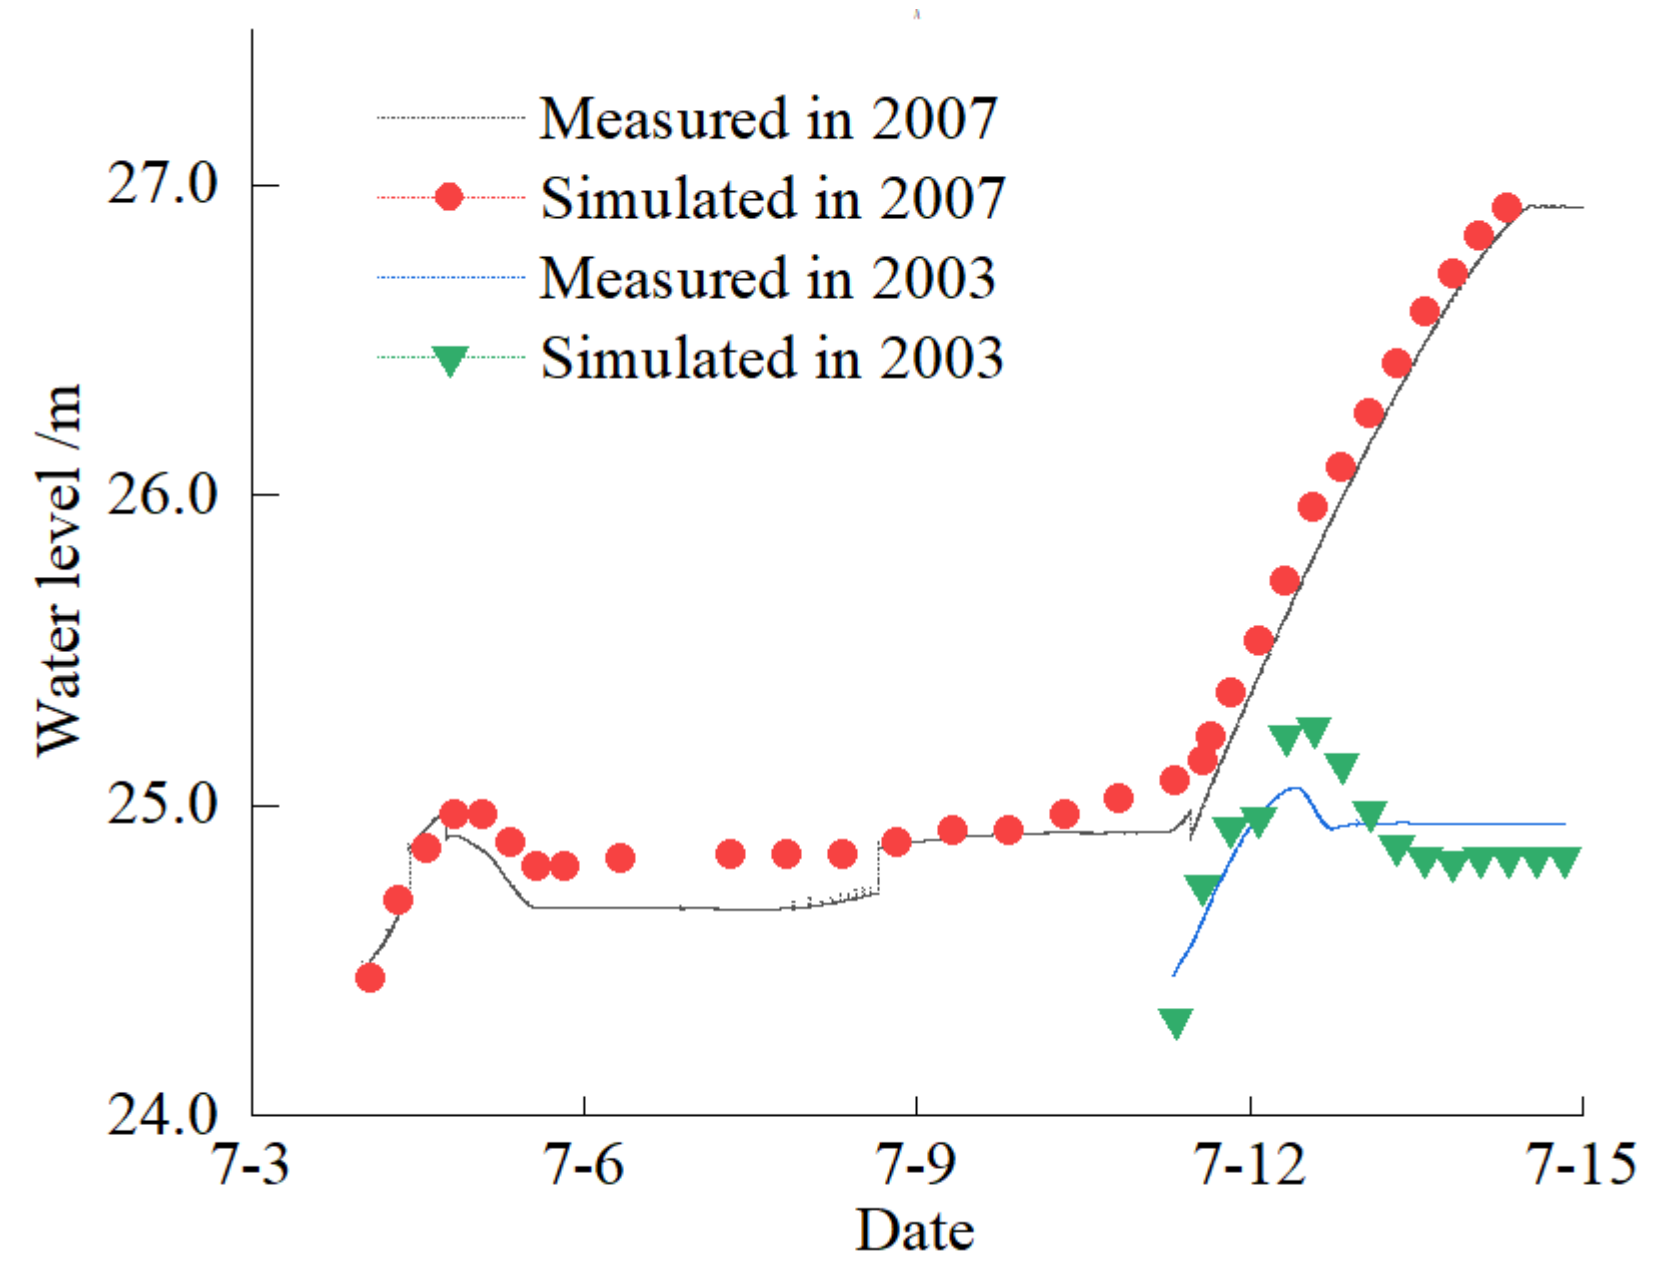
3.1.1. Flood Process Re-Inspection in River Channels

River roughness is a sensitive parameter reflecting water flow resistance, and the accuracy of flood analysis model outputs is related to the roughness value [40]. The flood analysis model was calibrated manually by adjusting model parameters for a close match between the simulated water stage at the SGS and measured data during the 2003 and 2007 flood events. Hence, we did not conduct a parameter sensitivity test. The measured and simulated water stage values at the stream gauging stations are listed in Table 4. The maximum differences in the simulated peak water stage and the measured one at the SGSs were −19.50 cm to 6.23 cm in 2007 and −14.90 cm to 1.13 cm in 2003. The calibrated values of river roughness are shown in Table 5.

3.1.2. Calibration of the Bed Resistance in the 2D Model

The 2D model calibration needs synchronous measured data, including the water stage in the 2D domain and the flow discharge from the river channels to the areas outside them. Although the areas outside the channels had been inundated by the fluvial flood in the past, there was a scarcity of measured data in the study area. While Mengwa diverted the riverine floods in 2003 and 2007, the water stages at Caoji in inner Mengwa were measured synchronously with the discharge of the flood diversion sluice. Bed resistance in the 2D model was related to land use and land cover [41]. From the land use and land cover map with a resolution of 30 m, there were six types of land use and land cover in the Mengwa flood storage area: village, shrub, dryland, paddy, roads, and waterbody. The bed resistance for each cell in the 2D model was calculated with the area weighted average method by using GIS, i.e., multiplying the bed resistance of the specific land use and land cover and its area ratio in the cell, then adding all types of land use and land cover in the cell to the bed resistance for the cell.
Figure 5 shows that the simulated stage hydrograph was close to the measured one at Caoji after the use of Mengwa in 2003 and 2007. In 2003, the simulated highest water stage was 24.98 m, while the measured value was 24.97 m, with a difference of 0.01 m. The simulated flood peak was 1.5 h earlier than the measured flood peak. The simulated maximum water stage in 2007 was 25.06 m, while the measured value was 25.25 m, with a difference of −0.19 m. The simulated flood peak was 3 h earlier than the measured flood peak. The calibrated bed resistance of the area of village, shrub, dryland, paddy, roads, and waterbody were 0.07 s/m1/3, 0.065 s/m1/3, 0.045 s/m1/3, 0.0375 s/m1/3, 0.035 s/m1/3, and 0.025 s/m1/3.

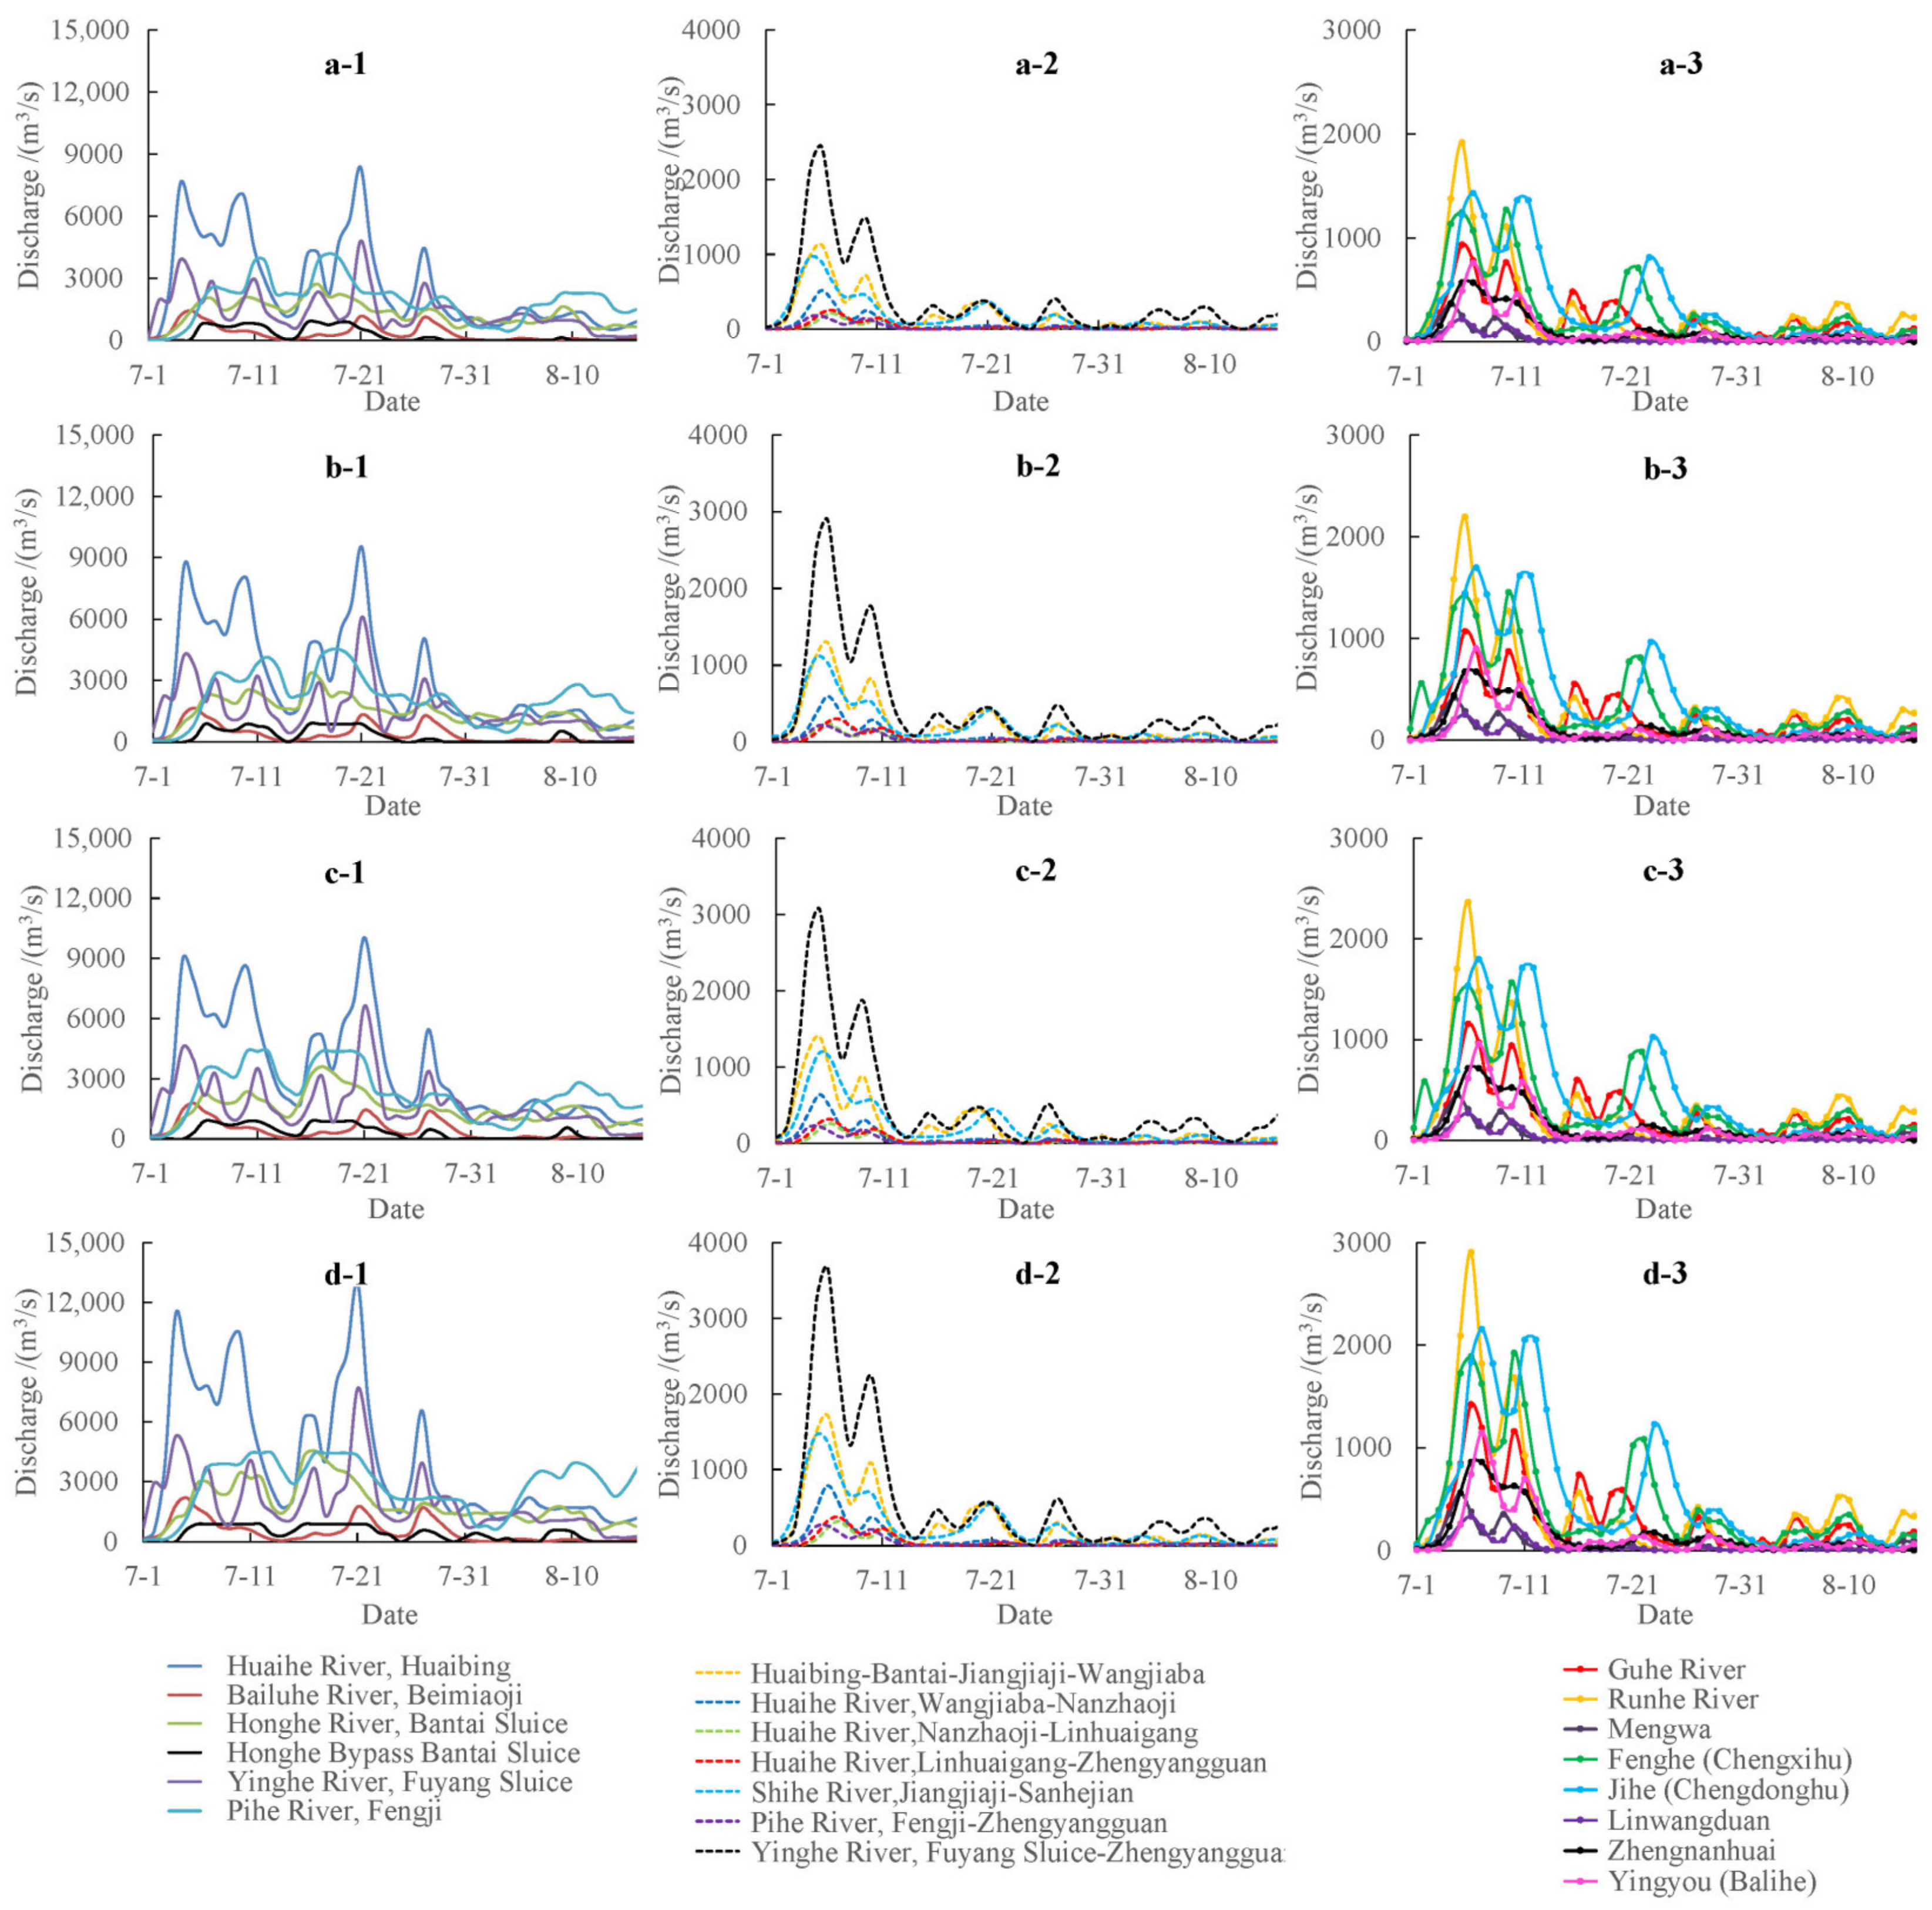
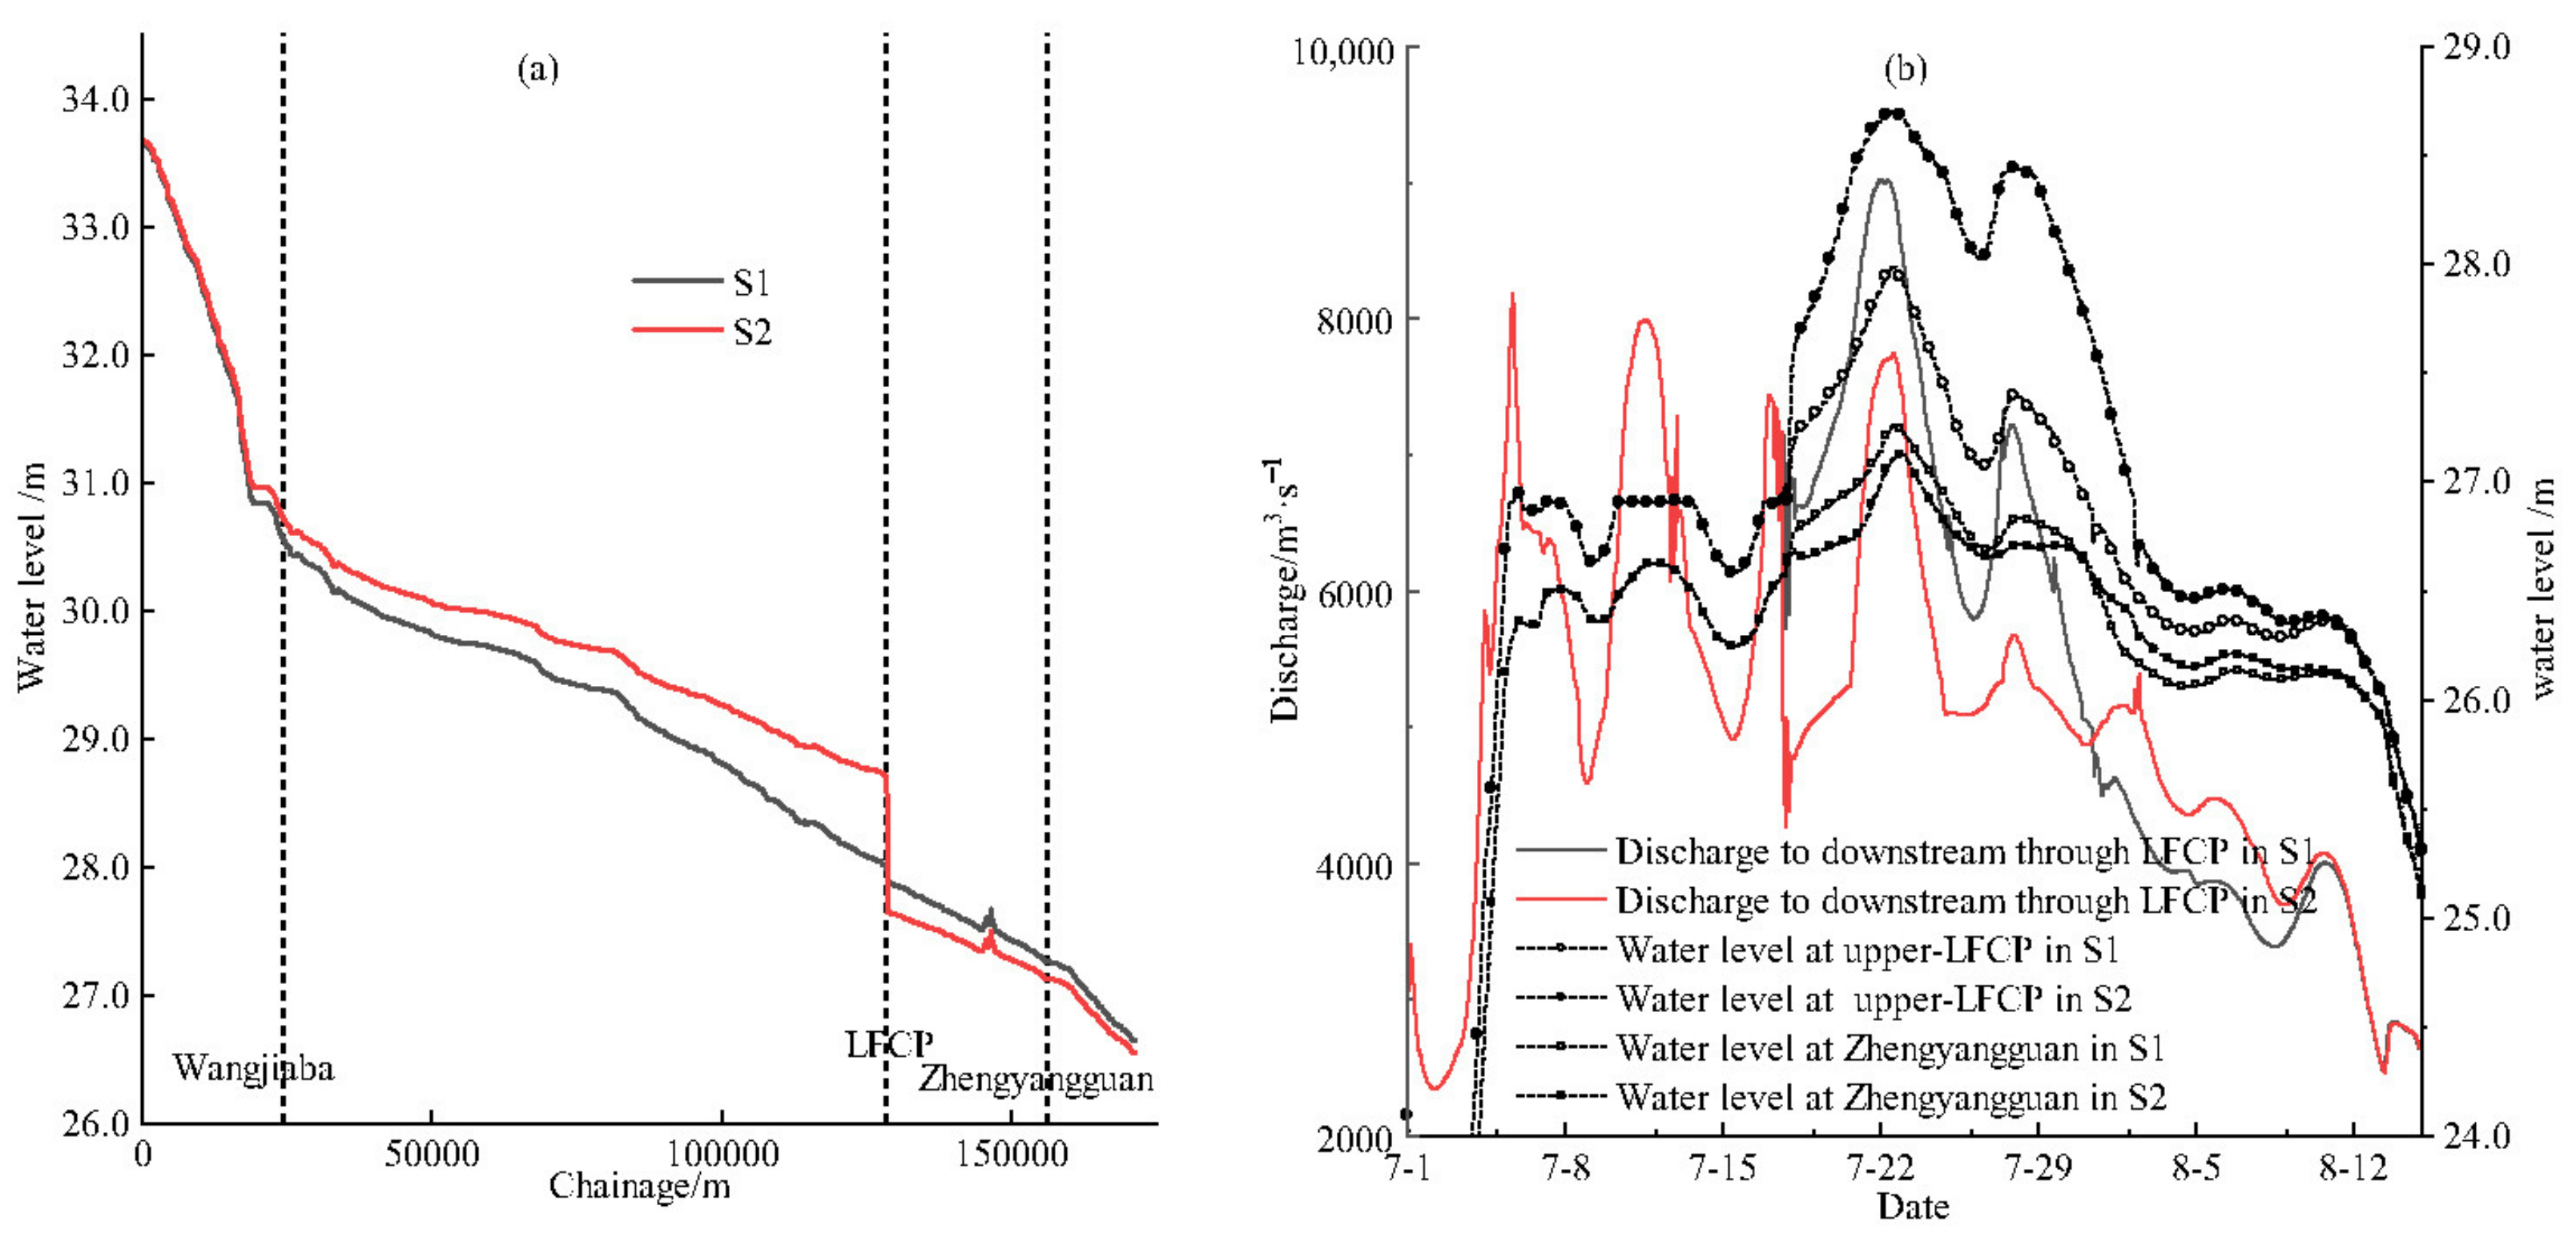
3.2. Riverine Flooding in the Design Flood Event

Figure 6 shows the water stage along the profile in the branch of the Huaihe River, the time series of the discharge by the LFCP, and the water stage upstream of the LFCP and Zhengyangguan under S1 and S2. Table 6 lists the peak water stage at the stream gauging stations. The peak water stage difference between S1 and S2 at Huaibing, Wangjiaba, and the upper LFCP was 0.02 m, 0.17 m, and 0.62 m, indicating that the operation of the LFCP had little impact on the peak water stage in the river above Wangjiaba. There were three flood events with an obvious water stage fluctuation process at Zhengyangguan. During the first and second flood events, the peak water stages at Zhengyangguan reached 26.51 m on 8 July and 26.63 m on 11 July, which were lower than the control level of the LFCP used to control the discharge. During the third flood event, the peak water stage reached 27.26 m on 22 July, which was higher than the control level of the LFCP used to control the discharge. The S2 results showed that during the period from 17 July 15:00 to 2 August 6:00, the LFCP was used to control the discharge from the Huaihe River upstream of the LFCP. Moreover, the peak discharge dropped from 9017.2 m3/s under the non-control condition to 7747.2 m3/s under the control condition. The LFCP retained part of the riverine floodwaters, and the highest water stage upstream of the LFCP was 28.70 m, which was 0.72 m higher than the non-control condition. The accumulated volume of discharge from the LFCP decreased to 1.554 billion m3. Meanwhile, the peak water stage at Zhengyangguan was 26.90 m, which was 0.36 m lower than under the non-control condition. With the increase in flood magnitude (S2–S5), the peak water stage at each stream gauging station increased incrementally. In the 1000-year flood, the water stage at the upper LFCP was 29.37 m, which was approximately similar to the check stage of the LFCP (29.41 m), and that at Zhengyangguan was 27.96 m, which was lower than the crown of the levee around Zhengyangguan.

3.3. Flood Storage Process in Flood Storage Areas

Table 7 shows the time at which the flood storage area started to divert the riverine floodwater, and the LFCP reduced the number of sluices opening. In the 100-, 200-, 300-, and 1000-year flood events, the LFCP started to reduce the number of sluices opening after all flood storage areas were used, with a lag time of 260 h, 135 h, 112 h, and 60 h compared with the last FSA used. This was consistent with the LFCP scheduling and operation rules. In the 100-year return period flood (S2), the flood storage areas were used in the following order: Mengwa, Qiujiahu, Nanrunduan, Shouxihu, Jiangtanghu, Chengxihu, and Chengdonghu. The specific opening times were 4 July 1:00, 4 July 10:00, 4 July 22:00, 5 July 7:00, 5 July 13:00, 5 July 14:00, 6 July 22:00, and 10 July 19:00, and the LFCP start time was 17 July 18:00. The greater the flood magnitude, the earlier the use of flood storage areas and the LFCP in each row. In the 200-year flood scenario (S3), Mengwa, Nanrunduan, Chengxihu, Chengdonghu, Qiujiahu, Jiangtanghu, Shouxihu, and the LFCP were 4 h, 9 h, 12 h, 28 h, 6 h, 12 h, 11 h, and 153 h earlier than in the 100-year flood scenario (S1), respectively.
Table 8 shows the maximum flood storage of the flood storage areas. In the 100-year flood event, comparing the scenario in which the LFCP was not used (S1) with the scenario in which the LFCP was used (S2), the peak water stage and the duration of the peak water stage upstream of the LFCP would increase, which would result in the increase in the maximum flood storage of Mengwa, Nanruanduan, Chengxihu, and Qiujiahu. With the increase in riverine flood magnitude, the maximum flood storage of Mengwa, Nanrunduan, Chengxihu, and Qiujiahu increased, and the Chengdonghu decreased.

3.4. Flood Inundation in Flood-Control-Protected Areas and Polder Areas

Table 9 shows the simulated inundation area and average depth in the flood-control-protected areas and polder areas. In the 100-year flood scenarios (S1, S2), the Linwangduan flood-control-protected area and the Chenda polder area were used to store part of the floodwaters, while other flood-control-protected areas and polder areas were not used. In addition, although the inundation area was the same whether the LFCP was put into use or not, the average water depth increased when the LFCP was put into use. The 200-, 300-, and 1000-year flood scenarios (S3, S4, S5) involved the use of Chenda, Linwangduan, Yangou–Jiamiao–Xuji, Daqiao, Laoliji, Gudui, Wanggang, Qisi, Lixiangpu, and Zhengnanhuai. With the increase in flood magnitude, the inundation area expanded further, and the average water depth of each area increased.

3.5. Flooding in Floodplain Areas

Table 10 shows the exchange between the floodplain and the river. When the water stage in the river channel was higher than the bank of the floodplain area, the floodwater penetrated through the side-link and overflowed into the floodplain. When the waterlogged water stage in the floodplain was higher than the water stage in the river channel, the water in the floodplain flowed into the river channel. The flow direction of Guhewa was mainly from the floodplain to the river channels. In the 100-year flood event, the amount of waterlogging entering the floodplain of the river channel was 227 million m3. The amount of water entering the flooded area due to riverine flooding was 17 million m3. Difuduan and Hongwa mainly relied on the river flooding entering the floodplain in the 100-year return period flood. The river flooding entering Difuduan was 55 million m3, and the water volume in Hongwa was 100 million m3. When the water stage of the river decreased, the storage capacity of the Difuduan and Hongwa floodplain was discharged into the river.

4. Discussion

4.1. Effectiveness of the Flood Model for the Study Area

We established a coupled 1D–2D hydrodynamic model to simulate flood inundation in the composite system of the Linhuaigang flood control project (LFCP), which consists of river channels, flood storage areas, floodplain areas, and flood-control-protected areas downstream of the Huaihe River. Despite the complexity of the system, the flood stage simulated by the coupled model matched the measured peak water levels quite well, thus providing a relatively reliable scenario simulation for extreme flood events. Parameters in the flood model, including the bed resistance in the 1D and 2D models [40], were calibrated with measured water stage data in 2003 and 2007. In 2003 and 2007, some flood storage areas were used [38,39]. The flood model could simulate the water stage in the river reasonably well while the flood storage areas were used to divert and store riverine floods. Based on a 100-year flood or even an exceeding standard flood, other areas outside the river channel, i.e., polder areas, flood-control-protected areas, and floodplain areas, served the function of storing floodwater, which was similar to flood storage areas. Although the flood magnitudes of the 2003 flood and 2007 flood were still far from that of a 100-year flood, because some flood storage areas were put into use in the model calibration phase, we suspect that the flood model is suitable for modeling the 100-year flood or even the exceeding standard flood.

4.2. Flood Model Setup for the Composite System

We proposed a framework for the setup of the flood model for the composite system, which comprised river channels, flood storage areas, floodplain areas, polder areas, flood-control-protected areas, and sluices on the river. The framework was effective at simulating an unsteady flooding process. In this study, we realized the flood modeling of the composite system in the Huaihe River Basin for various flood magnitudes. We used the 1D model to simulate the flood routing in the river channel. To obtain the flood hazard factors in the hinterland (i.e., flood storage areas, floodplain areas, and flood-control-protected areas), we used the 2D model to simulate flood inundation in these areas. For the problem of collecting the DEM of the polder areas, we used a fictitious reservoir to simplify the polder areas as in the 0D model. The polder areas in this study ranged from quite small to several square kilometers in size, and their flood hazard factors were not needed for flood risk mapping. If a polder area had been large in size or the flood hazard factors had been needed, this simplified method would have been unsuitable. Various kinds of linkage were constructed to link the 1D and 2D models. The linkage of the flood storage area and river channel was at the flood diversion sluice and was simulated as the control structure with the operation rule according to the contingency plan. The linkage of the polder area and river channel was at the assumptive breach, and it was modeled by using a control structure with a reservoir. The relationship between the water stage and the storage capacity of the reservoir was more easily accessible in comparison to high-precision DEM in China, e.g., through design reports or contingency plans. The linkage of the flood-control-protected area and river channel was at the assumptive breach, and it was modeled by using a control structure. The breach characteristics (i.e., location, width, and the time when breach formation began) were presupposed according to the contingency plan. The linkage of the floodplain area and river channel was distributed along their common boundary. The sluices on the river in this study had three parts: the first part had a deep hole, the second part had a low hole, and the third part was the flood diversion sluice. Each part was separately controlled. We constructed a virtual channel upstream and downstream for each sluice, and the virtual channels were joined to the real channels. Through the outputs of the flood model, we could obtain hydrographs of the specific cross-section and profile in the river channel, the discharge process of sluices, flood hazard factors in the 2D domain (i.e., the flood storage areas, floodplain areas, flood-control-protected areas, and floodplain areas), and the flood inundation information in the polder areas. Further analysis could be carried out by comparing outputs from flood models with different scenarios, as we did in Section 3. The case study in the Huaihe River Basin proved that our proposed framework was effective. The framework and the case study have some referential significance for other regions in China which have similar conditions. Moreover, the framework proposed in this research was assembled and made available for the composite system; other regions that have part of the composite system could use the relevant part of our proposed framework. For example, from the research on the river channel–flood storage area system, interested parties could extract the part of the framework that involves flood-routing modeling in the river channels and flood inundation modeling in the areas outside the river channel.

4.3. Flood Control Structural Measures Used in the Exceeding Standard Flood

The combined operation of flood control structural measures realizes the potential abilities of the individual measures. From the model results, to effectively cope with the exceeding control standard flood, flood control structural measures in the reaches of the basin were not put into service simultaneously. After all the flood storage areas were put into use, it was still necessary to use the LFCP to control the discharge from the Huaihe River and ensure that the downstream water stage at Zhengyangguan did not exceed the preset value. In the 200-year, 300-year, and 1000-year flood scenarios of the Huaihe River, the simulated upper-LFCP water stage did not exceed the LFCP check water stage.
In order to control the design flood and the exceeding control standard flood (spatial pattern of design flood is based on the 1954 flood), the flood control projects were put into use in the following order: Mengwa, Qiujiahu, Nanrunduan, Shouxihu, Jiangtanghu, Chengxihu, Chengdonghu, Linwangduan, Chenda, the LFCP, Zhengnanhuai, and Yingyou. The probability of flooding was a 100-year flood event in flood-prone areas such as Difuduan and Guhewa, while there was a 200-year flood event in Hongwa. The above-mentioned order of the flood control projects was based on the design flood (based on a historic flood in 1954); for other types of flood composition or actual flood events, the application sequence of various flood control projects should be analyzed further.

5. Conclusions

As more flood control measures have been implemented to form a composite flood control measure system, capabilities for coping with flooding have been remarkably improved. Multiple flood control measures in the composite system are often used together, especially during catastrophic flooding periods. Since the operation of each measure mutually interacts with other measures, the flood hydrograph in the river channel and flood hazard factors in the area outside the river channel rely on not only the nearest measure but also other measures in the basin. Flood modeling of this complex system, which provides the hydrograph and flood hazard factors in advance, is the foundation for scheduling the operation of flood control measures. There are various kinds of flood control measures, and several measures for each kind, in the middle reaches of the Huaihe River Basin, i.e., river channels, flood storage areas, sluices on the river, and levees with different flood control standards (around the polder areas and flood-control-protected areas). Hence, the study area is an excellent site for flood modeling of a complex system. This study proposed a framework for the setup of the flood model of the composite flood control system, which consists of river channels, flood storage areas, floodplain areas, polder areas, and flood-control-protected areas. We selected the inundation area by the Linhuaigang flood control project in the Huaihe River Basin as the study area, which contains seven flood storage areas, three floodplain areas, eight polder areas, and three flood-control-protected areas. In this case study, we described the specific procedure of the framework in detail. The results of this case study can provide technical support for flood risk management for administrators. Moreover, the framework we have proposed here can be applied to model a flood in a similar flood control system, which contains all or some of the kinds of flood control measures we modeled in this study. Researchers can easily construct flood models of their study objects by applying the related part of the framework and this case study. If the study object only contains some kinds of flood control measures, researchers can extract the relevant aspect(s) of the framework. In the past 20 years, the actual floods in the Huaihe River Basin were far below the control standard, and the flood control measures were not fully utilized. Hence, we only modeled flooding under design hydrological conditions and did not model real flood events, although the latter is also very important.

Author Contributions

Conceptualization, Y.H. and T.Q.; methodology, Y.H. and X.C.; software, Y.H., G.D., and H.R.; validation, Y.H., G.D., and H.R.; formal analysis, L.W.; investigation, L.W.; resources, M.W.; data curation, M.W.; writing—original draft preparation, Y.H.; writing—review and editing, T.Q.; visualization, M.W.; supervision, Q.Z.; project administration, M.W.; funding acquisition, X.C. and H.R. All authors have read and agreed to the published version of the manuscript.

Funding

This research was funded by the Anhui Provincial Natural Science Foundation: 2308085US13; Independent Research Project of Water Resources Research Institute of Anhui Province and Huaihe River Water Resources Commission: KJGG202101; Anhui Provincial Natural Science Foundation: 2208085US16; National Natural Science Foundation of China: 52109048; and Science and Technology Projects of Anhui Provincial Group Limited for Yangtze-To-Huaihe Water Diversion: YJJH-ZT-ZX-20230706545.

Data Availability Statement

The data are contained within the article.

Acknowledgments

We would like to express our sincere thanks to the anonymous reviewers.

Conflicts of Interest

The authors declare no conflicts of interest.

References

  1. Duan, W.; He, B.; Nover, D.; Fan, J.; Yang, G.; Chen, W.; Meng, H.; Liu, C. Floods and Associated Socioeconomic Damages in China over the Last Century. Nat. Hazards 2016, 82, 401–413. [Google Scholar] [CrossRef]
  2. Kundzewicz, Z.; Su, B.; Wang, Y.; Xia, J.; Huang, J.; Jiang, T. Flood Risk and Its Reduction in China. Adv. Water Resour. 2019, 130, 37–45. [Google Scholar] [CrossRef]
  3. Xia, J.; Chen, J. A New Era of Flood Control Strategies from the Perspective of Managing the 2020 Yangtze River Flood. Sci. China Earth Sci. 2021, 64, 1–9. [Google Scholar] [CrossRef]
  4. Kryžanowski, A.; Brilly, M.; Rusjan, S.; Schnabl, S. Review Article: Structural Flood-Protection Measures Referring to Several European Case Studies. Nat. Hazards Earth Syst. Sci. 2014, 14, 135–142. [Google Scholar] [CrossRef]
  5. Sun, T.; Cheng, W.-Q.; Bo, Q.-Y.; Meng, X.; Liang, D. Analysis on Historical Flood and Countermeasures in Prevention and Control of Flood in Daqing River Basin. Environ. Res. 2021, 196, 110895. [Google Scholar] [CrossRef]
  6. Vorogushyn, S.; Lindenschmidt, K.-E.; Kreibich, H.; Apel, H.; Merz, B. Analysis of a Detention Basin Impact on Dike Failure Probabilities and Flood Risk for a Channel-Dike-Floodplain System along the River Elbe, Germany. J. Hydrol. 2012, 436–437, 120–131. [Google Scholar] [CrossRef]
  7. Wang, K.; Wang, Z.; Liu, K.; Cheng, L.; Bai, Y.; Jin, G. Optimizing Flood Diversion Siting and Its Control Strategy of Detention Basins: A Case Study of the Yangtze River, China. J. Hydrol. 2021, 597, 126201. [Google Scholar] [CrossRef]
  8. Jonoski, A.; Popescu, I.; Zhe, S.; Mu, Y.; He, Y. Analysis of Flood Storage Area Operations in Huai River Using 1D and 2D River Simulation Models Coupled with Global Optimization Algorithms. Geosciences 2019, 9, 509. [Google Scholar] [CrossRef]
  9. Yu, P.; Ma, H.; Qiu, L.; Zhang, T.; Li, S. Optimization of a Flood Diversion Gate Scheme in Flood Storage and Detention Areas Based on Flood Numerical Simulation. Front. Environ. Sci. 2022, 10, 978385. [Google Scholar] [CrossRef]
  10. Farooq, U.; Taha Bakheit Taha, A.; Tian, F.; Yuan, X.; Ajmal, M.; Ullah, I.; Ahmad, M. Flood Modelling and Risk Analysis of Cinan Feizuo Flood Protection Area, Huaihe River Basin. Atmosphere 2023, 14, 678. [Google Scholar] [CrossRef]
  11. Ferdous, M.R.; Di Baldassarre, G.; Brandimarte, L.; Wesselink, A. The Interplay between Structural Flood Protection, Population Density, and Flood Mortality along the Jamuna River, Bangladesh. Reg. Environ. Chang. 2020, 20, 5. [Google Scholar] [CrossRef] [PubMed]
  12. Ungvári, G.; Kis, A. Reducing Flood Risk by Effective Use of Flood-Peak Polders: A Case Study of the Tisza River. J. Flood Risk Manag. 2022, 15, e12823. [Google Scholar] [CrossRef]
  13. Mingkai, Q.; Kai, W. Flood Management in China: The Huaihe River Basin as a Case Study. In Flood Risk Management; Hromadka, T., Rao, P., Eds.; InTech: London, UK, 2017; ISBN 978-953-51-3465-7. [Google Scholar]
  14. Dupuits, E.J.C.; Klerk, W.J.; Schweckendiek, T.; de Bruijn, K.M. Impact of Including Interdependencies between Multiple Riverine Flood Defences on the Economically Optimal Flood Safety Levels. Reliab. Eng. Syst. Saf. 2019, 191, 106475. [Google Scholar] [CrossRef]
  15. Acheampong, J.N.; Gyamfi, C.; Arthur, E. Impacts of Retention Basins on Downstream Flood Peak Attenuation in the Odaw River Basin, Ghana. J. Hydrol. Reg. Stud. 2023, 47, 101364. [Google Scholar] [CrossRef]
  16. Apel, H.; Merz, B.; Thieken, A.H. Influence of Dike Breaches on Flood Frequency Estimation. Comput. Geosci. 2009, 35, 907–923. [Google Scholar] [CrossRef]
  17. Kvočka, D.; Ahmadian, R.; Falconer, R.A. Flood Inundation Modelling of Flash Floods in Steep River Basins and Catchments. Water 2017, 9, 705. [Google Scholar] [CrossRef]
  18. Mudashiru, R.B.; Sabtu, N.; Abustan, I.; Balogun, W. Flood Hazard Mapping Methods: A Review. J. Hydrol. 2021, 603, 126846. [Google Scholar] [CrossRef]
  19. Teng, J.; Jakeman, A.J.; Vaze, J.; Croke, B.F.W.; Dutta, D.; Kim, S. Flood Inundation Modelling: A Review of Methods, Recent Advances and Uncertainty Analysis. Environ. Model. Softw. 2017, 90, 201–216. [Google Scholar] [CrossRef]
  20. Ahmadian, R.; Falconer, R.A.; Wicks, J. Benchmarking of Flood Inundation Extent Using Various Dynamically Linked One- and Two-Dimensional Approaches. J. Flood Risk Manag. 2018, 11, S314–S328. [Google Scholar] [CrossRef]
  21. Jafarzadegan, K.; Moradkhani, H.; Pappenberger, F.; Moftakhari, H.; Bates, P.; Abbaszadeh, P.; Marsooli, R.; Ferreira, C.; Cloke, H.L.; Ogden, F.; et al. Recent Advances and New Frontiers in Riverine and Coastal Flood Modeling. Rev. Geophys. 2023, 61, e2022RG000788. [Google Scholar] [CrossRef]
  22. Lu, C.W.; Zhou, J.Z.; Jiang, Y.S.; He, D.C. Risk Analysis of Flood Protected Zone with Complex Boundary Conditions and Multi-flood Sources. Adv. Water Sci. 2018, 29, 514–522. [Google Scholar] [CrossRef]
  23. Zhang, W.T.; Liu, Y.T.; Zhang, X.N.; Tang, W.W.; Song, J.H. Flood Routing Simulation and Analysis of Lian’anwei Flood Protection Zone. Water Resour. Prot. 2022, 38, 1–6. [Google Scholar]
  24. Dazzi, S.; Vacondio, R.; Mignosa, P.; Aureli, F. Assessment of Pre-Simulated Scenarios as a Non-Structural Measure for Flood Management in Case of Levee-Breach Inundations. Int. J. Disaster Risk Reduct. 2022, 74, 102926. [Google Scholar] [CrossRef]
  25. Zhang, L.M.; Xu, Y.; Liu, Y.; Peng, M. Assessment of Flood Risks in Pearl River Delta Due to Levee Breaching. Georisk Assess. Manag. Risk Eng. Syst. Geohazards 2013, 7, 122–133. [Google Scholar] [CrossRef]
  26. Huthoff, F.; Remo, J.W.F.; Pinter, N. Improving Flood Preparedness Using Hydrodynamic Levee-Breach and Inundation Modelling: Middle Mississippi River, USA. J. Flood Risk Manag. 2015, 8, 2–18. [Google Scholar] [CrossRef]
  27. Liu, Q.; Qin, Y.; Zhang, Y.; Li, Z. A Coupled 1D–2D Hydrodynamic Model for Flood Simulation in Flood Detention Basin. Nat. Hazards 2015, 75, 1303–1325. [Google Scholar] [CrossRef]
  28. Li, D.; Chen, S.; Zhen, Z.; Bu, S.; Li, Y. Coupling a 1D-Local Inertia 2D Hydraulic Model for Flood Dispatching Simulation in a Floodplain under Joint Control of Multiple Gates. Nat. Hazards 2021, 109, 1801–1820. [Google Scholar] [CrossRef]
  29. Jiang, S.-H.; Zhi, H.-L.; Wang, Z.Z.; Zhang, S. Enhancing Flood Risk Assessment and Mitigation through Numerical Modeling: A Case Study. Nat. Hazards Rev. 2023, 24, 04022046. [Google Scholar] [CrossRef]
  30. César Fassoni-Andrade, A.; Cauduro Dias De Paiva, R.; Wongchuig, S.; Barbosa, C.; Durand, F.; Sanna Freire Silva, T. Expressive Fluxes over Amazon Floodplain Revealed by 2D Hydrodynamic Modelling. J. Hydrol. 2023, 625, 130122. [Google Scholar] [CrossRef]
  31. Vorogushyn, S.; Merz, B.; Lindenschmidt, K.-E.; Apel, H. A New Methodology for Flood Hazard Assessment Considering Dike Breaches. Water Resour. Res. 2010, 46, 2009WR008475. [Google Scholar] [CrossRef]
  32. Ferrari, A.; Dazzi, S.; Vacondio, R.; Mignosa, P. Enhancing the Resilience to Flooding Induced by Levee Breaches in Lowland Areas: A Methodology Based on Numerical Modelling. Nat. Hazards Earth Syst. Sci. 2020, 20, 59–72. [Google Scholar] [CrossRef]
  33. Ma, Z.; Fan, Z.; Zhang, M.; Su, Y. Flood Risk Control of Dams and Dykes in Middle Reach of Huaihe River. Water Sci. Eng. 2014, 7, 17–31. [Google Scholar] [CrossRef]
  34. Wu, S.Q.; Wu, X.F.; Zhou, H.; Zhou, J.Z.; Fan, Z.W. Application of a Flood Control Operation Numerical Model for Linhuaigang Project on Huai River. Hydro-Sci. Eng. 2009, 16, 196–202. [Google Scholar] [CrossRef]
  35. Hu, Y.; Qin, T.; Dong, G.; Zhang, Q.; Chen, X.; Wang, M.; Ruan, H.; Wang, L. Impact of Levee-Breach Width on the Channel–Levee–Floodplain: A Case Study in the Huaihe River Basin, China. Water 2024, 16, 413. [Google Scholar] [CrossRef]
  36. DHI Water & Environment. MIKE FLOOD 1D-2D Modelling; User Manual; DHI Water & Environment: Lakewood, CO, USA, 2013. [Google Scholar]
  37. Tull, N.; Passalacqua, P.; Hassenruck-Gudipati, H.J.; Rahman, S.; Wright, K.; Hariharan, J.; Mohrig, D. Bidirectional River-Floodplain Connectivity During Combined Pluvial-Fluvial Events. Water Resour. Res. 2022, 58, e2021WR030492. [Google Scholar] [CrossRef]
  38. Bureau of Hydrology of the Ministry of Water Resources; Huai River Water Resources Commission of Ministry of Water Resources. Huaihe River Storm Flood in 2003; China Water and Power Press: Beijing, China, 2006.
  39. Bureau of Hydrology of the Ministry of Water Resources; Huai River Water Resources Commission of Ministry of Water Resources. Huaihe River Storm Flood in 2007; China Water and Power Press: Beijing, China, 2010.
  40. Alipour, A.; Jafarzadegan, K.; Moradkhani, H. Global Sensitivity Analysis in Hydrodynamic Modeling and Flood Inundation Mapping. Environ. Model. Softw. 2022, 152, 105398. [Google Scholar] [CrossRef]
  41. Goeury, C.; Bacchi, V.; Zaoui, F.; Bacchi, S.; Pavan, S.; El Kadi Abderrezzak, K. Uncertainty Assessment of Flood Hazard Due to Levee Breaching. Water 2022, 14, 3815. [Google Scholar] [CrossRef]
Figure 1. (a) Location of the Huaihe River Basin in China. (b) Location of the study area in the Huaihe River Basin. The Linhuaigang flood control project (LFCP) is located upstream of Zhengyangguan (a critical node of flood control in the basin). (c) The composition of the study area. The sluices of the LFCP are situated on the Huaihe River channel. Note: 1. Lixiangpu polder area; 2. Qisi polder area; 3. Gudui polder area; 4. Wanggang polder area; 5. Laoliji polder area; 6. Yangou–Jiamiao–Xuji polder area; 7. Chenda polder area; 8. Daqiao polder area; 9. Hongwa floodplain; 10. Difuduan floodplain; 11. Guhewa floodplain; 12. Mengwa flood storage area; 13. Nanrunduan flood storage area; 14. Qiujiahu flood storage area; 15. Chengxihu flood storage area; 16. Jiangtanghu flood storage area; 17. Chengdonghu flood storage area; 18. Shouxihu flood storage area; 19. Linwangduan flood-control-protected area; 20. Yingyou flood-control-protected area; 21. Zhengnanhuai flood-control-protected area.
Water 16 00825 g001
Figure 2. Topological structure of the modeled area.
Water 16 00825 g002
Figure 3. Schematic diagram of the LFCP in the 1D model.
Water 16 00825 g003
Figure 4. Design hydrographs of subregions with 100-, 200-, 300-, and 1000-year flood events. Subregions cover the upstream catchment, inter-zone and area outside the river channel: (a-1) inflow from the upstream catchment in the 100-year flood, (a-2) inter-zone inflow into river channel in the 100-year flood, (a-3) pluvial flood into area outside the river channel in the 100-year flood; (b-1) inflow from the upstream catchment in the 200-year flood, (b-2) inter-zone inflow into river channel in the 200-year flood, (b-3) pluvial flood into area outside the river channel in the 200-year flood; (c-1) inflow from the upstream catchment in the 100-year flood, (c-2) inter-zone inflow into river channel in the 100-year flood, (c-3) pluvial flood into area outside the river channel in the 100-year flood; (d-1) inflow from the upstream in the 1000-year flood, (d-2) inter-zone inflow into river channel in the 1000-year flood, (d-3) pluvial flood into area outside the river channel in the 1000-year flood.
Water 16 00825 g004
Figure 5. Comparison of the measured and simulated water stage at the Caoji while the Mengwa flood storage area was in operation in 2003 and 2007.
Water 16 00825 g005
Figure 6. (a) Profile of Huaihe River in the design flood with return period of 100 years. S1 is the scenario in which the LFCP was used, and S2 is the scenario in which the LFCP was not used; (b) time series of discharge and water stage at the upper LFCP and Zhengyangguan in S1 and S2.
Water 16 00825 g006
Table 1. Generalization of subareas in the flood model.
MethodAreaSimulation UnitIn–OutflowLink to the 1D Model
0DPolder areaLixiangpu; Qisi; Guidui; Wanggang; Laoliji;
Yangou–Jiamiao–Xuji; Chenda; Daqia
BreachSide structure
1DRiver channelsHuaihe River from Huaibin to Lutaizi SGS (201 km);
Honghe River from Bantai Sluice SGS to estuary (74.06 km);
Honghe Bypass areas from Bantai Sluice SGS to estuary (70.72 km);
Bailuhe River from Beimiaoji SGS to estuary (31.38 km);
Menghe Bypass areas (48.5 km);
Shihe River from Jiangjiaji SGS to estuary (40.14 km);
Yinghe River from Fuyang Sluice SGS to estuary (206.64 km);
Pihe River from Fengji SGS to estuary (54.40 km)
//
2DFlood-control-protected areaLingwangduan; Yingyou; ZhengnanhuaiBreachStandard link
Flood storage areaMengwa; Qiujiahu; Nanrunduan; Chengxihu; Chengdonghu; Jiangtanghu; ShouxihuFlood diversion sluiceStandard link
Floodplain areaHongwa; Difuduan; GuhewaOverflowLateral link
Note: SGS, stream gauging station.
Table 2. Maximum 30-day flood volume and peak discharge of subregions in the 100-, 200-, 300-, and 1000-year flood events. Compositions of floods are from the upstream catchments (first type of subregion), the inter-zones between the sections (second type of subregion), and the 2D domains outside the river channels (third type of subregion). The flood from the first type of subregion, e.g., the upstream catchment of Huaibing on the Huaihe River, is set as the boundary in the 1D model. The flood from the second type of subregion, e.g., Huaibing to Wangjiaba on the Huaihe River, is set as the liner boundary in the 1D model. The flood from the third type of subregion, e.g., the Guhe River, is added to the 2D model.
SubregionMaximum 30-Day Flood Volume
(billion m3)
Peak Discharge (m3/s)
100 Years200 Years300 Years1000 Years100 Years200 Years300 Years1000 Years
Huaihe RiverUpstream of Huaibing9.4410.8211.9617.438380953010,04813,005
Huaibing to Wangjiaba *0.951.091.171.441916219323642906
Wangjiaba to Nanzhaoji0.220.260.280.34519593640787
Nanzhaoji to Linhuaigang0.100.120.130.16213243262323
Linhuaigang to Zhengyangguan0.130.160.170.20253299318381
Bailuhe RiverUpstream of Beimiaoji1.291.481.591.961439164717752183
Honghe RiverUpstream of Bantai Sluice4.054.764.826.142713331336014550
Honghe BypassUpstream of Bantai Sluice0.991.071.181.50880880880880
Shihe
River
Upstream of Jiangjiaji4.695.305.796.724793608866217664
Jiangjiaji to Sanhejian0.680.780.841.03964110311901463
Yinghe RiverUpstream of Fuyang Sluice5.786.687.177.764191424443644430
Fuyang Sluice to Zhengyangguan1.361.621.712.052445289530683678
Pihe
River
Upstream of Fengji4.125.185.756.563314367040484583
Fengji to Zhengyangguan0.110.130.140.16176208221265
Guhe River0.710.810.871.081132129613981718
Runhe River0.690.790.851.04935107011531418
Mengwa0.180.210.230.28368421453557
Chengxihu (Fenghe River)1.091.301.401.671269145215661925
Chengdonghu (Jihe River)1.371.641.742.081432169517962153
Linwangduan0.100.120.130.16221253273335
Zhengnanhuai0.420.500.530.64569673713855
Yingyou (Balihe River)0.370.440.470.567609009541144
Note: * denotes that the subregion does not contain areas upstream of the Beimiaoji in the Bailuhe River and upstream of the Bantai Sluice of the Honghe River.
Table 3. Calculation schemes.
Scheme NumberHydrographic ConditionOperating Mode Condition
S1100-year return period floodLFCP not used
S2100-year return period floodLFCP used
S3200-year return period floodLFCP used
S4300-year return period floodLFCP used
S51000-year return period floodLFCP used
Table 4. Comparison of the calculated and measured peak water stage in 2003 and 2007.
River BreachStream Gauging StationPeak Water Stage in 2007Peak Water Stage in 2003
Simulated /mMeasured
/m
D-Value
/cm
Simulated /mMeasured
/m
D-Value
/cm
Honghe riverFangji31.9432.06−11.7031.5031.63−13.50
Honghe BypassDilicheng29.4129.60−19.5029.1729.28−11.00
Menghe BypassShangang29.2829.29−1.3928.9528.940.68
Shihe riverJiangjiaji32.7732.86−9.1033.3133.39−8.00
Yinghe riverFuyang Sluice29.6829.82−14.1029.1629.31−14.90
Huaihe riverWangjiaba29.4829.426.2329.2929.227.18
Sanhejian28.5528.495.7828.2128.34−13.23
Nanzhaoji28.1528.17−1.5827.8527.88−3.58
Runheji27.6627.66−0.1927.4527.46−0.80
Upper-LFCP27.0227.002.40///
Down-LFCP26.8526.823.30///
Zhengyangguan26.2926.30−1.3026.7026.691.13
Table 5. Roughness value used in the 1D model.
River BreachRoughness Value/(s/m1/3)
Overflow LandMain River Channel
Honghe River0.040–0.0470.025–0.030
Honghe Bypass0.0350.025
Bailuhe River0.0370.026
Menghe Bypass0.040.026
Shihe River0.0360.025
Yinghe River0.040–0.0470.024–0.028
Pihe River0.040.035
Huaihe River0.036–0.0400.024–0.026
Table 6. Peak water stage simulated at stream gauging stations under designed scenarios.
Stream Gauging StationPeak Water Stage/m
S1S2S3S4S5
Huaibing33.6533.6734.2334.5935.85
Wangjiaba30.5430.7131.3331.6032.37
Sanhejian29.3929.7030.3130.5431.03
Nanzhaoji29.1529.5130.0830.3030.73
Runhejian28.6729.1729.6229.8130.17
Upper LFCP27.9828.7028.9629.0729.37
Zhengyangguan27.2626.9027.4527.4327.96
Table 7. Moment when flood storage areas and the LFCP were put into use.
Project NameThe Moment Put into Use
S1S2S3S4S5
Mengwa4 July 1:004 July 1:003 July 21:003 July 20:003 July 15:00
Nanrunduan4 July 22:004 July 22:004 July 13:004 July 12:004 July 4:00
Chengxihu5 July 14:005 July 14:005 July 2:004 July 23:004 July 14:00
Chengdonghu6 July 22:006 July 22:005 July 18:005 July 6:004 July 20:00
Qiujiahu4 July 10:004 July 10:004 July 4:004 July 2:003 July 21:00
Jiangtanghu5 July 13:005 July 13:005 July 1:004 July 22:004 July 15:00
Shouxihu5 July 7:005 July 7:004 July 20:004 July 16:004 July 10:00
LFCP/17 July 18:0011 July 9:009 July 22:007 July 8:00
Table 8. Flood storage volume in the flood storage areas.
Flood Storage AreaDesign ValueFlood Storage Volume/108
Volume/108Water Stage/mS1S2S3S4S5
Mengwa7.527.78.33 8.97 9.74 10.02 10.48
Nanrunduan0.6426.40.77 0.82 0.86 0.96 1.59
Chengxihu28.827.630.62 33.84 36.39 37.31 40.52
Qiujiahu1.726.94.56 8.68 13.29 15.83 20.21
Chengdonghu15.325.59.93 9.43 9.25 9.25 7.46
Table 9. Flood inundation characteristics in the flood-control-protected areas and polder areas.
Name of Flood-Control-Protected AreaInundation Area/Million m2Average Water Depth/m
S1S2S3S4S5S1S2S3S4S5
Yingyou008198791040002.132.162.30
Linwangduan1311321341341354.504.805.235.435.78
Zhengnanhuai00425436459001.751.861.93
Chenda27272828304.494.915.595.656.65
Yangou–Jiamiao–Xuji00575759004.004.996.15
Daqiao00353535004.295.867.34
Laoliji00394041002.603.845.22
Gudui006779124001.402.313.49
Wanggang00555563001.643.205.89
Qisi00272829003.154.114.93
Lixiangpu00264874001.251.673.24
Table 10. Exchange between the floodplain area and the river channel.
Floodplain AreaFrom the Floodplain Area to the River/108 m3From the River to the Floodplain Area/108 m3
S1S2S3S4S5S1S2S3S4S5
Guhewa2.27 2.04 4.23 8.59 8.49 0.17 0.42 0.69 0.41 5.07
Difuduan0.14 0.17 0.41 0.49 0.71 0.55 0.64 1.56 2.58 5.30
Hongwa0.00 0.00 0.01 0.01 0.10 0.01 0.01 0.37 0.87 2.79
Disclaimer/Publisher’s Note: The statements, opinions and data contained in all publications are solely those of the individual author(s) and contributor(s) and not of MDPI and/or the editor(s). MDPI and/or the editor(s) disclaim responsibility for any injury to people or property resulting from any ideas, methods, instructions or products referred to in the content.

