Abstract
In order to understand the pollution degree and source of potentially toxic elements (PTEs) in groundwater around the accident site and evaluate their harm to human health, 22 groundwater samples were collected around the accident well, and the contents of As, Cd, Cr, Cu, Hg, Ni, Pb, Zn, CH2Cl2 and C2H4Cl2 were determined. On the basis of water quality evaluation, the source apportionment method combining qualitative and quantitative analysis was used to determine the main sources of PTEs in the region, and the health risk assessment model was used to evaluate the health risk of PTEs to the human body. The results show that pH, TDS, Th and COD all exceed the standard to varying degrees, among which TH is the index with the largest number exceeding the standard. The quality of the groundwater environment in the study area is at a very poor level, and the F value is between 7.25 and 8.49. The exposure results model showed that there was no non-carcinogenic risk of PTEs in the study area, and the health risk of oral intake in the exposed population was greater than that of skin contact. Compared with adults, children were more vulnerable to the health risk stress of PTEs in groundwater. The total carcinogenic risk is higher than the total non-carcinogenic risk. As, Cd and Cr are the primary factors causing carcinogenic health risks in this area. Principal component analysis (PCA) was used to analyze the sources of PTEs in groundwater, and three principal components were extracted. It was preliminarily determined that PTE pollution was mainly related to agricultural sources, anthropogenic industrial sources and industrial sedimentation sources. The results of positive definite factor matrix analysis (PMF) were basically similar to those of PCA, but PMF further clarified the contribution rate of three pollution sources, among which agricultural sources contributed the most to the accumulation of PTEs.
1. Introduction
Groundwater is a kind of extensive and fragile natural resource that is very important for human survival and development. According to statistics, the total amount of water resources in China in 2022 was 2708.81 billion m3, of which 792.44 billion m3 was underground water resources, accounting for about 30% of the total water resources [1]. Groundwater resource storage and water security play an important role in regional economic development and residents’ lives. Especially in northern China, most of the water used in human daily life comes from groundwater [2].
However, in recent years, with the rapid growth of the economy and population, urbanization and industrialization have rapidly improved. At the same time, due to the large discharge of industrial waste, agricultural waste and municipal solid waste, the quality of the groundwater environment has been seriously threatened [3,4,5,6,7], especially groundwater pollution with potentially toxic element (PTE) pollution as an important source of pollution. According to the 2006 report of the World Health Organization, nearly 80% of human diseases worldwide are caused by groundwater pollution. Heavy metal pollution and organic pollution in groundwater are some of the causes of biological and ecosystem toxicity [8].
These typical PTEs have strong neurotoxicity, long-distance migration and difficult degradation [9,10,11]. PTEs bioaccumulate in the process of transferring along the food chain, which has a more serious impact on the ecological environment and human health [12,13,14,15]. For example, large amounts of toxic elemental mercury have been found in fish or other animals in remote Arctic regions [16]. In recent years, scholars at home and abroad have focused on different areas and different types of soil around coal-fired power plants. Among the many evaluation methods, the Nemerow pollution index method, principal component analysis method, gray system method and fuzzy comprehensive evaluation method, which add the uncertainty theory of pollution to the research method, are the most frequently used. The health risk model was used to carry out research on the human health risk assessment of PTEs [17,18,19,20]. There are also some studies on the qualitative source identification and quantitative source analysis of pollutant source analysis methods such as joint correlation analysis, cluster analysis and the positive matrix factorization model [21,22,23]. However, there are few reports on the quantitative source apportionment of PTEs in groundwater, especially the combination of the dual quantitative source apportionment receptor model for source apportionment and mutual comparison.
Due to the existence of factories around the study area, there are unknown people dumping waste liquid in the accident well, resulting in environmental pollution incidents. Therefore, this paper selects 22 groundwater sampling points at an accident site in Zhangqiu City, Shandong Province, China. According to the detection results of various indicators of groundwater in this area, based on the analysis and determination of PTE content in groundwater, the single-factor pollution index and Nemerow comprehensive pollution index method were used to comprehensively evaluate the PTE pollution characteristics of groundwater. Based on the IBM SPSS Statistics 26.0 model of correlation analysis combined with principal component analysis and the positive matrix factorization model, the PTE pollution source of groundwater was quantitatively explained, and the health risk system proposed by USEPA was used to evaluate the health risk of PTEs in groundwater to the human body in two ways. It provides a scientific basis for maintaining the safety of the groundwater environment and human health.
2. Materials and Methods
2.1. Study Area
Zhangqiu District is located in the eastern region of Jinan City, with an area of 1719 km2. It is connected to the Zhoucun District of Zibo City in the east and the Daiyue District of Tai an City in the south. The traffic in the area is convenient. Zhangqiu District is located on the northern foot of Taiyi Mountain, bordering on the North China Plain [24]. The Great Wall Ridge stretches to the south, and Changbai Mountain stands to the east. The terrain is tilted from southeast to northwest and from south to north, followed by mountains, hills, plains and depressions. It is a continental climate in the warm temperate monsoon region. The four seasons are distinct, and the rain and heat occur in the same season. Spring is dry and windy, summer rainfall is concentrated, autumn is mild and cool and winter snow is less dry and cold [25]. The accident site is located in the surrounding area of Shanggao Village Coal Mine in Zhangqiu City, Shandong Province.
The southern part of the Tuozhangqiu belongs to the Luxi uplift, and the northern part belongs to the Jiyang sag. The geological structure is dominated by monoclinic strata, with a strike of 60° NW and a dip angle of 7° to 13°. The strata exposed in the study area are mainly Quaternary and Ordovician, and the remaining strata are less or not exposed [26]. The sedimentary sequence of each geological age is the Archean metamorphic rock series, the Paleozoic sedimentary rock series, the Mesozoic sedimentary rock series and the Cenozoic sedimentary rock series [27]. The larger synclines in the study area include the Wenzu–Bucun syncline and the Xilanggou syncline. The faults and fissures are mostly NNW and NNE, and the larger faults are the Wenzu fault, Yuwangshan fault, Ganquan fault, Songjiazhuang fault and so on.
The hydrogeological unit of the study area belongs to the upstream runoff area of the Mingshui spring basin. The piedmont zone in the northern part of the study area is mainly loose rock pore water. The main aquifer of carbonate rock fissure karst water is the Wuyangshan Formation, which is mainly located in the south and exposed to the surface. The karst fissure water of clastic rock and carbonate rock is mainly coal-bearing strata. The bedrock weathering fissure water is mainly distributed in the northern part of the study area. Artificial mining discharge is an important discharge form of karst water in the area. Because the area is mainly a monoclinic structure, confined groundwater is often formed in the continuous distribution section of sandstone.
2.2. Sampling and Analysis
Combined with the geological structure, environment and human activities, according to ‘the technical guidelines for the sampling of volatile organic compounds in soil and groundwater’ (HJ 1019-2019), ‘Groundwater environment investigation and evaluation work guide’, ‘Groundwater environment monitoring technical specification’ (HJ 164-2020), the point layout is required, 22 monitoring wells are set up and a total of 22 groups of groundwater samples are collected. The groundwater sampling points are shown in Figure 1. Taking the accident well as the center, 22 monitoring wells were taken around the accident well. Clean, dry polyethylene plastic bottles were used to take water samples, and the sample pretreatment was completed within 24 h.
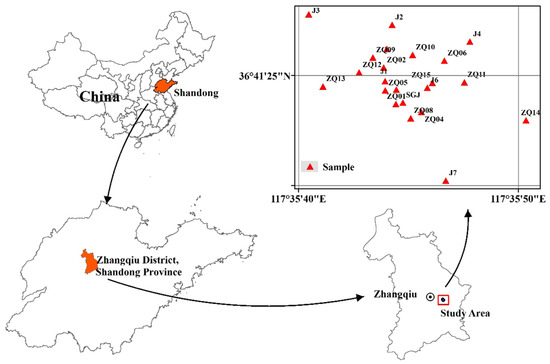
Figure 1.
The schematic diagram of sampling points in the study area.
Inductively coupled plasma mass spectrometry (ICP-MS) (ICP-MS, Thermo X Series 2, Waltham, MA, USA) is used to detect heavy metal ions in groundwater samples. Volatile organic compounds in water samples are detected according to ‘Determination of volatile organic compounds in water quality-Purge and trap/gas chromatography-mass spectrometry’ (HJ 639-2012). Quality assurance and control are carried out by means of method blank and matrix addition. We use a purge and trap device (ATOMX-XYZ 1090L0429, Mason, OH, USA), and the chromatographic mass spectrometer is Agilent 8890-5977B (Agilent, Santa Clara, CA, USA) [28]. All tests are performed in triplicate to ensure the accuracy of the analysis. The error of parameter analysis is detected by the cation–anion concentration balance method, and the measurement error is less than 5%.
2.3. Groundwater Quality Assessment
The comprehensive evaluation method of groundwater quality is the evaluation method recommended by the ‘Groundwater Quality Standard’ (GB/T 14848-2017) [29]. The specific steps are as follows: Firstly, the element indexes were determined according to ‘Groundwater Quality Standard’ [29], and the pollution indexes of single component and multiple components were calculated with the limitation of class III water quality standard as the evaluation standard. Then, the pollution grade of sampling points was determined by combining the classification standards of multiple indexes [30,31].
2.3.1. Single-Factor Evaluation Method
The measured concentration value is compared with the limit value in the evaluation standard to determine the pollution level of the pollutant. The formula is as follows:
In the formula, Pki is the pollution index of the pollution index i in the water quality sample of the k monitoring well; cki is the measured concentration of the pollution index i in the water quality sample of the k monitoring well; sij is the limit value of pollution index i in GB/T 14848-2017 j water quality standard.
The pollution level is divided into six grades, and the degree of pollution has never reached serious pollution. The specific evaluation and grading standards of single-factor evaluation are shown in Table 1.

Table 1.
Single-factor pollution score levels.
2.3.2. Nemerow Comprehensive Evaluation Method
The comprehensive evaluation method of the Nemerow index is used to obtain the environmental pollution index by comparing the measured value of the water quality monitoring index with the environmental standard value and then calculating the weight on the basis of the obtained environmental pollution index, which can accurately take into account the influence of the maximum value and avoid the influence of personal subjective factors in the process of weighted calculation. The formula is as follows:
In the formula, cki is the measured concentration of the pollution index i in the water quality sample of the k monitoring well; sij is the limit value of pollution index i in GB/T 14848-2017 j water quality standards; Fmax is the maximum value of each pollution index Fi, which is dimensionless; is the average value of each pollution index Fi, which is dimensionless. The classification of the Nemerow comprehensive pollution index is shown in Table 2. The pollution level is divided into five grades, and the pollution degree is superior to the range.
Table 2.
Nemerow comprehensive evaluation score levels.
2.4. Health Risk Assessment Model
PTEs in groundwater mainly harm human health through oral intake (including direct drinking water and indirect drinking water) and skin contact (including bathing and swimming). These two methods account for more than 90% of the pollutants ingested in or in contact with the human body. PTEs in groundwater in the study area can be divided into chemical carcinogenic elements (As, Cd, Cr, CH2Cl2 and C2H4Cl2) and chemical non-carcinogenic elements (Cu, Zn, Ni, Hg and Pb). Their risk characterization is mainly carried out in two aspects, namely non-carcinogenic risk assessment and carcinogenic risk assessment [32].
Recipients exposed to groundwater in and around industrial areas can be divided into adults and children. The US Environmental Protection Agency (USEPA) has developed a human health risk assessment model. Based on this model, different calculation methods are used to calculate the health risks caused by oral intake and skin contact [32]. The groundwater health risks in China are mostly based on foreign models and parameters. The actual evaluation results will be affected by uncertainties such as system models, scenarios and human activities. Therefore, the exposure parameters of Shandong Province are used as much as possible in the specific calculation process to make the research results more in line with the actual situation of local people.
- (1)
- Risk exposure through oral intake route: ADDi, mg (kg × d)−1
In the formula, cw is the pollutant concentration, mg × L−1; IR is drinking water intake, L × d−1; EF is drinking water exposure frequency, d × a−1; ED is the exposure period of drinking water, a; BW is the average body weight of the population in Shandong Province (the two groups are divided into adults and children), kg; AT is exposure time (non-carcinogenic exposure time and carcinogenic exposure time), d. Reference values of model parameters are in Table 3.
Table 3.
Exposure measurement calculation parameters.
- (2)
- Risk exposure of skin contact pathway, ADDd, mg (kg × d)−1
In the formula, cw is the pollutant concentration, mg × L−1; SA is the skin contact surface area, cm2; PC is skin permeation constant, cm × h−1; ET is the exposure time, h × d−1; EF is the frequency of skin contact exposure, d × a−1; ED is the duration of skin contact exposure, a; CF is the volume conversion factor, L × cm−3. The reference values and units of model parameters are shown in Table 3.
- (3)
- Risk characterization
The PTEs detected in the samples were divided into two categories, non-carcinogenic substances and carcinogenic substances, and their health risks are calculated according to Equations (7) and (8), respectively [33]. The values of RfDi and SFi are shown in Table 4.
Table 4.
Skin permeation constant and reference dose of PTEs for oral and transdermal delivery [34,35,36,37,38].
In the formula, is the lifetime excess carcinogenic risk of carcinogenic pollutant i to the population for 70 years, which is dimensionless, LADDi is the daily average exposure dose of threshold chemical pollutants, mg (kg × d)−1, and the calculation method is the same as ADD.
Assuming that PTEs in water have a cumulative relationship with human health risks, the health risk RT caused by a single element to two groups of people can be expressed as in Equation (9), and the total health risk HI caused by all elements in two ways to two groups of people can be expressed as in Equation (10).
In the formula, is the lifetime risk of health hazards caused by non-carcinogenic pollutants; ADDi is the average daily exposure dose of threshold chemical pollutants, mg (kg × d)−1; RfDi is the reference dose for a certain exposure pathway of chemical pollutants, mg (kg × d)−1; 10−6 is the acceptable risk level of the hypothesis corresponding to RfD.
2.5. Analytical Method of Pollution Source
2.5.1. Correlation Analysis
Correlation analysis is a statistical method for studying the uncertain relationship between variables that can be used to analyze the degree of correlation between two or more correlated variable elements. In general, if there is a positive correlation between elements, it indicates that there may be the same or similar behavior and source between elements; if it is negatively correlated, it indicates that there are different sources or no correlation between elements [39].
2.5.2. Principal Component Analysis
Principal component analysis (PCA) can use dimensionality reduction to transform the original complex and mutually contained environmental features into a few main original feature indicators that are closely related to each other. In the process of induction, as much information in the data sample should be retained as possible to ensure the reliability of the analysis results. As the basic basis for evaluating the importance of alternative indicators, the public degree of the selected indicator is closer to 1, which means that the indicator is more difficult to replace. According to Caesar’s criterion, the impact factor index with an eigenvalue greater than 1 is retained as the principal component [40].
2.5.3. Positive Definite Matrix Factorization Model
The positive matrix factorization (PMF) model is a receptor model that can determine the contribution value of the pollution source to the receptor. Its application premise is that there is no value less than 0 in the source contribution matrix and the pollution source matrix, and the source contribution matrix (gik) and the source component spectrum matrix (fkj) are obtained [41]. The specific calculation formula is
In the formula, Xij represents the content of the jth element in the ith sample; p is the number of pollution sources; gik represents the contribution rate of source k to the first i sample; fkj denotes the content of the jth element in the source k; eij is the residual matrix; Q is the objective function; n is the number of samples; m is the number of element types; uij is the uncertainty value of j element content in the ith sample.
When the element content is less than or equal to the method detection limit (MDL), uij can be calculated by Formula (13):
When the element content is higher than MDL, it is calculated from Formula (14) [42]:
In the formula, EF is the percentage of uncertainty, and c is the measured value of the element.
2.6. Data Analysis and Mapping Tools
Microsoft Excel 2019 was used for statistical analysis of element data. Principal component analysis and correlation analysis were carried out by SPSS 26.0 and Origin2021 software, respectively, and PMF5.0 was used to analyze the source of elemental pollution. We used Origin2021 and Arcgis10.7 software to complete the drawing and editing of the map.
3. Results and Discussion
3.1. Levels of Major Parameters
A total of 22 groundwater samples were collected in this study. The PTE indicators tested included 10 indicators of As, Cd, Cr, Cu, Hg, Ni, Pb, Zn, CH2Cl2 and C2H4Cl2. The statistical results of conventional indicators of groundwater quality are shown in Table 5. According to the class III standard limit specified in the ‘Groundwater Quality Standard’ (GB/T 14848-2017) [29], the pH range is 3.10–7.70, with an average value of 6.54, indicating that the pH of groundwater in the study area is neutral and acidic. The content of TDS is 513.00–34,400.00 mg × L−1, which indicates that the groundwater in this area is fresh water and brackish water. The variation range of TH is 342.00 mg × L−1–2930.00 mg × L−1, which indicates that there is a large area of high-hardness water in the groundwater in this area. The indexes of groundwater quality exceed the national class III water quality standard to varying degrees, and the most excessive index is TH.
Table 5.
Statistical results of groundwater quality indicators.
The distribution of PTE content in groundwater is shown in Figure 2. It can be seen from the diagram that various indicators have high outliers to varying degrees. Ni and Zn at some sites were also significantly higher. The study area is seriously polluted, and the spatial difference is large. It is necessary to evaluate the human health risk of groundwater in this area. Among the groundwater detection indicators, the coefficient of variation for Cd, Cr, Cu, Ni and Zn exceeded 1.0, indicating that there was a large difference in water quality between groundwater samples.
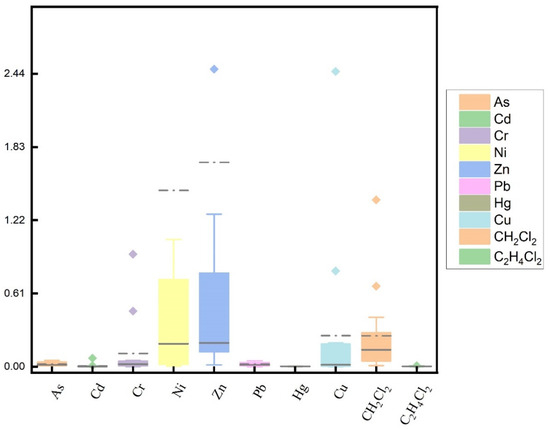
Figure 2.
Distribution map of PTE content in groundwater.
3.2. Groundwater Quality Evaluation Results
From the perspective of single-factor pollution in Table 6, all eight heavy metal indicators have water samples at moderate to severe pollution levels. Among them, the contribution of Ni pollution was the highest, the number of samples with severe pollution reached 14, accounting for 51.8%, and the highest value of the single-factor pollution index reached 915. Followed by Pb, four samples were at the level of severe pollution, and the highest value of the single-factor pollution index reached 32.6%. All eight indexes of ZQ01 points in all samples exceeded the standard and were at the level of heavy pollution. Except for Hg, the single-factor pollution index of the other seven indexes was at the maximum value in all samples. The second is the J1 point, which has Cr, Ni and As indicators of a heavy pollution level. From the comprehensive evaluation of groundwater indicators in Table 6, it can be seen that the quality of the groundwater environment in the study area is at a very poor level, the F value is between 7.25 and 8.49, and the drinking water wells around the accident wells are at a poor level.
Table 6.
Groundwater quality evaluation table.
3.3. Groundwater Health Risk Assessment
Based on the health risk assessment model, the health risks of PTEs in groundwater in the study area to adults and children through oral intake and dermal contact were calculated as shown in Table 7. The total health risks of the five non-carcinogenic PTEs in the study area through oral intake and skin contact with the population did not exceed the maximum acceptable level recommended by the International Commission on Radiological Protection (ICRP) of 5.0 × 10⁻⁵ a−1. The total health risks of the three carcinogenic heavy metal elements in the PTEs through oral intake to the population exceeded the maximum acceptable level, which should be paid attention to. From Table 7, it can be seen that Cd has the greatest carcinogenic health risk to children through oral intake, which is 9.20 × 10⁻⁴, and Cr has the greatest carcinogenic health risk to children through skin contact, which is 7.44 × 10⁻⁵. The maximum non-carcinogenic health risk of Ni to children through oral intake was 3.07 × 10⁻⁶, and the maximum non-carcinogenic health risk of Zn to children through skin contact was 2.99 × 10⁻⁹. The total non-carcinogenic risks of PTEs in groundwater to the two groups of people under the oral intake route and the skin contact exposure route were Ni > Pb > Hg > Cu > Zn and Zn > Hg > Ni > Cu > Pb, respectively. The non-carcinogenic risk of oral intake was consistent with the trend of total non-carcinogenic risk. The total non-carcinogenic risk is 1~2 orders of magnitude lower than the maximum acceptable risk level (5.0 × 10⁻⁵ a−1), and the total carcinogenic risk value is 2~4 orders of magnitude higher than the total non-carcinogenic risk value, indicating that the non-carcinogenic health risk of groundwater in the study area is small, and the daily drinking water, bathing, swimming and other activities of the population will not cause significant harm.
Table 7.
Health risk assessment results.
The EPA’s acceptable risk level for carcinogens is in the range of 10−6–10−4. Less than 10−6 indicates that the risk is not obvious, 10−6–10−4 indicates that there is a risk, and more than 10−4 indicates that there is a significant risk. From Table 7, it can be seen that Cr has the greatest health risk of carcinogenicity for children through both routes. The carcinogenic risk of oral intake is 1.39 × 10⁻³, which exceeds the acceptable risk level by 1–3 orders of magnitude, with a significant risk. The carcinogenic risk of skin contact is 7.74 × 10⁻⁵. The carcinogenic risks of CH2Cl2 and C2H4Cl2 in PTEs to children through oral intake were 1.29 × 10⁻⁵ and 6.46 × 10⁻⁶, respectively, which were risky but not significant. As, Cd and Cr have a significant risk to both groups under the exposure route of oral intake, and the risk is not obvious under the exposure route of skin contact. The carcinogenic risk of oral intake is 2–4 orders of magnitude larger than that of skin contact. Therefore, As, Cd and Cr are the three primary factors that cause the carcinogenic health risk of the population (especially children) in this area. We should pay attention to the pollution of As, Cd and Cr in the groundwater in the study area.
In general, by comparing the health risks of groundwater PTEs to the two groups of people in different exposure routes, it can be seen that the health risks of children and adults are in the same order of magnitude, whether through oral intake or skin contact, but children are always slightly higher than adults. Therefore, we should focus on the health risks of groundwater PTE toxicity to children.
3.4. Source Apportionment of Elements in Groundwater
3.4.1. Correlation Analysis
Correlation analysis has a basic distinguishing effect on exploring the sources of different PTEs, and can simply identify the correlation between different PTEs. In general, correlation analysis can be used to analyze whether different PTEs have a significant positive correlation, so as to determine whether different PTEs may come from similar sources or the same source [43].
In this paper, the correlation between groundwater PTEs in the study area was analyzed by Origin2021 software (Figure 3).
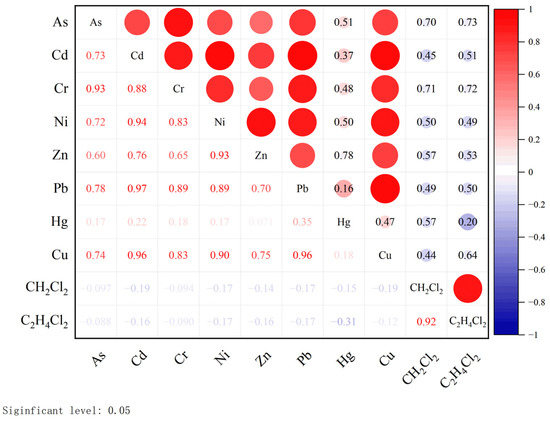
Figure 3.
Correlation analysis matrix.
The results show that there is a significant positive correlation between the seven heavy metal elements except Hg in the study area, and the correlation is pairwise, indicating that there may be an information overlap between As, Cd, Cr, Cu, Ni, Pb and Zn elements in groundwater in the study area, and the correlation coefficients are all > 0.5, so they may undergo the same environmental geochemistry or have a compound pollution relationship. However, the correlation coefficient between C2H4Cl2 and CH2Cl2 is 0.92, which is a very significant correlation level but has no significant relationship with other PTEs. Therefore, CH2Cl2 and C2H4Cl2 are more likely to come from the same pollution source. In addition, there is no obvious correlation between Hg and other PTEs in the study area, and there may be independent pollution sources.
3.4.2. PCA
The results of the KMO and Bartlett sphericity tests showed that the KMO test value was 0.652, the Bartlett sphericity test statistic was 0, and the significance test value of the Bartlett sphericity test was p < 0.05, indicating that this group of data was suitable for PCA. PCA was carried out by IBM SPSS Statistics 26.0 software. Three principal components were extracted by the Kaiser standardized orthogonal rotation method, which were F1, F2 and F3.
Three principal components (F1–F3) were extracted by principal component analysis and could explain 89.454% of the total variance. The principal component loads contained in each component are shown in Table 8. The contribution of As, Cd, Cr, Cu, Ni, Pb and Zn in F1 is higher, and the absolute value of the factor load exceeds 0.8. The principal component contains seven heavy metal elements. The long-term input of livestock and poultry manure and the application of chemical fertilizers may be the main sources of Cu, Zn, Cd and Cr in the study area. Livestock feed additives, pesticides and fertilizers are used more frequently in the local area [44,45], indicating that they are mainly affected by agricultural sources. The contribution of CH2Cl2 and C2H4Cl2 in F2 is higher, and the factor load is greater than 0.9. Since some indicators of groundwater have changed significantly due to the dumping of chemical waste by three enterprises in the study area, F2 explains the impact of this pollution incident on groundwater quality, indicating that it may be affected by anthropogenic industrial sources. The factor load of Hg in F3 is greater than 0.8, and Hg is seriously polluted in some sample points. However, due to the volatility of Hg, its content has a large degree of spatial dispersion. It is preliminarily judged that Hg enrichment is mainly caused by the accumulation of micro-particles released by surrounding coal combustion through atmospheric deposition, which is mainly an industrial sedimentation source.
Table 8.
The main calculation results of PTEs’ principal component analysis.
3.4.3. PMF
Principal component analysis combined with correlation analysis basically explained the possible sources of 10 PTEs in the study area. On this basis, the PMF method can be used to quantitatively analyze the source of PTEs in the study area. When calculating the uncertainty of PTEs, the signal-to-noise ratio of Ni and Zn is small (S/N = 0), which is classified as ‘Bad’, the signal-to-noise ratio of Cu is small (S/N < 0.5), which is classified as ‘weak’, and the remaining PTEs are classified as ‘strong’. After trial calculation, when the number of setting factors is 2–7, the number of operations is 25 times and the number of factors is 3, QRobust/Qtrue decreases rapidly, and the residual value is between −3 and 3. The proportion is the largest, indicating that the correlation between the measured value and the predicted value of the PMF model is high [46], and it is inferred that there are three main sources of PTEs in this area.
According to the source composition spectrum (Figure 4) and source contribution diagram (Figure 5), it was found that As, Cd, Cr, Cu and Pb had higher loads on PMF1, which were 34%, 88%, 54.7%, 93.1% and 38.2%, respectively, which were consistent with the results of F1. Cd, as a representative element of PMF1, is an iconic element of agricultural activities [47]. Agricultural activities such as industrial waste, pesticides, fertilizers and plastic film use will lead to its high content. The excessive point of the Cd element is distributed near villages and towns in the study area, which also confirms this point. In the study area, there is the Minggao No. 2 coal mine, which is located in the east of the Jidong coalfield. There are many roadways filled with water. Some studies have pointed out that As, Ni and Cr are relatively stable in nature. They are usually regarded as crustal elements, mainly derived from soil characteristics [48]. Therefore, PMF1 is mainly affected by agricultural sources.
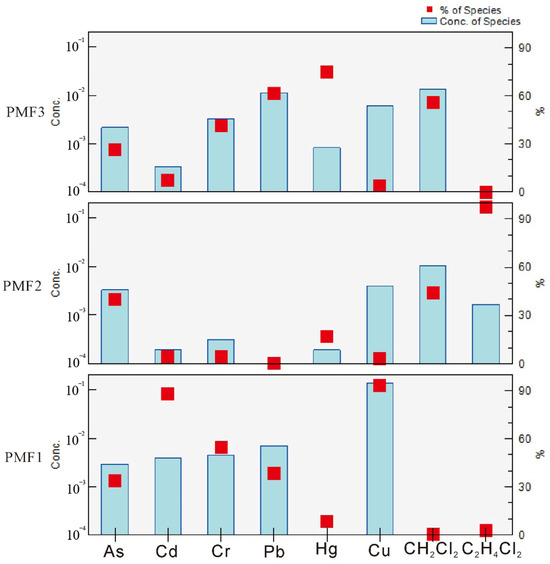
Figure 4.
Analytical results of PMF model.
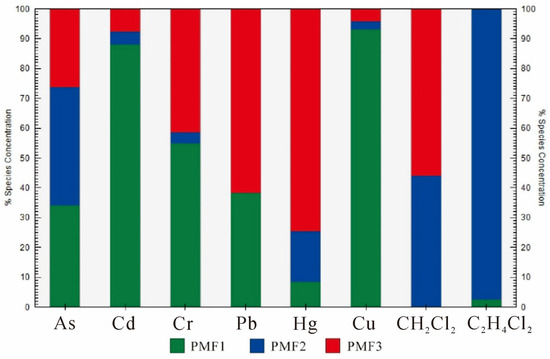
Figure 5.
The proportion of PTE factors in groundwater.
The contribution rates of CH2Cl2 and C2H4Cl2 in PMF2 were 43.9% and 97.6%, respectively, indicating that the load of similar elements was higher, which was due to the fact that the surrounding companies poured waste samples into the accident well, mainly due to the influence of artificial industrial sources.
PMF3 has higher Hg and Pb element loads, with contribution rates of 74.7% and 61.8%. Atmospheric deposition and surface water are the main sources of Hg. Chemical enterprises use oil and coal as the main fuel, and coal combustion leads to the emission of Hg-containing gases. Pb is the iconic element of traffic activity [49], the main source of automobile exhaust and coal combustion, so it suggests that Hg enrichment is mainly due to its release into the surrounding metallurgy and coal, mainly from industrial sedimentation sources.
From the source apportionment results, the two analyses have similar identification results in the qualitative identification of potential pollution sources and generally represent the same potential pollution sources. In addition, the two models are slightly different in the distribution of principal component composition but do not affect the overall analytical results. From the perspective of the contribution rate of pollution sources, the trend and contribution rate of pollution sources analyzed by the two models are different. The reason for this difference is that the factorization process of the two models is different, that is, although both of them are based on the calculation of the least squares method, they are different in the factor extraction model [50,51].
According to the factor profile of PMF, the average contribution of sample sources to the total mass was calculated (Figure 6). The results showed that As, Cd, Cr, Cu and Pb are mainly from agricultural sources, with a contribution rate of 39.84%. CH2Cl2 and C2H4Cl2 are mainly affected by anthropogenic industrial sources, with a contribution rate of 26.13%. Hg is from an industrial sedimentation source, with a contribution rate of 34.04%.
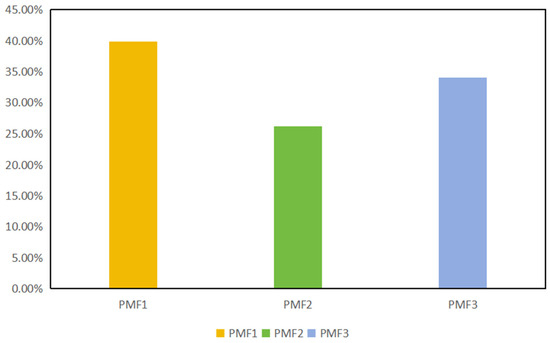
Figure 6.
Contribution rate distribution diagram of sources.
4. Conclusions
This paper took an accident site in Zhangqiu City, Shandong Province, as the main research area, determined the pollution situation and pollution source of the research area, made a pollution assessment and health risk assessment of the research area, and provided information for the sustainable development and utilization of groundwater resources in the research area and on the protection of and improvement in the living environment. It is of great significance. The comprehensive indexes of pH, TDS, COD, TH and PTEs in groundwater at the accident site are significantly high, exceeding the class III standard limit to varying degrees, and the spatial dispersion of PTE content is large. The single-factor pollution index values of Ni and Pb in the PTE index are high. According to the single-factor pollution index method, most of the PTEs are at a safe or alert level. According to the Nemerow comprehensive pollution index, there are heavy pollution levels. The sample points are ZQ01 and ZQ07, and Ni is the main contribution factor in the region. In view of the comprehensive consideration of PTEs, the groundwater in the study area is seriously polluted. According to the non-carcinogenic risk assessment, the total non-carcinogenic risk index of groundwater around the accident site for nearby children and adults does not exceed the non-carcinogenic safety risk value, but the risk value for children is higher than that for adults. According to the carcinogenic risk assessment, the carcinogenic health risk values of adults and children exposed to As, Cd and Cr through oral intake in the study area are all high, and the maximum acceptable risk value is 1.0 × 10⁻⁴. The control of As, Cd and Cr in groundwater in the study area should be strengthened. Among the two exposure routes, the oral intake route has the greatest impact. On the basis of correlation analysis and principal component analysis, combined with the PMF model, the main pollution sources of PTEs in the study area were determined. As, Cd, Cr, Cu, Ni, Pb and Zn are from agricultural sources (PMF1), CH2Cl2 and C2H4Cl2 are from human-made industrial sources (PMF2) and the accumulation of Hg is mainly from industrial sedimentation sources (PMF3). The contribution rates of the three pollution sources were 39.84%, 26.13% and 34.04%, respectively.
Author Contributions
M.W.: conceptualization, investigation, methodology, project administration, writing—original draft; X.S.: conceptualization, methodology, project administration, writing—review and editing; Y.H.: conceptualization, investigation, writing—original draft; G.D.: methodology, writing—original draft; R.Z.: methodology, software, writing—review and editing; S.W.: methodology, data curation; S.G.: supervision; Y.L.: validation. All authors have read and agreed to the published version of the manuscript.
Funding
The study was supported by the National Natural Science Foundation of China (No. 42202294).
Data Availability Statement
Data are available upon request from the corresponding author. The data are not publicly available due to privacy reasons.
Conflicts of Interest
The authors declare no conflicts of interest.
References
- 2022 China Water Resources Bulletin. Water Resour. Dev. Manag. 2023, 9, 2. Available online: http://www.mwr.gov.cn/xw/slyw/202306/t20230629_1672395.html (accessed on 10 January 2024).
- Ministry of Ecology and Environment of the People’s Republic of China National Groundwater Pollution Prevention and Control Plan (2011–2020) [EB]. 2011. Available online: https://www.mee.gov.cn/gkml/hbb/bwj/201111/W020111109376922920938.pdf (accessed on 28 October 2011).
- Xiao, H.; Shahab, A.; Li, J.Y.; Xi, B.; Sun, X.; He, H.; Yu, G. Distribution, ecological risk assessment and source identification of heavy metals in surface sediments of Huixian karst wetland, China. Ecotoxicol. Environ. Saf. 2019, 185, 109700. [Google Scholar] [CrossRef]
- Ahmed, S.; Khurshid, S.; Madan, R.; Bassam, A.A.; Naushad, M. Water quality assessment of shallow aquifer based on Canadian Council of Ministers of the environment index and its impact on irrigation of Mathura District, Uttar Pradesh. J. King Saud Univ.-Sci. 2020, 32, 1218–1225. [Google Scholar] [CrossRef]
- Ahmedd, S.; Akhtar, N.; Rahman, A.; Mondal, N.; Khurshid, S.; Sacsh, S.; Khan, M.; Kamboj, V. Evaluating groundwater pollution with emphasizing heavy metal hotspots in an urbanized alluvium watershed of Yamuna River, northern India. Environ. Nanotechnol. Monit. Manag. 2022, 18, 100744. [Google Scholar] [CrossRef]
- Pazand, K.; Khosrvai, D.; Ghaderi, M.R.; Rezvaniyanzadeh, M. Hydrogeochemistry and lead contamination of groundwater in the north part of Esfahan province, Iran. J. Water Health 2018, 16, 622–634. [Google Scholar] [CrossRef]
- Baskaran, P.; Abraham, M. Evaluation of groundwater quality and heavy metal pollution index of the industrial area, Chennai. Phys. Chem. Earth Parts A/B/C 2022, 128, 103259. [Google Scholar] [CrossRef]
- Belkhiri, L.; Mouni, L.; Sheikhy Narany, T.; Tiri, A. Evaluation of potential health risk of heavy metals in groundwater using the integration of indicator kriging and multivariate statistical methods. Ground Water Sustain. Dev. 2017, 4, 12–22. [Google Scholar] [CrossRef]
- Wang, S.; Gu, Y.; Yang, J.; Jiang, Y.; Yu, X.; Zhang, Z.; Wang, J.; Wang, T.; Zhang, Y. Emissions and distribution characteristics of heavy metal in 1000MW near-zero emission coal-fired units. China Environ. Sci. 2022, 42, 2060–2069. [Google Scholar]
- Zhao, L.Y.; Kong, L.H.; Zhao, Z.G.; Zhou, W.; Qiu, J.; Huang, J.; Geng, B.; Yang, M.; Han, X.; Li, Y.; et al. Pollution Characteristics, Source Analysis and Risk Assessment of Heavy Metals in Soil Around a Gold Mine in Jiaodong Peninsula. Geol. China 2023, 1–28. Available online: http://kns.cnki.net/kcms/detail/11.1167.P.20231106.1329.002.html (accessed on 26 February 2024).
- Ljung, K.; Otabbong, E.; Selinus, O. Natural and anthropogenic metal inputs to soils in urban uppsala, sweden. Environ. Geochem. Health 2006, 28, 353–364. [Google Scholar] [CrossRef]
- Huang, R.J.; Cheng, R.; Jing, M.; Yang, L.; Li, Y.; Chen, Q.; Chen, Y.; Yan, J.; Lin, C.; Wu, Y.; et al. Source-specific health risk analysis on particulate trace elements: Coal combustion and traffic emission as major contributors in wintertime Beijing. Environ. Sci. Technol. 2018, 52, 10967–10974. [Google Scholar] [CrossRef]
- Gu, C.; Zhao, Y. Research progress of air pollutant emissions of Chinese coal-fired power plants. J. China Coal Soc. 2022, 1–12. Available online: https://kns.cnki.net/kcms/detail/11.2190.TD.20220816.1038.003.html (accessed on 9 January 2024).
- Xie, T.Y.; Shi, Z.M.; Gao, Y.W.; Tan, L.; Meng, L. Modeling analysis of the characteristics of selenium-rich soil in heavy metal high background area and its impact on main crops. Ecol. Inform. 2021, 66, 101420. [Google Scholar] [CrossRef]
- Wang, J.; Zhang, X.; Chen, A.; Wang, B.; Zhao, Q.; Liu, G.; Xiao, X.; Cao, J. Source analysis and risk evaluation of heavy metal in the river sediment of polymetallic mining area: Taking the Tonglüshan skarn type Cu-Fe-Au deposit as an example, Hubei section of the Yangtze River Basin, China. China Geol. 2022, 5, 649–661. [Google Scholar]
- Outridge, P.M.; Mason, R.P.; Wang, F.; Guerrero, S.; Heimburger, L. Updated global and oceanic mercury budgets for the United Nations global mercury assessment. Environ. Sci. Technol. 2018, 52, 11466–11477. [Google Scholar] [CrossRef]
- Huang, X.; Hu, J.; Qin, F.; Quan, W.; Cao, R.; Fan, M.; Wu, X. Heavy metal pollution and ecological assessment around the Jinsha coal-fired power plant (China). Int. J. Environ. Res. Public Health 2017, 14, 1589. [Google Scholar] [CrossRef]
- Minkina, T.; Konstantinova, E.; Bauer, T.; Mandzhieva, S.; Sushkova, S.; Chaplygin, V.; Burachevskaya, M.; Nazarenko, O.; Kizilkaya, R.; Gülser, C.; et al. Environmental and human health risk assessment of potentially toxic elements in soils around the largest coal-fired power station in Southern Russia. Environ. Geochem. Health 2020, 43, 2285–2300. [Google Scholar] [CrossRef]
- Linnik, V.G.; Minkina, T.M.; Bauer, T.V.; Saceliev, A.; Mandzhieva, S. Geochemical assessment and spatial analysis of heavy metals pollution around coalfired power station. Environ. Geochem. Health 2021, 42, 4087–4100. [Google Scholar] [CrossRef]
- Liu, Z.; Fang, Z.; Ding, X. Heavy metal pollution and health risk assessment of soil in ash yard of coal-fired power plant. Ecol. Environ. 2021, 30, 1916–1922. [Google Scholar] [CrossRef]
- Yang, Z.; Xiao, R.; Chen, Y.; Deng, Y.; Han, C.; Liu, C.; Gao, Z.; Huang, S.; Dai, W. Heavy metal distribution, risk assessment and source analysis of soil around a typical coalfired power plant in South China. Acta Ecol. Sin. 2020, 40, 4823–4835. [Google Scholar]
- Yang, M.; Li, X.; Wang, Y.; Zhang, J. Spatial distribution, source analysis and health risk assessment of heavy metals in surface dust around a coal-fired power plant. J. Arid Land Resour. Environ. 2022, 36, 176–182. [Google Scholar] [CrossRef]
- Che, K.; Chen, C.; Zheng, Q.; Fan, H.; Wei, M.; Luo, P.; Yu, J. Heavy metal emissions from coal-fired power plants and heavy metal pollution characteristics and health risks in surrounding soils. Environ. Sci. 2022, 43, 4578–4589. [Google Scholar] [CrossRef]
- Chen, H.; Wu, W.; Cao, L.; Zhou, X.; Guo, R.; Nie, L.; Shang, W. Source Analysis and Contamination Assessment of Potentially Toxic Element in Soil of Small Watershed in Mountainous Area of Southern Henan, China. Int. J. Environ. Res. Public Health 2022, 19, 13324. [Google Scholar] [CrossRef]
- Han, Y.; Liu, Y.; Wei, S.; Wang, M.; Ding, G.; Song, X.; Shen, D.; Gao, S.; Tang, C.; Ma, G. Source Apportionment and Health Risk Assessment of Heavy Metals in Karst Water from Abandoned Mines in Zhangqiu, China. Water 2023, 15, 3440. [Google Scholar] [CrossRef]
- Gao, D.; Yan, Y.; Yao, R.; Shi, H.; Chen, Q. Spatial analysis and GIS mapping of regional hydrochemistry, groundwater quality, and probabilistic health risk in western Sichuan Basin, southwestern China. Environ. Earth Sci. 2023, 83, 41. [Google Scholar] [CrossRef]
- Cai, X.L.; Cao, J.M.; Zhu, J.S.; Cheng, X. System of Crust-Mantle Ductile Shear Zone in the Continental Lithosphere in China. Earth Sci. Front. 2008, 15, 36–54. [Google Scholar] [CrossRef]
- Elizabeth, J.; Mary, V.; Michelle, L. Effect of Fe(III) on 1,1,2,2-Tetrachloroethane Degradation and Vinyl Chloride Accumulation in Wetland Sediments of the Aberdeen Proving Ground. Bioremediat. J. 2004, 8, 31–45. [Google Scholar] [CrossRef]
- GB/T 14848-2017; Natural Resources and Territory Spatial Planning. Standard for Groundwater Quality. Natural Resources and Territory Spatial Planning: Beijing, China, 2014.
- Li, M.; Zhang, J.; Liang, N.; Lin, L.; Li, Q.; Wen, X. Comparisons of some common methods for water environmental quality assessment. Prog. Geogr. 2012, 31, 617–624. [Google Scholar] [CrossRef]
- Wang, W.; Ji, M.; Su, Y. Reviews of the progress in the research of water quality evaluation and the methods for water quality evaluation. Sci-Tech Inf. Dev. Econ. 2012, 22, 129–131. [Google Scholar]
- Wu, W.H.; Zou, H.; Zhu, G.; Liao, Y.; Pan, H.; Xiao, C.; Fan, J.; Li, L. Characteristics and health risk assessment of heavy metal pollution in groundwater of a mining area. J. Ecol. Rural Environ. 2018, 34, 1027–1033. [Google Scholar]
- USEPA. Risk Assessment Guidance for Superfund Volume I: Human Health Evaluation Muanual (Part E, Supplemental Guidance for Dermal Risk Assessment); USEPA: Washington, DC, USA, 2004.
- Duan, X.L. Research Methods of Exposure Parameters and Their Application in Environmental Health Risk Assessment; Science Press: Beijing, China, 2012. [Google Scholar]
- Liu, B.; Cui, X.; Wang, X.; Hu, Q. Source identification and health risk assessment of heavy metals in groundwater of Yongqing County, Hebei. J. Ecol. Rural. Environ. 2022, 39, 741–749. [Google Scholar] [CrossRef]
- Ma, C.; Zhou, J.; Zeng, Y.; Bai, F.; Yan, Z. Source analysis and health risk assessment of heavy metals in groundwater in the oasis belt of Ruoqiang County, Xinjiang. Acta Sci. Circumstantiae 2023, 43, 266–277. [Google Scholar] [CrossRef]
- Cao, Z.; Gou, J.; Qiu, X.; Zhou, Q.; Wan, Y.; Zhao, Z. Spatial and temporal distribution characteristics and health risk assessment of heavy metals in water of Ningxia section of the Yellow River. Environ. Monit. Manag. Technol. 2022, 34, 33–38. [Google Scholar] [CrossRef]
- An, W.; Sun, L.; Ma, L.; Zhang, S. Assessment of heavy metals and human health risk in surface soils in a legacy land of typical industrial agglomeration area. J. Nat. Sci. Hunan Norm. Univ. 2022, 45, 108–116. [Google Scholar]
- Rao, K.; Tang, T.; Zhang, X.; Wang, M.; Liu, J.; Wu, B.; Wang, P.; Ma, Y. Spatial-temporal dynamics, ecological risk assessment, source identification and interactions with internal nutrients release of heavy metals in surface sediments from a large Chinese shallow lake. Chemosphere 2021, 282, 131041. [Google Scholar] [CrossRef]
- Singaraja, C.; Chidambaram, S.; Srinivasamoorthy, K.; Anandhan, P.; Selvam, S. A study on assessment of credible sources of heavy metal pollution vulnerability in groundwater of thoothukudi districts, Tamilnadu, India. Water Qual. Expo. Health 2015, 7, 459–467. [Google Scholar] [CrossRef]
- Paatero, P.; Tapper, U. Positive matrix factorization: A non-negative factor model with optimal utilization of error estimates of data values. Environmetrics 1994, 5, 111–126. [Google Scholar]
- Wen, C.; Zhu, S.; Li, N.; Luo, X. Source apportionment and risk assessment of metal pollution in natural biofilms and surface water along the Lancang River, China. Sci. Total Environ. 2022, 843, 156977. [Google Scholar] [CrossRef]
- Wang, Z.; Han, R.; Muhammad, A.; Guan, D.; Zama, E.; Li, G. Correlative distribution of DOM and heavy metals in the soils of the Zhangxi watershed in Ningbo city, East of China. Environ. Pollut. 2022, 299, 118811. [Google Scholar]
- Belon, E.; Boisson, M.; Deportes, I.Z.; Eglin, T.K.; Feix, I.; Bispo, A.O.; Galsomies, L.; Leblond, S.; Guellier, C.R. An inventory of trace elements inputs to French agricultural soils. Sci. Total Environ. 2012, 439, 87–95. [Google Scholar] [CrossRef]
- Qu, M.; Wang, Y.; Huang, B.; Zhao, Y. Source apportionment of soil heavy metals using robust absolute principal component scores-robust geographically weighted regression (RAPCS-RGWR) receptor model. Sci. Total Environ. 2018, 626, 203–210. [Google Scholar] [CrossRef]
- Li, J.; Teng, Y.; Wu, J.; Jiang, J.; Huang, Y. Source Apportionment of Soil Heavy Metal in the Middle and Upper Reaches of Le’an River based on PMF Model and Geostatistics. Res. Environ. Sci. 2019, 32, 984–992. [Google Scholar] [CrossRef]
- Jiang, Y. Distribution Characteristics and Environmental Health Risk Assessment of Dissolved Trace Elements in River Flow under the Influence of Human Activities. Ph.D. Thesis, Guizhou University, Guiyang, China, 2021. [Google Scholar] [CrossRef]
- Ye, P.; Abdugheni, A.; Sun, X.; Halidan, A. E Source analysis and pollution assessment of soil heavy metals in the economic belt on the northern slope of Tianshan. China Environ. Sci. 2022, 42, 4704–4712. [Google Scholar] [CrossRef]
- Cai, L.; Ma, J.; Zhou, Y.; Huang, L.; Dou, L.; Zhang, C.; Fu, S. Multivariate Geostatistics and GIS-based Approach to Study the Spatial Distribution and Sources of Heavy Metals in Agricultural Soil in the Pearl River Delta, China. Environ. Sci. 2008, 29, 3496–3502. [Google Scholar] [CrossRef]
- Ma, J.; Shen, Z.; Zhang, P.; Liu, P.; Liu, J.; Sun, J.; Wang, L. Pollution characteristics and source apportionment of heavy metals in farmland soils around the gangue heap of coal mine based on APCS-MLR and PMF receptor model. Environ. Sci. 2023, 44, 2192–2203. [Google Scholar] [CrossRef]
- Zhao, D.; Jiang, C.; Zhao, Q.; Chen, X.; Li, C.; Zheng, L.; Chen, Y. Distribution characteristics and source apportionment of polycyclic aromatic hydrocarbons in groundwater of a coal mining area based on PMF and PCA-APCS-MLR model. Earth Environ. 2022, 50, 721–732. [Google Scholar] [CrossRef]
Disclaimer/Publisher’s Note: The statements, opinions and data contained in all publications are solely those of the individual author(s) and contributor(s) and not of MDPI and/or the editor(s). MDPI and/or the editor(s) disclaim responsibility for any injury to people or property resulting from any ideas, methods, instructions or products referred to in the content. |
© 2024 by the authors. Licensee MDPI, Basel, Switzerland. This article is an open access article distributed under the terms and conditions of the Creative Commons Attribution (CC BY) license (https://creativecommons.org/licenses/by/4.0/).