Article

Climate Seasonality of Tropical Evergreen Forest Region

1
Institute of International Rivers and Eco-Security, Yunnan University, Kunming 650504, China
2
School of Ecology and Environment, Hainan University, Haikou 570228, China
3
School of Ecology and Environmental Science, Yunnan University, Kunming 650504, China
*
Author to whom correspondence should be addressed.
Water 2024, 16(5), 749; https://doi.org/10.3390/w16050749
Submission received: 3 February 2024 / Revised: 21 February 2024 / Accepted: 27 February 2024 / Published: 1 March 2024

Abstract

:
Climatic seasonality has lacked research attention in terms of global tropical forests, where it impacts vegetation productivity, biodiversity, and hydrological cycles. This study employs two methods—climatological anomalous accumulation (CAA) and potential evapotranspiration (PET) threshold—to detect the climatic seasonality of global tropical forests, including the onset and duration of wet seasons. Spatial clustering based on the length of the wet season is used to delineate smaller regions within the tropical forest areas to observe their precipitation patterns. The results show that these methods effectively reveal more homogeneous regions and their respective rainfall patterns. In particular, we found that the wet season in Amazon forests detected by the CAA method is more uniform in space than the PET threshold, but the global tropical forest regions divided by the CAA method on average contain more complex climates than the PET threshold. Moreover, the year-round abundant precipitation in Southeast Asia, which is strongly influenced by monsoons, presents challenges for wet season detection. Overall, this work provides an objective perspective for understanding the climatic seasonality changes in tropical forests and lays a scientific foundation for future forest management and the development of adaptation strategies to global climate change.

1. Introduction

Tropical forests cover approximately 7% to 10% of the Earth’s land area and play a crucial role in regulating global climate while also serving as vital reservoirs for biodiversity. These ecosystems are instrumental in absorbing atmospheric carbon dioxide, maintaining hydrological cycles, and influencing local to global climate patterns [1]. The variation in seasonal rainfall significantly impacts forest net primary productivity, plant species’ growth cycles, and overall ecosystem stability [2]. Moreover, the abundant precipitation in tropical forests profoundly affects ecological processes such as plant community structure, biodiversity, and forest productivity [3], and can even provide water resources for many surrounding agricultural areas [4]. An unprecedented drought swept through the Amazon rainforest in 2005. The point of difference for this particular drought was that as the dry season progressed into the middle phase, remote sensing images showed an increase in vegetation greenness (“green-up”) in the region [5], indicating that vegetation was undergoing intense photosynthesis during the dry season. This phenomenon has been confirmed by the seasonal variation in solar-induced fluorescence (SIF) [6]. It is known that photosynthesis in plants requires water, but when precipitation exceeds a certain threshold, water is no longer a limiting factor for photosynthesis [7]. Therefore, even during the dry season, the growth of new leaves and the shedding of aged ones allows canopy leaves to achieve higher photosynthetic efficiency [8]. However, the question remains: why do plants engage in what seems like the “risky” behavior of performing photosynthesis during the dry season of water deficit, and does it relate to their own seasonal biological rhythms? A lot of research is needed to answer this question clearly, but it is certain that it is basic and necessary to have an objective and comprehensive understanding of the climatic seasonality of tropical forests.
Many studies and observations indicate that the wet season in the Amazon rainforest typically begins in December, characterized by high precipitation levels [9]. The African region, influenced by the intertropical convergence zone (ITCZ) [10], experiences two wet season peaks separated by a relatively dry period [11]. This biannual wet season pattern has been confirmed to be widespread in East Africa, also occurring in Ethiopia, Kenya, and Uganda [12]. The tropical rainforest areas in Southeast Asia are strongly influenced by tropical monsoons, with abundant precipitation and almost the entire year being in the wet season. However, we need to know more details about seasonal rainfall events in tropical forests, such as the onset and end times. Thus, precise and long-term rainfall data and objective definitions of the wet season are required. Currently, various methods are employed to detect the wet season, such as setting subjective thresholds for the onset of the wet season defined as the cumulative date representing 7–8% of the annual total rainfall [13], or introducing potential evapotranspiration (PET) as a parameter to judge the onset of the wet season [14,15], as PET reflects the vegetation’s demand for water. This method is often used in agriculture. On this basis, Cook and Vizy [16] additionally considered the factor of water stored in the soil when measuring for the wet season. In addition, the method of combining relative entropy and harmonic analysis to distinguish the wet and dry seasons [17] can be well applied on a global scale. The method of climatological anomalous accumulation (CAA) [18] precisely locates the onset and end of the wet season without relying on subjectively introduced reference quantities, yielding purely climatological results.
In this study, we selected the CAA and PET threshold methods to objectively determine the distribution of the wet season in global tropical forests (see Methods for details). Through different methods, we aim to categorize global tropical forest regions into homogenous areas based on the spatial clustering of wet season lengths to observe their precipitation changes. By conducting detailed research on the monthly rainfall and its climatic seasonality changes in tropical forests globally, we hope to better understand the seasonal variations in tropical forest vegetation in the future. Additionally, such research can aid in addressing global climate change, and adaptive management strategies targeting changes in wet season patterns can help reduce forest degradation and maintain their contribution to mitigating climate change.

2. Materials and Methods

In our study, we adopted the International Geosphere-Biosphere Program (IGBP) land cover classification scheme, which defines 17 land cover types. We categorized tropical regions with evergreen broad-leaf forests (dominated by evergreen broad-leaves and palms with a canopy height > 2 m and tree cover > 60%) as our research area for tropical forests. The land cover data was derived from the 2020 MODIS MCD12Q1 Version 6 product. This product was obtained through supervised classification of MODIS Terra and Aqua reflectance data, with a spatial resolution of 500 m and six different classification schemes, including IGBP.
The precipitation dataset was sourced from the Tropical Rainfall Measuring Mission (TRMM) satellite, a collaborative effort between the National Aeronautics and Space Administration (NASA) and the Japan Aerospace Exploration Agency (JAXA) [19]. We utilized the TRMM 3b42 version 7, which has a spatial resolution of 0.25 degrees and a temporal resolution of three days, covering the range from 50° N to 50° S since 1998. Our analysis utilized data from 1999 to 2019.
We did not calculate PET ourselves; hence, to ensure data accuracy, we opted to use two PET datasets, the first sourced from the Climatic Research Unit gridded Time Series (CRU TS) version 4, and the other published by Singer et al. [20] in Scientific Data. The CRU TS, produced by the National Centre for Atmospheric Science (NCAS) in the UK, is a global dataset covering land surfaces at a 0.5° resolution from 1901 to 2020, based on angular-distance weighting (ADW) interpolation of a vast network of meteorological station observations [21], and its PET dataset is calculated using FAO’s Penman-Monteith formula. Singer’s PET utilizes multiple reanalysis data from ERA5-Land (the European Centre for Medium-Range Weather Forecasts fifth generation of land surface reanalysis) and calculates PET at an hourly 0.1° resolution also using the Penman-Monteith formula [20]. These datasets are available on a public data server at https://doi.org/10.5523/bris.qb8ujazzda0s2aykkv0oq0ctp (accessed on 8 February 2024). Both PET datasets cover the years 1999 to 2019, and all data including land cover and precipitation were interpolated to a 0.5° spatial resolution for subsequent analysis.
In this study, we employed two distinct methods of defining the wet season to objectively investigate the spatial distribution of wet season lengths in tropical forests (Figure 1). The CAA method is determined by calculating the daily anomaly, i.e., the daily precipitation subtracted by the annual average daily precipitation [18], and accumulating these anomalies over time to generate a cumulative curve. The Julian day, corresponding to the curve’s minimum value, marks the onset of the wet season because it signifies the day when climatological daily precipitation exceeds the annual average [22]; conversely, the maximum value’s corresponding Julian day indicates the end of the wet season. Harmonic analysis was used to determine the number of wet seasons experienced annually, defining areas in low-latitude Africa where the ratio of the second harmonic to the first harmonic exceeds one as having two wet seasons per year [22]. For areas experiencing more than two wet seasons, only the lengths of the longest two seasons were summed to calculate the final wet season length [23]. The PET threshold method, widely applied in studies on seasonal vegetation changes in tropical forests [6,7], identifies the onset of the wet season as when monthly precipitation exceeds the PET for two consecutive months, and conversely, its end when monthly precipitation falls below the PET. For regions with biannual wet seasons, if there are two non-consecutive periods where precipitation exceeds PET, the durations of these periods are summed to determine the total length of the wet season.
To conduct a more detailed study of the climatic characteristics of tropical forests, we have divided the global tropical forest region into more homogeneous areas based on the spatial clustering of wet season lengths. This approach serves a dual purpose: on one hand, it reduces the climatic variations brought about by geographical factors; on the other hand, it allows for an indirect evaluation of the wet season detection method we have employed. We evaluate the homogeneity of the divided regions by calculating the mean and standard deviation of the climate data of all grid points in each region.

3. Results

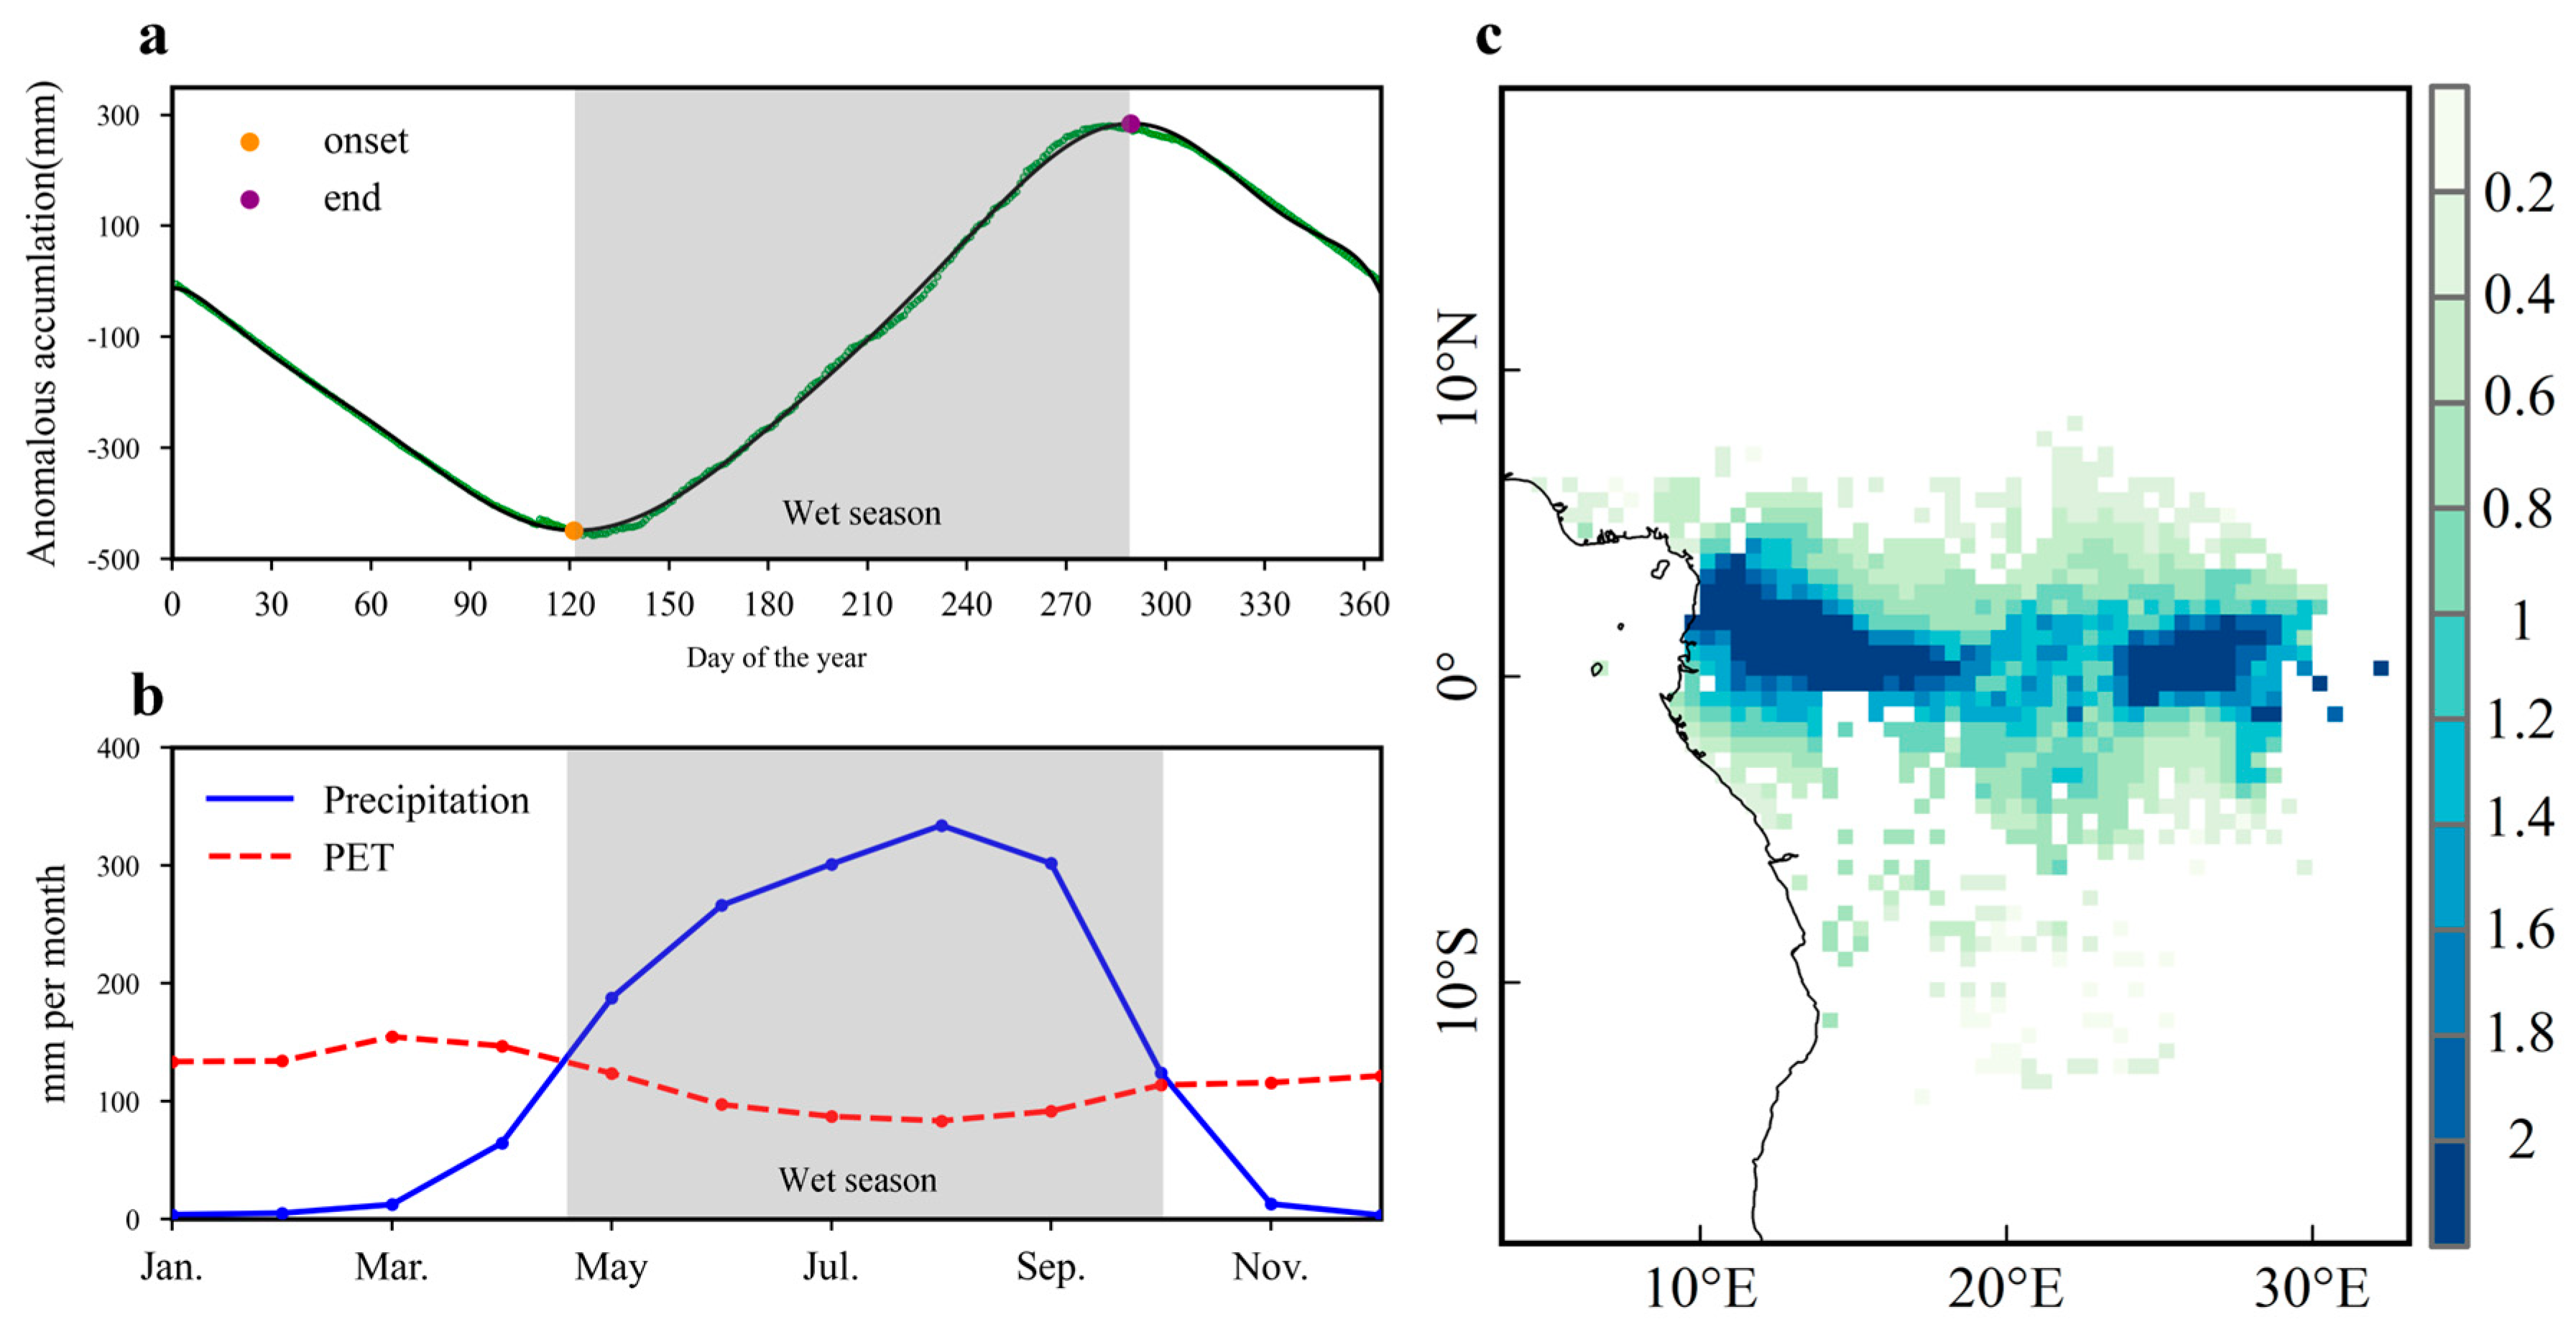
3.1. The Global Tropical Forest Wet Season

The wet season lengths detected through the PET threshold method reveal the complex spatial distribution of rainfall in the Amazon forest (Figure 2), where the central region experiences nearly year-round wet seasons. In contrast, the eastern and southern regions see a gradual reduction in the length of the wet season to 6–8 months, with some areas of longer wet seasons embedded within larger areas of shorter wet seasons (e.g., the Guiana Highlands in the Northern Hemisphere and regions near the Andes in the Southern Hemisphere).
Such uneven distributions indicate significant variability in precipitation and evaporation within these areas. Conversely, the African Congo tropical forest exhibits better spatial continuity in its wet season (Figure 3a), with long wet seasons (>9 months) in the central and eastern parts of the forest, whereas the northern region experiences relatively shorter wet seasons (6–8 months). In Southeast Asian tropical forests (Figure 3b), the distribution of wet season lengths is simpler; apart from the Indochinese peninsula, almost all other regions have year-round wet seasons, correlating with their abundant annual precipitation.
On the other hand, the wet season lengths identified using the CAA method are shorter than PET threshold, but display a more continuous spatial distribution. The average wet season length in the Amazon forest ranges from 5 to 8 months (Figure 4), with shorter wet seasons in the Guiana Highlands and longer ones in the Southern Hemisphere compared to the Northern Hemisphere, without the occurrence of small areas with long wet seasons. In the Congo tropical forest (Figure 5a), wet seasons present a spatial pattern of shorter durations in the center regions and middling and longer durations around the periphery, with concentrated wet seasons of 3–5 months in the heart of the Congo Basin, surrounded by wet seasons lasting 7–9 months. However, in Southeast Asian tropical forests (Figure 5b), the wet season lengths significantly differ from those detected by the PET threshold, averaging only 6–8 months with complex spatial distribution. The northern coastal regions of Sumatra and the Malay Peninsula experience 3–5 month wet seasons, while the southern part of Sumatra has 7–9 month wet seasons. Areas above 3° N in Borneo exhibit uneven distributions of 9–10 month predicted durations, whereas regions below 3° N have more consistent 7–8 month wet seasons, with New Guinea displaying uneven distributions of wet season lengths across the island.

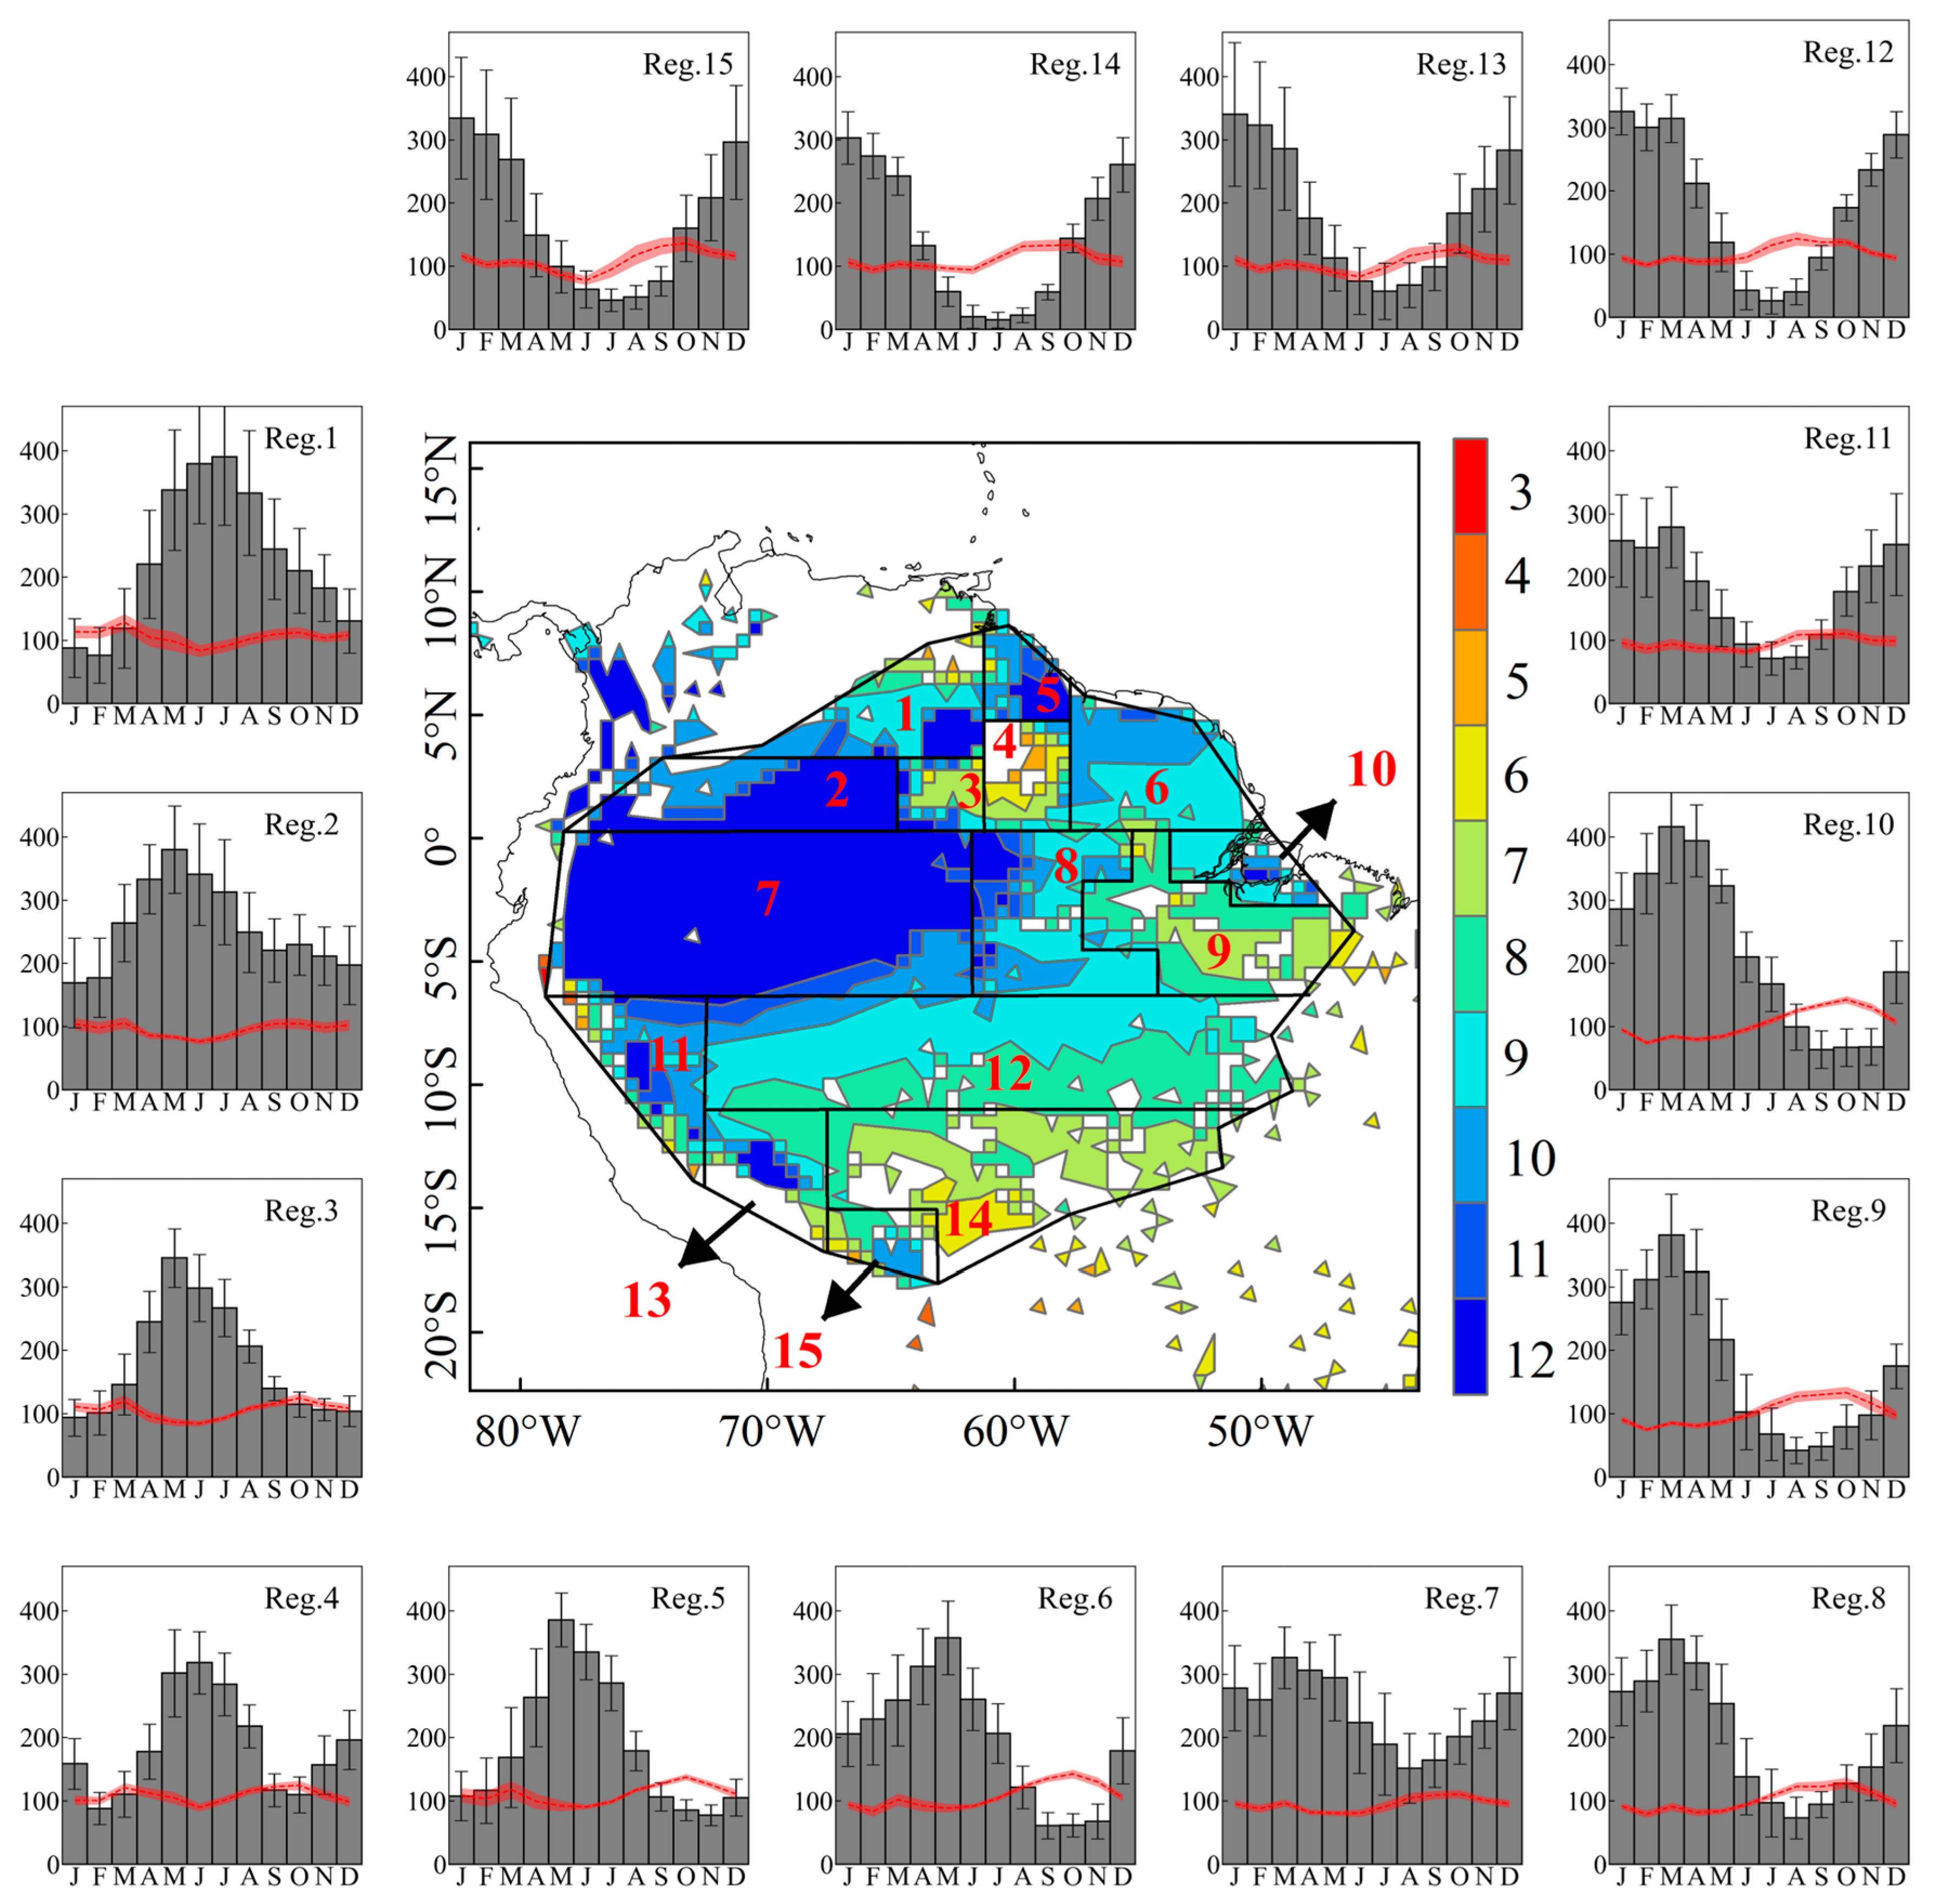
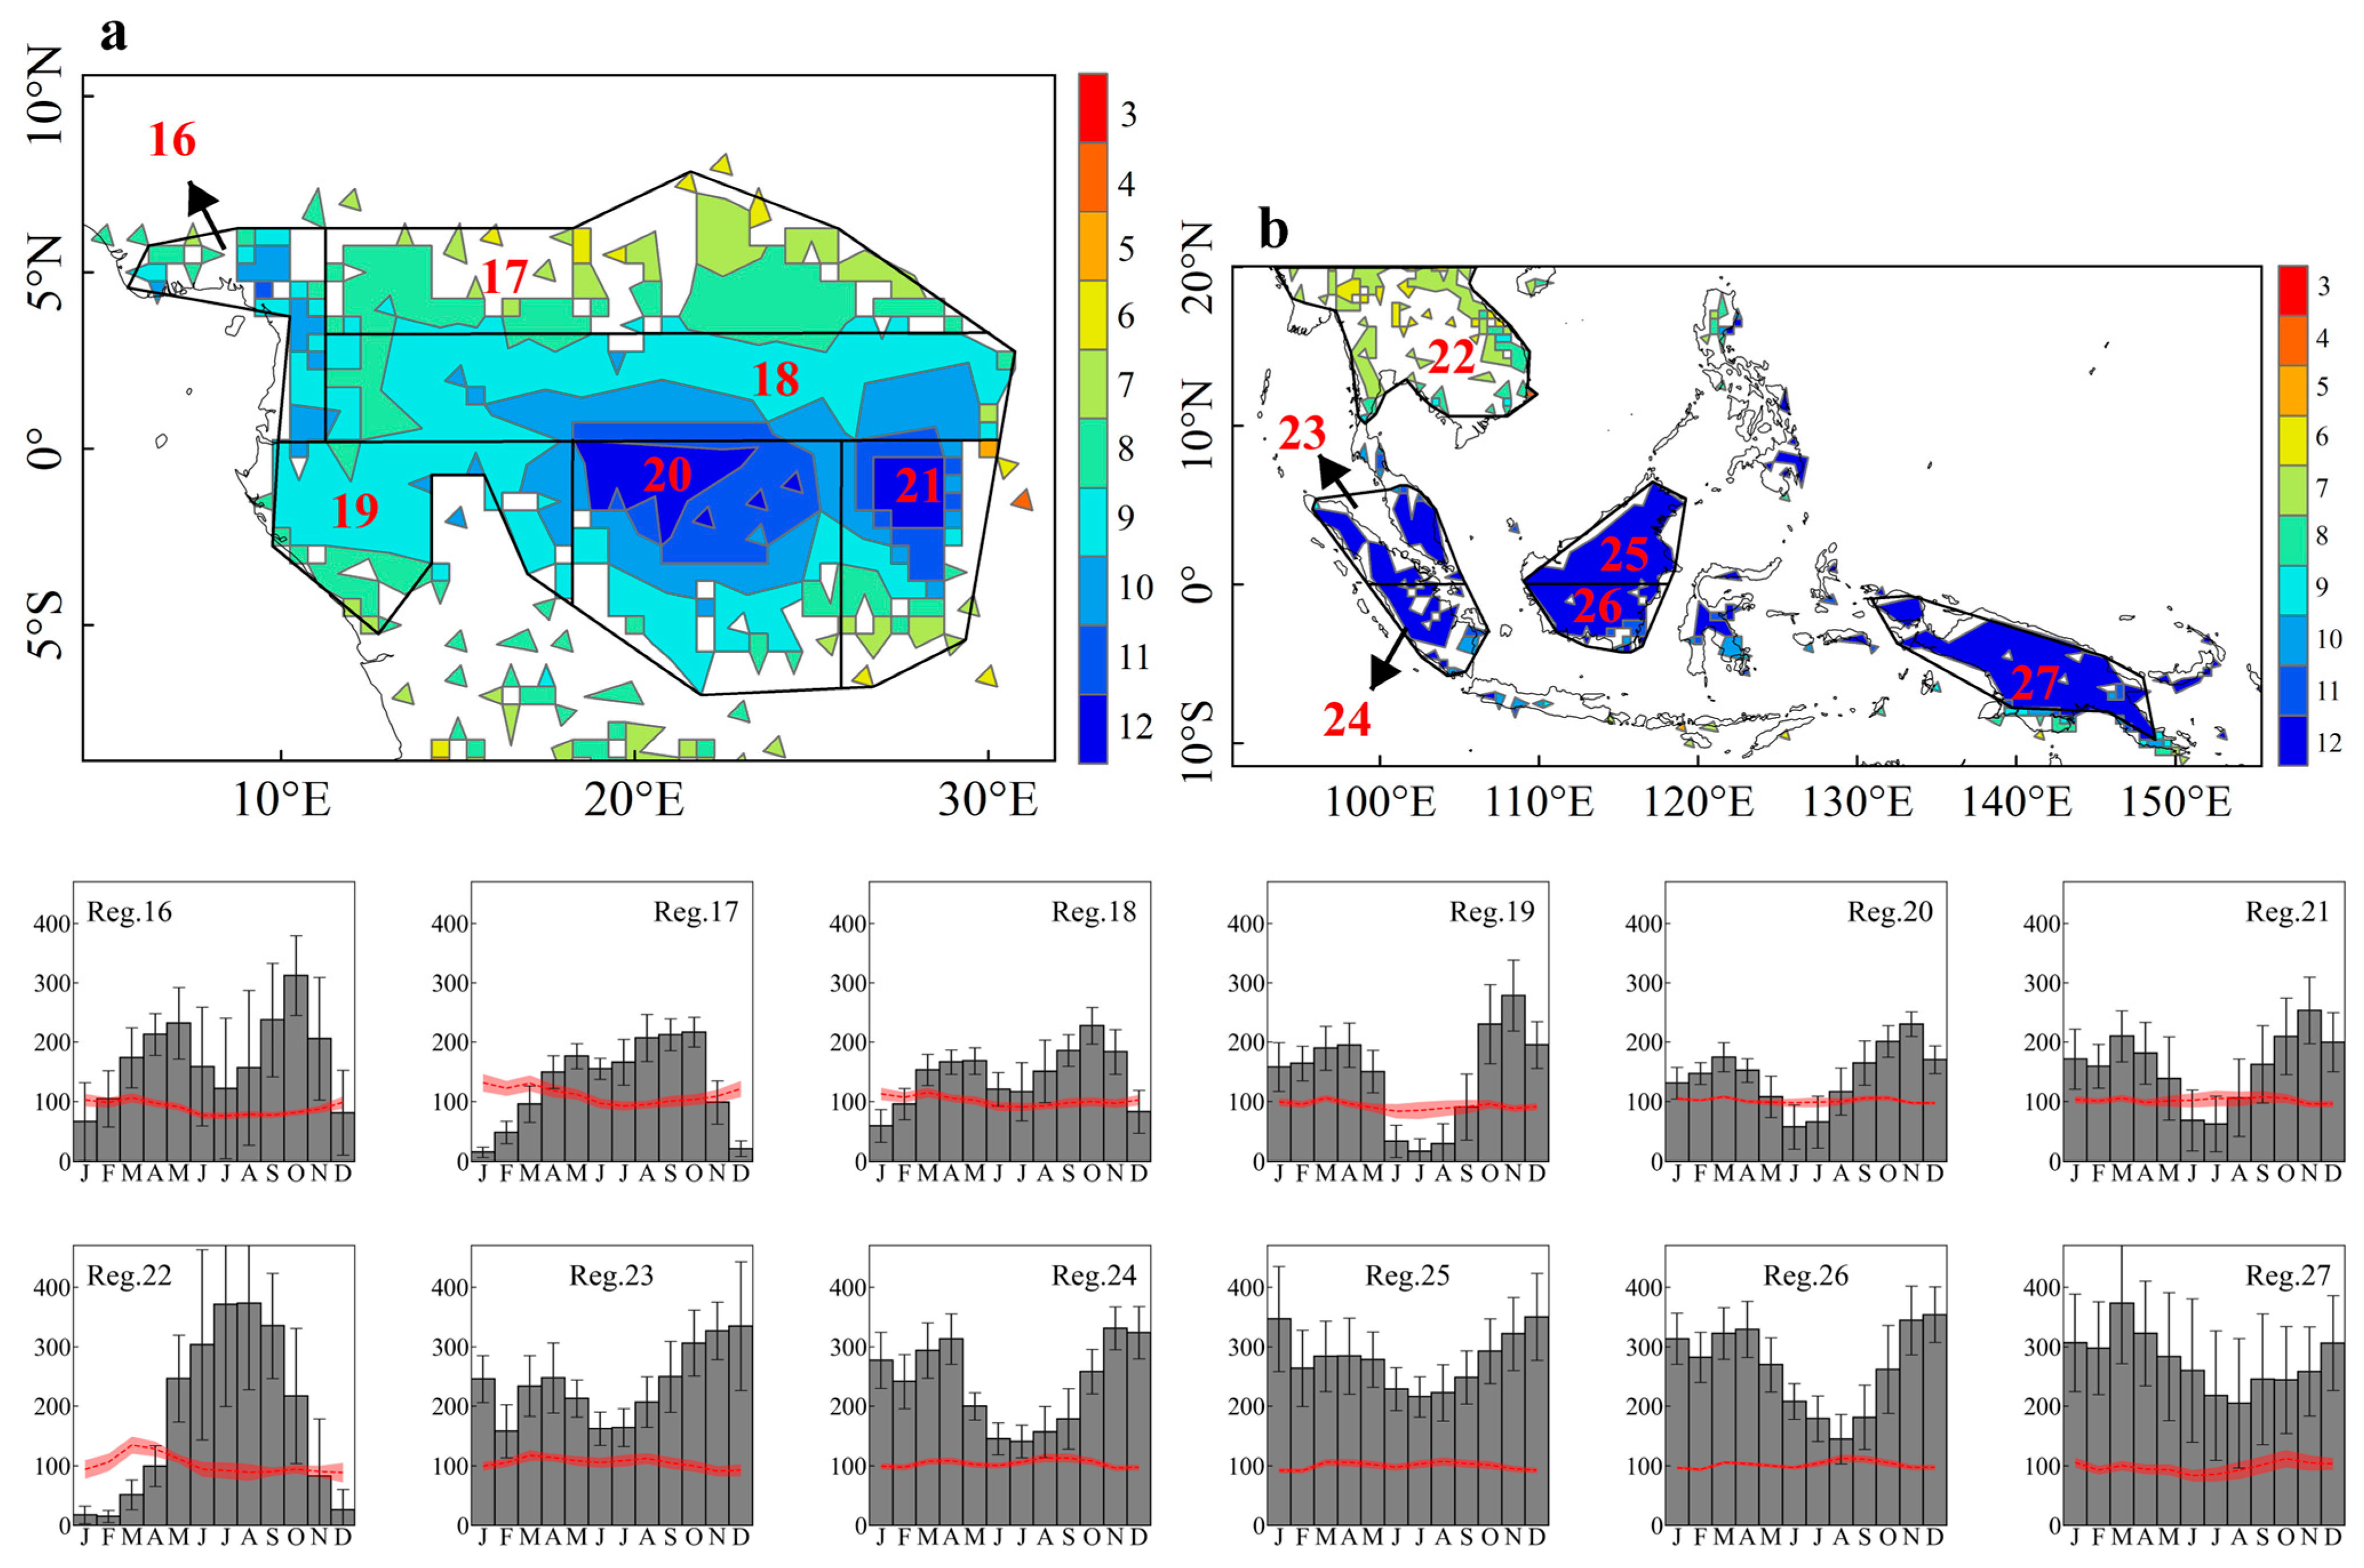
3.2. Regional Division of the Global Tropical Forests

Based on the spatial clustering of wet season lengths, the global distribution of the three major tropical forests is divided into several regions (Figure 2, Figure 3, Figure 4 and Figure 5). In delineating these regions, we first ensured the spatial continuity of the designated areas, excluding more dispersed tropical forests such as those in the southwestern Amazon, southern Congo River Basin, Philippine Islands, and Sulawesi Island.
Some designated regions contain multiple different lengths of wet season because we also wanted to observe how these mixed-wet-season areas seasonally behave, with all regions’ spatial uniformity subsequently assessed using the standard deviation of precipitation. Furthermore, considering the different environmental influences on the Northern and Southern Hemispheres, such as solar radiation, atmospheric circulation, and ocean current systems, we deliberately separated the hemispheres along the equator (although this is not a priority condition) in order to better observe the climatic seasonality across different geographic locations. In regions divided according to the PET threshold method, the Amazon tropical forest mainly exhibits a unimodal rainfall trend, with the monsoon center (Region 7 in Figure 2) experiencing almost year-round wet seasons and abundant precipitation without distinct rainfall peaks. Wet seasons in the Northern Hemisphere primarily occur from May to July, shifting later as latitude moves southward. In Reg. 11–15 (Figure 2), rain peaks are always clear, with wet seasons mainly concentrated from December to March of the following year, and dry seasons from May to September. Broadly speaking, wet and dry seasons in the Northern and Southern Hemispheres exhibit opposite patterns, and we can observe poor spatial uniformity in Regions 1, 2, 13, and 15 (Figure 2) through precipitation standard deviation.
The Congo tropical forest’s northern latitudes (Regions 16–18 in Figure 3) lack distinct rainfall peaks, with wet seasons concentrated from April to October. Region 16’s climate may be affected by topography, such as the Cameroon Volcanoes, Mount Fogo, and the Adamawa Mountains, leading to uneven climate distribution and dispersed tropical forests. Region 17 is drier than other regions but displays more uniform climate characteristics. Southern latitudes show a significant bimodal rainfall trend, characterized by two different rainfall peaks in April and October, separated by a relatively dry period, or even almost no precipitation (Region 19 in Figure 3).
Unlike the Amazon, the Southeast Asian tropical forest (excluding Region 22 in Figure 3) presents a simpler pattern, with inconspicuous monthly rainfall fluctuations. Warm currents from the Indian and Pacific Oceans bring substantial moisture to these regions, promoting rainfall without distinct peaks. However, we still find relatively dry periods from June to August, which also can be captured in the CAA curve. The large standard deviation in Region 27 (Figure 3) may result from spatial heterogeneity across 20° of longitude and the impact of strong monsoon climates. Region 22 experiences clear unimodal rainfall, with wet seasons concentrated from April to October. This region’s tropical forest continuity is low, and the large rainfall standard deviation indicates a relatively complex climate.
The regions delineated by the CAA method indicate that divisions within the Amazon area are larger compared to those demarcated by the PET threshold. In this classification, small areas with long wet seasons detected by the PET threshold (Regions 1, 11, 13, and 15 in Figure 2) are encompassed within larger areas (Regions C and H in Figure 4). Despite having similar lengths of wet seasons, precipitation variability is evident through standard deviation in these areas. The distribution across the Northern and Southern Hemispheres still reflects similar precipitation peaks as those identified by the PET threshold. Moreover, based on the standard deviation bands from the CAA curve, the Southern Hemisphere appears to exhibit better uniformity than the Northern Hemisphere since CAA solely calculates daily precipitation against climatic averages; its standard deviation can similarly signify variations in precipitation.
Figure 5a shows that the Congo tropical forest is divided at the equator into six regions for both hemispheres, with the spatial uniformity of areas defined by the CAA method showing considerable similarity to those identified by the PET threshold. Except for region M, which lacks distinct bimodal precipitation characteristics (similarly indistinct in Region 17 according to the PET threshold), the other five divisions display clear bimodal precipitation characteristics. It is observed that Region L (encompassing Region 16 from the PET threshold) also has a large standard deviation, whereas Region P, with relatively shorter wet seasons, exhibits more homogeneity.
The division of Southeast Asian tropical forests (Figure 5b) largely aligns with the PET threshold, maintaining the Indochinese peninsula as a whole region (Region R). The distinction lies in the similar wet season lengths for the northern coastal areas of Sumatra and the Malay Peninsula (Region S) as determined by the CAA method, suggesting an increased spatial heterogeneity. The standard deviation in Region S slightly exceeds that in Region 23 (Figure 3) per the PET threshold, with Borneo being divided along 3° N into Regions U and V. New Guinea’s entire island exhibits uneven distributions of wet season lengths, which are divided into three regions longitudinally to reduce the impact of excessive partitioning on its homogeneity. Indeed, compared to Regions S, U, and V, and PET threshold Regions 23, 25, and 26 (Figure 3), the wet season lengths detected in precipitation-rich areas by CAA do not contribute to improved homogeneity in divided regions. Moreover, Regions W, X, and Y demonstrate that the complex climate of Southeast Asian tropical forests is influenced not only by the size of divided regions but also by monsoons, extreme weather conditions, and other factors.

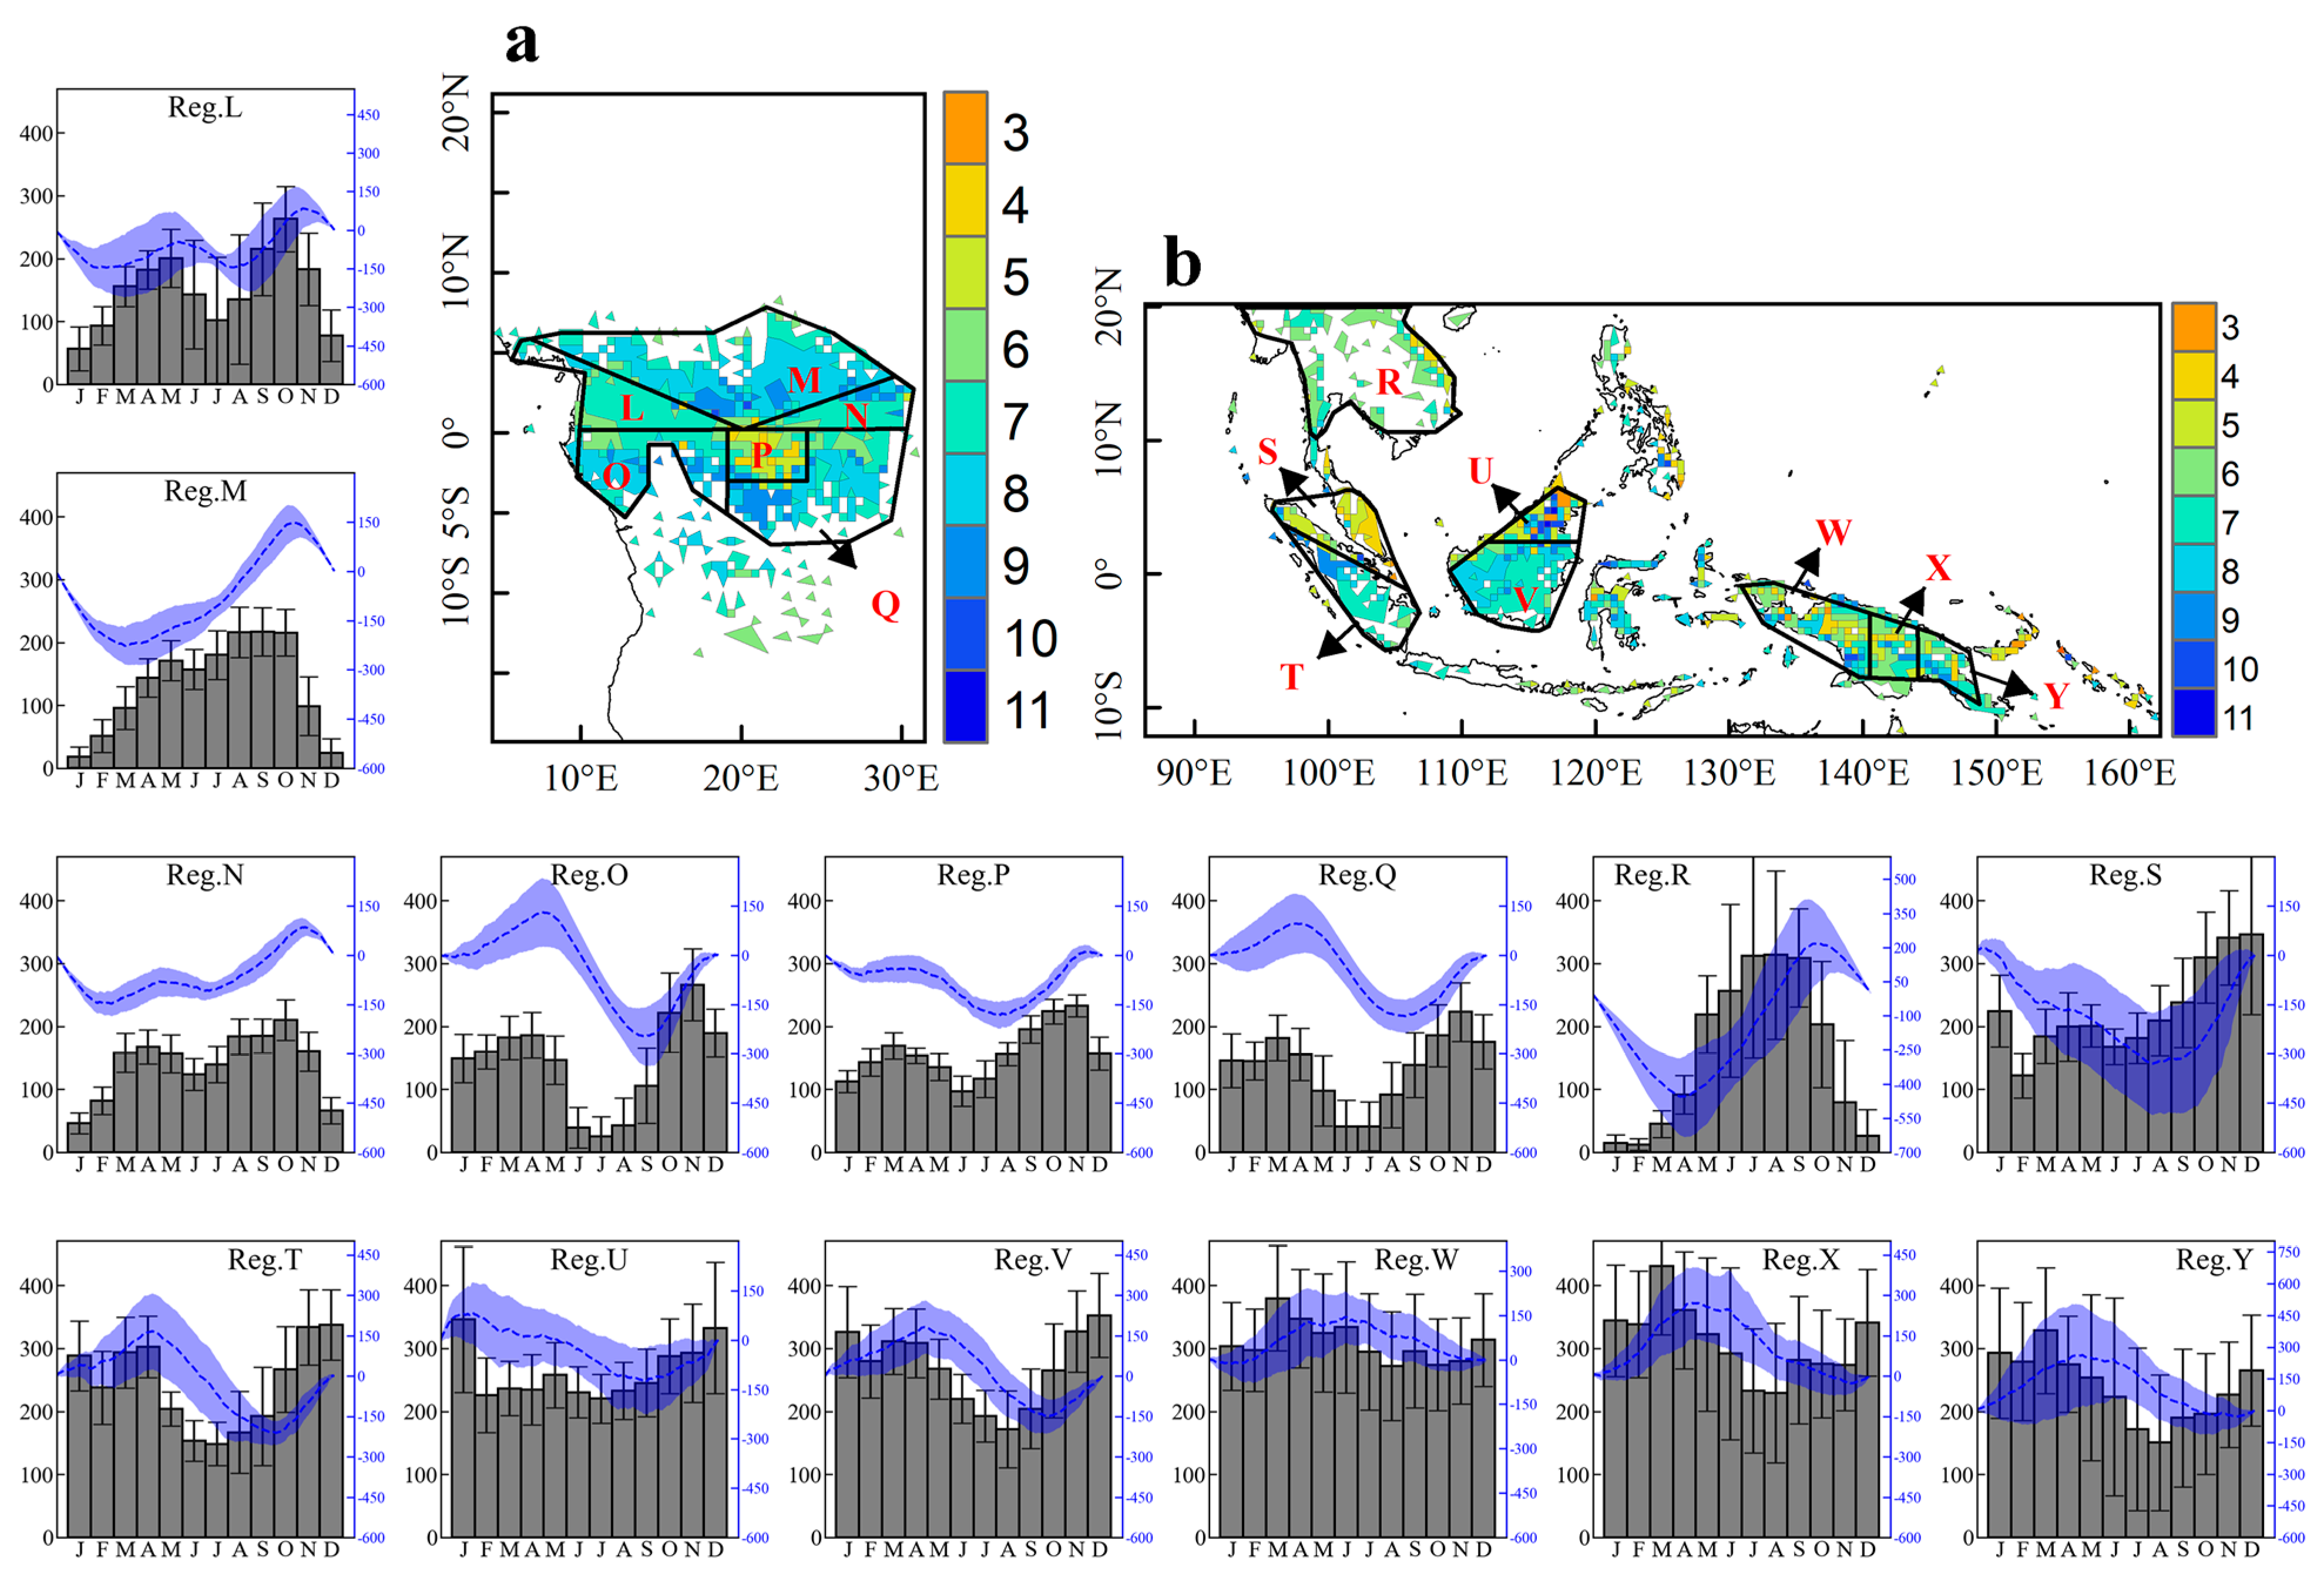
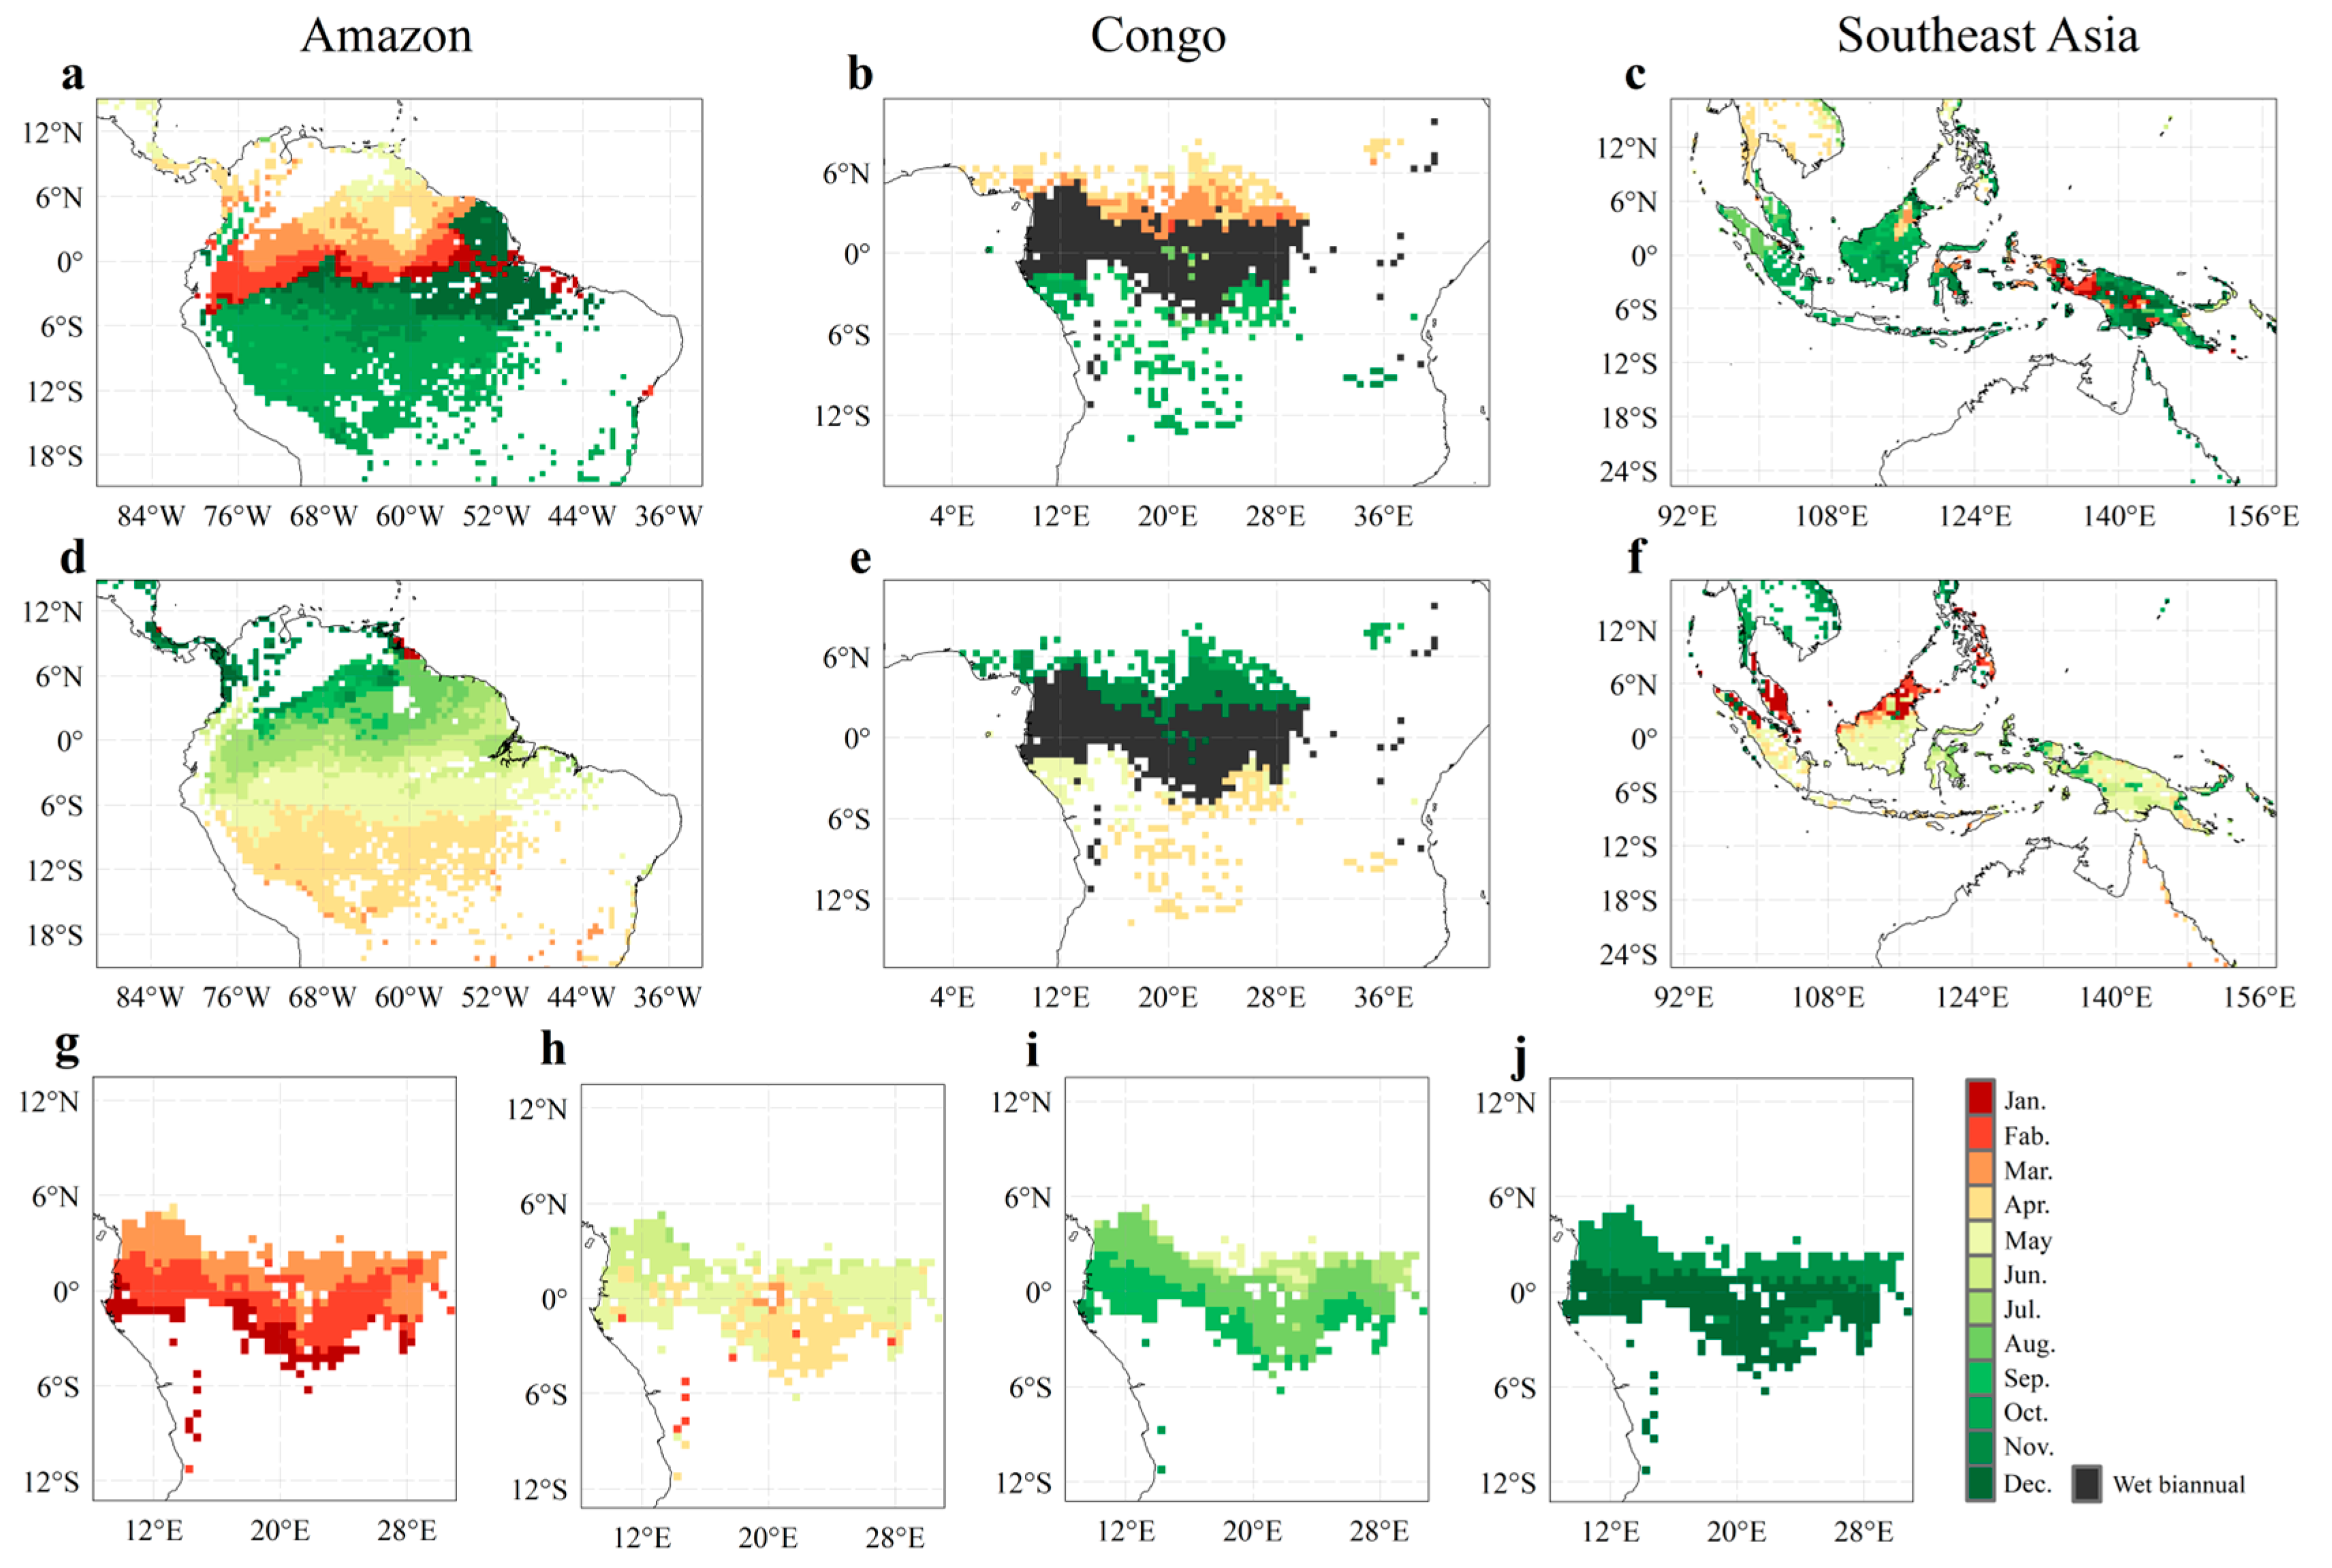
3.3. The Onset and End of the Wet Season in Global Tropical Forests

Figure 6 and Figure 7 displays the onset and end times of the wet seasons, determined using two different methods. Some areas of the Congo tropical forest are obscured (black areas) due to biannual wet seasons; these areas will sequentially show the onset and end times of the first and second wet seasons, while blue-shaded areas represent year-round wet seasons without distinct onset and end times. Overall, the wet season onset and end times deduced by both detection methods do not significantly differ within the same regions, despite the PET identifying a large part of the area as having year-round wet seasons. Both results depict a division trend along the equator between the Northern and Southern Hemispheres. In the Northern Hemisphere of the Amazon forest, the average wet season onsets from January to April and ends from August to October, while in the Southern Hemisphere, it begins from September to December and ends from March to June. In fact, areas with two wet seasons per year, as identified by the PET threshold, are fewer than those detected using the CAA method (harmonic analysis) in the Congo tropical forest, where climate characteristics are easily influenced by monsoons and extreme weather. Additionally, it was found that the onset times of the wet seasons in the Amazon tropical forest spread from the equator towards the poles; for instance, the wet season onsets in January in the equatorial regions of the Northern Hemisphere, but is delayed until April-May in the Guiana Highlands. A similar trend exists in the Congo tropical forest, albeit less pronounced.

4. Discussion

The Amazon experiences seasonal climactic variations, with defined dry and wet seasons; monthly precipitation during the wet season can be several times that seen in the dry season. Moreover, the duration and amount of rainfall within the Amazon forest is not uniform; the central regions receive more than the eastern and southern parts. While not as pronounced as the Asian monsoons, the wet season in the Amazon is primarily influenced by marine systems and atmospheric circulation [24]. Although most of the Amazon Basin is relatively flat, its western edge abuts the Andes Mountains. The mountains block or channel the moist air brought by the South American tropical monsoon [25], affecting precipitation during the wet season, while evapotranspiration-precipitation recycling within the forest affects local microclimates and exacerbates the Amazon’s climatic heterogeneity.
We compared our results with similar studies. Specifically, we compared our average onset and end dates of the wet season determined by the CAA method with Libemann [22], who studied the seasonality of the African continent’s climate. Concerning the Congo rainforest, there was no significant difference in the onset and end of the wet season. We also compared our results with those of Dunning [23] for the Congo rainforest region, where harmonic analysis was used to divide Africa into humid, biannual, and annual zones in the discussion of biannual wet seasons within a year. It is certain that this method effectively captures regions with biannual wet seasons. The authors also compared different precipitation datasets, which is valid because the only parameter used in the CAA method is the daily precipitation at that grid point; it captures the wet season through changes in precipitation over time, therefore being specific to each grid point and dataset. However, we found that in the PET threshold method, the length of the wet season we detected on average was longer than that of Guan [7], especially in the Congo forest, where his result showed an east-west gradient from drier in the east to wetter in the west, whereas ours showed wetter conditions in the central and eastern parts, and drier conditions in the north. Comparisons using the PET threshold method are challenging because of the different precipitation (TRMM versions) and PET datasets used, and we are also unsure how extreme weather influences are affecting our study’s timescale.
However, in the Southeast Asian forests, the two methods revealed strikingly different lengths of the wet season. The rainfall patterns in Southeast Asia are actually quite complex and influenced by multiple factors, including monsoons, oceanic conditions, and atmospheric circulations near the equator. These climatic factors bring abundant precipitation to the forests of Southeast Asia. However, Indonesia consists of thousands of islands, and places like the Malay Peninsula, Sumatra, and Kalimantan have mountain ranges and hills, comprising complex terrain that causes most areas to still exhibit significant fluctuations in precipitation, leading to differences in the wet seasons detected by the two methods.

5. Conclusions

This study, based on gridded climate data, reveals precipitation and seasonal climatic patterns in global tropical forests. Previously, such information was scattered across various regional studies that employed different data, methodologies, and definitions. The aim of this work is to explore an objective seasonality by using a straightforward spatial clustering approach to delineate relatively homogeneous regions, thereby clearly identifying unimodal or bimodal climatic patterns and specific precipitation amounts. These results affirm that such division methods can yield relatively uniform climatic regions, despite the complex spatial distribution of climates in some areas (e.g., western Nigeria and Cameroon in Africa, and the Indochinese peninsula in Southeast Asia). This also indicates that future studies on seasonality should consider additional influencing factors such as topography and extreme climates. Overall, the transition between wet and dry seasons is gradual in space and alternates over time. A clear transition between unimodal and bimodal rainfall patterns exists between the hemispheres in the Congo tropical forest, which simplistic approach can successfully detect.
Our analysis of regions delineated by two methods showed that the homogeneity of regions defined by the CAA method was not as robust as that of the PET threshold. However, the primary goal of our research was not to evaluate the superiority of one method over another since the wet seasons detected by both the CAA method and the PET threshold are significantly related to our subject matter. The CAA method focuses more on climatological changes, detecting wet seasons solely based on variations in precipitation without considering actual precipitation amounts; hence, it is sensitive to precipitation anomalies. For example, the Southeast Asian tropical forests experience abundant rainfall throughout the year, but this method still identifies significant maxima and minima on cumulative curves, leading to relatively shorter detected wet seasons. Meanwhile, the PET threshold method considers regional evapotranspiration as a necessary condition for defining wet seasons, including the water requirement for plant transpiration. Indeed, the difference obtained by subtracting PET from precipitation can indicate the vegetation water deficit or surplus in a region, making it highly applicable in agricultural and forestry research. Furthermore, discontinuities in the spatial distribution of wet seasons in the Amazon, as detected by the PET threshold method, remind us of the severe impact of human activities, such as deforestation, on the vegetation and climate of tropical forests [26].

Author Contributions

Z.-H.T. and Z.-Y.S. provided the main research ideas for the paper and the review of the paper, and L.-X.L. conducted data collection and processing and paper writing. All authors have read and agreed to the published version of the manuscript.

Funding

This study was supported by the National Natural Science Foundation of China (41771099, 41861023, 42101101), and Yunnan Provincial Department of Science and Technology and Yunnan University “Double World-Class” Joint Construction Fund Project in 2023 (202301BF070001-015).

Data Availability Statement

Data is contained within the article.

Conflicts of Interest

The authors declare no conflicts of interest.

References

  1. Bonan, G.B. Forests and Climate Change: Forcings, Feedbacks, and the Climate Benefits of Forests. Science 2008, 320, 1444–1449. [Google Scholar] [CrossRef]
  2. Malhi, Y.; Baldocchi, D.D.; Jarvis, P.G. The Carbon Balance of Tropical, Temperate and Boreal Forests. Plant Cell Environ. 1999, 22, 715–740. [Google Scholar] [CrossRef]
  3. Poveda, G.; Waylen, P.R.; Pulwarty, R.S. Annual and Inter-Annual Variability of the Present Climate in Northern South America and Southern Mesoamerica. Palaeogeogr. Palaeoclimatol. Palaeoecol. 2006, 234, 3–27. [Google Scholar] [CrossRef]
  4. Nyasulu, M.K.; Fetzer, I.; Wang-Erlandsson, L.; Stenzel, F.; Gerten, D.; Rockström, J.; Falkenmark, M. African Rainforest Moisture Contribution to Continental Agricultural Water Consumption. Agric. For. Meteorol. 2024, 346, 109867. [Google Scholar] [CrossRef]
  5. Saleska, S.R.; Didan, K.; Huete, A.R.; Rocha, H.R.D. Amazon Forests Green-Up during 2005 Drought. Science 2007, 318, 612. [Google Scholar] [CrossRef]
  6. Doughty, R.; Köhler, P.; Frankenberg, C.; Magney, T.S.; Xiao, X.; Qin, Y.; Wu, X.; Moore, B. TROPOMI Reveals Dry-Season Increase of Solar-Induced Chlorophyll Fluorescence in the Amazon Forest. Proc. Natl. Acad. Sci. USA 2019, 116, 22393–22398. [Google Scholar] [CrossRef]
  7. Guan, K.; Pan, M.; Li, H.; Wolf, A.; Wu, J.; Medvigy, D.; Caylor, K.K.; Sheffield, J.; Wood, E.F.; Malhi, Y.; et al. Photosynthetic Seasonality of Global Tropical Forests Constrained by Hydroclimate. Nat. Geosci. 2015, 8, 284–289. [Google Scholar] [CrossRef]
  8. Wu, J.; Albert, L.P.; Lopes, A.P.; Restrepo-Coupe, N.; Hayek, M.; Wiedemann, K.T.; Guan, K.; Stark, S.C.; Christoffersen, B.; Prohaska, N.; et al. Leaf Development and Demography Explain Photosynthetic Seasonality in Amazon Evergreen Forests. Science 2016, 351, 972–976. [Google Scholar] [CrossRef]
  9. Marengo, J.A. Interdecadal Variability and Trends of Rainfall across the Amazon Basin. Theor. Appl. Climatol. 2004, 78, 79–96. [Google Scholar] [CrossRef]
  10. Nicholson, S.E. The ITCZ and the Seasonal Cycle over Equatorial Africa. Bull. Am. Meteorol. Soc. 2018, 99, 337–348. [Google Scholar] [CrossRef]
  11. Nicholson, S.E. A Review of Climate Dynamics and Climate Variability in Eastern Africa. In Limnology, Climatology and Paleoclimatology of the East African Lakes; Routledge: London, UK, 2019. [Google Scholar]
  12. Herrmann, S.M.; Mohr, K.I. A Continental-Scale Classification of Rainfall Seasonality Regimes in Africa Based on Gridded Precipitation and Land Surface Temperature Products. J. Appl. Meteorol. Climatol. 2011, 50, 2504–2513. [Google Scholar] [CrossRef]
  13. Odekunle, T.O. Rainfall and the Length of the Growing Season in Nigeria. Int. J. Climatol. 2004, 24, 467–479. [Google Scholar] [CrossRef]
  14. Benoit, P. The Start of the Growing Season in Northern Nigeria. Agric. Meteorol. 1977, 18, 91–99. [Google Scholar] [CrossRef]
  15. Thornton, P.K.; Jones, P.G.; Ericksen, P.J.; Challinor, A.J. Agriculture and Food Systems in Sub-Saharan Africa in a 4 °C+ World. Philos. Trans. A Math. Phys. Eng. Sci. 2011, 369, 117–136. [Google Scholar] [CrossRef]
  16. Cook, K.H.; Vizy, E.K. Impact of Climate Change on Mid-Twenty-First Century Growing Seasons in Africa. Clim. Dyn. 2012, 39, 2937–2955. [Google Scholar] [CrossRef]
  17. Wainwright, C.M.; Allan, R.P.; Black, E. Consistent Trends in Dry Spell Length in Recent Observations and Future Projections. Geophys. Res. Lett. 2022, 49, e2021GL097231. [Google Scholar] [CrossRef]
  18. Liebmann, B.; Marengo, J. Interannual Variability of the Rainy Season and Rainfall in the Brazilian Amazon Basin. J. Clim. 2001, 14, 4308–4318. [Google Scholar] [CrossRef]
  19. Huffman, G.J.; Bolvin, D.T.; Nelkin, E.J.; Wolff, D.B.; Adler, R.F.; Gu, G.; Hong, Y.; Bowman, K.P.; Stocker, E.F. The TRMM Multisatellite Precipitation Analysis (TMPA): Quasi-Global, Multiyear, Combined-Sensor Precipitation Estimates at Fine Scales. J. Hydrometeorol. 2007, 8, 38–55. [Google Scholar] [CrossRef]
  20. Singer, M.B.; Asfaw, D.T.; Rosolem, R.; Cuthbert, M.O.; Miralles, D.G.; MacLeod, D.; Quichimbo, E.A.; Michaelides, K. Hourly Potential Evapotranspiration at 0.1° Resolution for the Global Land Surface from 1981-Present. Sci. Data 2021, 8, 224. [Google Scholar] [CrossRef]
  21. Harris, I.; Osborn, T.J.; Jones, P.; Lister, D. Version 4 of the CRU TS Monthly High-Resolution Gridded Multivariate Climate Dataset. Sci. Data 2020, 7, 109. [Google Scholar] [CrossRef]
  22. Liebmann, B.; Bladé, I.; Kiladis, G.N.; Carvalho, L.M.V.; Senay, G.B.; Allured, D.; Leroux, S.; Funk, C. Seasonality of African Precipitation from 1996 to 2009. J. Clim. 2012, 25, 4304–4322. [Google Scholar] [CrossRef]
  23. Dunning, C.M.; Black, E.C.L.; Allan, R.P. The Onset and Cessation of Seasonal Rainfall over Africa. J. Geophys. Res. Atmos. 2016, 121, 11405–11424. [Google Scholar] [CrossRef]
  24. Marengo, J.A.; Nobre, C.A.; Tomasella, J.; Oyama, M.D.; Oliveira, G.S.D.; Oliveira, R.D.; Camargo, H.; Alves, L.M.; Brown, I.F. The Drought of Amazonia in 2005. J. Clim. 2008, 21, 495–516. [Google Scholar] [CrossRef]
  25. Garreaud, R.D. The Andes Climate and Weather. Adv. Geosci. 2009, 22, 3–11. [Google Scholar] [CrossRef]
  26. Wright, J.S.; Fu, R.; Worden, J.R.; Chakraborty, S.; Clinton, N.E.; Risi, C.; Sun, Y.; Yin, L. Rainforest-Initiated Wet Season Onset over the Southern Amazon. Proc. Natl. Acad. Sci. USA 2017, 114, 8481–8486. [Google Scholar] [CrossRef]
Figure 1. (a) illustrates the CAA method for detecting the wet season, where green dots represent daily precipitation anomalous accumulation. The curve has been smoothed, with the orange dot indicating the onset of the wet season and the purple dot marking its end. The grey area depicts the duration of the wet season. (b) shows the wet season detection schematic using the PET threshold method, with the grey area representing the wet season’s duration. (c) displays the ratio between the second harmonic and first harmonic amplitudes in the Congo tropical forest region of Africa, defining areas with a ratio greater than 1 as having a biannual wet season.
Water 16 00749 g001
Figure 2. The spatial distribution map shows the length of the wet season (months) in the Amazon tropical forest region, as detected by the PET threshold method. Reg. 1–15 illustrates the regional average monthly precipitation and standard deviation (mm), with the red curve representing the average PET and the red band indicating standard deviation (mm).
Water 16 00749 g002
Figure 3. The length of the wet season (months) in the Congo (a) and Southeast Asian (b) tropical forest regions, as detected by the PET threshold method. Reg. 16–27 illustrates the regional average monthly precipitation and standard deviation (mm), with the red curve representing the average PET and the red band indicating standard deviation (mm).
Water 16 00749 g003
Figure 4. The length of the wet season (months) in the Amazon tropical forest region, as detected by the CAA method. Reg. A–K provides the regional average monthly precipitation and standard deviation (mm), with the blue curve showing the average daily precipitation’s anomalous accumulation and the blue band representing its standard deviation (mm).
Water 16 00749 g004
Figure 5. The length of the wet season (in months) in the Congo (a) and Southeast Asian (b) tropical forest regions, as detected by the CAA method. Reg. L–Y provides the regional average monthly precipitation and standard deviation (mm), with the blue curve showing the average daily precipitation’s anomalous accumulation and the blue band representing its standard deviation (mm).
Water 16 00749 g005
Figure 6. The global tropical forest wet season onset and end times detected by the PET threshold method. (ac) represent the onset of the wet season in the Amazon, Congo, and Southeast Asian tropical forests, and (df) represent its end, with black areas indicating a biannual wet season. (g,h) show the onset and end of the first wet season in the Congo tropical forest’s biannual region, and (i,j) depict the onset and end of the biannual region’s second wet season.
Water 16 00749 g006
Figure 7. The global tropical forest wet season onset and end times detected by the CAA method. (ac) represent the onset of the wet season in Amazon, Congo, and Southeast Asian tropical forests, and (df) represent its end, with black areas indicating a biannual wet season and blue areas indicating an all-year round wet season. (g,h) show the onset and end of the first wet season in the Congo tropical forest’s biannual region, and (i,j) depict the onset and end of the biannual region’s second wet season.
Water 16 00749 g007
Disclaimer/Publisher’s Note: The statements, opinions and data contained in all publications are solely those of the individual author(s) and contributor(s) and not of MDPI and/or the editor(s). MDPI and/or the editor(s) disclaim responsibility for any injury to people or property resulting from any ideas, methods, instructions or products referred to in the content.

