1. Introduction
Groundwater nitrogen pollution has become a serious environmental problem worldwide [
1]. Thirty regions in Africa, twenty regions in Asia, and nine regions in Europe are experiencing very high levels of groundwater nitrogen pollution [
2,
3]. Groundwater nitrogen pollution mainly occurs due to population increase, the illegal discharge of industrial wastewater, and the excessive use of nitrogen fertiliser in agriculture. The intrusion of contaminated surface water into underground aquifers can have serious ecological impacts and directly harm humans and their activities [
4,
5].
Nitrogen transport and transformation in the groundwater aeration zone is a complex process involving a series of physical, biological, and chemical reactions, mainly the mineralisation of organic nitrogen, nitrification, denitrification, assimilation, and adsorption, which are not only related to the input of pollutants but also closely related to the hydrogeological conditions of the system. Factors such as soil lithology, soil moisture, organic matter content, particle size distribution, permeability, soil pH, and soil temperature in the study area all have an influence on nitrogen transport and transformation to a certain degree [
6,
7,
8,
9].
Hydrus-1D 4.16.0110 software can be used to simulate water movement, heat transport, and solute transport in media. In recent years, it has been widely used by scholars at home and abroad in the fields of agricultural irrigation, salt leaching, nitrogen transfer, and pollutant transport [
10,
11,
12]. Wang et al. systematically analysed research progress in the field of Hydrus modelling in China, and the results showed that Hydrus is able to better simulate the migration and transformation processes of water and solute in different media [
13]. Ramos et al. irrigated maize with irrigation water mixed with artificial saline water containing different nitrogen concentrations in two regions of Portugal, Alvaredo and Mithra, and modelled the nitrogen transport process in groundwater using Hydrus-1D 4.16.0110 software [
14]. Zhan Jiang et al. investigated the migration and transformation laws of ammonia nitrogen in three typical sandy soils through an indoor soil column test and compared the results with those derived using numerical simulation, and the comparison results showed that Hydrus could simulate the nitrogen transport process more accurately [
15].
Visual MODFLOW is currently the most popular and internationally recognised standard visualisation software system for the simulation and evaluation of 3D groundwater flow and solute transport [
16]. Zhang et al. used the second largest aquifer in the UK, the Sherwood Sandstone aquifer in Nottinghamshire, to discuss the impact of woodland cover on groundwater quality using MODFLOW and MT3D to simulate nitrate concentrations until 2025 [
17]. Sith et al. coupled the Soil Moisture Assessment Tool (SWAT) with a groundwater model (MODFLOW) and applied them to simulate water flow, sediment, and pollutant discharge in an agricultural small-flow study area in southwestern Japan [
18].
This study used a typical section of the Wei River as the study area and carried out numerical simulation research on nitrogen migration and conversion by using Hydrus-1D and Visual MODFLOW 4.6 software to model the nitrogen pollution of groundwater in this study area. This study realised the integration of simulation calculations between the surface, the aeration zone, and the aquifer system. Based on the simulation results and groundwater nitrogen pollution monitoring data in the study area, effective groundwater nitrogen pollution prevention and control measures are proposed to provide a scientific basis for follow-up targeted nitrogen pollution control and the protection of groundwater resources.
2. Methods
2.1. Study Area Overview
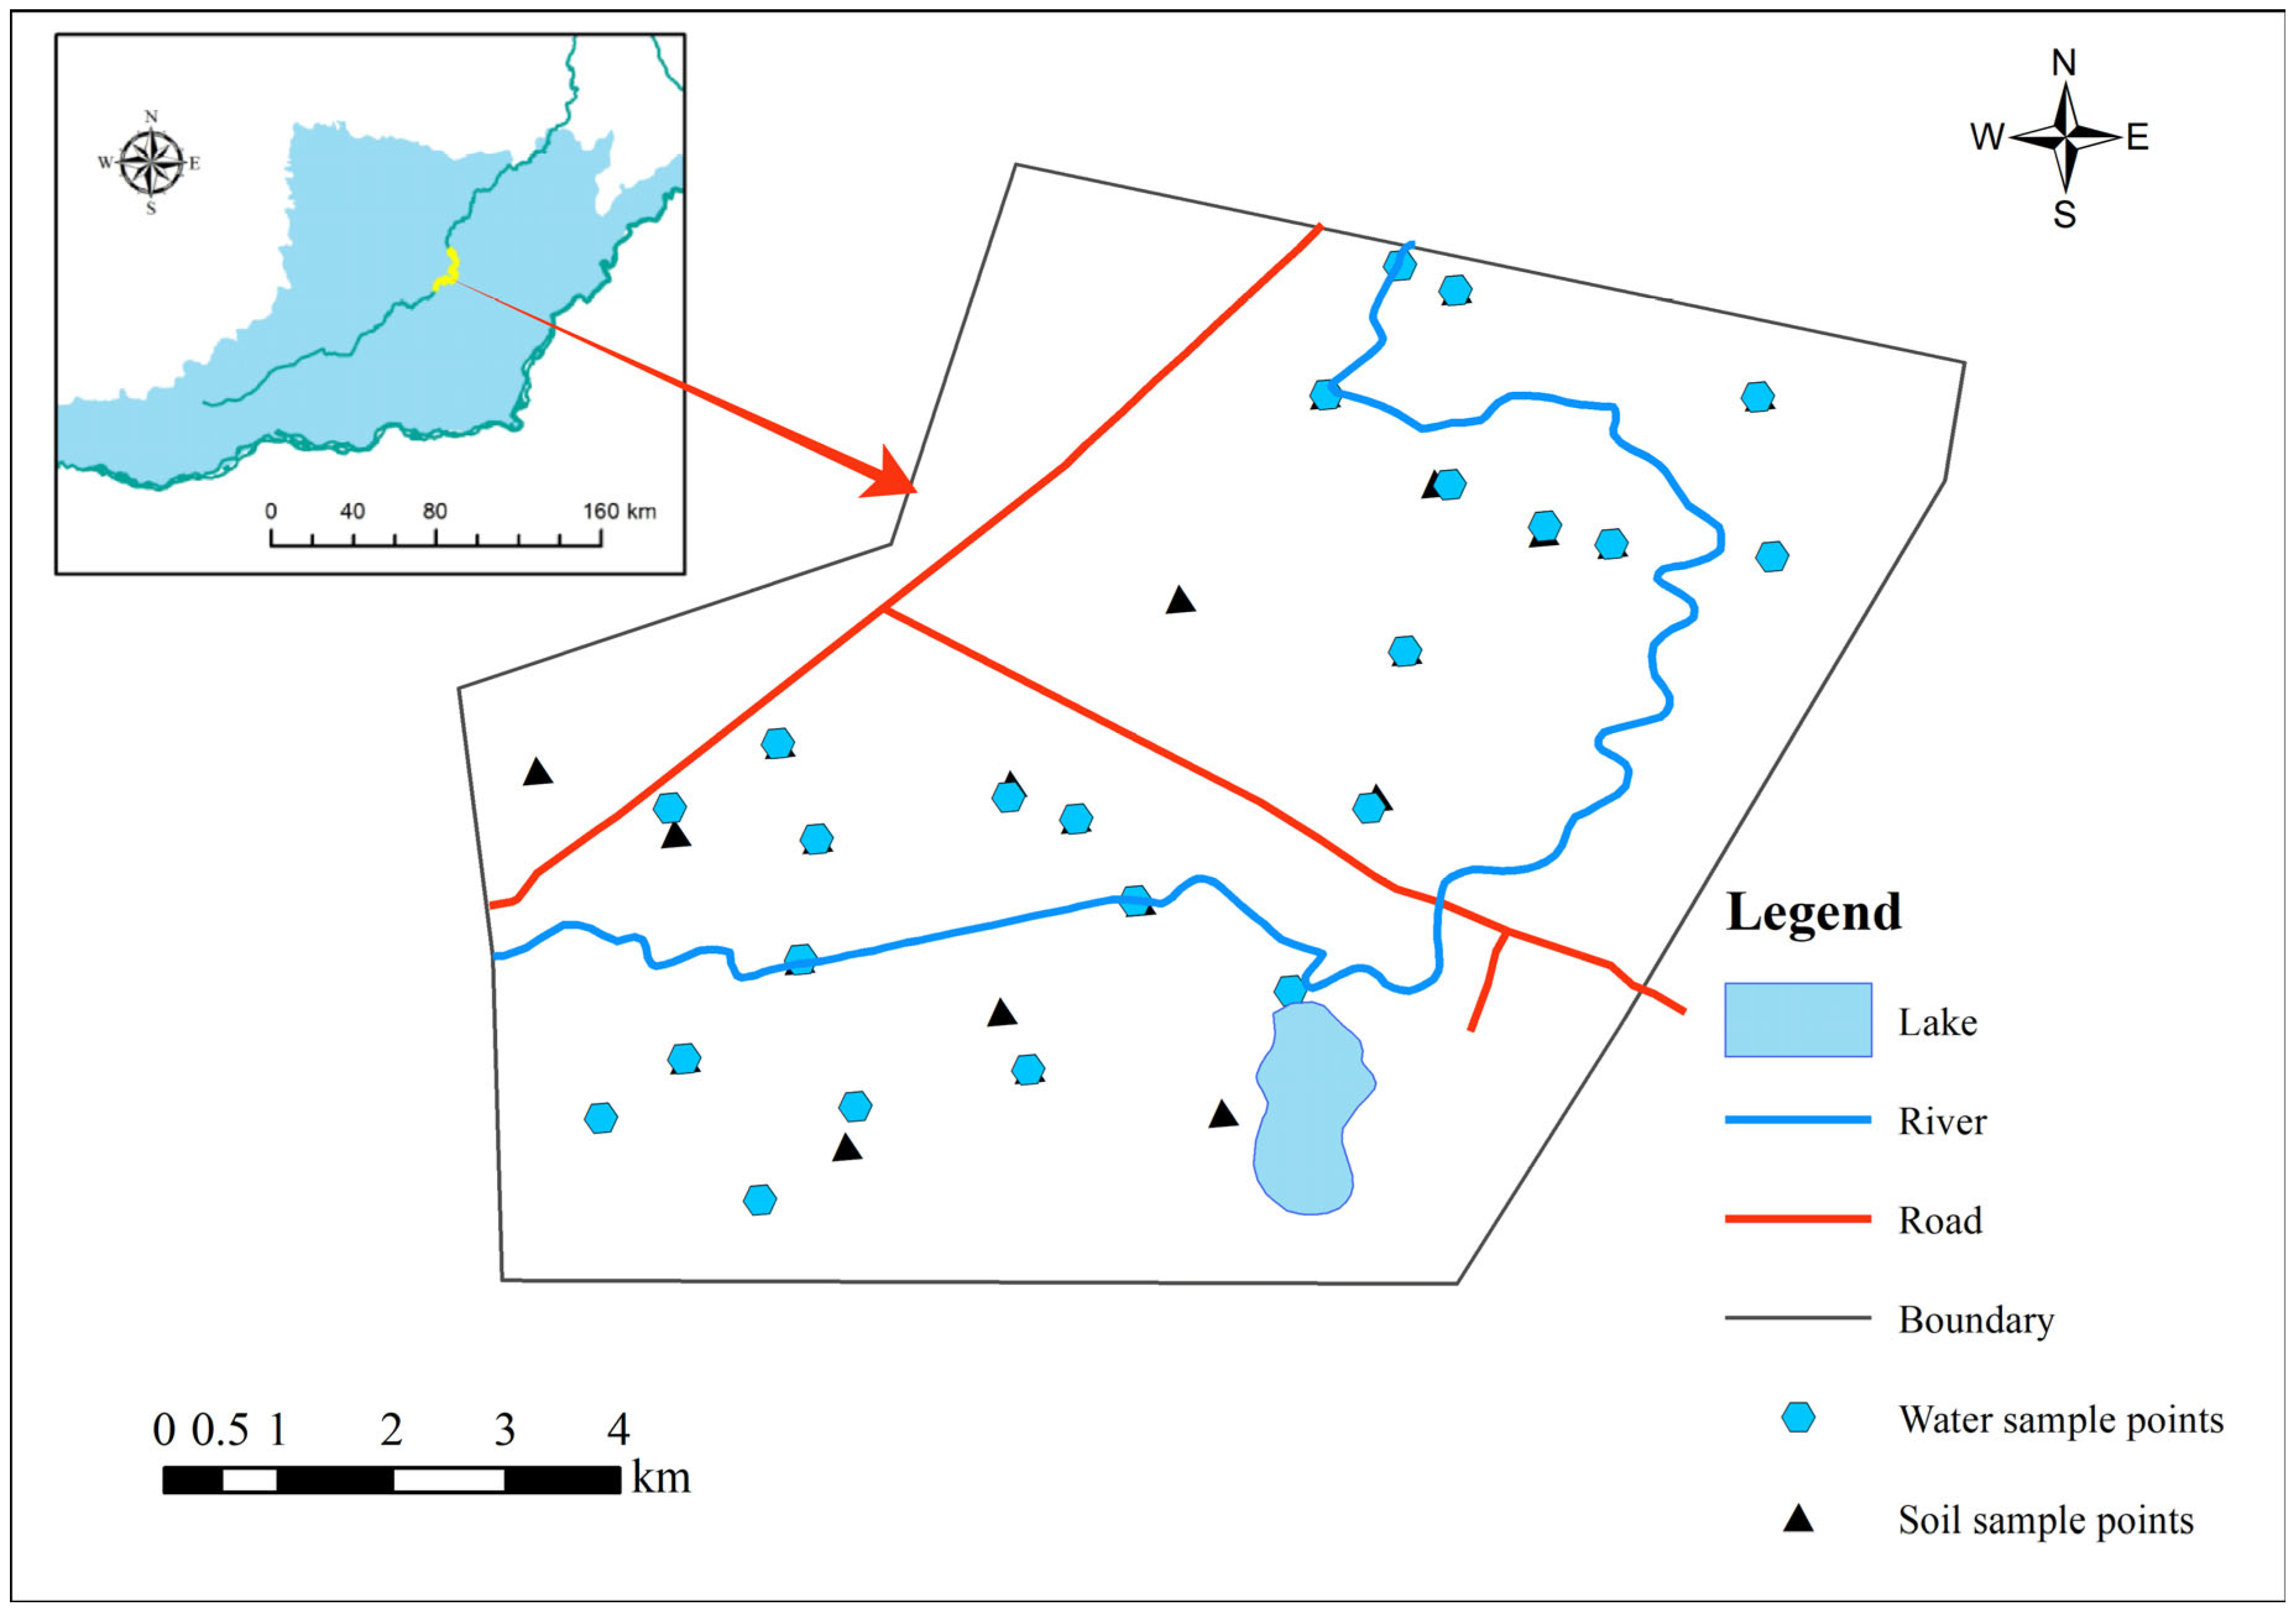
The research area is located in the south of the Hai River Basin and the north of the northern Henan region, which is a tributary of the Zhangweinan canal system. The research area is a typical section of the Wei River, extending from Xizhangzhuang Village to Wangsizhuang Village, spanning Junxian County, Hebi City, Hua County, and Anyang City, Henan Province. The total length of the river area studied is 19.5 km, and the total study area includes 3 km areas on both sides of the river, for a total area of 69.08 km
2. The study area is located in the flood accumulation depression of the northern Henan Plain, with little topographic fluctuation, a surface elevation difference of less than 10 m, an elevation of 56~64 m, and a slow incline from southwest to northeast. In this study, field survey sampling was conducted in May 2020 and September 2022. The distribution of the water and soil samples is shown in
Figure 1.
Since the indexes of this study were three typical pollutants, NH
4-N, NO
3-N, and NO
2-N, only the detected concentrations of these pollutants were used to evaluate the water quality category. The detection methods were determined in accordance with those outlined in
Water and Wastewater Monitoring and Analysis Methods (Fourth Edition); for NH
4-N detection, Nessler’s reagent spectrophotometry; and for NO
3-N and NO
2-N detection, UV spectrophotometry. The evaluation standards adopt the national standards of environmental quality standards for surface water (GB3838-2002) and standards for groundwater quality (GB/T14848-2017) [
19,
20]. The content of NH
4-N, NO
3-N, and NO
2-N and the water quality categories for the collected water samples are shown in
Table 1.
Among the groundwater samples tested, class V water accounted for 15.8%, class IV water for 31.6%, and class III water for 52.6%. According to the maximum concentration value, NH4-N exceeded the standard 6-fold, NO2-N 1.89-fold, and NO3-N 1.66-fold.
2.2. Vertical Infiltration Simulation of Surface Nitrogen Pollution
2.2.1. Concept Model of Aeration Zone
Due to the large study area and the complexity of the stratigraphic lithology, topography, and surface pollution sources, it was not possible to use Hydrus-1D directly for simulation. Therefore, the main controlling factors of nitrogen transport and transformation in the aeration zone were analysed first, and six factors, i.e., stratigraphic characteristics, surface infiltration coefficients, ammoniacal nitrogen concentrations, nitrate nitrogen concentrations, nitrate nitrogen concentrations, and nitrification/denitrification reactions, were selected for a zoning treatment [
21,
22]. The values are shown in
Table 2.
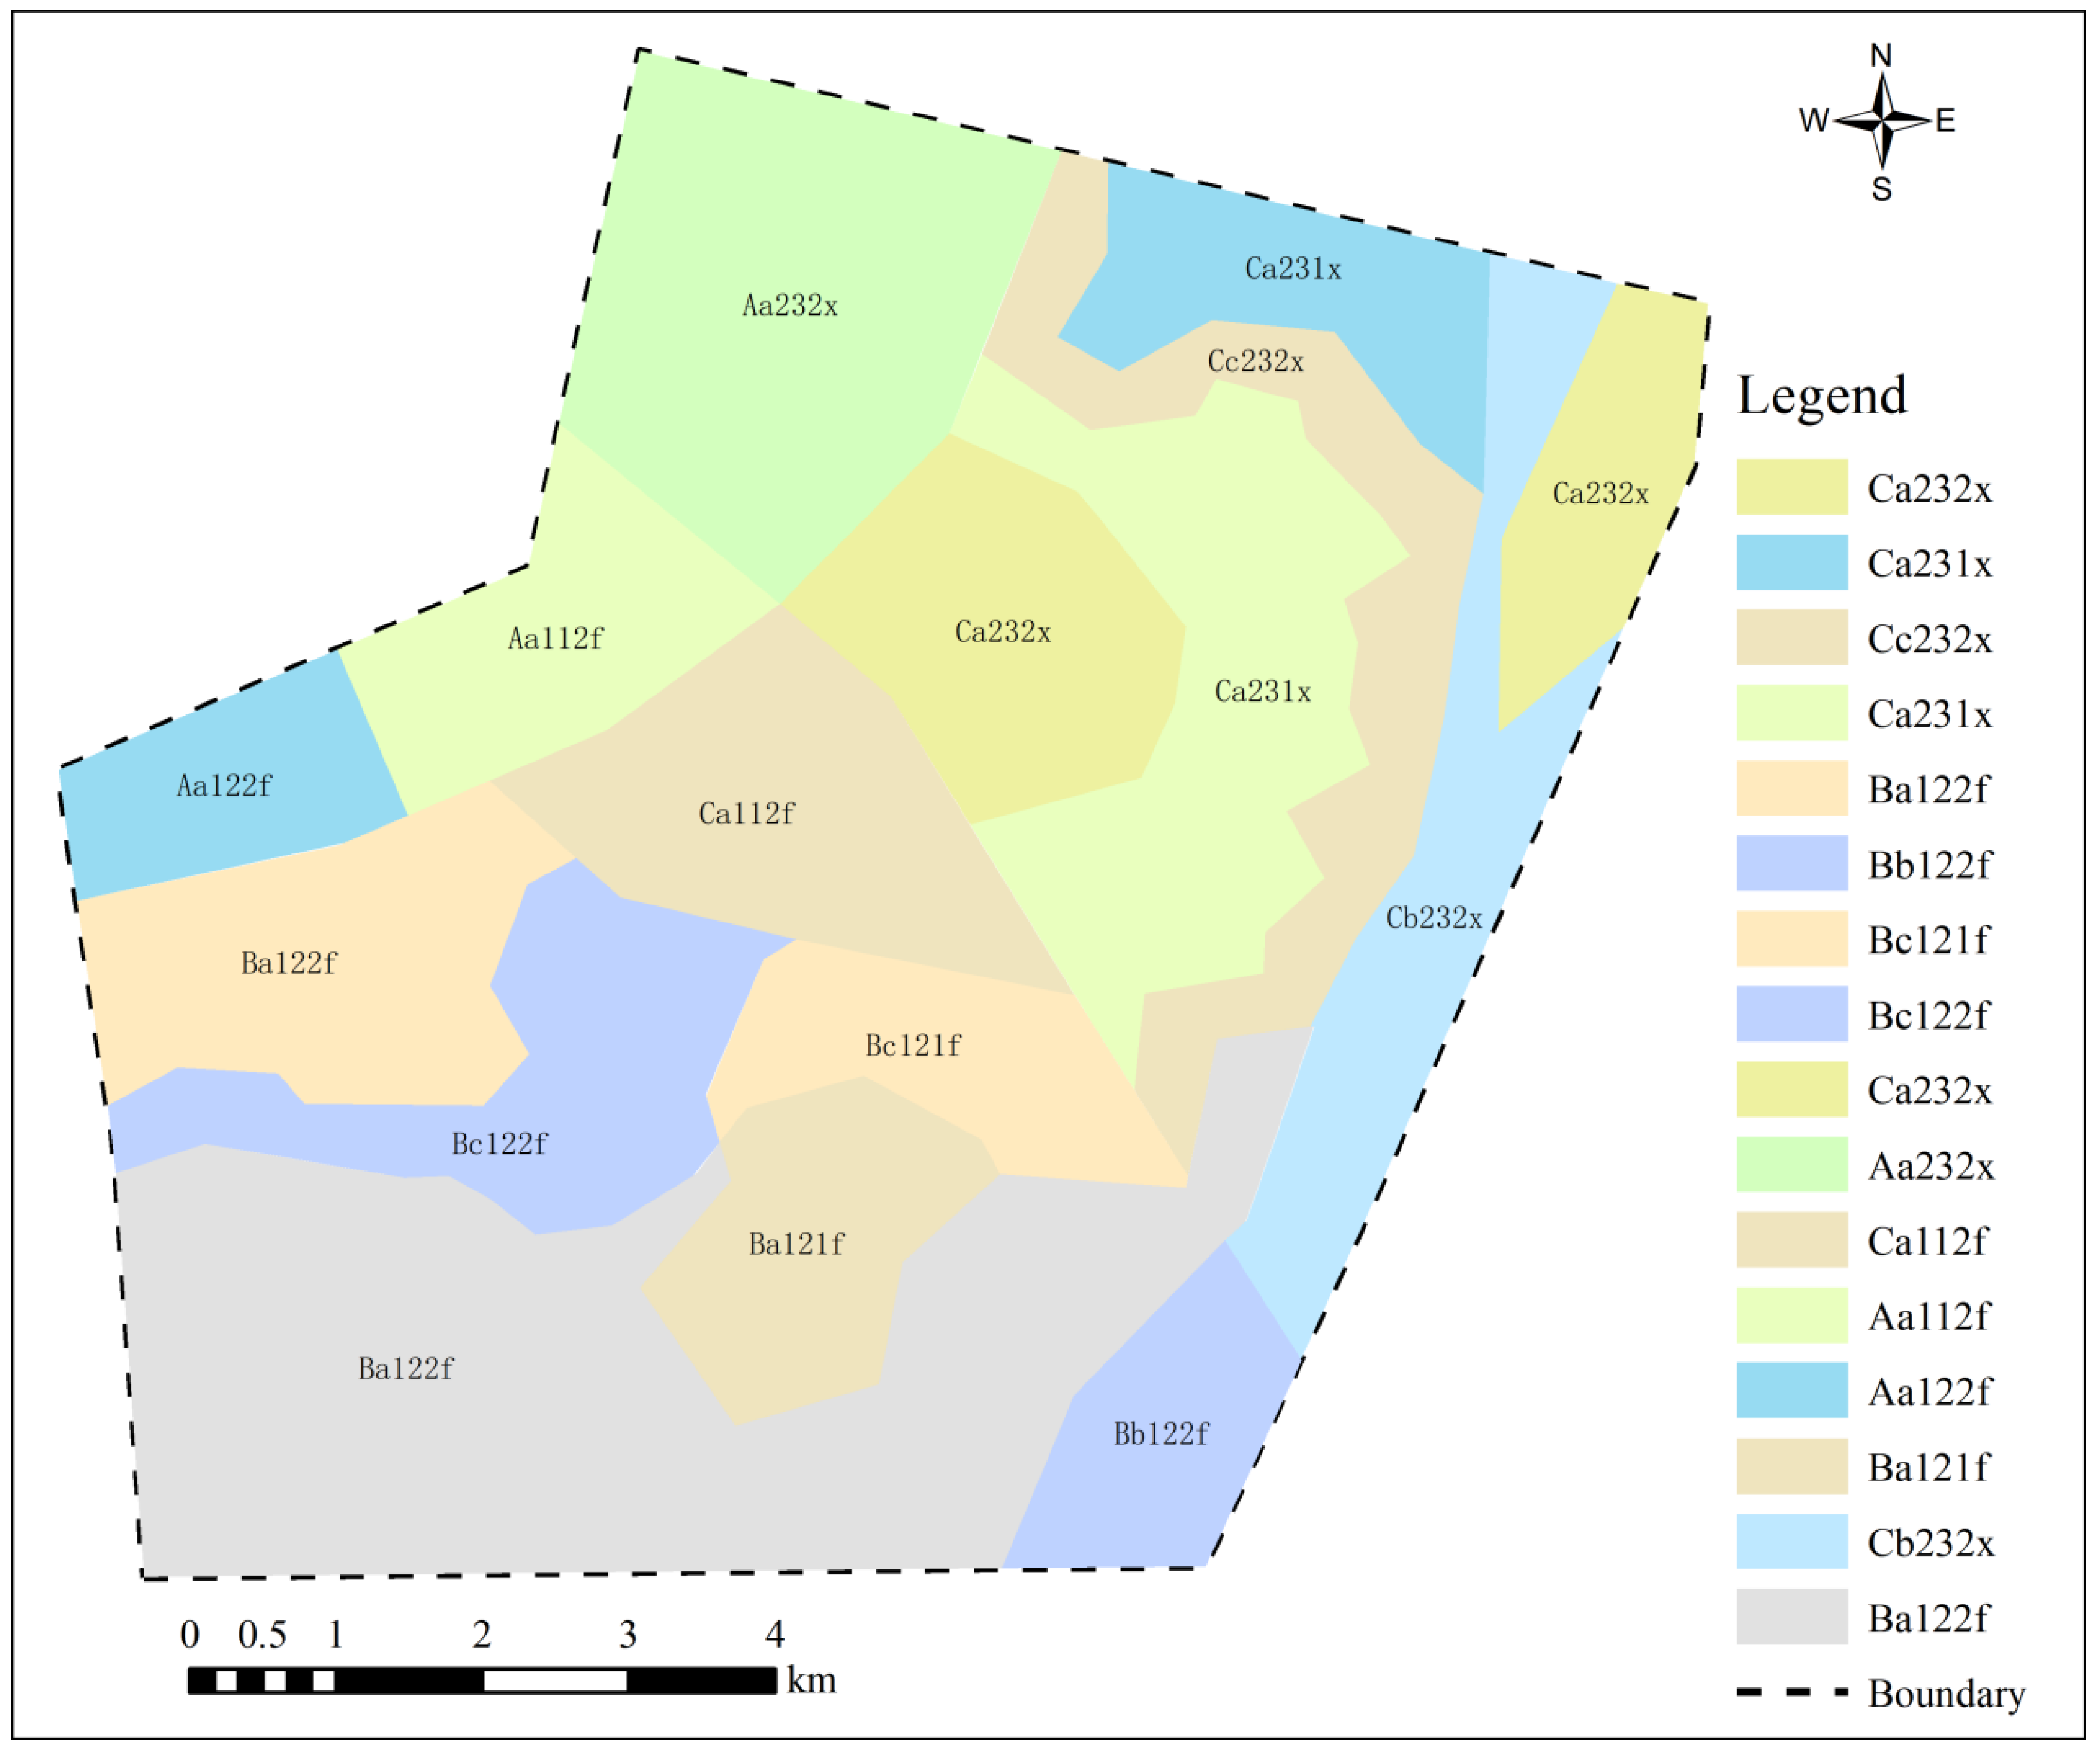
The independent layers of the above six factors were generated using ArcGIS and then overlaid to obtain a comprehensive zoning map of the model parameters in the study area [
23,
24] (see
Figure 2), which divides the whole study area into 16 zones. The code for each subzone consists of six parameters; for example, Aa132x represents stratum A, infiltration coefficient a, ammonia nitrogen concentration 1, nitrate nitrogen concentration 3, nitrite concentration 2, and nitrification reaction x.
2.2.2. Numerical Model
In this study, Hydrus-1D was used to simulate the nitrogen migration transformation to obtain the nitrogen distribution characteristics of the leachate effluent at the bottom of the aeration zone [
25].
The Richards equation for one-dimensional homogeneous (equilibrium) water flow motion in unsaturated pore media is as follows [
26]:
In the formula, C(h) is the water capacity; K(h) is the hydraulic conductivity; h is the negative pressure, z is the position coordinate in the direction of parallel water flow; t is the time; α is the angle between the water flow direction and the vertical positive down; θ is the volumetric water content; and S(z,t) is the water absorption strength of the plant root system (d−1).
It is assumed that surface pollutants enter the aeration zone mainly through rainfall leaching, so the upper boundary of the water flow model is the atmospheric boundary condition with surface runoff and the lower boundary is the free drainage boundary condition. The rainfall is the multiyear average rainfall of the study area. Empirical values for soil moisture characteristics in the study area were used, as shown in
Table 3. In the table, θr and θs represent the residual volumetric water content and the saturated volumetric water content of the soil, respectively; α(cm
−1) and n are empirical fitting parameters; and Ks (cm·d
−1) is the saturated soil hydraulic conductivity.
On the basis of water transport, Hydrus-1D uses the classical convection–dispersion equation to describe one-dimensional solute transport in saturated–unsaturated pore media [
27]:
In the formula, C is the solute concentration in the liquid phase (mg/L); DL is the longitudinal dispersion coefficient (cm/d); v is the Darcy flow rate (cm/d); ρb is the soil bulk density (mg/cm); ρs is the soil bulk weight (mg/cm3); KL is the sorption partition coefficient (cm3/g); C0 is the initial concentration (mg/L); k is the primary reaction rate constant (d−1); and the others are as described above.
Empirical values were used for the solute transport model parameters in the study area, as shown in
Table 4.
The current model was first run for 365 days, using the head at the last moment of the current model as the initial head of the solute transport model, after which the solute transport model was run for 2000 days.
2.3. Simulation of Nitrogen Migration and Transformation in Groundwater
Using Visual MODFLOW software to establish an underground hydrogen nitrogen migration transformation simulation model, the Hydrus-1D simulation results were used to enter the aquifer model as the initial input and to identify and validate the model based on the collection of data, viewing the experience values, hydrological geological parameters, solvent transportation model parameters, and water layer structure and boundary conditions [
28,
29].
2.3.1. Numerical Model of Groundwater Flow
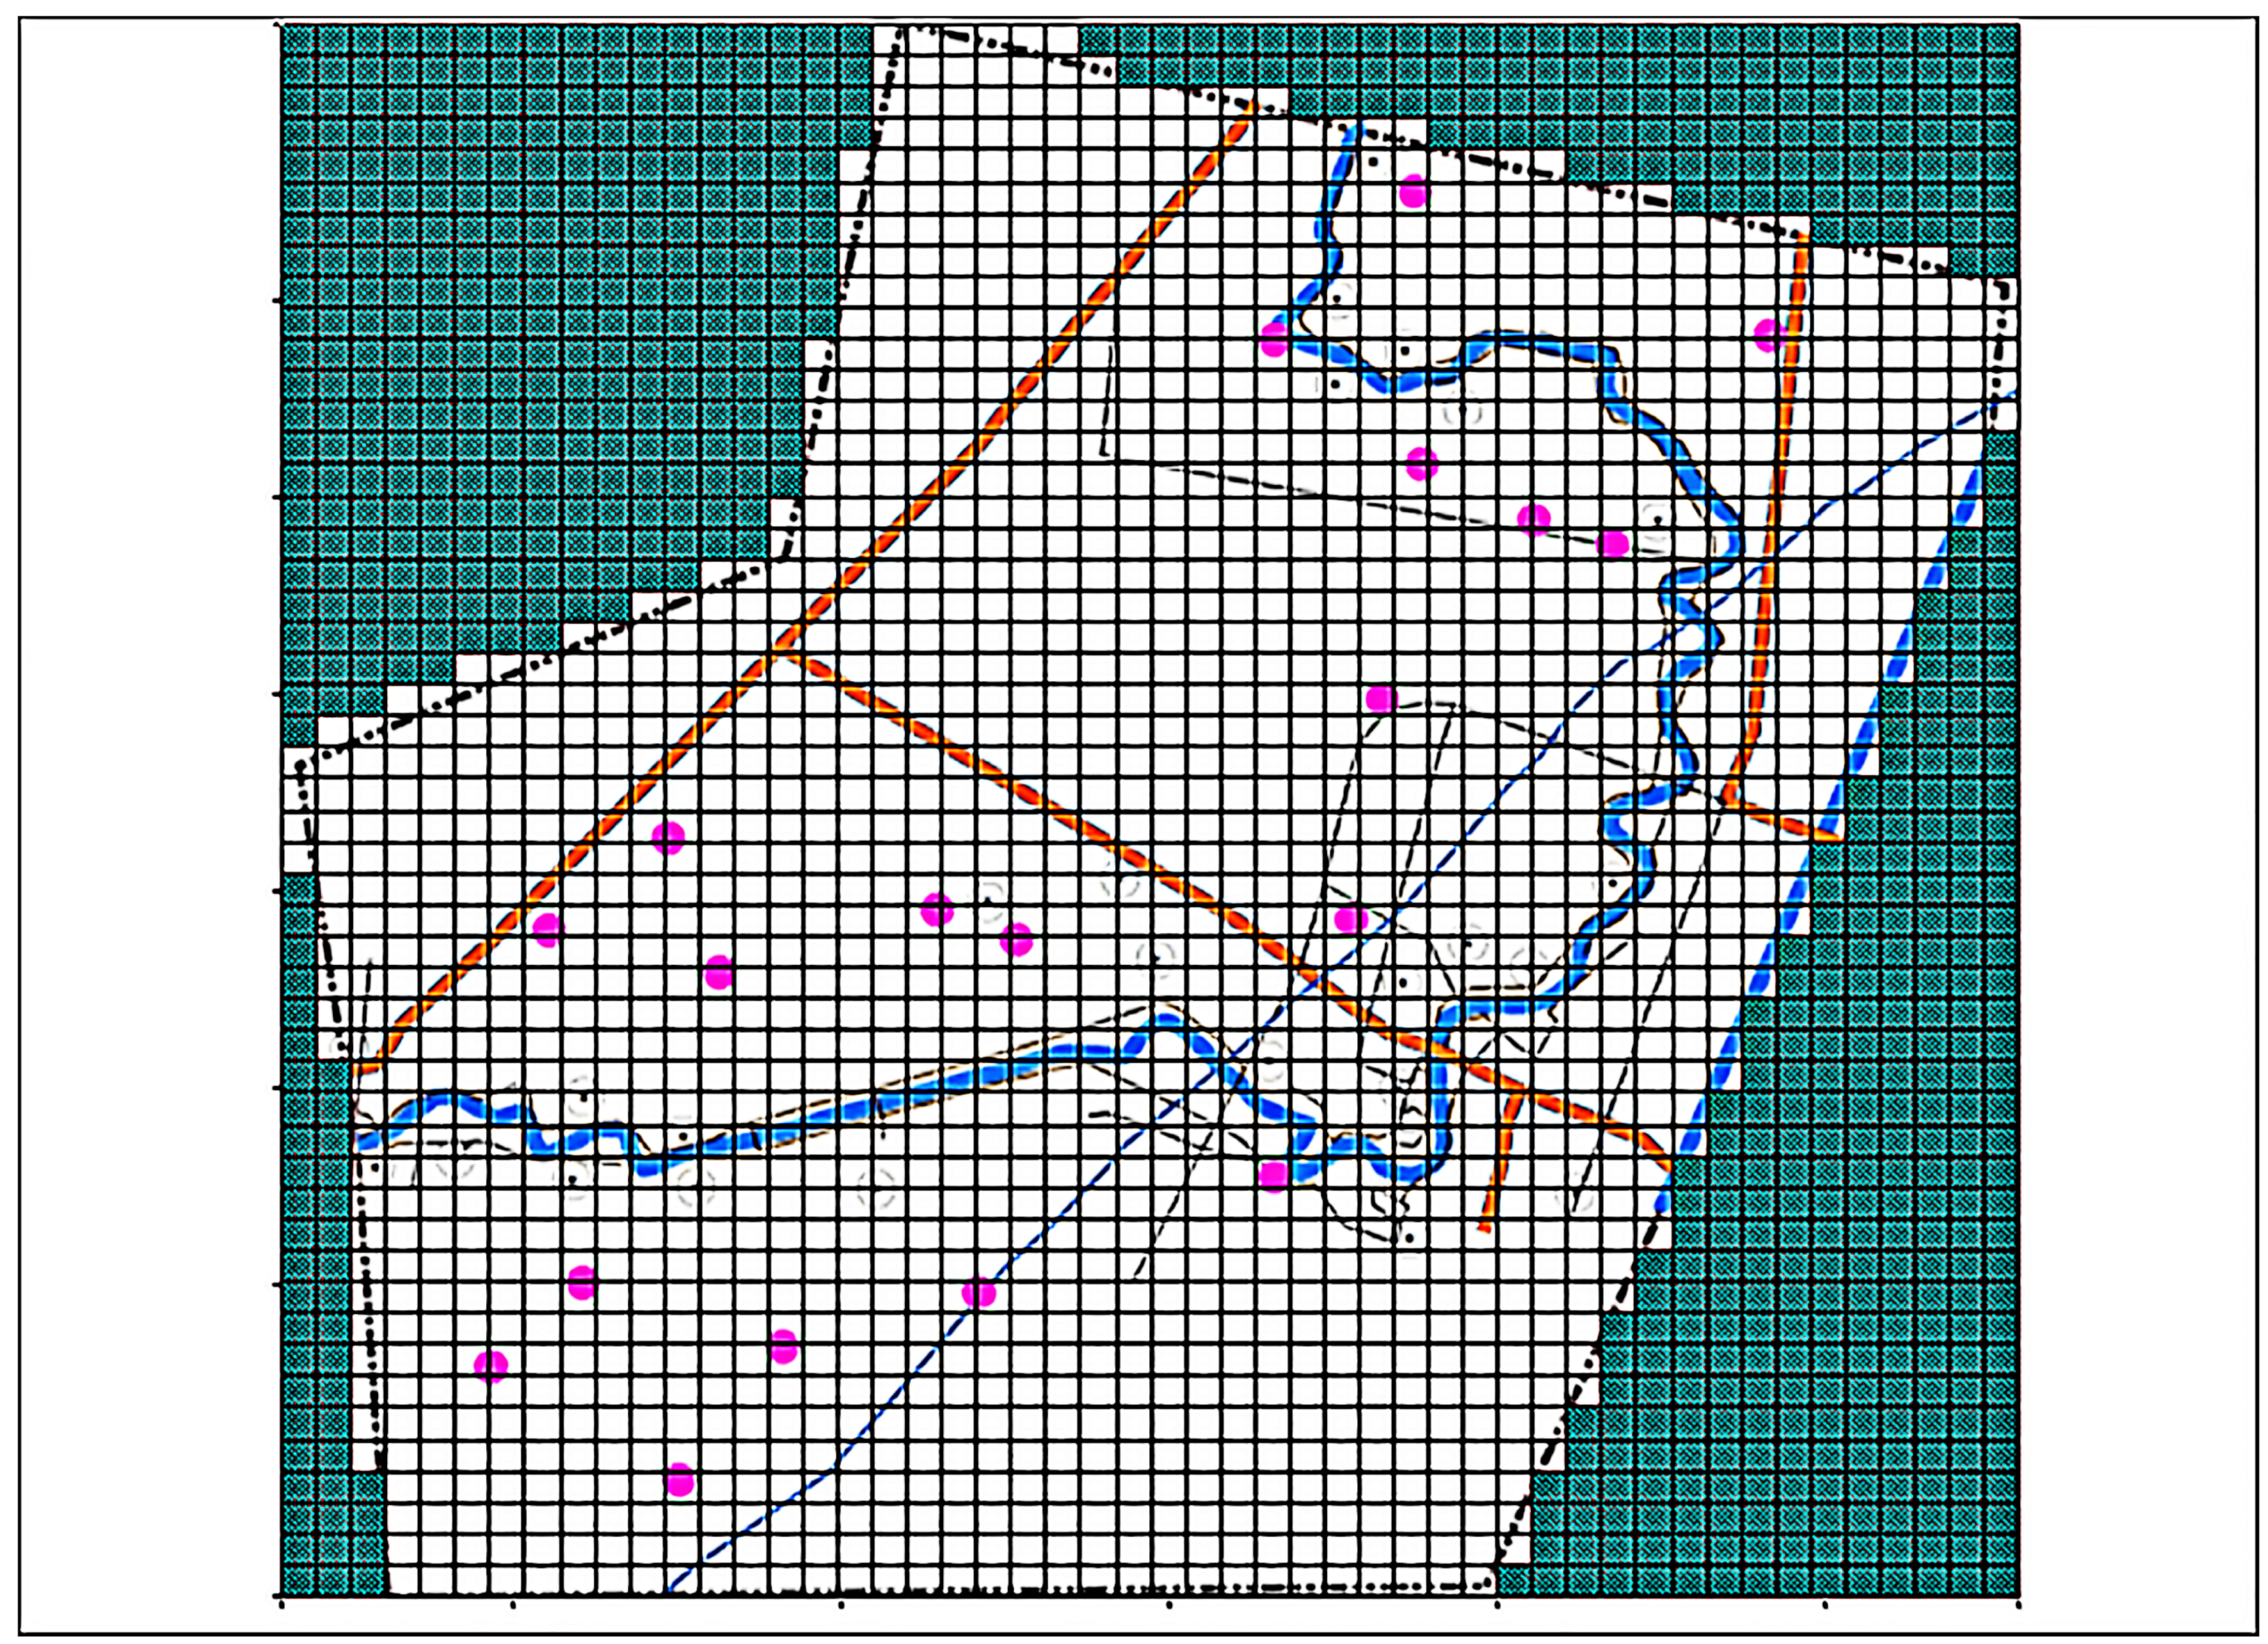
Based on the Hydrological Geological Concept Model of the Wei River area, the grid of the dispersed treatment of the research area was set at 50 columns × 50 lines, which ran vertically according to the three-dimensional geological structure model and were divided into 3 cell layers. The grid totalled 2500 cells, and the activated part of the study area totalled 1572 effective cells. The research differential grid is shown in
Figure 3.
According to the information from the six boreholes and stratigraphic profiles from the study area, the Quaternary lithology along the Wei River mainly consists of powdered soil, dust sand, fine sand, and dusted clay. Because the distribution of dust sand is small and the particles are thinner, dust and fine sand are generalised into one layer, so the vertical upper cutting is divided into three layers. The generalised structure of the aquifer is shown in
Figure 4.
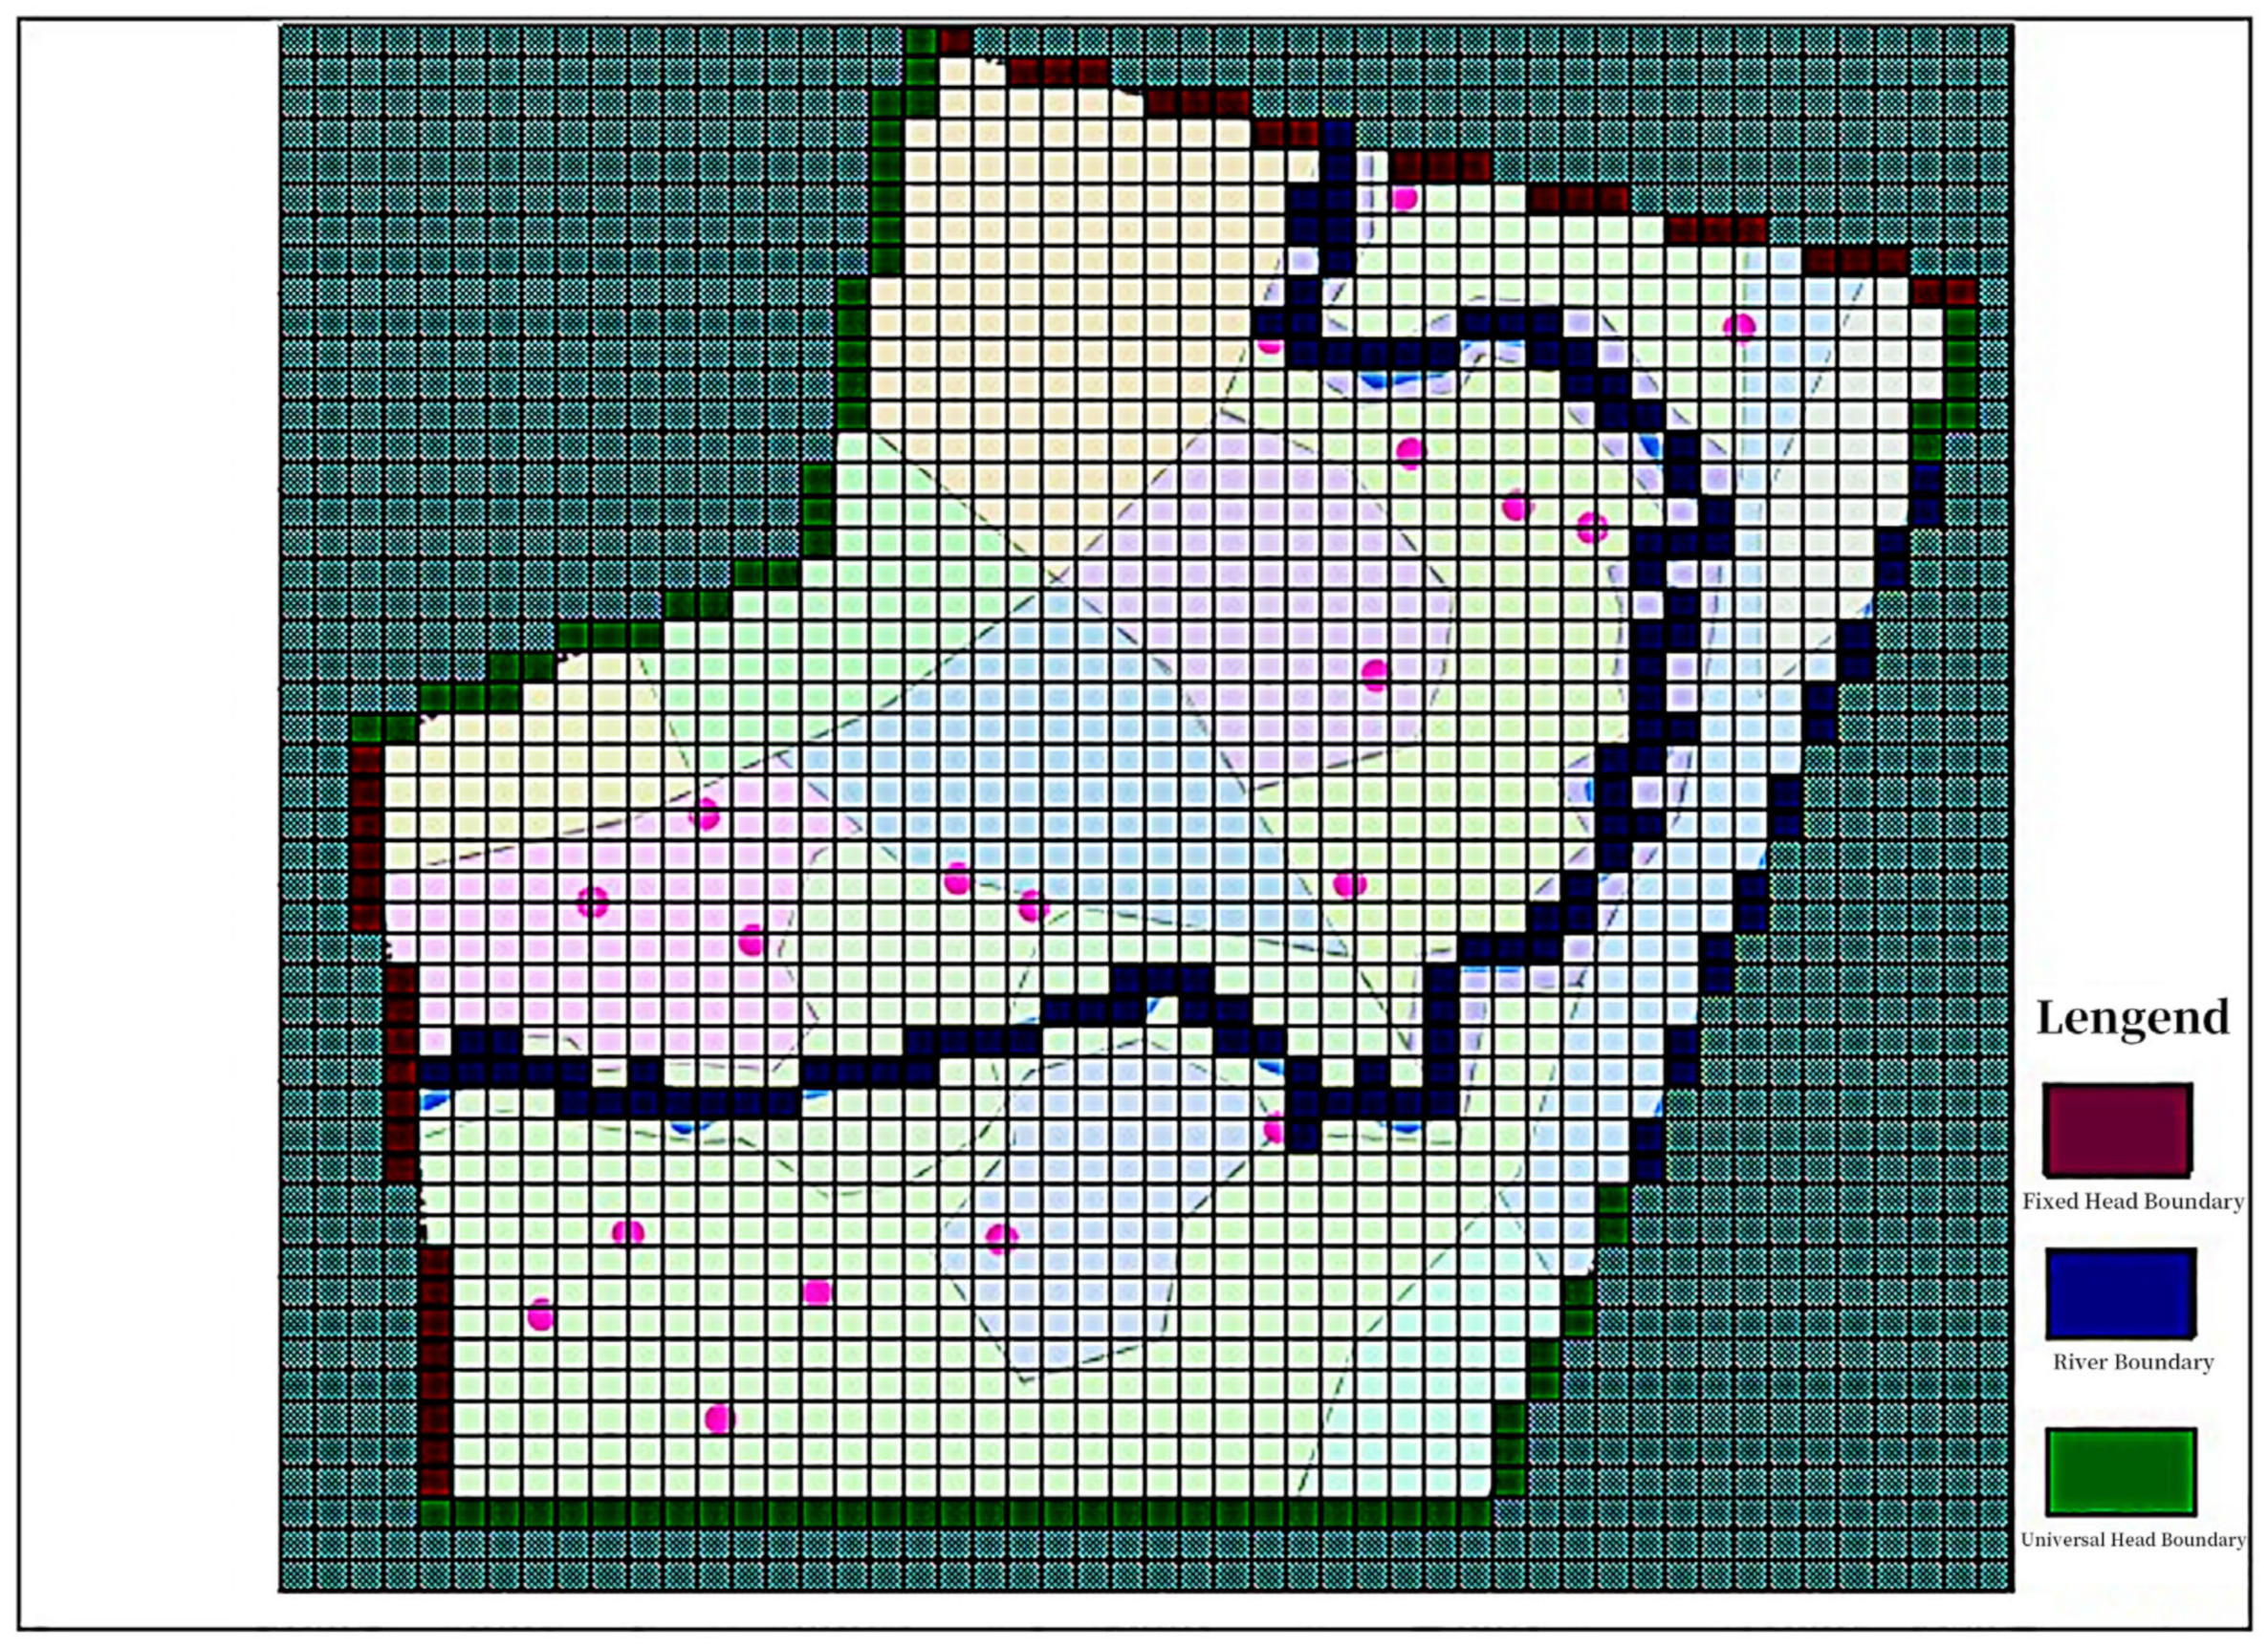
Based on the previously analysed groundwater circulation characteristics of the Wei River area and the flow field diagram, the western and northern boundaries are generalised as fixed-head boundaries; the north-western, eastern, and southern boundaries are generic-head boundaries; and both the Wei River and the Dagong River are designated as river boundaries. Vertically, the upper boundary is defined by the free water surface, which receives vertical infiltration recharge from the air-packed belt, artificial mining, etc. The lower boundary is defined by the elevation of the bottom plate of the powdery clay layer, and the transgressing flow is negligible. According to the data, the dynamic change in the groundwater in the Wei River area over the years is relatively small, so this study generalises the groundwater flow system as a stable flow, and the input and output of the groundwater do not change with time. The generalisation of the aquifer boundary in the study area is shown in
Figure 5.
2.3.2. Nitrogen Migration Conversion Numerical Model
The continuous decay reaction model in the RT3D module was used to construct a numerical model of nitrogen migration conversion in the area of study, calculating the nitrogen quality of the flow into and out of the groundwater systems of various sources, thus obtaining nitrogen contribution rates from the pollution sources [
30,
31,
32].
The nitrogen migration and conversion process is mainly controlled by convection, dispersion, adsorption, the nitrification reaction, and the denitrification reaction. The formula for the migration and transformation of nitrogen in groundwater systems is as follows:
In the formula, , , and are the constraint coefficients for NH4-N, NO2-N, and NO3-N; , , and are the concentrations of NH4-N, NO2-N, and NO3-N (mg/L); Xi, Xj (i, j = 1, 2, 3) denote the coordinate components; Dij is the hydrodynamic dispersion coefficient of the solute (m2/d); vi is the flow rate of the groundwater (m/d); k1, k2, k3, and k4 are the primary nitrification coefficient, secondary nitrification coefficient, denitrification coefficient, and degradation coefficient of COD; and are the ratios of stoichiometric numbers of NO2/NH4 and NO3/NO2; is the initial concentration of NH4-N, NO2-N, and NO3-N (mg/L); is the concentration on the boundary of fixed concentration (mg/L); is the boundary of fixed concentration; is the boundary of fixed flux; is the outer normal vector on the boundary conditions; and g(x, y, z, t) is a known function of the constant flux boundary.
The modelled extent and aquifer structure of the solute transport in the study area is consistent with the groundwater flow model. The model in the study area is vertically oriented, with the upper boundary being the diving surface, which receives pollutants leached from the bottom of the aeration zone, and solute exchange occurs vertically. The lower boundary is generalised as a zero-flux boundary. The solute concentration in the Wei River does not vary significantly, so the Wei River is generalised to a constant concentration boundary, with an ammonia nitrogen concentration of 4.35 mg/L, a nitrite nitrogen concentration of 0.199 mg/L, and a nitrate nitrogen concentration of 7.571 mg/L.
According to the solute transport results, the solute concentration filtered from the bottom of the aeration zone is taken as the vertical infiltration concentration [
33,
34] of the numerical model of Visual MODFLOW groundwater flow. The Hydrus-1D aeration zone model is divided into 16 regions for simulation, and the solute concentration at the bottom of each zone is different, so the solute transport model is divided into 16 regions with the input vertical infiltration concentration. The partition situation of the solute transport model is consistent with the calculation partition of the aeration zone model (
Figure 2), and the pollutant concentration in each zone is shown in
Table 5 [
35].
3. Results and Discussion
3.1. Change Pattern of Nitrogen in the Aeration Zone
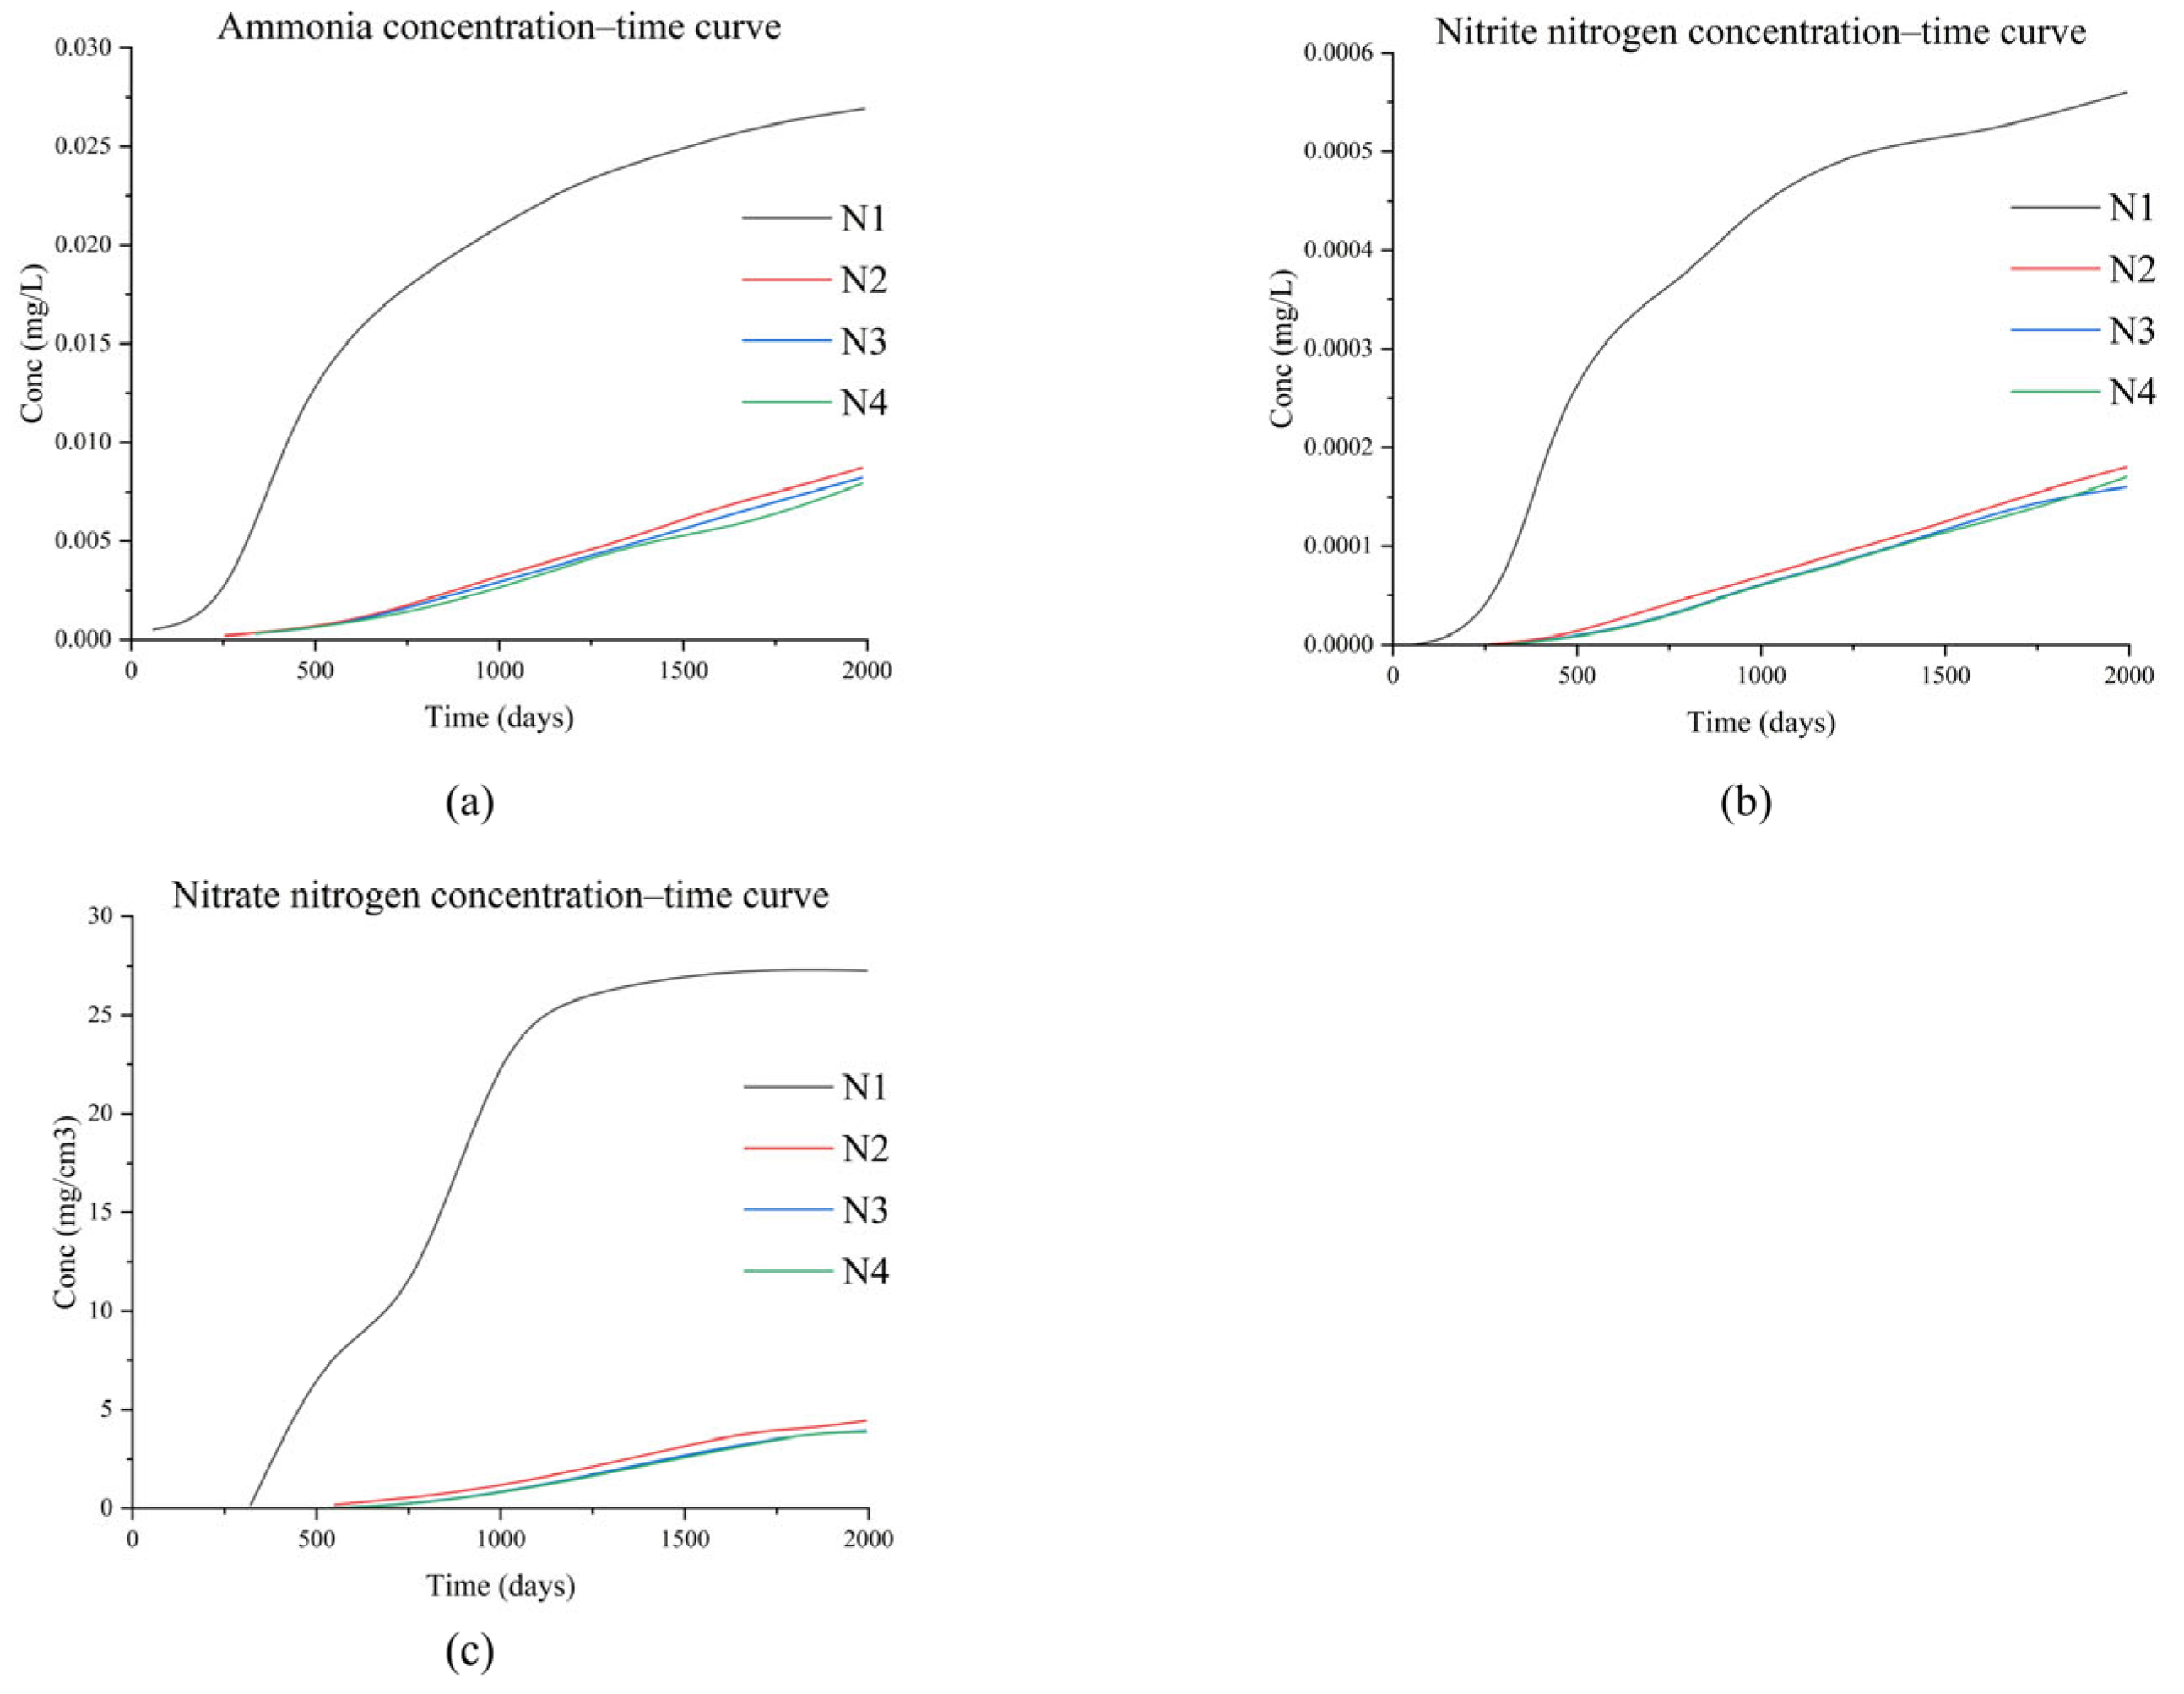
The observation point curve graph in each observation hole can be seen in the simulation period’s solute concentration change over time.
Figure 6 uses the area numbered Aa122f as an example to illustrate a graph of the nitrogen concentration change over time.
In the observation point plot, the vertical coordinate is the solute concentration, the horizontal coordinate is the simulation time, and N1~N4 are the observation point labels, with N1 representing the topmost observation point and N4 representing the bottom observation point.
As can be seen from the figure, ammonia nitrogen is greatly affected by the soil adsorption and nitrification reaction. The concentration of effluent is very small and ultimately remains within a certain concentration range, indicating that the adsorption process of soil on ammonia nitrogen basically reaches stability. Nitrite nitrogen is the intermediate product of the nitrification reaction, the concentration of which gradually rises with time, and is maintained within a certain concentration range after about 1500 days. Nitrate nitrogen is the final product of nitrification and is not adsorbed by the soil; thus, nitrate nitrogen constantly accumulates over time and stabilises within a certain concentration range after approximately 1500 days.
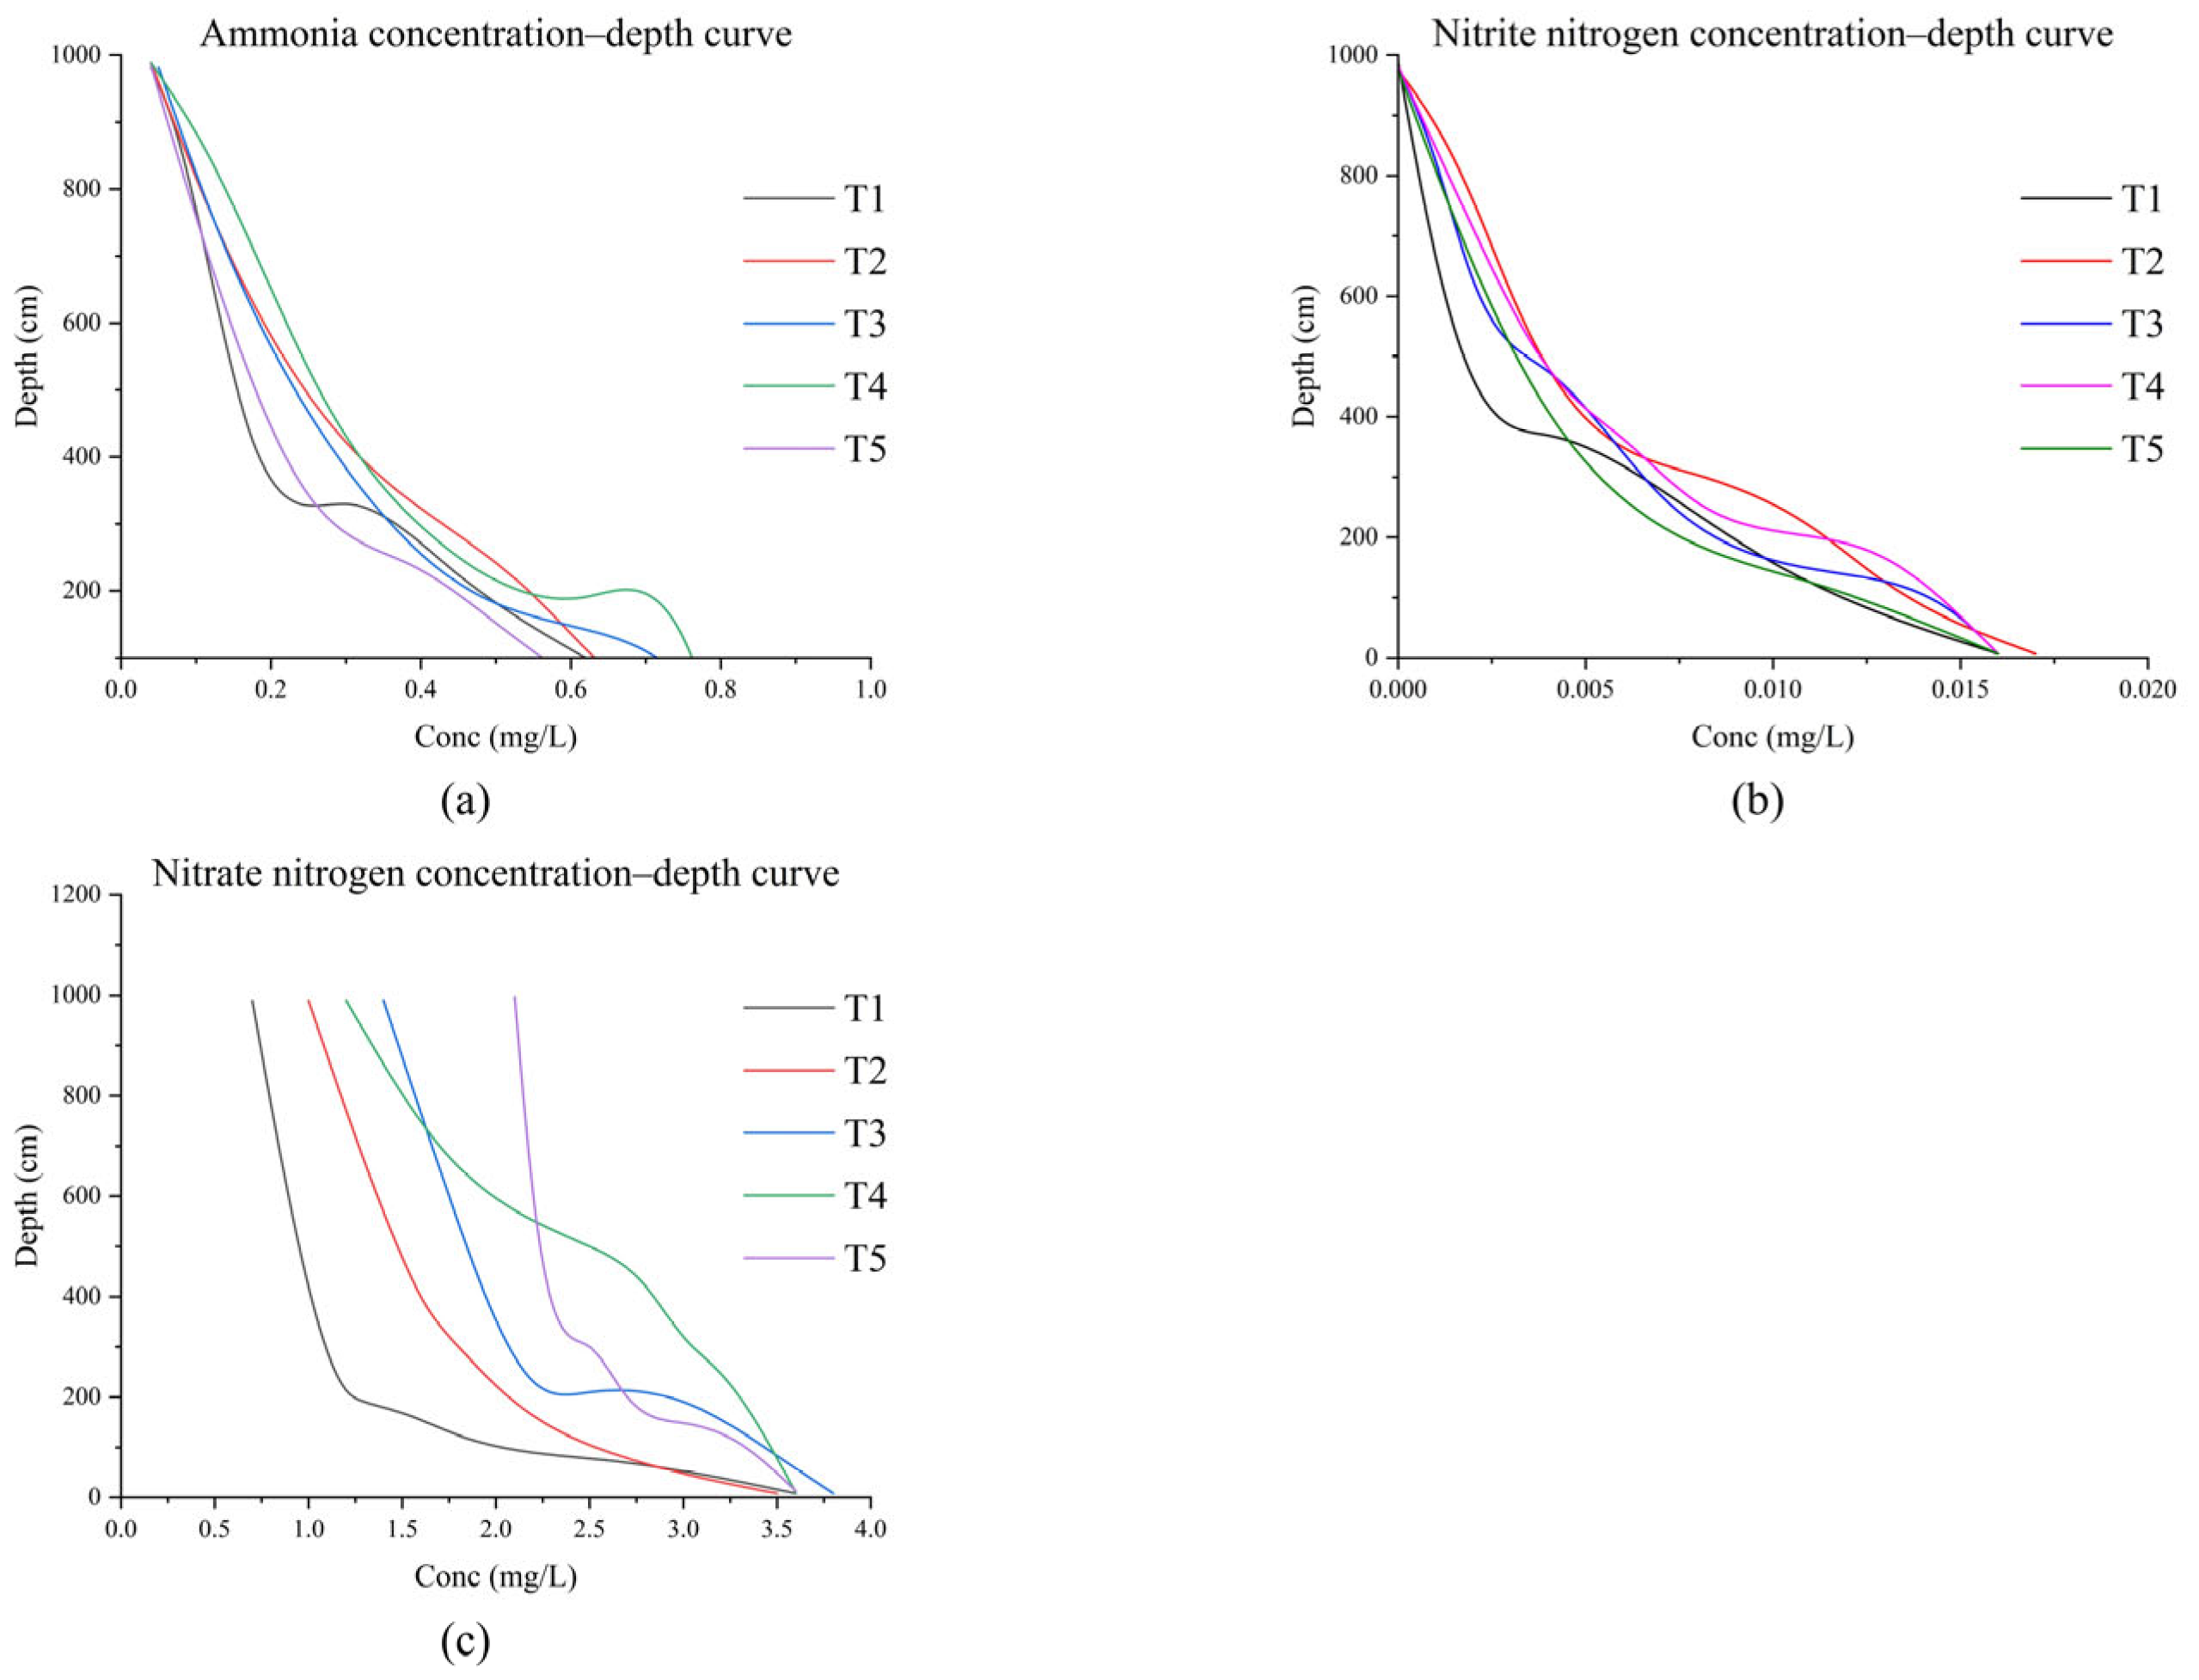
Based on the soil profile infographic, one can see the variation in the solute concentration with the depth of the profile at each output time point. The soil profile nitrogen concentrations with depth curves are shown in
Figure 7.
In
Figure 7, the vertical coordinate represents the depth of the profile, the horizontal coordinate represents the solute concentration, and T1~T5 represent the moments, with T1 representing the 400th day, T2 representing the 800th day, T3 representing the 1200th day, T4 representing the 1600th day, and T5 representing the 2000th day. The ammonia nitrogen concentration decreases with increasing profile depth and eventually penetrates the air envelope into the groundwater. The concentration entering the groundwater is very small due to the adsorption and nitrification reactions; the nitrite nitrogen concentration decreases with increasing profile depth and eventually penetrates the aeration zone into the groundwater.
3.2. Characteristics of Nitrogen Distribution at the Bottom of the Aeration Zone
The various parameters required for the model were entered item by item, and then the Hydrus model was run separately for each partition of the division. Through the post-processing tool on the right side of the Hydrus-1D operation interface, the output concentration of nitrogen at the bottom of the aeration zone can be queried [
36], which can be used as the initial concentration for the subsequent aquifer simulation. The output results of the nitrogen concentration in the 16 partitions are shown in
Table 5. The data presented in
Table 5 have relative errors due to different parameter settings. In
Section 3.3: Fitting of the water flow field and
Section 3.4: Nitrogen concentration field fitting, the water flow field and nitrogen are fitted; as seen in
Figure 8 and
Figure 9, the fit is better, indicating that the parameters are set reasonably well.
Table 5.
Nitrogen concentration at the bottom of the aeration zone (mg/L).
Table 5.
Nitrogen concentration at the bottom of the aeration zone (mg/L).
| No. | NH4-N | NO2-N | NO3-N | No. | NH4-N | NO2-N | NO3-N |
|---|
| Aa122f | 0.046 | 0.00023 | 2.10 | Bc121f | 0.014 | 0.00029 | 3.37 |
| Aa112f | 0.030 | 0.00020 | 1.09 | Ca232x | 0.006 | 0.00043 | 7.43 |
| Aa232x | 0.006 | 0.00020 | 5.89 | Ca231x | 0.009 | 0.00031 | 6.98 |
| Ba122f | 0.030 | 0.00022 | 3.37 | Cc232x | 0.032 | 0.00045 | 4.06 |
| Bc122f | 0.028 | 0.00021 | 3.15 | Ca232x | 0.006 | 0.00043 | 7.43 |
| Ca112f | 0.033 | 0.00027 | 0.57 | Bb122x | 0.01 | 0.00034 | 2.75 |
| Ba132f | 0.038 | 0.00037 | 4.07 | Cb232x | 0.013 | 0.00022 | 8.12 |
| Ba111f | 0.020 | 0.00013 | 0.51 | Ca232x | 0.006 | 0.00043 | 7.43 |
According to the output results combined with the comprehensive zoning map of the model parameters in the study area, the concentration of ammonia nitrogen at the bottom of the air envelope in the study area is higher in the southwestern part; the nitrate concentration is higher in the northeastern part; and the nitrite nitrogen concentration does not change much across the whole range of the study area. Combined with the distribution of surface soil nitrogen in the Wei River area described in the previous section, it can be seen that the distribution of nitrogen concentration output from the bottom of the aeration zone is basically the same, which indicates that nitrogen pollutants are transported vertically in the aeration zone of the Wei River.
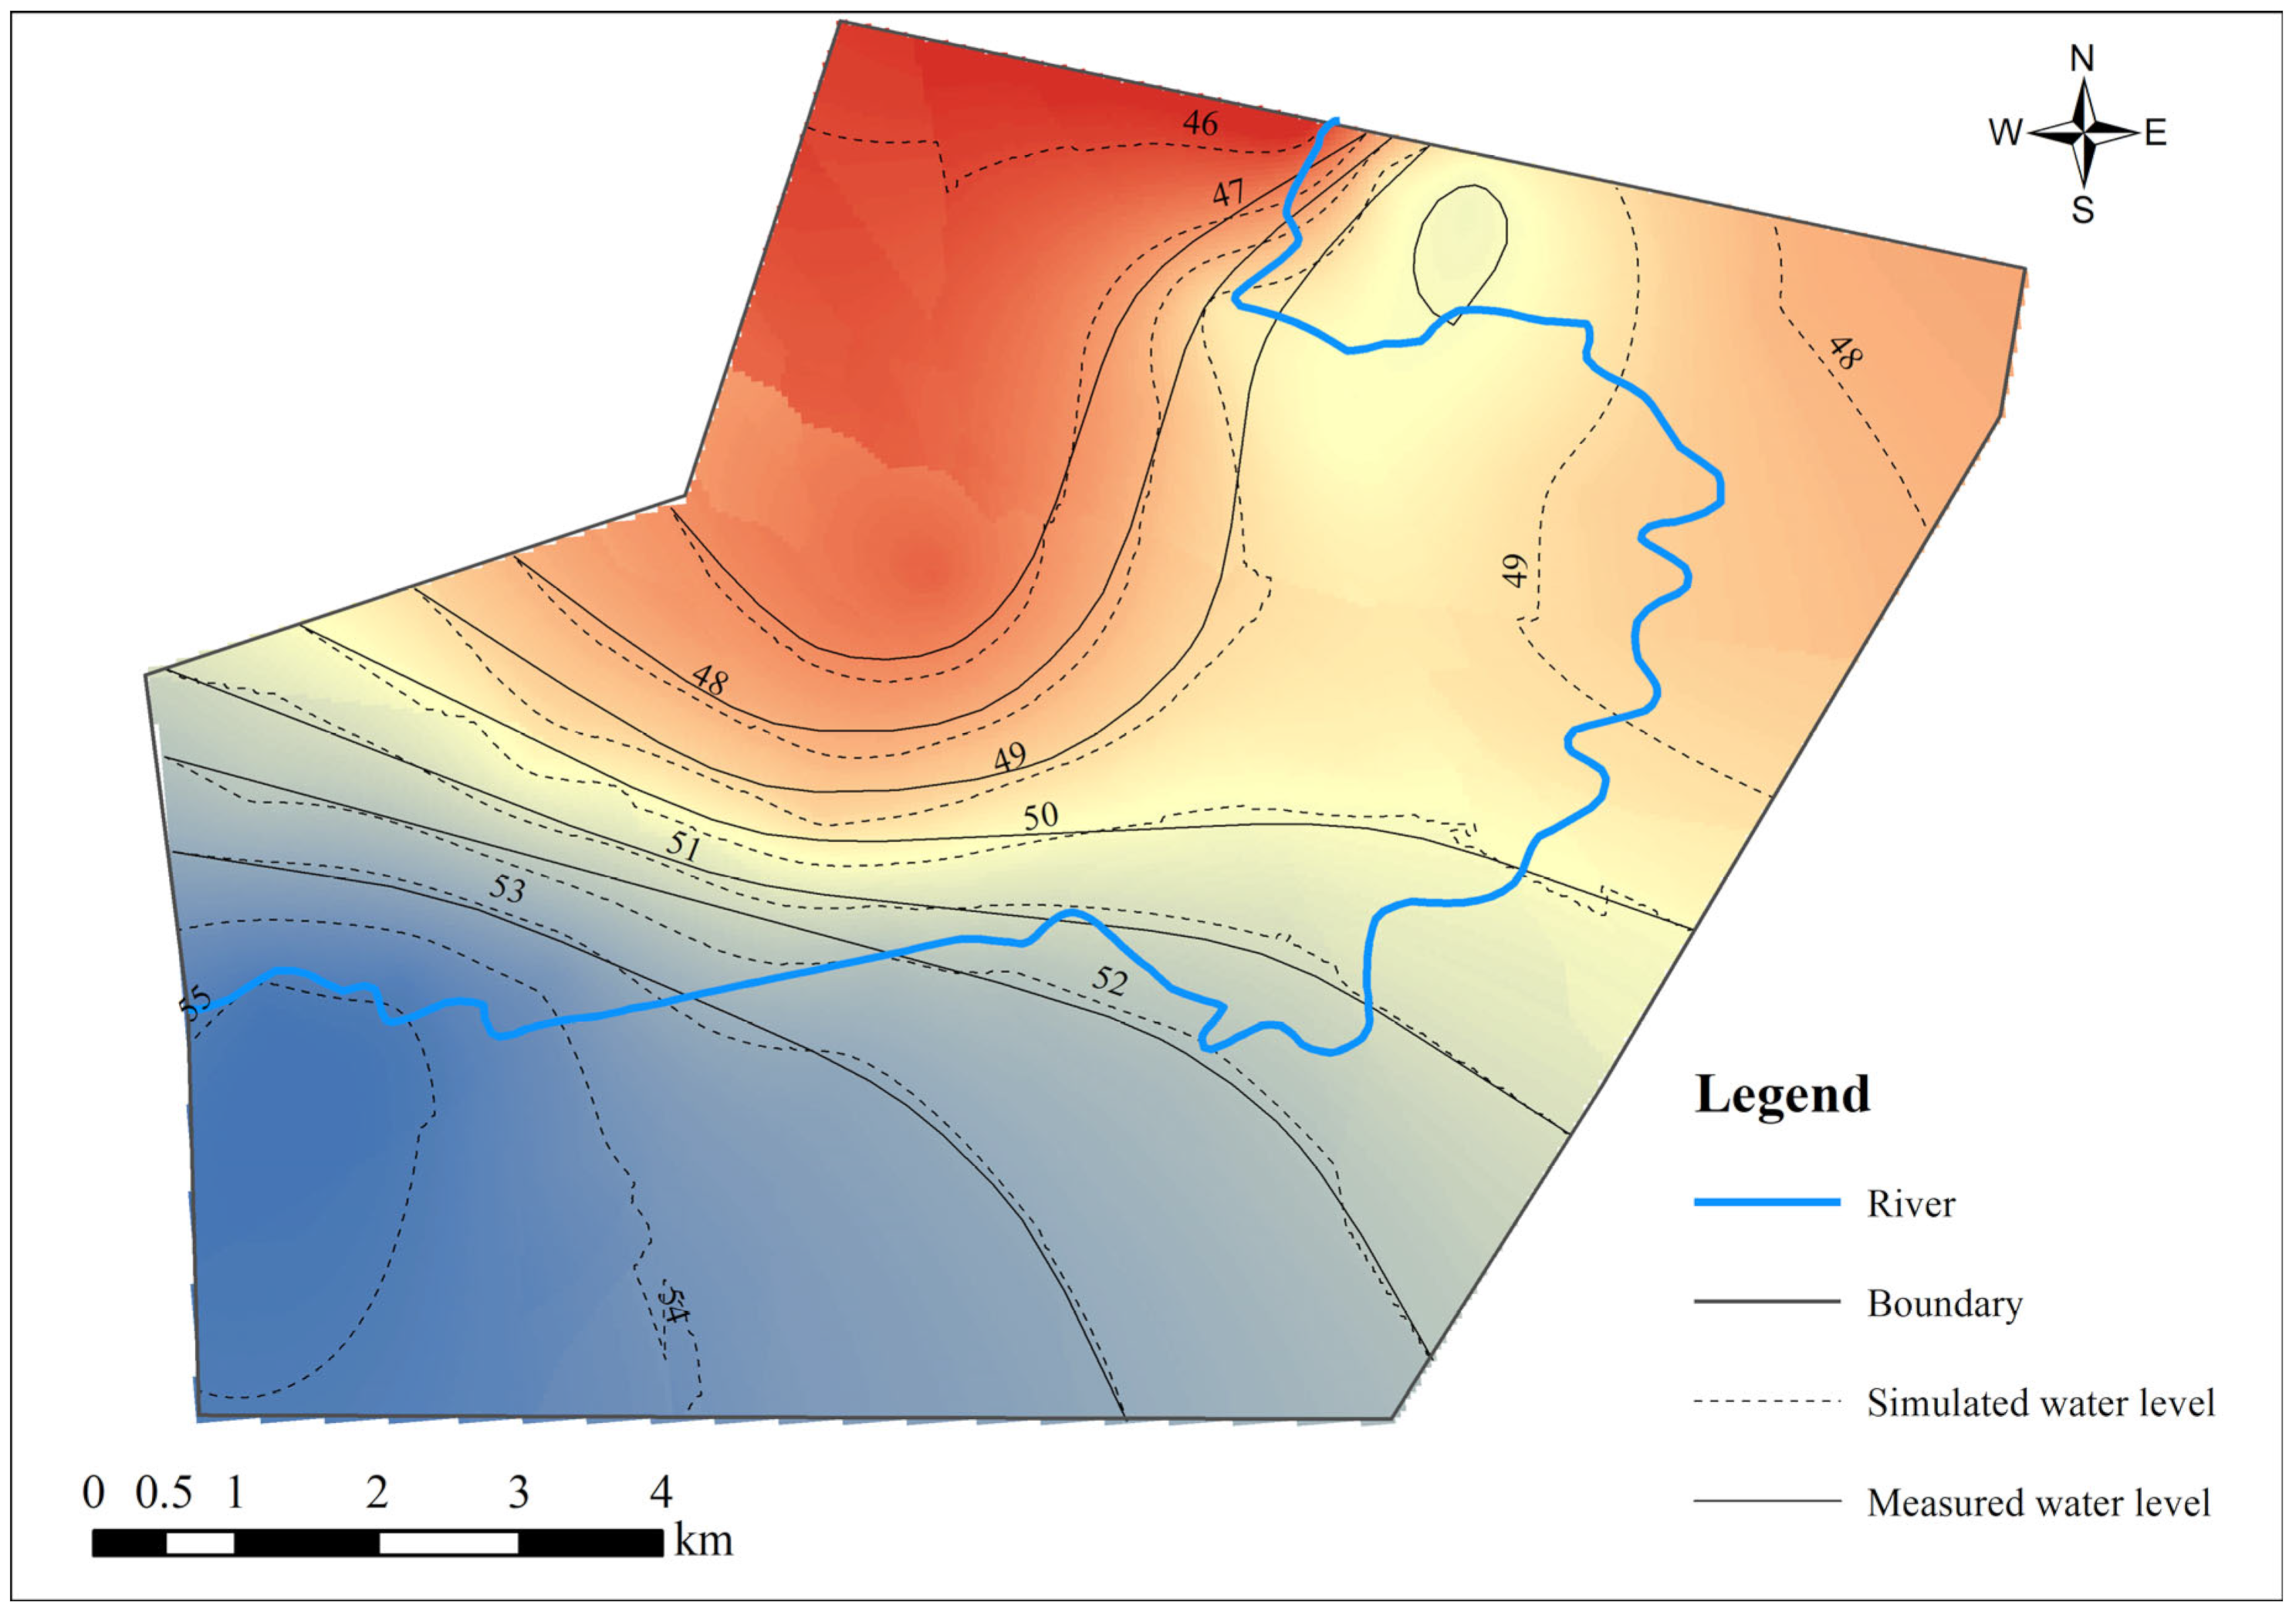
3.3. Fitting of the Water Flow Field
The measured shallow groundwater flow measured in September 2022 was used as the initial flow field of the numerical groundwater flow model; the simulation period was 90 days, and the results of the simulated flow field were fitted with the actual groundwater flow field [
37,
38]. The fitting diagrams are shown in
Figure 8. It can be seen from the diagrams that the groundwater flow field in the study area is well fitted and the error of the water level at each node is relatively small, which shows that the geological structure of the aquifer, the generalisation of the boundary conditions, and the selection of the hydrogeological parameters are reasonable in the simulation process.
As can be seen from the figure, the groundwater flow field of the model is consistent with the actual flow field, and the concentration difference between the simulated water level and the actual water level is less than 1 m, meeting the requirement of accuracy. This indicates that the model is consistent with the hydrogeological situation of the study area and truly reflects the characteristics of the actual groundwater flow field.
3.4. Nitrogen Concentration Field Fitting
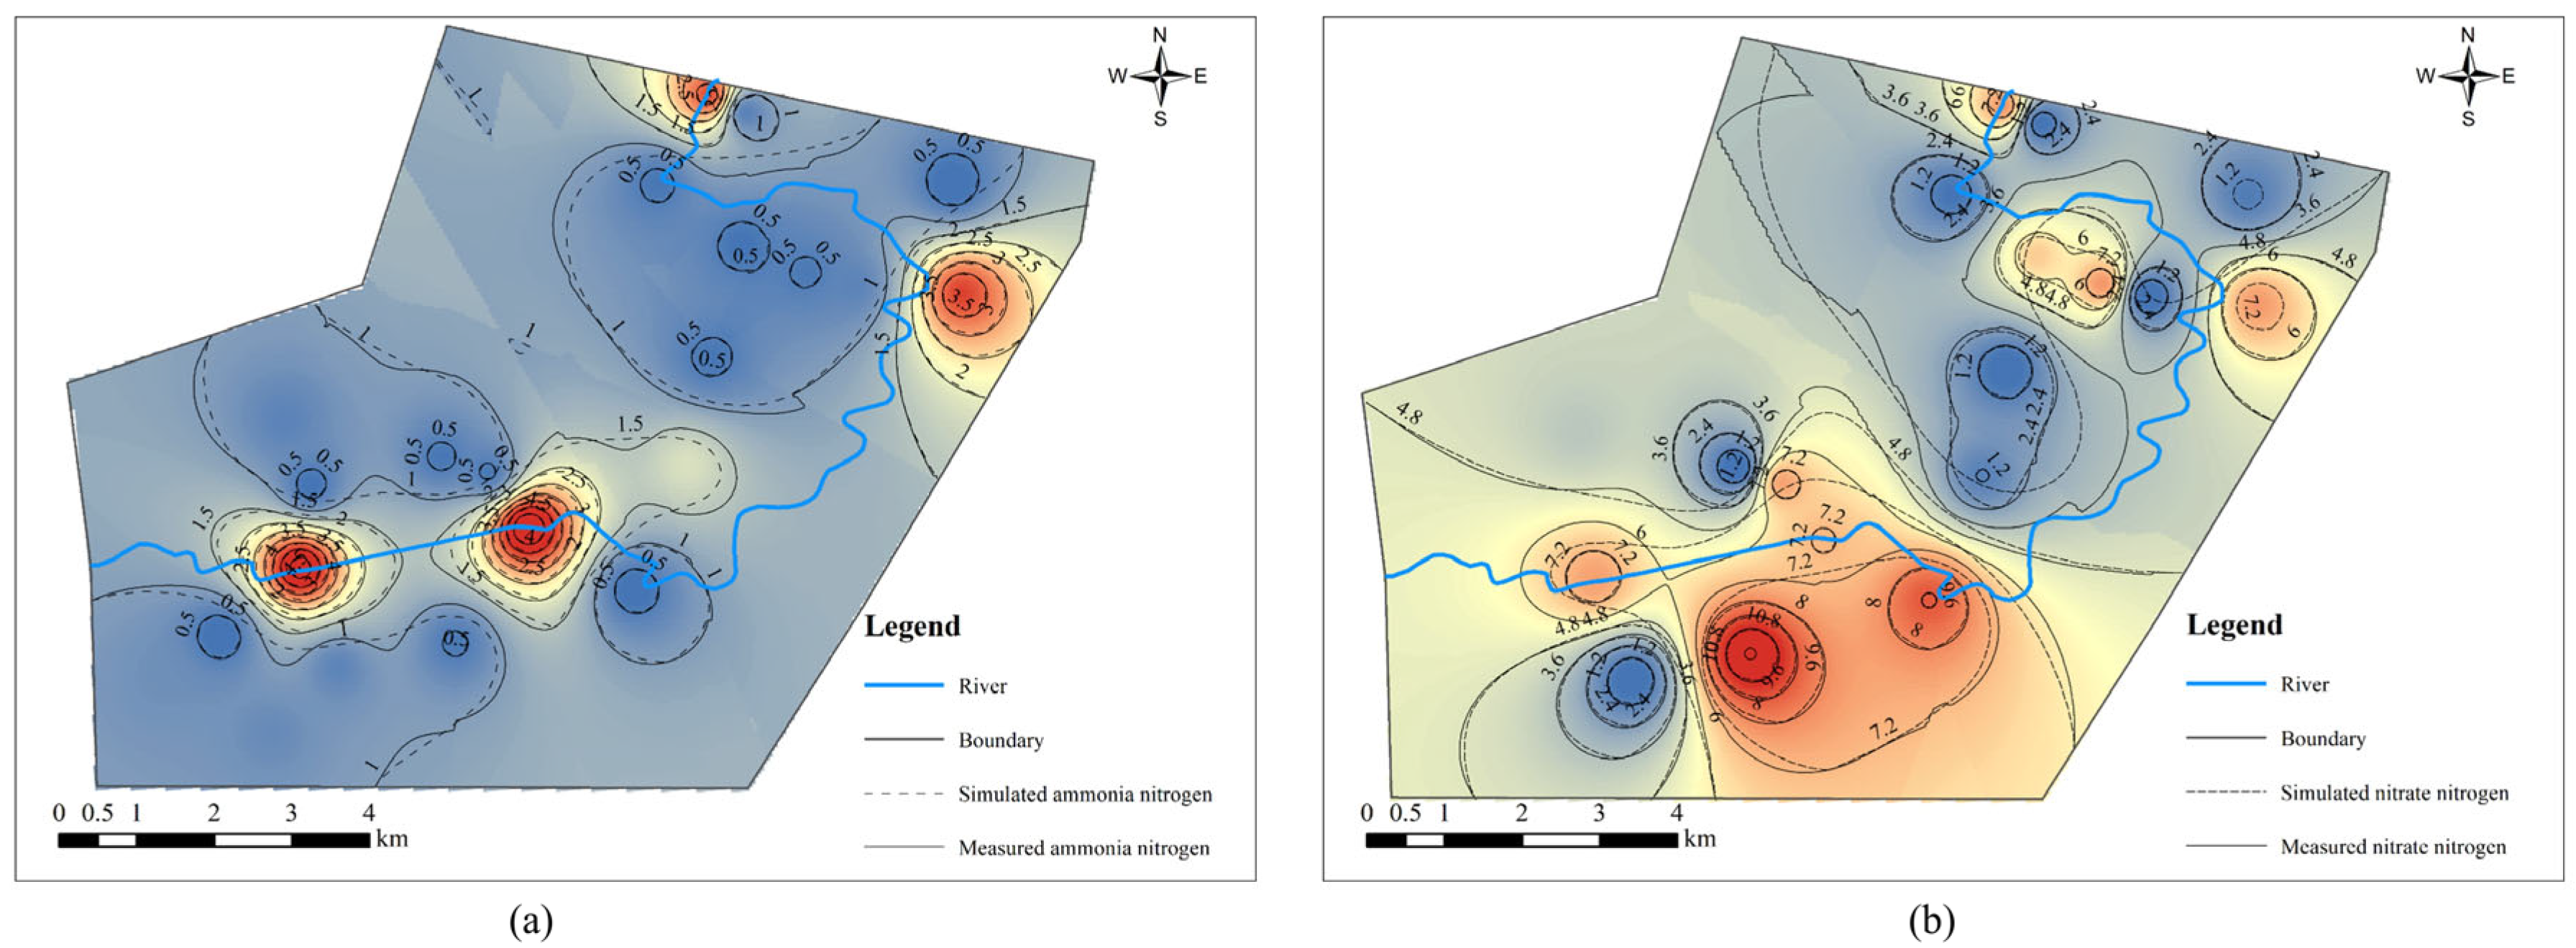
The nitrogen concentration measured in September 2022 was selected as the initial concentration for the solute transport model of the aquifer in the study area, which was fitted based on the measured concentration in December 2022. The results of the fitting are shown in
Figure 9.
Due to the limited information from the observation wells, only the groundwater nitrogen fitting of the submerged aquifer in the study area was analysed. As can be seen from the figure, the simulated concentration field of nitrogen in the submerged aquifer in the study area fits well with the measured concentration field.
The results of the groundwater flow field simulated using the aquifer model for the Wei River area coincide with the actual flow field, and the results of the simulated nitrogen concentration field also fit well with the actual concentration field. This indicates that the model truly reflects the characteristics of the actual groundwater flow field and nitrogen concentration field in the study area, and that the results of the model calculations are reliable.
3.5. Calculation of the Equalised Rate of Contribution
The contribution rate of nitrogen from different pollution sources is defined as the percentage of nitrogen recharge from a single pollution source to the total nitrogen recharge from all pollution sources at a given time [
39]. From this, the formula for the contribution rate of nitrogen from different pollution sources was obtained as:
In the formula:
Q—nitrogen recharge from individual sources (kg);
X—vertical infiltration nitrogen recharge (kg);
Y—nitrogen recharge from rivers (kg);
P—net recharge of nitrogen exchange between the southern and northern parts of the Wei River, since these regions transport nitrogen from the south to the north. P = 0 when calculating the southern part of the Wei River; the specific value of P when calculating the northwestern part of the river is shown in
Table 6.
According to the results of the model operation, the simulated data were statistically collated to obtain the nitrogen recharge from different sources of pollution in the south and north of the Wei River, respectively. The calculation results are shown in
Table 6.
From the table, it can be seen that the ammonia nitrogen in the groundwater in the northern part of the Wei River mainly comes from vertical infiltration, with a contribution rate of 60.02%, followed by river recharge with a contribution rate of 35.82%. A small amount of nitrogen comes from the nitrogen exchange between the two districts, with a contribution rate of only 4.16%. Nitrite nitrogen is mainly derived from vertical infiltration with a contribution of 60.98%, followed by riverine recharge with a contribution of 34.52%. The net nitrogen exchange recharge in the two zones is low, with a contribution of only 4.5%. Nitrate nitrogen, mainly derived from vertical infiltration, had a contribution of 65.35%, followed by riverine recharge with a contribution of 29.34%, and net nitrogen exchange in the two zones with a low contribution of 5.31%. The calculation of the contribution rate in the northern part of the Wei River coincides with the actual situation, and the nitrogen in the groundwater mainly comes from rainfall and the use of nitrogen fertilisers on farmland, which is a source of vertical infiltration recharge in addition to the poor water quality of the river and serious exceedance of nitrogen concentrations, which also pollute the groundwater.
The ammonia nitrogen in the groundwater of the southern part of the Wei River mainly comes from vertical infiltration, with a contribution rate as high as 95.82%, followed by river recharge with a contribution rate of 4.18%. The nitrite nitrogen and nitrate nitrogen levels are similar to that of ammonia nitrogen, with vertical infiltration contributing 92.41% and 94.26%, respectively, and river recharge contributing 7.59% and 5.74%, respectively. It can be seen that almost all of the nitrogen in the groundwater in the southern part of the Wei River comes from rainfall and the use of nitrogen fertiliser on farmland in the study area, which is a source of vertical infiltration, and a small amount of nitrogen comes from the river.
In summary, the main sources of nitrogen in the groundwater in the study area are vertical infiltration and river recharge. The section of the Wei River examined in this study contains sewage, and the pollution of the water is very serious. The nitrogen concentration level is also seriously increased. There is a hydraulic connection between the Wei River and the groundwater, and the river discharge is significant, which strongly contributes to the nitrogen pollution in the study area. At the same time, the coarser lithological particles in the Wei River region’s aeration zone aggravate the entry of pollutants from surface sources into the groundwater, so the vertical infiltration of nitrogen in this region contributes considerably to groundwater pollution.
4. Conclusions
This study identified the hydrogeological characteristics of groundwater and surface water and typical pollutants in the study area through a field survey, data collection, field sampling, and analysis. Zoning was used to delineate the vertical infiltration of pollutants in the surface layer of the study area, and the water flow and solute transport model of the aeration zone were established using Hydrus-1D 4.16.0110 software in order to obtain the water volume and nitrogen concentration output from the bottom of the aeration zone. These values were then used to determine the water volume and nitrogen concentration entering the aquifer. MODFLOW software was used to simulate the nitrogen migration process in the aquifer, and, finally, the equalised method was used to calculate the contribution rate of the groundwater nitrogen sources. Through the analysis and discussion of the simulation results, the following conclusions were drawn:
(1) According to the simulation results from the Hydrus surface pollution source vertical infiltration model, the concentration of ammonia nitrogen at the bottom of the aeration zone in the study area was higher in the southwest, with a concentration range of 0.006 mg/L~0.046 mg/L. The nitrite nitrogen concentration did not change significantly across the study area, with a concentration range of 0.00013 mg/L~0.00045 mg/L. Moreover, the nitrate concentration was higher in the northeast of the study area, ranging from 0.51 mg/L to 8.12 mg/L. Combined with the distribution of nitrogen concentration in the surface soil of the Wei River area, it can be seen that the distribution of nitrogen concentration was basically the same as that exported from the bottom of the aeration zone, and the nitrogen pollutants mainly migrated vertically in the airbag zone.
(2) The calculation of the contribution rate of the groundwater nitrogen sources in the study area shows that the nitrogen in the northern part of the Wei River mainly comes from vertical infiltration, river recharge, and nitrogen exchange between the two areas; of these, the contribution rates of ammonia nitrogen sources are 60.02%, 5.86%, and 4.16%; the contribution rates of nitrite nitrogen sources are 60.98%, 34.52%, and 4.50%; and the contribution rates of nitrate nitrogen sources are 65.35%, 29.34%, and 5.31%. The groundwater nitrogen in the southern part of the Wei River mainly comes from vertical infiltration and river recharge, which, for ammonia nitrogen, contribute 95.82% and 4.18%; for nitrite nitrogen, contribute 92.41% and 7.59%; and for nitrate nitrogen, contribute 94.26% and 5.74%.
The process of nitrogen transport and transformation is extremely complex and the sources of contamination are varied; thus, further research should be carried out on the specific sources of groundwater nitrogen contamination. Isotope detection, combined with the use of tracers, could be used to identify the sources of groundwater nitrogen pollution more clearly and accurately.
In order to protect groundwater resources and prevent nitrogen pollution from deteriorating the water quality in the Wei River area even more, the following targeted pollution management proposals are put forward: the intensity of the pollution management of the surface water of the Wei River should be increased so as to alleviate the load of nitrogen pollution at source, which will effectively reduce the nitrogen pollution in the aquifer through the recharge of the river. Polluted surface water can be purified using biotechnology; aquatic plant restoration technology has been shown to demonstrate good purification effects. The treatment of surface water nitrogen pollution can effectively reduce the contribution of recharge from the Wei River to the aquifer. Moreover, it is very important to control the surface sources of pollution in the study area; the control of the amount and frequency of nitrogen fertiliser used in agricultural land in the study area will effectively reduce the pollution of the groundwater due to vertical infiltration from the surface.
Author Contributions
Conceptualisation, Y.L. and Z.L.; methodology, Y.L., J.Q., Z.L. and J.W.; validation, Y.L. and Z.L.; writing—original draft preparation, Y.L. and Z.L.; writing—review and editing, Y.L., Z.L. and J.Q.; visualisation, Z.L., S.X., J.W. and J.Q.; supervision, J.Q. and S.X. All authors have read and agreed to the published version of the manuscript.
Funding
The study was financially supported by the Graduate education reform and quality improvement project in Henan province (HNYJS2020JD01), Higher education teaching reform research and practice project (Degree and Graduate Education) general project in Henan province (2021SJGLX073Y) (2021SJGLX075Y) (2023SJGLX115Y), and the master’s degree innovation ability improvement project of NCWU (NCWUYC-2023035).
Data Availability Statement
Data are contained within the article.
Conflicts of Interest
The authors declare no conflicts of interest.
References
- Amina, R.; Sami, T.; Meriem, F. Recent advances in the source identification and remediation techniques of nitrate contaminated groundwater: A review. J. Environ. Manag. 2022, 316, 115265. [Google Scholar]
- Zuo, R.; Zheng, S.; Liu, X.; Wu, G.; Wang, S.; Wang, J.; Zhai, Y. Groundwater table fluctuation: A driving force affecting nitrogen transformation in nitrate-contaminated groundwater. J. Hydrol. 2023, 621, 129606. [Google Scholar] [CrossRef]
- Abascal, E.; Gómez, L.; Ortiz, I.; Ortiz, A. Global diagnosis of nitrate pollution in groundwater and review of removal technologies. Sci. Total Environ. 2021, 810, 152233. [Google Scholar] [CrossRef] [PubMed]
- Wang, X.; Xu, Y.; Zhang, L. Watershed scale spatiotemporal nitrogen transport and source tracing using dual isotopes among surface water, sediments and groundwater in the Yiluo River Watershed, Middle of China. Sci. Total Environ. 2022, 833, 155180. [Google Scholar] [CrossRef] [PubMed]
- Margalef-Marti, R.; Carrey, R.; Viladés, M.; Jubany, I.; Vilanova, E.; Grau, R.; Soler, A.; Otero, N. Use of nitrogen and oxygen isotopes of dissolved nitrate to trace field-scale induced denitrification efficiency throughout an in-situ groundwater remediation strategy. Sci. Total Environ. 2019, 686, 709–718. [Google Scholar] [CrossRef] [PubMed]
- Zuo, R.; Jin, S.; Chen, M.; Guan, X.; Wang, J.; Zhai, Y.; Teng, Y.; Guo, X. In-situ study of migration and transformation of nitrogen in groundwater based on continuous observations at a contaminated desert site. J. Contam. Hydrol. 2018, 211, 39–48. [Google Scholar] [CrossRef] [PubMed]
- Li, Y.; Bai, G.; Zhou, X.; Qu, J.; Wang, L. Nitrogen Migration and Transformation Mechanism in the Groundwater Level Fluctuation Zone of Typical Medium. Water 2021, 13, 3626. [Google Scholar] [CrossRef]
- Ming, X.; Groves, C.; Wu, X.; Chang, L.; Zheng, Y.; Yang, P. Nitrate migration and transformations in groundwater quantified by dual nitrate isotopes and hydrochemistry in a karst World Heritage site. Sci. Total Environ. 2020, 735, 138907. [Google Scholar] [CrossRef] [PubMed]
- Shalev, N.; Burg, A.; Gavrieli, I.; Lazar, B. Nitrate contamination sources in aquifers underlying cultivated fields in an arid region—The Arava Valley, Israel. Appl. Geochem. 2015, 63, 322. [Google Scholar] [CrossRef]
- Balkhair, K.S. Modeling fecal bacteria transport and retention in agricultural and urban soils under saturated and unsaturated flow conditions. Water Res. 2017, 110, 313–320. [Google Scholar] [CrossRef]
- Gupta, A.; Gupta, M.; Srivastava, P.K.; Petropoulos, G.P.; Singh, R.K. Potassium Simulation Using HYDRUS-1D with Satellite-Derived Meteorological Data under Boro Rice Cultivation. Sustainability 2023, 15, 2147. [Google Scholar] [CrossRef]
- Yang, T.; Šimůnek, J.; Mo, M.; Mccullough-Sanden, B.; Cherchian, S.; Wu, L. Assessing salinity leaching efficiency in three soils by the HYDRUS-1D and -2D simulations. Soil Tillage Res. 2019, 194, 104342. [Google Scholar] [CrossRef]
- Wang, X.; Zhao, Y.; Liu, H.; Xiao, W.; Chen, S. Evaluating the Water Holding Capacity of Multilayer Soil Profiles Using Hydrus-1D and Multi-Criteria Decision Analysis. Water 2020, 12, 773. [Google Scholar] [CrossRef]
- Ramos, T.B.; Šimůnek, J.; Gonçalves, M.C.; Martins, J.C.; Prazeres, A.; Castanheira, N.L.; Pereira, L.S. Field evaluation of a multicomponent solute transport model in soils irrigated with saline water of the article. J. Hydrol. 2011, 407, 129–144. [Google Scholar] [CrossRef]
- Zhan, J.; Li, W.; Li, Z.; Zhao, G. Indoor experiment and numerical simulation study of ammonia-nitrogen migration rules in soil column. AJ. Groundw. Sci. Eng. 2018, 6, 205–219. [Google Scholar]
- Lyazidi, R.; Hessane, M.A.; Moutei, J.F.; Bahir, M. Developing a methodology for estimating the groundwater levels of coastal aquifers in the Gareb-Bourag plains, Morocco embedding the visual MODFLOW techniques in groundwater modeling system. Groundw. Sustain. Dev. 2020, 11, 100471. [Google Scholar] [CrossRef]
- Zhang, H.; Hiscock, K.M. Modelling the effect of forest cover in mitigating nitrate contamination of groundwater: A case study of the Sherwood Sandstone aquifer in the East Midlands, UK. J. Hydrol. 2011, 399, 212–225. [Google Scholar] [CrossRef]
- Sith, R.; Watanabe, A.; Nakamura, T.; Yamamoto, T.; Nadaoka, K. Assessment of water quality and evaluation of best management practices in a small agricultural watershed adjacent to Coral Reef area in Japan. Agric. Water Manag. 2019, 213, 659–673. [Google Scholar] [CrossRef]
- GB3838-2002; Environmental Quality Standards for Surface Water. Standards Press of China: Beijing, China, 2002.
- GB/T 14848-2017; Standard for Groundwater Quality. Standards Press of China: Beijing, China, 2017.
- Forkutsa, I.; Sommer, R.; Shirokova, Y.; Lamers, J.; Kienzler, K.; Tischbein, B.; Martius, C.; Vlek, P.L.G. Modeling irrigated cotton with shallow groundwater in the Aral Sea Basin of Uzbekistan: II. Soil salinity dynamics. Irrig. Sci. 2009, 27, 331–346. [Google Scholar] [CrossRef]
- Anlauf, R.; Schaefer, J.; Kajitvichyanukul, P. Coupling HYDRUS-1D with ArcGIS to estimate pesticide accumulation and leaching risk on a regional basis. J. Environ. Manag. 2018, 217, 980–990. [Google Scholar] [CrossRef] [PubMed]
- Kumar, S.; Sangeetha, B. Assessment of ground water quality in Madurai city by using geospatial techniques. Groundwater Sustain. Dev. 2020, 10, 100297. [Google Scholar] [CrossRef]
- Bal, M.; Dandpat, A.K.; Naik, B. Hydrological Modeling with respect to Impact of Land-Use and Land-Cover Change on the Runoff Dynamics in Budhabalanga River Basing using ArcGIS and SWAT Model. Remote Sens. Appl.-Soc. Environ. 2021, 23, 100527. [Google Scholar] [CrossRef]
- Wang, G.; Tariq, M.; Liang, W.; Wan, J.; Peng, C.; Zhang, W.; Cao, X.; Lou, Z. A comparative and modeled approach for three biochar materials in simultaneously preventing the migration and reducing the bioaccessibility of heavy metals in soil: Revealing immobilization mechanisms. Environ. Pollut. 2022, 309, 119792. [Google Scholar] [CrossRef]
- Bao, Q.; Jun, Y. Saturated-unsaturated groundwater modeling using 3D Richards equation with a coordinate transform of nonorthogonal grids. Appl. Math. Model. 2017, 50, 39–52. [Google Scholar]
- Diaw, E.B.; Lehmann, F.; Ackerer, P. One-dimensional simulation of solute transfer in saturated–unsaturated porous media using the discontinuous finite elements method. J. Contam. Hydrol. 2001, 51, 197–213. [Google Scholar] [CrossRef] [PubMed]
- Qing, C.; Wen, X.; Yan, N. Numerical Modeling of Three Dimension Groundwater Flow in Tongliao (China). Procedia Eng. 2011, 24, 638–642. [Google Scholar]
- Sathe, S.S.; Mahanta, C. Groundwater flow and arsenic contamination transport modeling for a multi aquifer terrain: Assessment and mitigation strategies. J. Environ. Manag. 2019, 231, 166–181. [Google Scholar] [CrossRef]
- Lee, M.S.; Lee, K.K. Nitrogen transformation and transport modeling in groundwater aquifers. Ecol. Model. 2006, 192, 143–159. [Google Scholar] [CrossRef]
- Shultz, C.D.; Bailey, R.T.; Gates, T.K.; Heesemann, B.E.; Morway, E.D. Simulating selenium and nitrogen fate and transport in coupled stream-aquifer systems of irrigated regions. J. Hydrol. 2018, 560, 512–529. [Google Scholar] [CrossRef]
- Ming, W.; Jing, F.W.; Jie, L.; Ji, C.W.; Chun, M.Z. Effect of groundwater quality on sustainability of groundwater resource: A case study in the North China Plain. J. Contam. Hydrol. 2015, 179, 132–147. [Google Scholar]
- Coelho, C.; Faria, A.C.; Marques, E.A. Comparative analysis of different boundary conditions and their influence on numerical hydrogeological modeling of Palmital watershed, southeast Brazil. J. Hydrol.-Reg. Stud. 2017, 12, 210–219. [Google Scholar] [CrossRef]
- Guo, S.S.; Wu, H.; Tian, Y.Q.; Chen, H.X.; Wang, Y.; Yang, J.Y. Migration and fate of characteristic pollutants migration from an abandoned tannery in soil and groundwater by experiment and numerical simulation. Chemosphere 2021, 271, 129552. [Google Scholar] [CrossRef] [PubMed]
- Leju, J.; Zhang, D. Modeling atrazine transport in soil columns with HYDRUS-1D. Water Sci. Eng. 2011, 4, 258–269. [Google Scholar]
- González, M.G.; Ramos, T.B. Modelling soil water dynamics of full and deficit drip irrigated maize cultivated under a rain shelter. Biosyst. Eng. 2015, 132, 1–18. [Google Scholar] [CrossRef]
- Chen, S.M.; Liu, F.T.; Liu, F.T.; Zhang, Z.; Zhang, Q.; Wang, W. Changes of groundwater flow field of Luanhe River Delta under the human activities and its impact on the ecological environment in the past 30 years. China Geol. 2021, 4, 455–462. [Google Scholar] [CrossRef]
- Hudak, P.F. Effective contaminant detection networks in uncertain groundwater flow fields. Waste Manag. 2001, 21, 309–312. [Google Scholar] [CrossRef]
- Minet, E.P.; Goodhue, R.; Meier-Augenstein, W.; Kalin, R.M.; Fenton, O.; Richards, K.G.; Coxon, C.E. Combining stable isotopes with contamination indicators: A method for improved investigation of nitrate sources and dynamics in aquifers with mixed nitrogen inputs. Water Res. 2017, 124, 85–96. [Google Scholar] [CrossRef]
| Disclaimer/Publisher’s Note: The statements, opinions and data contained in all publications are solely those of the individual author(s) and contributor(s) and not of MDPI and/or the editor(s). MDPI and/or the editor(s) disclaim responsibility for any injury to people or property resulting from any ideas, methods, instructions or products referred to in the content. |
© 2024 by the authors. Licensee MDPI, Basel, Switzerland. This article is an open access article distributed under the terms and conditions of the Creative Commons Attribution (CC BY) license (https://creativecommons.org/licenses/by/4.0/).


