Article

A Novel Generalized Clapeyron Equation-Based Model for Capturing the Soil Freezing Characteristics Curve of Saline Soil: Validation by Small Sample Lab and Field Experiments

1
Center for Agricultural Water Research in China, China Agricultural University, Beijing 100083, China
2
College of Water Conservancy & Civil Engineering, Northeast Agricultural University, Harbin 150030, China
3
Department of Geology and Surveying and Mapping, Shanxi Institute of Energy, Jinzhong 030600, China
*
Authors to whom correspondence should be addressed.
Water 2024, 16(5), 670; https://doi.org/10.3390/w16050670
Submission received: 16 January 2024 / Revised: 14 February 2024 / Accepted: 17 February 2024 / Published: 25 February 2024

Abstract

:
The soil freezing characteristic curve (SFCC) describes the relationship between the freezing point and unfrozen water content, which are two critical parameters in depicting the heat, solute, and water transport in frozen soil. In this paper, we propose a novel Generalized Clapeyron Equation (GCE)-based model, the GCE-Salt Model, to better capture the SFCC in frozen soil in the presence of solute. It keeps the matric potential Ψf in the GCE as its original meaning and incorporates the effect of solute potential in the equilibrium freezing temperature. The performance of our GCE-Salt Model was validated by both lab and field experimental data and compared with related models (Combined Model and GCE-Tan Model). The GCE-Salt Model performed exceptionally well in extremely saline soil and it performed well in both non-saline and saline soil. (1) Our GCE-Salt Model could capture the SFCC of non-saline soil equally as well as the Combined Model (NSE = 0.866); (2) our GCE-Salt Model performed similarly well as the Combined Model and a little better than the GCE-Tan Model for the slightly to highly saline soil (NSE ≥ 0.80 for three models); and (3) our GCE-Salt Model (NSE = 0.919) beat the Combined Model (NSE = 0.863) and the GCE-Tan Model (NSE = 0.62) in capturing the SFCC of extremely saline soil, mainly because the inherent expression of our GCE-Salt Model can more accurately capture the freezing point. Our findings highlight the effect of solute potential on the ice–water change and could improve the understanding of the effect of freezing and thawing on the thermal–hydrological processes, structure of saline soil, and landscape evolution in cold regions.

1. Introduction

Understanding soil freezing and thawing is vital in understanding winter evapotranspiration [1], runoff [2], groundwater recharge periodically [3], soil formation [4], predicting the movement of nutrients/contaminants as they seep through frozen layers of soil [5], and landscape evolution [6] in cold regions. The soil pores were expanded by soil frost heaving during the freezing period [7,8,9]. Whereas, the soil pore collapsed along with the ice–water phase change during thawing [4,10,11]. As the soil pore expansion was dominant, after a seasonal freezing–thawing cycle, the soil was less compacted [10] and its porosity increased [4,10]. What is more, the presence of salt will further complicate the influence of freezing and thawing on soil structure and landscape evolution [6]. Therefore, this study focuses on the freezing process of saline soil, which is prevalent in the middle and high latitudes of Asia [12,13,14,15], Europe [16,17], and America [1,12]. However, characterizing the ice–water phase change in saline soil is still challenging due to the complicated interaction between the soil matric potential and the solute potential [13,14].
The soil freezing characteristic curve (SFCC) describes the equilibrium state of the ice–water phase change [15] by illustrating the decline in the liquid volume ratio in the pore space as temperature decreases during the ice–water phase change [16]. As summarized by Bi et al. [17], the models described by the SFCC can be categorized into four types: the theoretical models [18,19,20], the SWCC-based models [12,21,22,23,24,25], the empirical models [26,27,28,29,30,31,32,33,34,35,36,37], and the estimation models [31,38,39]. However, only a few SFCC models have considered the presence of salt or solute [1,14,40,41,42,43,44,45,46]. Wu et al. [14] proposed an improved empirical model by substituting the freezing point of the SFCC model proposed by Xu et al. [47] with the freezing point of the salt solution according to Banin and Anderson [48]. The empirical models could well capture the experimental soils [27] but might be hard to apply to soils of other types [17]. For the theoretical models [43,44], Wang et al. [43] proposed a phase composition model based on the assumption that soil particles are spheres and the unfrozen water covers the spherical soil particles as a thin film. Wan and Yang [44] built a theoretical model considering the soil pore size distribution and the effect of ion concentrations. The theoretical models have gained prominence in recent years [39] because they have clear physical meanings which are based on the pore size distribution of soil [17,18,44,49] or the surface effects of soil particles [18,43,50,51]. However, theoretical models usually possess complicated equations [18,19,20,50].
Whereas, the SWCC-based models integrate the Clapeyron equation with the soil water characteristic curve (SWCC) [12,52,53,54,55,56] based on the similarity of SFCC and SWCC [39] and take advantage of soil hydraulic parameters. Thus, once the soil hydraulic parameters are obtained for a soil, its SFCC could be readily obtained via SWCC-based models. In recent years, some SWCC-based SFCC models have been developed for saline soils. Except for Zhou et al. [42], whose model was based on the Brooks and Corey model [57], most of the existing SWCC-based SFCC models are based on the van Genuchten model. Under low salinity conditions (<1.0% g/g dry soil), Tan et al. [46] proposed an improved GCE model, which excluded the osmotic potential from the total soil water potential [58] in the SWCC before using GCE to predict SFCCs. Wan et al. [59] improved the van Genuchten model-based SFCC model by considering the effect of salt concentration on the ice nucleation and on the freezing point. Amankwah et al. [1] proposed a Combined Model, combining the GCE and a newly developed Salt Exclusion model, to well capture the SFCC of both non-saline and saline soil. However, most of these models are not easily used in actual areas and are still limited to the theoretical level or laboratory. The Combined Model proposed by Amankwah has a clear physical meaning and is handy in application. We found that the salt concentration in the experimental area of this research is smaller than that in our area. There is a lack of modeling under a wider range of salt concentrations.
Based on the GCE, the fundamental improvement in the Combined Model is the (1) expression of the equilibrium freezing temperature Tf as Td + T0 to consider the effect of soil matric potential and (2) replacement of the freezing initiation temperature T0 in the denominator by Tm to consider the effect of solute potential. That is to say, Amankwah et al. [1] regarded the Ψf as the summation of soil matric potential and solute potential but not the original soil matric potential any more. Alternatively, we could keep the Ψf as the soil matric potential and exclude the effect of solute potential in the numerator. Inspired by the expression of the freezing point by Wang et al. [43], we keep the T0 in the denominator as the reference state and consider both the effect of soil matric potential and the effect of solute potential in the numerator, i.e., the equilibrium freezing temperature is T0 + ΔTfm = Tf − ΔTfs.
The objective of this study is to propose a novel model that describes the SFCC considering the solute potential and test the ability of our newly proposed model to capture the ice–water phase change in frozen saline soil, especially, the ability to capture the freezing point of soil pore water at different salinity levels.

2. Materials and Methods

2.1. Modelling

2.1.1. The Combined Model

Amankwah et al. [1] proposed a Combined Model describing the SFCC by combining the conventional GCE model and a new Salt Exclusion Model, considering both the effect of capillary and adsorption and the effect of solute exclusion on the freezing point depression.
(1)
The GCE
Based on the similarity between the SFCC and the SWCC, Amankwah et al. [1] adopted the van Genuchten equation [60] to describe the relationship between the liquid soil water potential and the liquid soil water content as follows:
θ l = θ r + θ s θ r 1 + α ψ l n m
where θl is the volumetric unfrozen water content (cm3∙cm−3), θr is the residual water content (cm3∙cm−3), θs is the saturated soil water content (cm3∙cm−3), Ψl (m) is the matric potential. α is the inverse of the air-entry value (m−1), n is the pore-size distribution index, and m = 1−1/n. Amankwah et al. [1] proposed that the GCE can be expressed as
ψ f = L g ln T f T 0 = L g ln T d + T 0 T 0
where Ψf (m) is soil matric potential, which predicts the liquid water content; Tf (°C) is the equilibrium freezing temperature of soil water; L (J∙kg−1) is the latent heat of fusion; g (m∙s−2) is gravitational acceleration; and T0 (K) is the freezing temperature for free pure water at atmospheric pressure 273.15 K (0 °C). Particularly, Amankwah et al. [1] expressed the equilibrium freezing temperature Tf as Td + T0 to consider the effect of soil matric potential.
Then, Ψl can be expressed as
ψ l = ψ u                                 ,     ψ f ψ u   L g ln T d + T 0 T 0 ,     ψ f < ψ u
where Ψu (m) is the equivalent unfrozen matric potential.
Then, the GCE model can be expressed as
θ l = θ r + θ s θ r 1 + α L f g ln T d + T o T o n m , ψ f < ψ u
(2)
The Salt Exclusion Model
Then, Amankwah et al. [1] proposed a Salt Exclusion Model, describing the freezing point depression because of salt concentrate, considering the saline water concentrated due to the transition of liquid water to ice:
T m = p 1 c 2 + p 2 c
where Tm is the minimum temperature below T0 at which the saline water of a given concentration will freeze. c = cb / (θlθr); cb is the bulk solute concentration in the soil, i.e., the mass of salt per unit volume of soil. The p1 and p2 are fitted parameters obtained by the relationship between freezing point depression and salt concentration and the values of p1 and p2 were found to be −0.00012544 and −0.05561807, respectively. Combining the relationship between c and θl and the relationship between Tm and c, Amankwah et al. [1] obtained the unfrozen water content for a given soil temperature in one bulk solute concentration as
θ l = θ r + 2 c b p 1 p 2 p 2 2 + 4 p 1 T d
(3)
The Combined Model
Amankwah et al. [1] finally obtained the Combined Model by replacing the freezing initiation temperature T0 in the denominator of Equation (4) with Tm (the freezing point considered solute potential) to consider both the effect of soil matric potential and the effect of solute potential on the freezing point depression as follows:
θ l = θ r + θ s θ r 1 + α L f g ln T d + T 0 T m n m

2.1.2. The GCE-Salt Model

Equation (2) expresses the relationship between the matric potential Ψf and the equilibrium freezing temperature Tf (K). Comparing Equations (4) and (7), the fundamental improvement in the Combined Model based on the GCE is the (1) expression of the Tf as Td + T0 to consider the effect of capillary and adsorption and (2) replacement of the T0 in the denominator by Tm to consider the effect of solute potential. That is to say, Amankwah et al. [1] regarded Ψf as the summation of soil matric potential and solute potential but not the original soil matric potential anymore.
Then, we happened to see that Wang et al. [43] express the freezing point Tf (K) as
T f = T 0 + Δ T f m + Δ T f s
where ΔTfm (K) is the freezing point depression induced by soil matric potential when salt concentration c = 0, the same as the Td in the Equation (2), and ΔTfs (K) is the freezing point depression induced by solute potential, the same as the Tm in the Equation (2).
Inspired by Equation (8), we, instead, keep the T0 in the denominator as the reference state and consider both the effect of soil matric potential and the effect of solute potential in the numerator, i.e., the equilibrium freezing temperature is T0 + ΔTfm = Tf − ΔTfs. In other words, we keep the Ψf as the soil matric potential and exclude the effect of solute potential in the numerator. Substituting Td = ΔTfm and T0 + ΔTfm = Tf − ΔTfs into the Equation (2), we obtain
Ψ f = L g ln T 0 + Δ T f m T 0 = L g ln T f Δ T f s T 0
Then, a new expression describing the SFCC is obtained for saline soil as follows:
θ l = θ r + θ s θ r 1 + α L f g ln T f Δ T f s T 0 n m ,   ψ f < ψ u
Assuming the soil salt is purely NaCl, which forms NaCl·H2O when the temperature is below 0.1 °C [43,61], the relationship between the freezing point depression induced by solute concentrate (ΔTfs) and the salt concentration (c) is provided by Wang et al. [43]:
Δ T f s / T * = φ c = i = 0 5 Z i 100 c w i
where z0 = 0, z1 = −0.5697, z2 = −1 × 10⁻³, z3 = −1 × 10⁻⁴, z4 = 2 × 10⁻⁶, and z5 = −8 × 10⁻⁸. T* (=1K) is aimed to normalize the value of temperature and cw (g·L−1) is the salt concentration, i.e., mass of salt per unit volume of water.
Notably, in this study, we assume that the change in solute concentration is only associated with the change in liquid water content change but neglects the transport and redistribution of solute following [1,41]. The structure of soil is assumed as the capillary model, which is the most general physical model when we describe the SFCC in soil [62].

2.2. Lab and Field Experiments

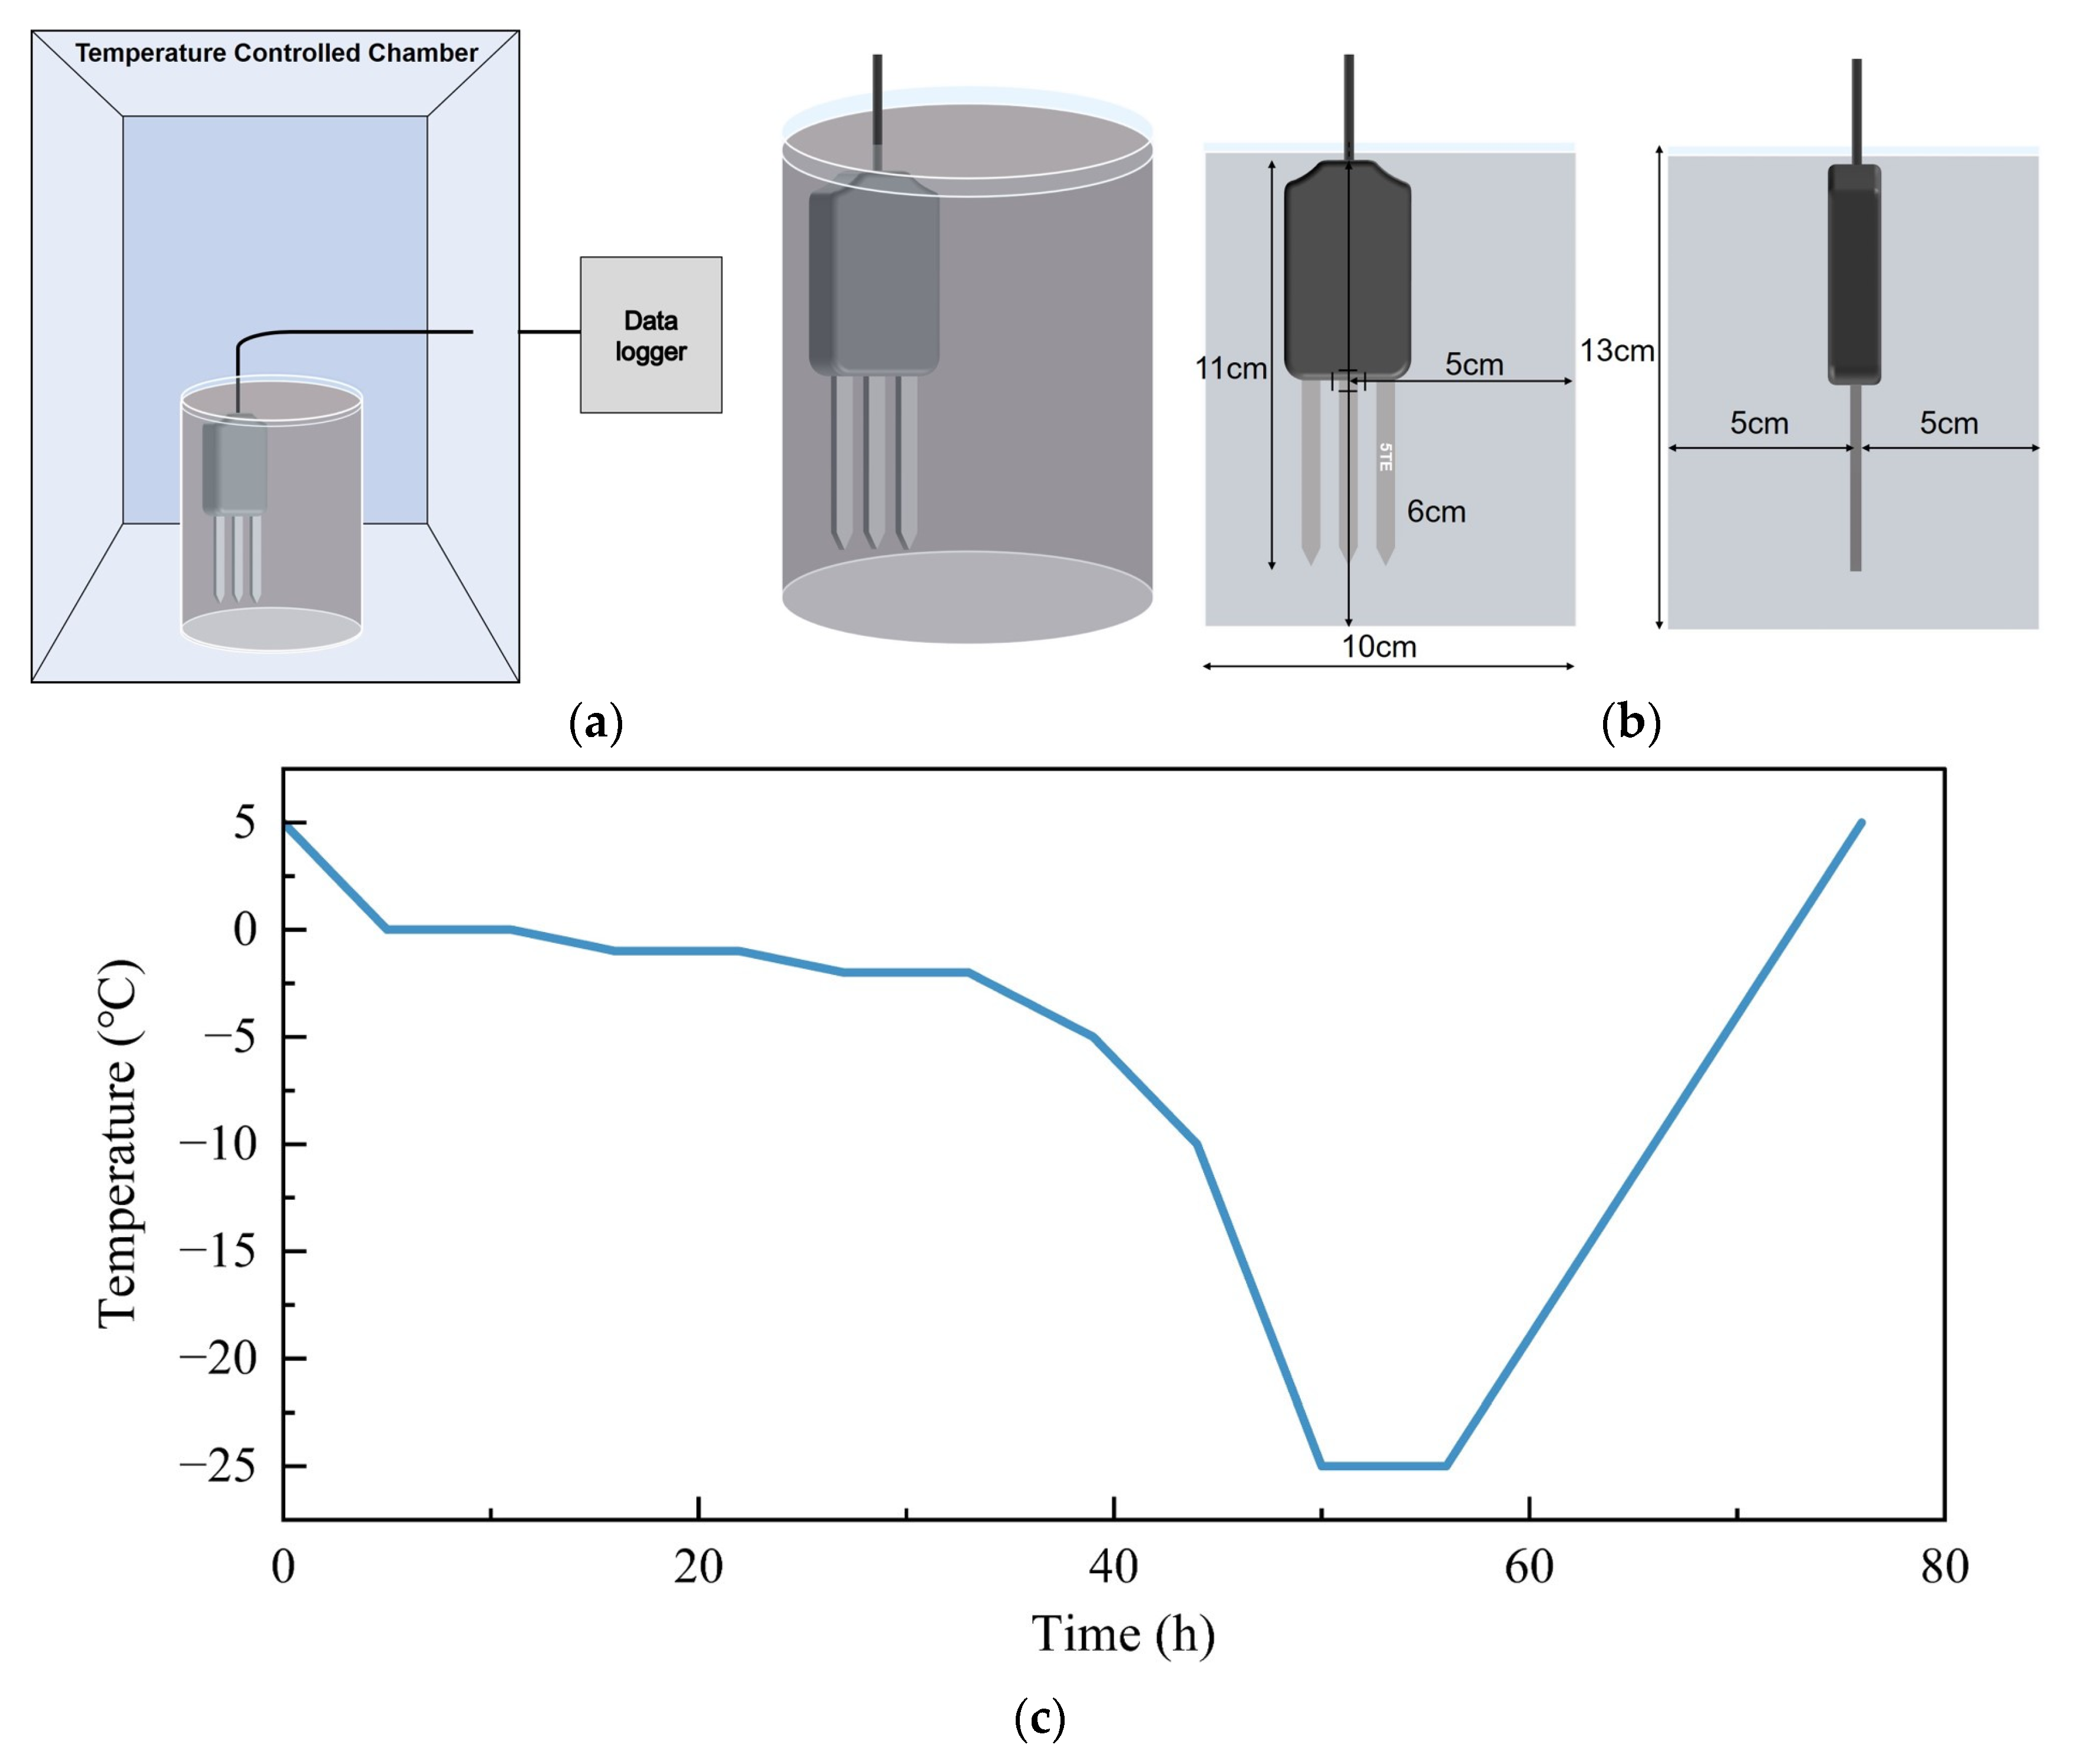
2.2.1. Laboratory Experiments

To test the performance of the proposed GCE-salt model in capturing the SFCC, lab experiments measuring the SFCC of soils of different salinity were conducted. The soil sample was collected from one farmland near the Shahaoqu Experimental Station, in the Hetao Irrigation District, China (about 40.908° N, 107.158° E) (Figure 1), which is mainly planted with wheat. Soil was dug from one agricultural field at the depth of 0 to 20 cm, where salinization was the most serious. This soil sample was classified as a sandy loam according to USDA classification methods. It is the most common soil texture in Hetao Irrigation District. This area is a typical seasonal frozen area [63] and a typical saline arid and semi-arid area due to long-term irrigation [57]. The soil sample was flushed by deionized water to salinity below 0.05% to eliminate the background salinity. After sieving by 2 mm sieve and air-drying, the basic characteristics of the soil sample are shown in Table 1. Four soil samples were mainly used to demonstrate the influence of the salt concentration on the SFCC. The sandy loam (32.6% sand, 61.3% silt, and 6.1% clay) was treated to a target VWC of 0.35 cm3∙cm−3 and four different soil salinities (salinity (SS) = 0%, 0.2%, 0.4%, and 0.6%, equivalent to NaCl concentration (cw) of 0, 0.75, 1.50, and 2.25 g·L−1), which are categorized as non-saline, slightly saline, moderately saline, and highly saline soil, respectively, according to [64].
The wet soil was then packed into columns of 10 cm diameter and 13 cm length by 5 cm increments to reach a bulk density of 1.5 g∙cm−3. The experimental soil volume fully encompassed the maximum measurement volume of the 5TE sensor [65].
One pre-calibrated 5TE Meter (Meter Group Inc., Pullman, WA, USA) was inserted vertically into each packed soil (Figure 2b). Each of the used 5TE Meter were calibrated for the effect of initial salt concentration on the dielectric constant based on the 5TE manual [65]. The packed soil samples were placed in a temperature control chamber (Figure 2a) (XT5438-TC250-R35, Xutemp, Hangzhou, China) to experience a freezing–thawing process (Figure 2c).

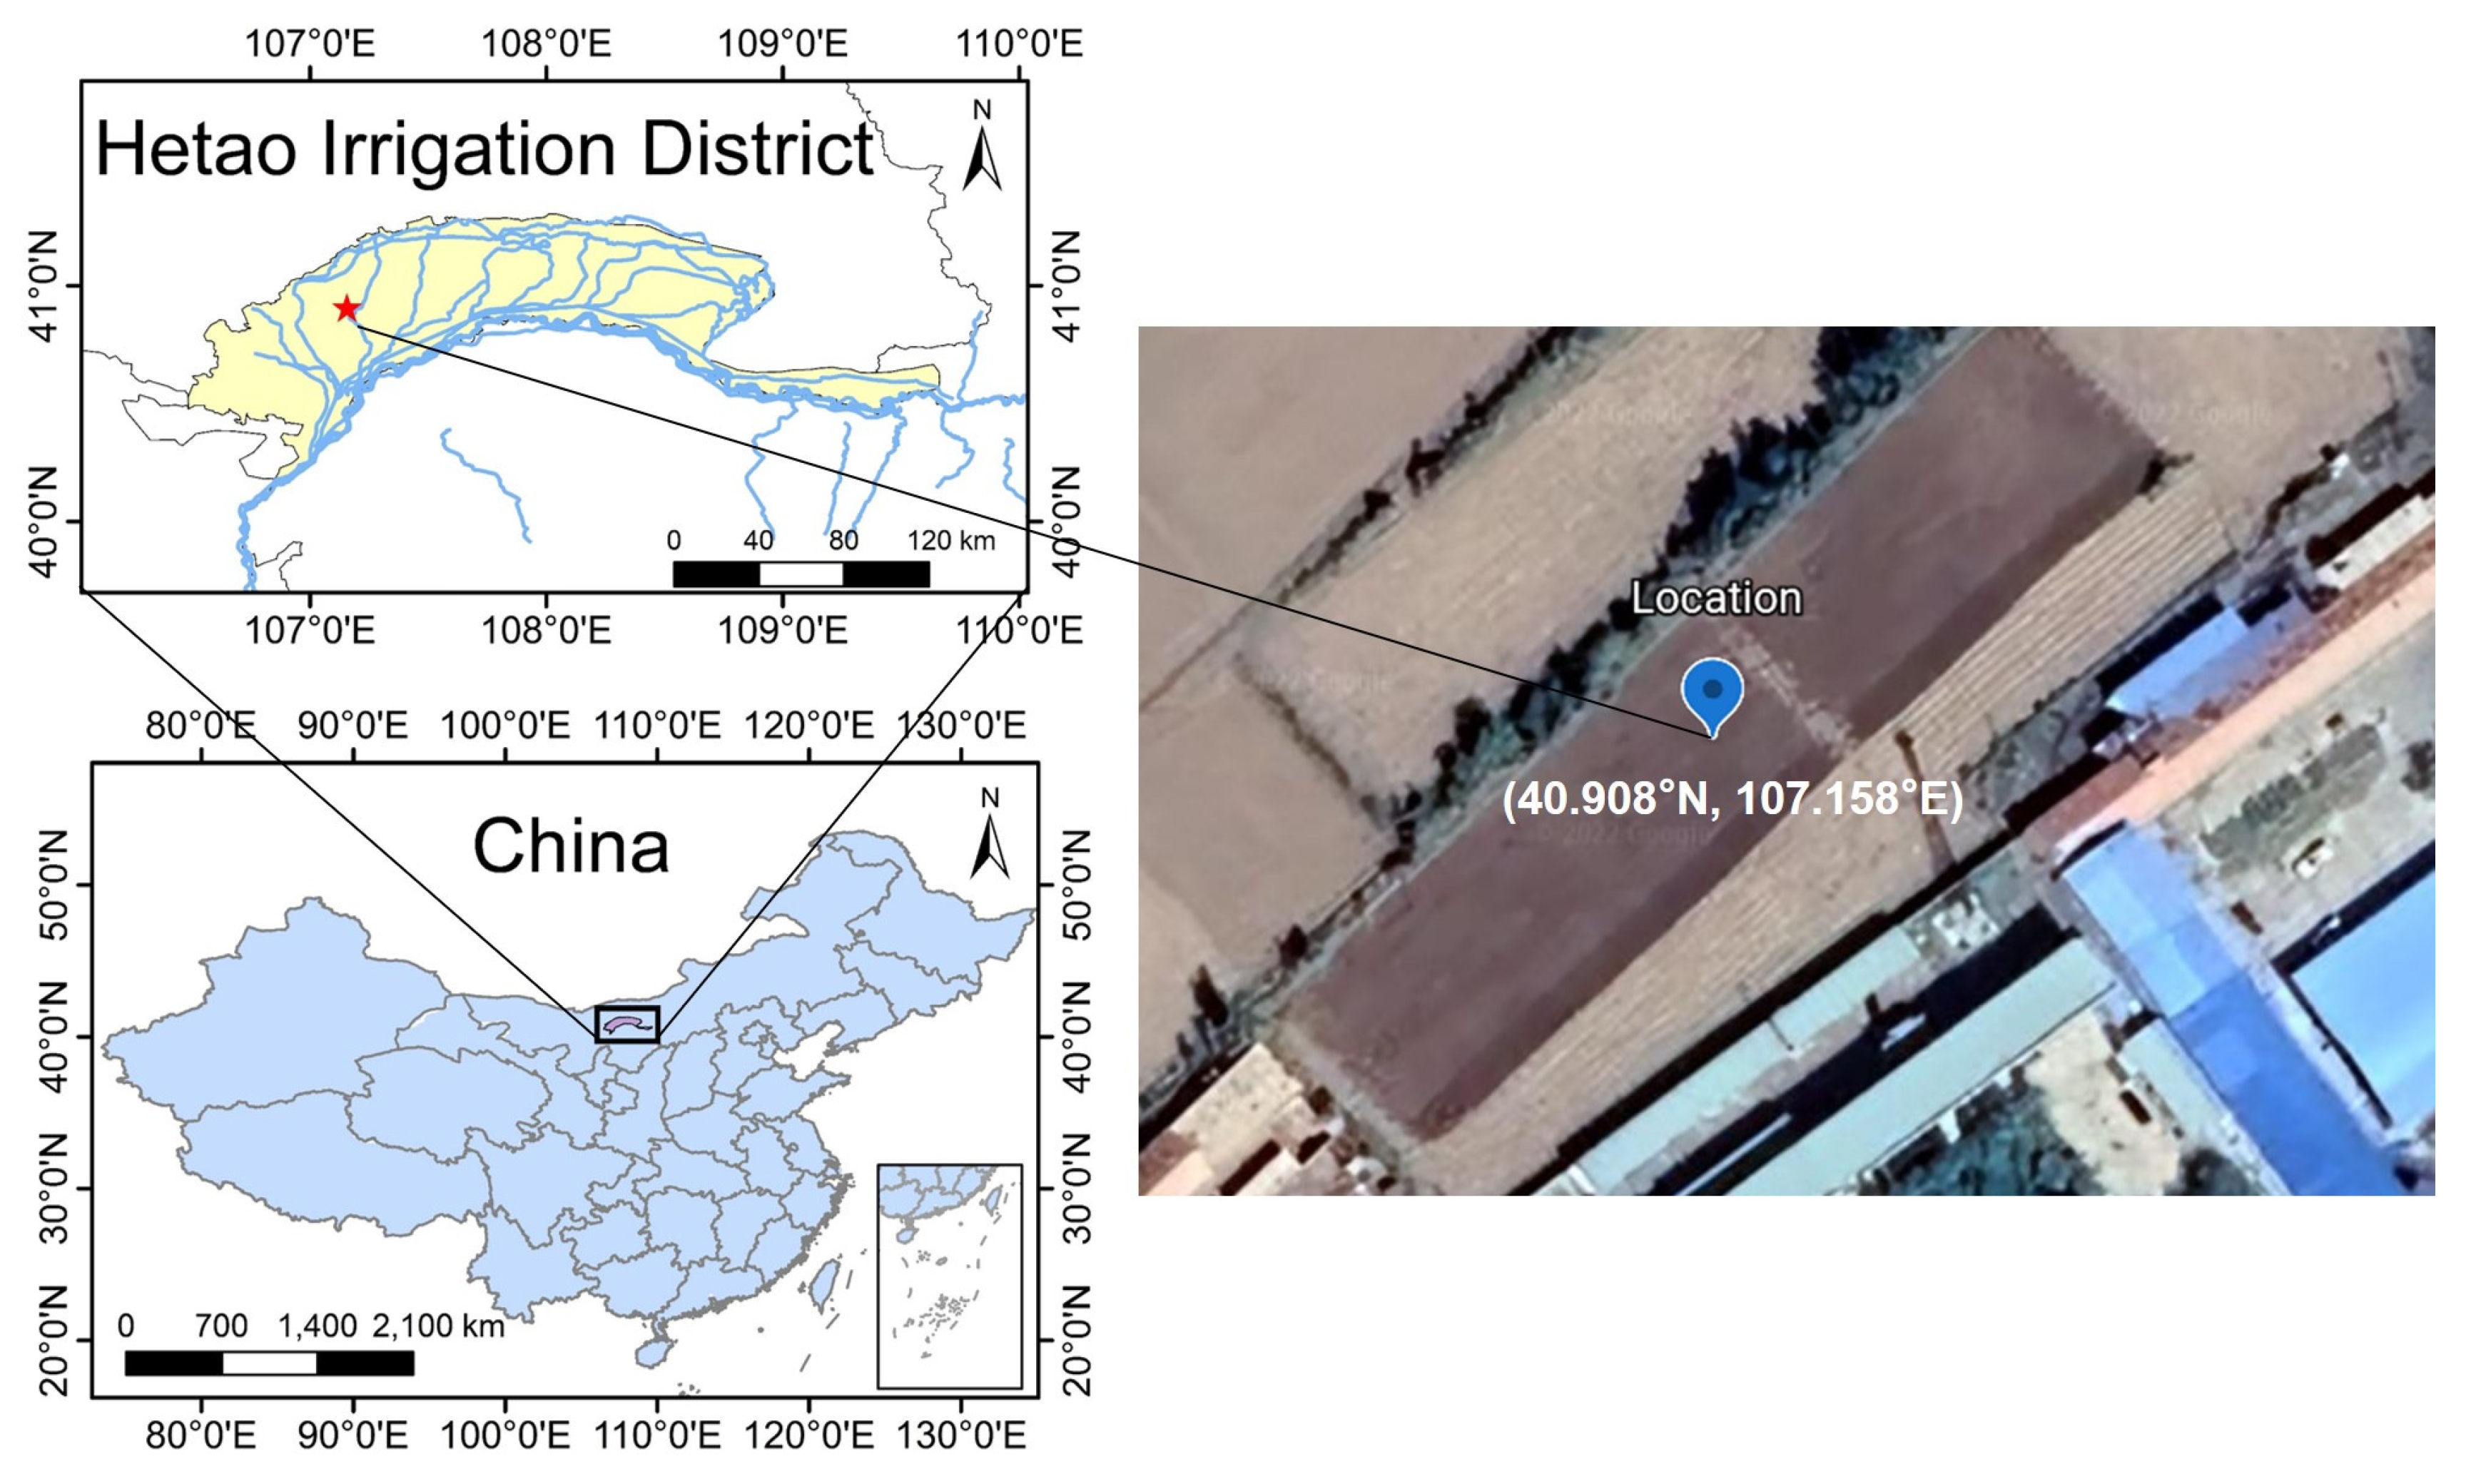
2.2.2. Field Experiment

To test the performance of the GCE-Salt Model in capturing the SFCC of in situ soil of different salinities, a field experiment was conducted during the 2017–2018 freezing–thawing period at the Shahaoqu Station in the Hetao Irrigation District, China (Figure 1). Two neighboring test fields were selected: one extremely saline abandoned land (SAL) and one slightly saline cropland (CL1). Wang et al. [10] tested that the soil condition was homogeneous in the same farmland, so we picked a point in the same soil to represent the nature of the site. The soil temperature and soil moisture of the soil profiles were monitored at 20, 40, 60, 100, and 140 cm depth hourly by Hydra Probe sensors (Stevens Water Monitoring Systems, Inc., Portland, Oregon, USA) [66]. The inherent fundamental assumption of the GCE-based SFCC models is that the ice formation reduced the soil water potential and the liquid water content. Thus, the field data used to test GCE-based models must meet the requirement that the total soil water content does not change significantly during the testing period. If the total soil water content changes, then, the soil water potential and the liquid water content would be interfered by other factors, not solely ice formation any more, and the GCE-based models may fail.
At our study site, the groundwater table was very shallow, from about 0.5 m to 2.5 m during the freezing period, and only the 0–20 cm has a nearly constant total soil water content during the freezing period [66]. Thus, only the data of the 0–20 cm topsoil were used for the model performance testing to meet the fundamental assumption of GCE-based models (Figure 3).
The soil particle distribution was measured by a Mastersizer 2000 (Malvern Instruments Ltd., Malvern, UK) to determine soil texture (Table 2). The soil bulk density was determined by oven drying at 105 °C. The dominant salt at the study site is NaCl [66]. The soil salinity was determined by measuring EC1:5 (mS∙cm−1) and converting it to soil salinity (SS, %) by SS = 3.480 EC1:5 − 0.236 (R2 = 0.993) following Liu et al. [67]. The saturated water content (θs) was obtained as the highest in situ VWC after flood irrigation during the cropping season [67]; whereas, the residual water content (θr) was obtained as the lowest in situ liquid water content during the stable frozen period [31,66]. The inverse of the air-entry value (α) and the pore-size distribution index (n) were calibrated by fitting the GCE model to the measured SFCC.

3. Results and Discussion

In the results and discussion, we tested the performance of the proposed GCE-Salt Model in both non-saline soil and saline soil and compared it with the models introduced in the introduction. We compared the GCE-Salt Model with the Combined Model in non-saline, which is the well-performing model that has been validated in non-saline soils. We reached the GCE-Salt Model with the Combined Model and GCE-Tan Model, both of which have been validated in the field and indoor experiments compared to other models proposed in recent years.

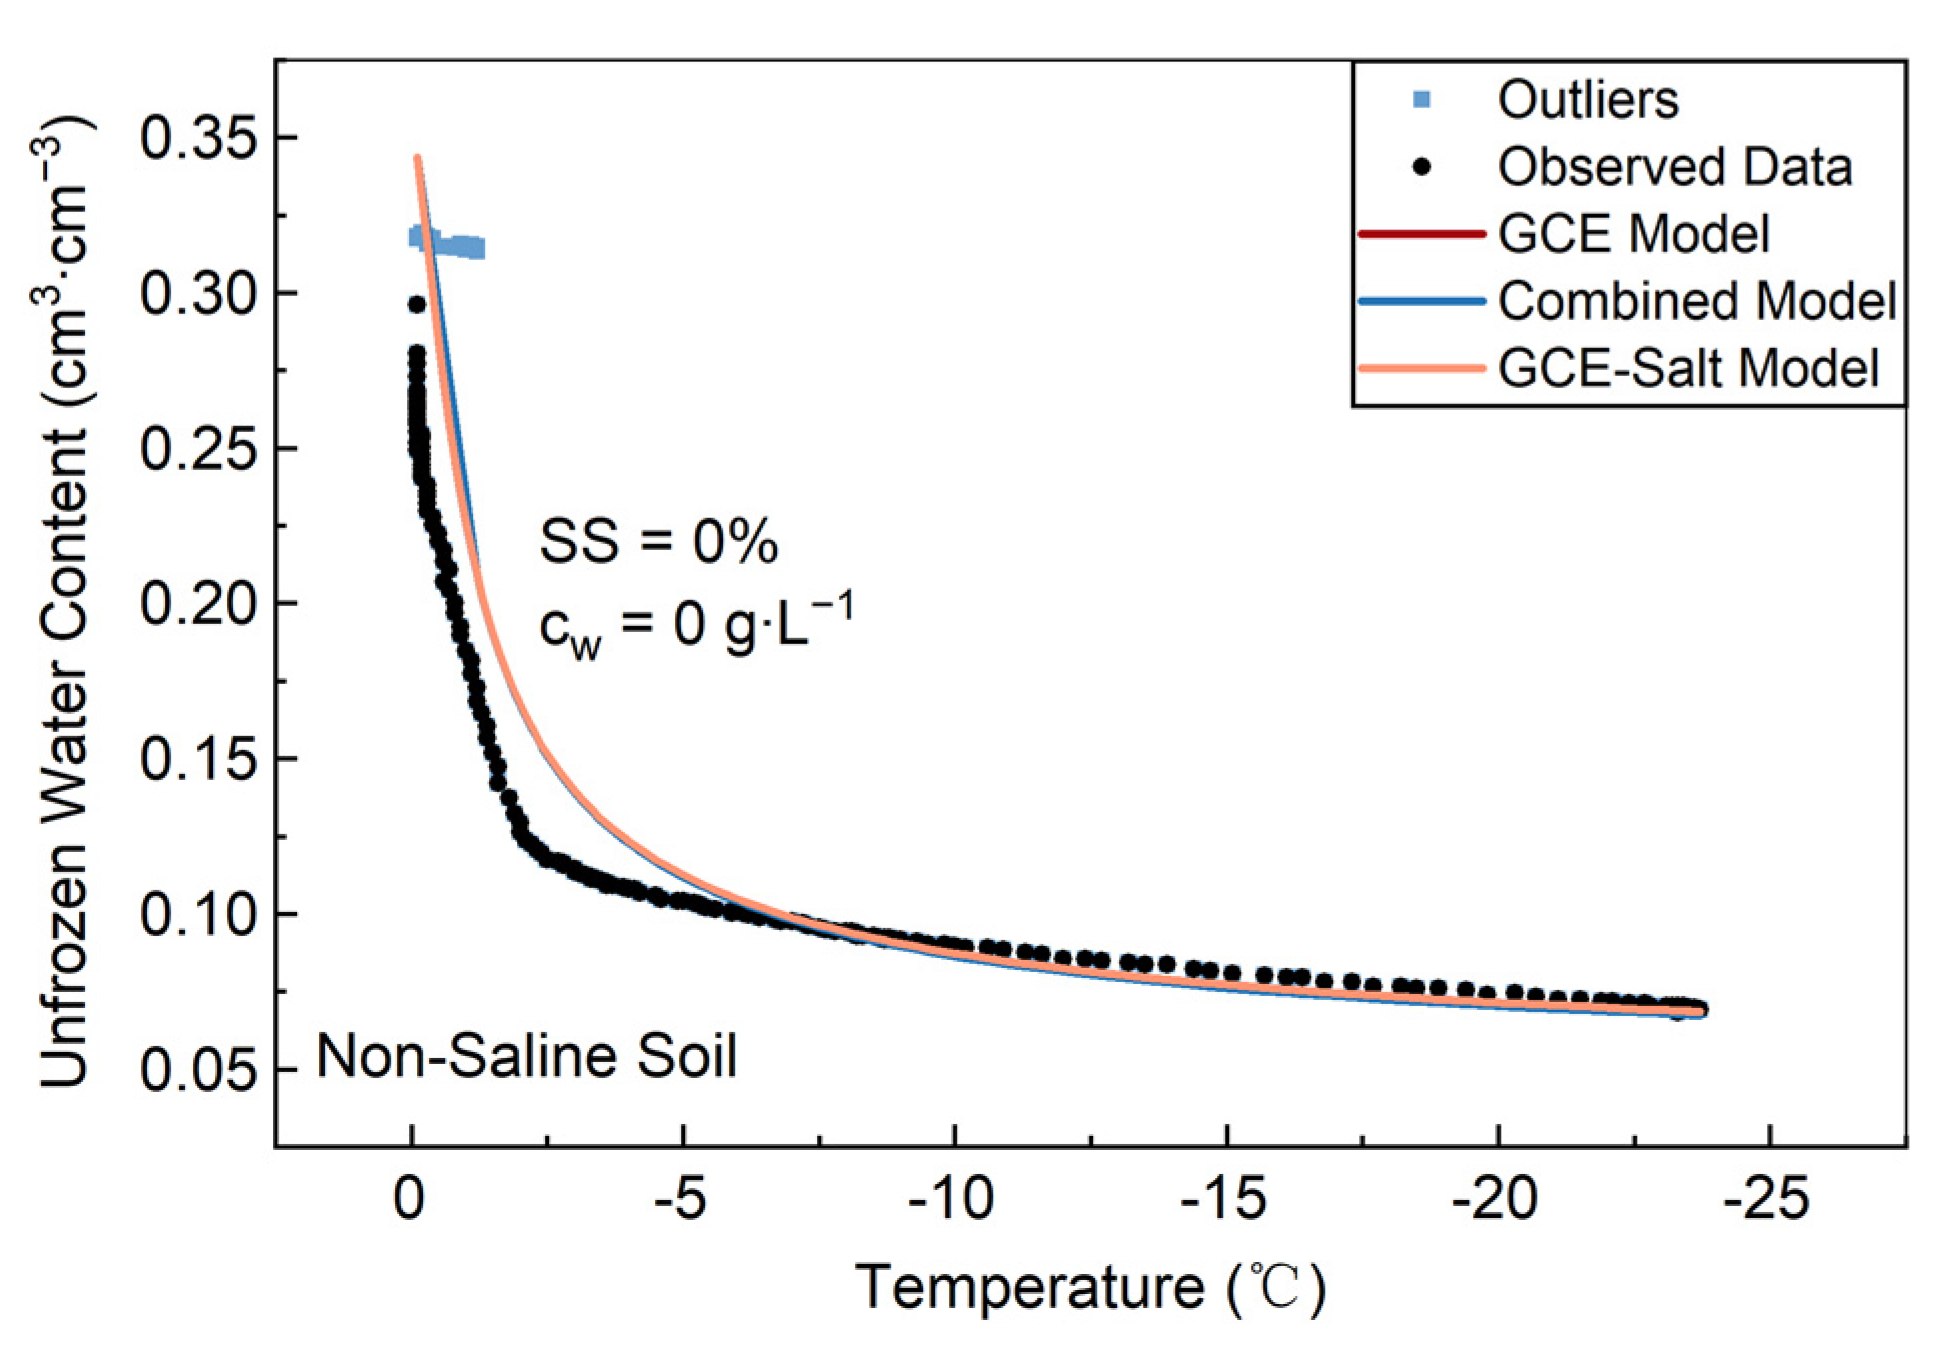
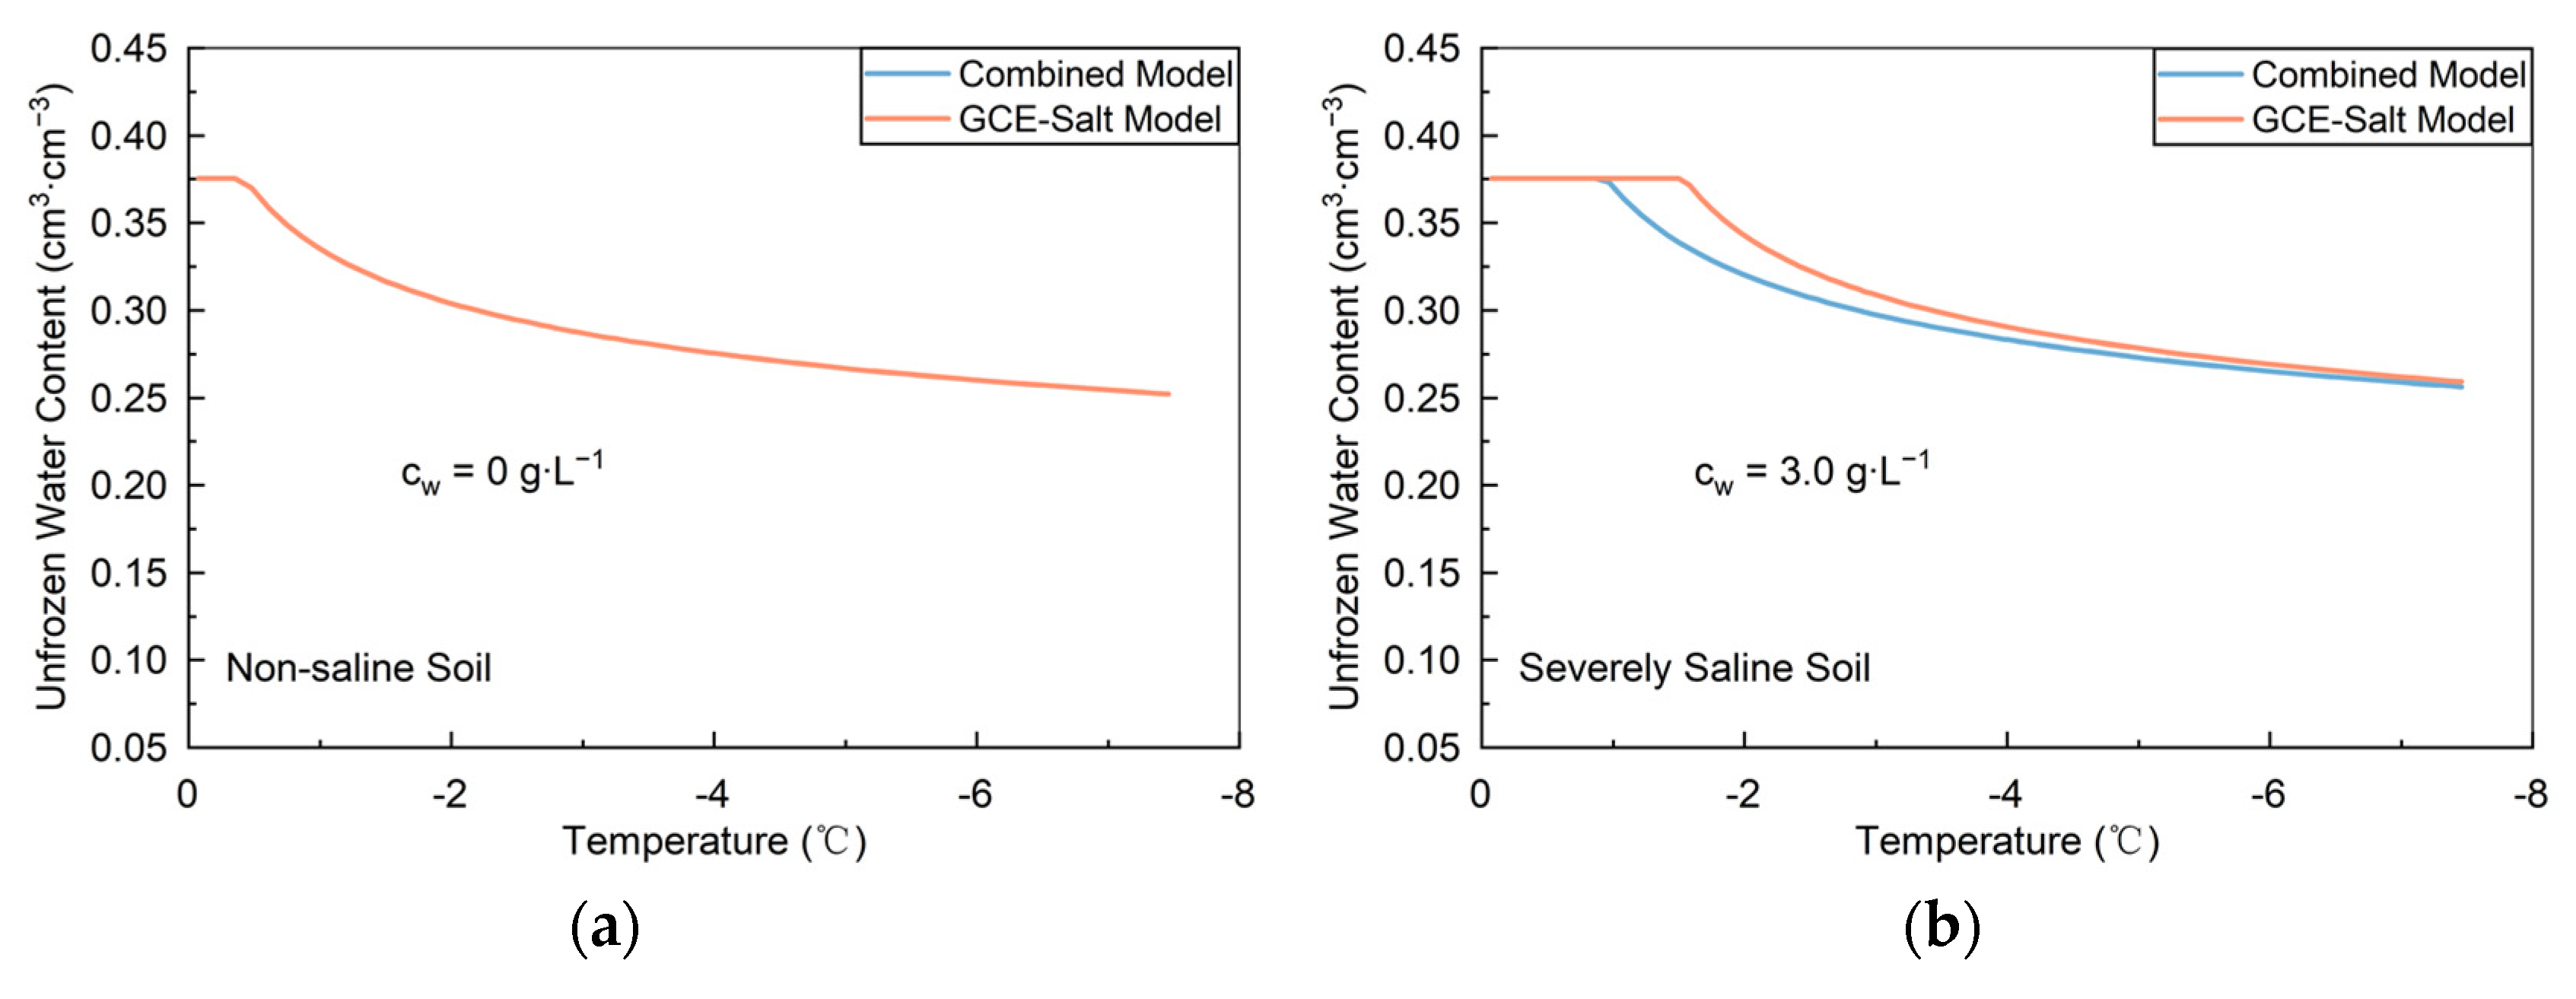
3.1. Lab Non-Saline Soil

For non-saline soil (Figure 4), both the Combined Model and the GCE-Salt Model are basically just the GCE Model (Equation (4)). Thus, the three models overlap and behave equally well (the root mean squared error (RMSE) = 0.037 cm3∙cm−3 and the Nash–Sutcliffe efficiency coefficient (NSE) = 0.866). All three models simulate the lower part of the unfrozen water content (<0.1 cm3∙cm−3) well and all of them slightly overestimate the unfrozen water content at the rapid drop part (from 0.34 to 0.07 cm3∙cm−3). The outliers were due to supercooling, i.e., at the beginning of a relatively fast freezing, the soil temperature rapidly dropped to the temperature of spontaneous nucleation but the liquid water could not release latent heat and turn into ice fast enough [1,42].

3.2. Saline Soil

To further test the performance of the GCE-Salt Model in different concentrations, we compared the performance of the GCE-Tan Model proposed by Tan et al. [46], the Combined Model, proposed by Amankwah et al. [1], and the GCE-Salt Model both in small sample lab and field experiments.

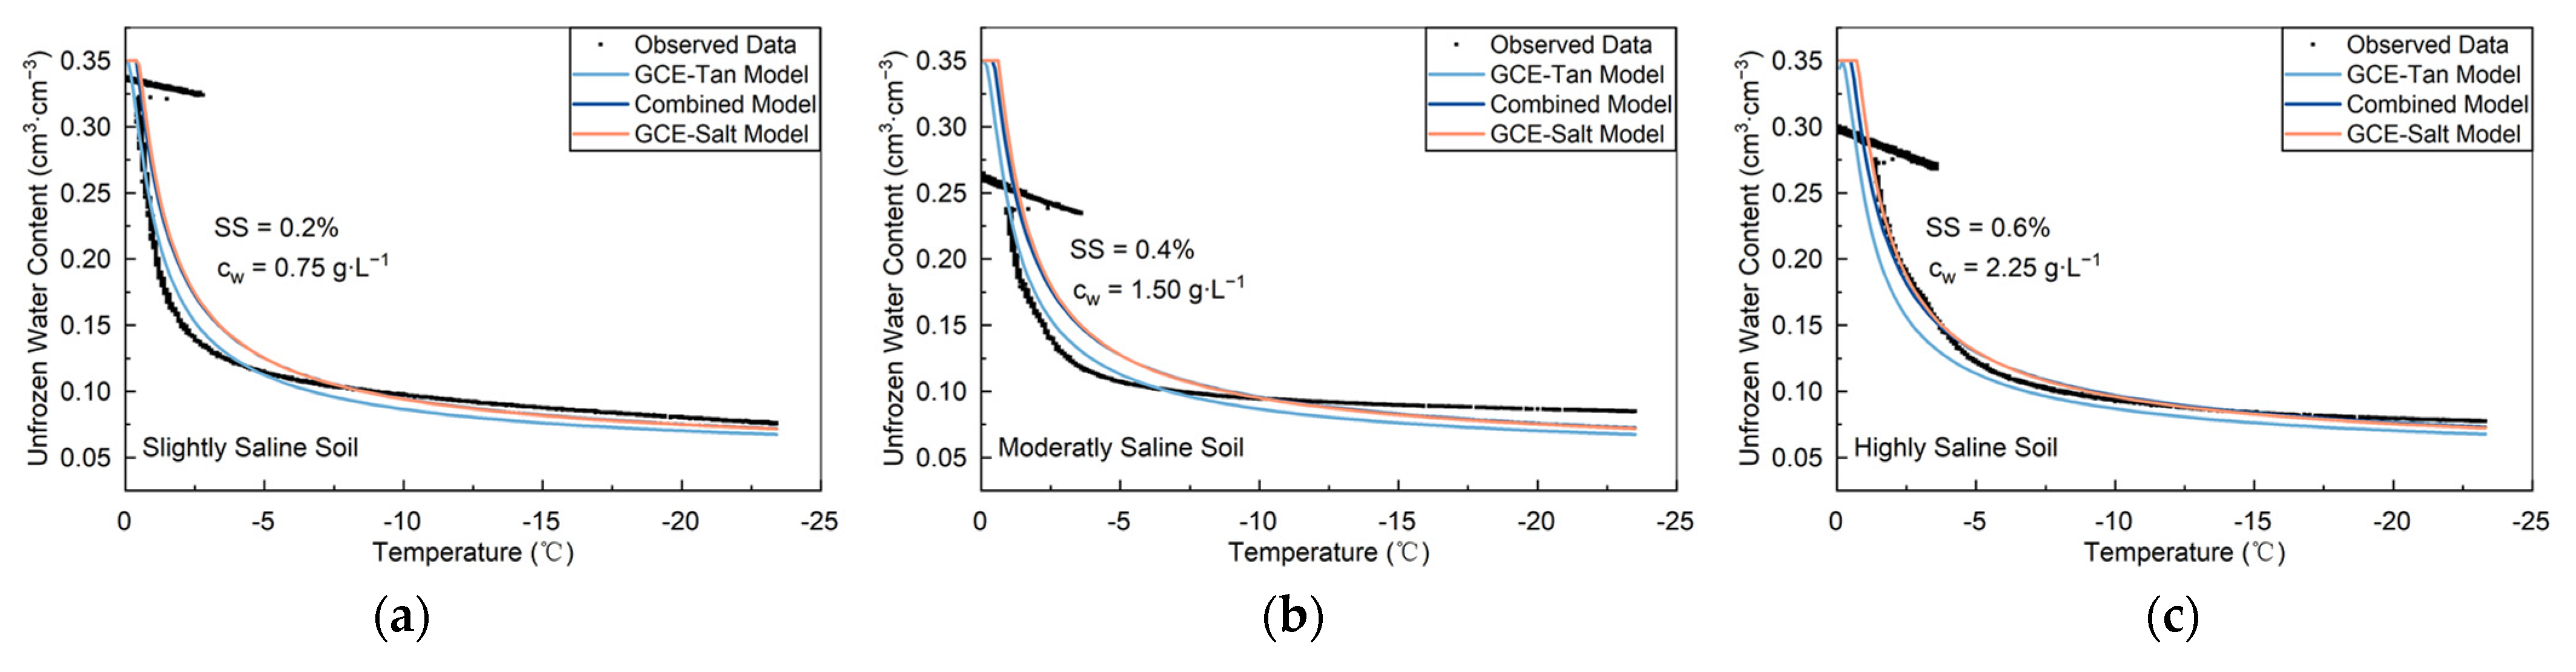
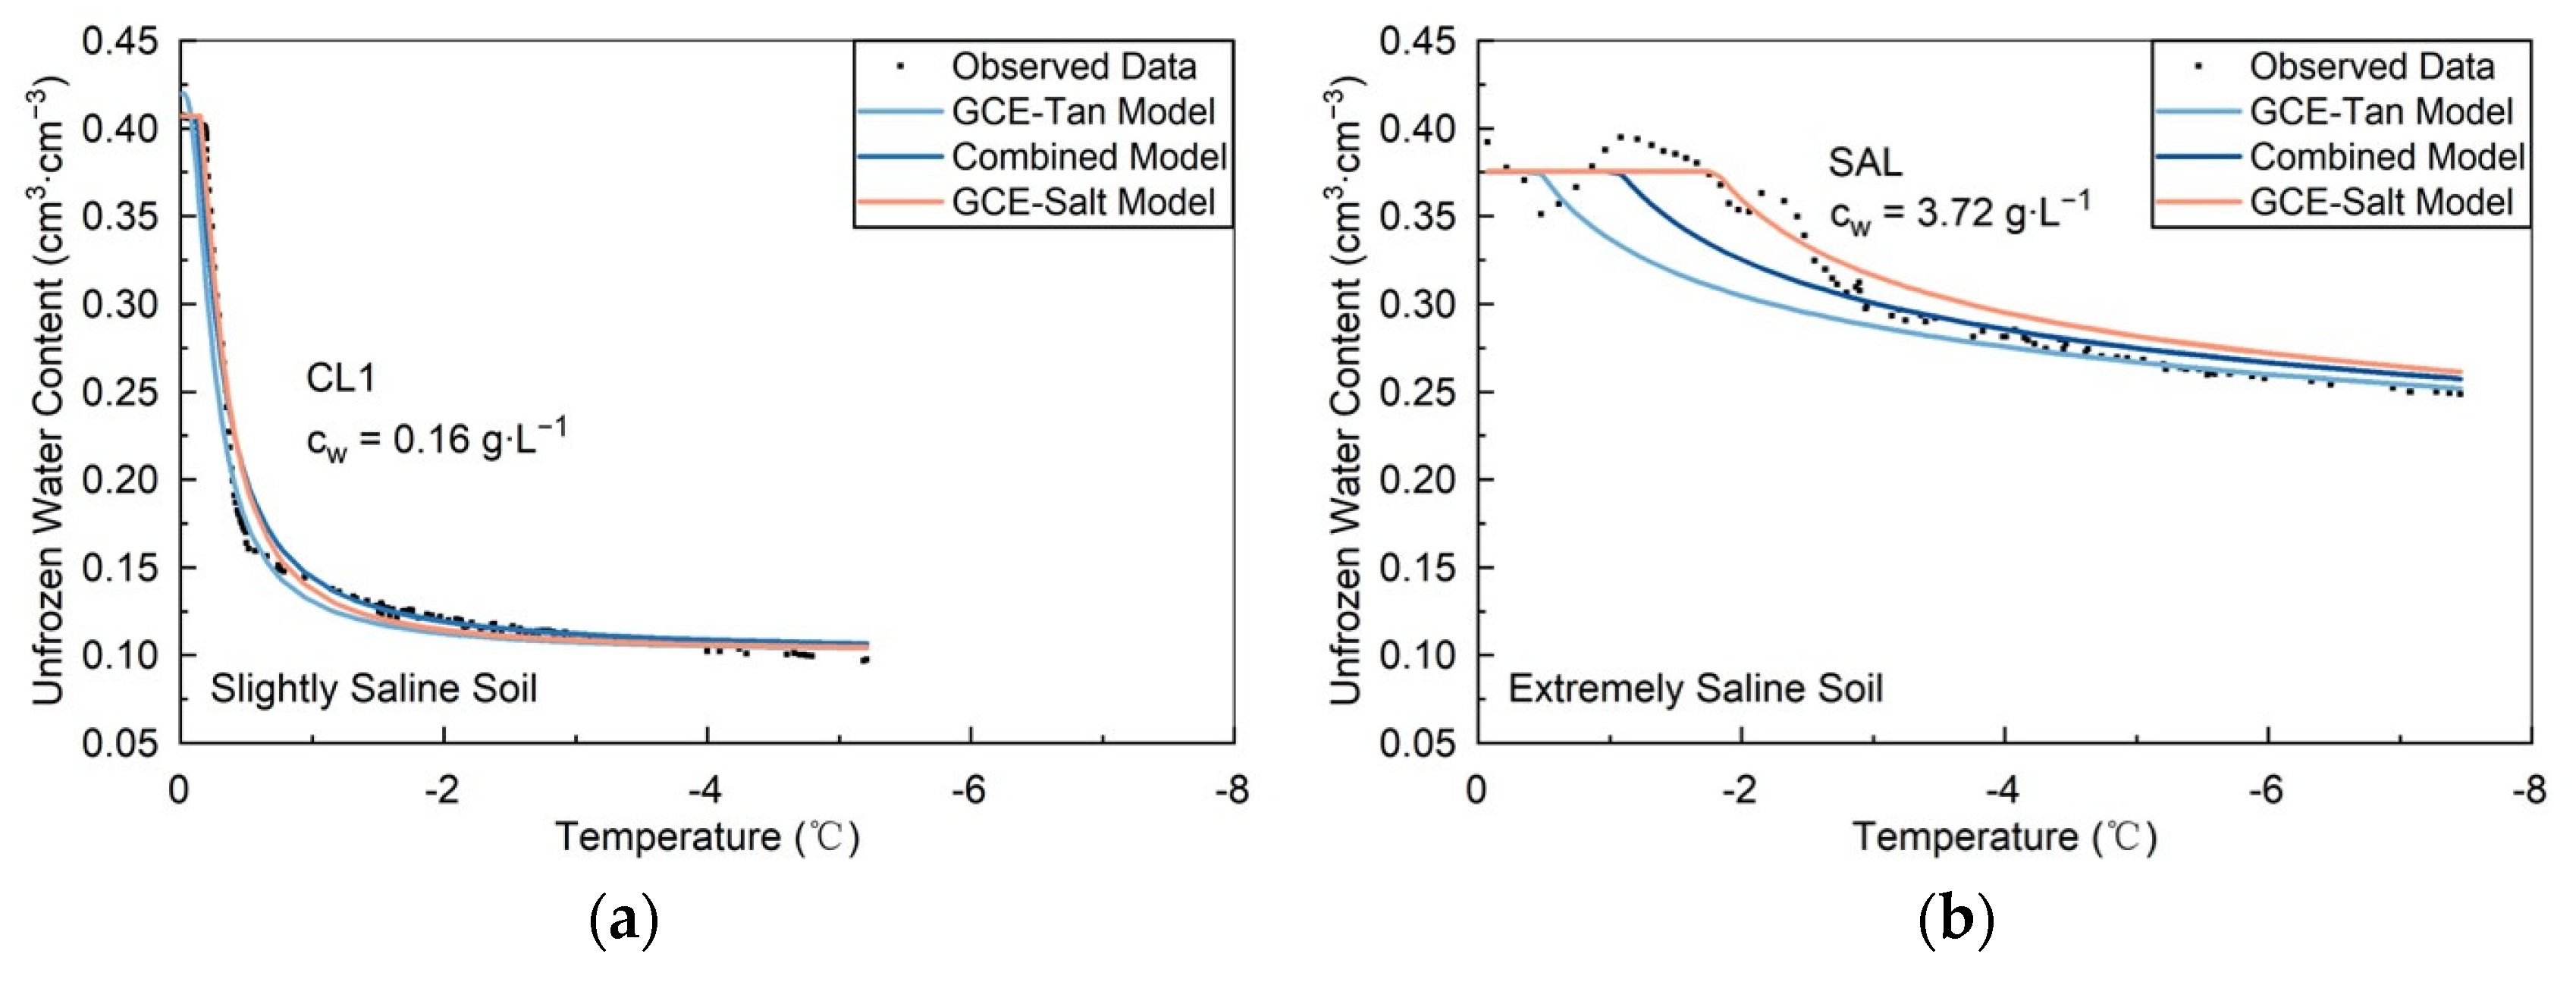
3.2.1. Lab Slightly to Highly Saline Soils

Our GCE-Salt Model performed similarly well as the Combined Model and the GCE-Tan Model for the lab slightly to highly saline soil (Figure 5, NSE ≥ 0.80 and RMSE < 0.030 cm3∙cm−3 for the three models). Particularly, compared to the GCE-Tan Model (RMSE = 0.029 cm3∙cm−3, NSE = 0.90), both the Combined Model (RMSE = 0.023 cm3∙cm−3, NSE = 0.93) and the GCE-Salt Model (RMSE = 0.024 cm3∙cm−3, NSE = 0.94) have remarkably high accuracy for the highly saline soil (Figure 5c). Whereas, they all overestimated the unfrozen water content at the rapid dropping stage for the slightly and moderately saline soils (Figure 5a,b). These indicated that the 0.4% soil salinity might not be high enough to illustrate the ability of the models in dealing with solute induced freezing point depression. As a common phenomenon in lab freezing experiments [59,68], supercooling occurred in all these lab saline soils, too. The fitted soil parameters are the same as the value of the non-saline soil (Table 3) and the transport and redistribution of salt in the soil were considered negligible [1].

3.2.2. Field Extremely and Slightly Saline Soils

Then, the ability of our newly proposed GCE-Salt model to capture the SFCC, especially the freezing point, at different salinity levels was tested with a slightly saline cropland (CL1) and an extremely saline abandoned land (SAL) (Table 4), against the GCE-Tan Model and the Combined Model (Figure 6a,b). The GCE-Salt Model (RMSE = 0.013 cm3∙cm−3, NSE = 0.99) performed similarly well as the Combined Model (RMSE = 0.017 cm3∙cm−3, NSE = 0.98) for the slightly saline soil (Figure 6a) and performed slightly better than the GCE-Tan Model (RMSE = 0.098 cm3∙cm−3, NSE = 0.94). Both the Combined Model and the GCE-Salt Model captured the unfrozen water content at the rapid dropping stage well and at the residue part (0.10 cm3∙cm−3). Whereas, the GCE-Salt Model (RMSE = 0.013 cm3∙cm−3, NSE = 0.92) surpassed the GCE-Tan Model (RMSE = 0.029 cm3∙cm−3, NSE = 0.62) and the Combined Model (RMSE = 0.017 cm3∙cm−3, NSE = 0.86) on the extremely saline soil (Figure 6b). Comparing the better-performed Combined Model and the GCE-Salt Model, the Combined Model better captured the elevated residue unfrozen water content (0.25 cm3∙cm−3); whereas, the GCE-Salt Model overestimated that by 0.26 cm3∙cm−3. However, the GCE-Salt Model accurately captured the huge freezing point depression of −1.70 K; whereas, the Combined Model underestimated this freezing point depression by 0.7 K.
The Tm (−0.35 K) in the GCE-Tan Model is smaller than the Tm in the Combined Model and the GCE-Salt Model, suggesting that this model would underestimate the effect of salinity on the freezing point. However, the Tm (−0.49 K) in the Combined Model and the ΔTfs (−0.44 K) in the GCE-Salt Model are similar, indicating that the estimation of the freezing point depression induced by solute potential is not the fundamental difference between the two models. In other words, keeping the Ψf as the soil matric potential and excluding the effect of solute potential in the numerator proved to be a better approach to capturing the freezing point than regarding the Ψf as the summation of soil matric potential and solute potential and considering the effect of soil matric potential and the effect of solute potential in the numerator and denominator, respectively.
To reveal the fundamental difference between the Combined Model and the GCE-Salt Model at capturing the freezing point, the SFCC of the SAL soil (soil properties are listed in Table 3) was simulated at different salinity levels: 0, 3.0 g∙L−1, 3.72 g∙L−1 (same as the in situ salinity), and 4.5 g∙L−1 (Figure 7). The estimated freezing points by the two models are significantly different at cw = 3.0 g∙L−1: the difference has reached 0.63 K. This difference becomes more and more significant with the increase in salinity, reaching 1.85 K when cw = 4.5 g∙L−1. The two models eventually converge at the same residue unfrozen water content.
The ability of our newly proposed GCE-Salt Model to capture the SFCC was first tested without salt against the Combined Model. Then, the performance of the GCE-Salt Model, especially, capturing the freezing point at different salinity levels against the GCE-Tan Model and the Combined Model was tested with sandy loam at slightly, moderately, and highly saline levels in the lab temperature-controlled chamber and in situ silt loam at slightly and extremely saline levels. Soils of different textures and at different salinity levels, particularly highly, severely, and extremely saline levels, could be used to test the ability of the GCE-Salt Model to capture the SFCC against the GCE-Tan Model and the Combined Model, to more comprehensively reveal which expression could better capture the freezing point of SFCC in saline soil.

4. Conclusions

In this study, we propose a novel model based on the Generalized Clapeyron Equation (GCE), the GCE-Salt Model to simulate the soil freezing characteristic curve (SFCC) in frozen saline soil accurately. By keeping the Ψf in the GCE as the matric potential and by incorporating solute potential, our model precisely captures the equilibrium freezing temperature (Ψf) and has shown excellent performance in both lab and field experiments, especially in extremely saline soil. Our GCE-Salt Model helps better understand the freezing and thawing of saline soil, which would promote a better understanding of the effect of the seasonal freezing–thawing cycle on the thermal–hydrological processes and the structure of saline soil.
The performance of our GCE-Salt Model was validated by both lab and field experimental data and compared with previous models: (1) our GCE-Salt Model could capture the SFCC of non-saline soil equally as well as the Combined Model. (2) Our GCE-Salt Model performed better than the GCE-Tan Model and performed similarly well as the Combined Model for the slightly to highly saline soil. (3) Our GCE-Salt Model beat the Combined Model and the GCE-Tan Model in capturing the SFCC of extremely saline soil, mainly because it can more accurately capture the freezing point.
For future studies, it is highly recommended to test the ability of the GCE-Salt Model to capture the SFCC with soils of different textures and at different salinity levels, particularly highly, severely, and extremely saline levels, to more comprehensively reveal which expression could better capture the SFCC in saline soil.

Author Contributions

Conceptualization, L.W. and Z.H.; methodology, L.W.; software, L.W.; validation, L.W., X.W. and Z.H.; formal analysis, L.W.; investigation, L.W.; resources, L.W., J.H. and X.W.; data curation, L.W., J.H. and X.W.; writing—original draft preparation, L.W.; writing—review and editing, L.W., X.W. and C.W.; visualization, L.W.; supervision, C.W., C.Z. and Z.H.; project administration, C.W., C.Z. and Z.H.; funding acquisition, Z.H.; All authors have read and agreed to the published version of the manuscript.

Funding

This work was supported by the National Natural Science Foundation of China [grant numbers: 52130902] and the National Key Research and Development Program of China [grant number: 2021YFD1900603].

Data Availability Statement

The lab and field experiment data used for the validation of the model in the study are available via reasonable request from the corresponding author, Zailin Huo, via email: [email protected].

Acknowledgments

The authors would like to thank Shahaoqu Experimental Station, Inner Mongolia Hetao Irrigation District Jiefangzha Department, China, for their assistance with the experimental setup and field work.

Conflicts of Interest

The authors declare no conflicts of interest.

References

  1. Amankwah, S.K.; Ireson, A.M.; Maulé, C.; Brannen, R.; Mathias, S.A. A Model for the Soil Freezing Characteristic Curve That Represents the Dominant Role of Salt Exclusion. Water Resour. Res. 2021, 57, e2021WR030070. [Google Scholar] [CrossRef]
  2. He, H.; Dyck, M.; Zhao, Y.; Si, B.; Jin, H.; Zhang, T.; Lv, J.; Wang, J. Evaluation of five composite dielectric mixing models for understanding relationships between effective permittivity and unfrozen water content. Cold Reg. Sci. Technol. 2016, 130, 33–42. [Google Scholar] [CrossRef]
  3. Gao, B.; Yang, D.; Qin, Y.; Wang, Y.; Li, H.; Zhang, Y.; Zhang, T. Change in frozen soils and its effect on regional hydrology, upper Heihe basin, northeastern Qinghai–Tibetan Plateau. Cryosphere 2018, 12, 657–673. [Google Scholar] [CrossRef]
  4. Kong, F.; Nie, L.; Xu, Y.; Rui, X.; He, Y.; Zhang, T.; Wang, Y.; Du, C.; Bao, C. Effects of freeze-thaw cycles on the erodibility and microstructure of soda-saline loessal soil in Northeastern China. Catena 2022, 209, 105812. [Google Scholar] [CrossRef]
  5. Gharedaghloo, B.; Berg, S.J.; Sudicky, E.A. Water freezing characteristics in granular soils: Insights from pore-scale simulations. Adv. Water Resour. 2020, 143, 103681. [Google Scholar] [CrossRef]
  6. Krzeminska, D.; Bloem, E.; Starkloff, T.; Stolte, J. Combining FDR and ERT for monitoring soil moisture and temperature patterns in undulating terrain in south-eastern Norway. Catena 2022, 212, 106100. [Google Scholar] [CrossRef]
  7. Ding, B.; Zhang, Y.; Yu, X.; Jia, G.; Wang, Y.; Zheng, P.; Li, Z. Comparative study of seasonal freeze–thaw on soil water transport in farmland and its shelterbelt. Catena 2023, 225, 106982. [Google Scholar] [CrossRef]
  8. Xu, J.; Ren, J.; Wang, Z.; Wang, S.; Yuan, J. Strength behaviors and meso-structural characters of loess after freeze-thaw. Cold Reg. Sci. Technol. 2018, 148, 104–120. [Google Scholar] [CrossRef]
  9. Hou, R.; Li, T.; Fu, Q.; Liu, D.; Li, M.; Zhou, Z.; Li, L.; Yan, J. Characteristics of water–heat variation and the transfer relationship in sandy loam under different conditions. Geoderma 2019, 340, 259–268. [Google Scholar] [CrossRef]
  10. Wang, X.; Wang, C.; Wang, X.; Huo, Z. Response of soil compaction to the seasonal freezing-thawing process and the key controlling factors. Catena 2020, 184, 104247. [Google Scholar] [CrossRef]
  11. Ye, W.; Li, C. The consequences of changes in the structure of loess as a result of cyclic freezing and thawing. Bull. Eng. Geol. Environ. 2018, 78, 2125–2138. [Google Scholar] [CrossRef]
  12. Ren, J.; Vanapalli, S.K.; Han, Z. Soil freezing process and different expressions for the soil-freezing characteristic curve. Sci. Cold Arid Reg. 2017, 9, 221–228. [Google Scholar] [CrossRef]
  13. Xiao, Z.; Lai, Y.; Zhang, M. Study on the freezing temperature of saline soil. Acta Geotech. 2017, 13, 195–205. [Google Scholar] [CrossRef]
  14. Wu, M.; Tan, X.; Huang, J.; Wu, J.; Jansson, P.-E. Solute and water effects on soil freezing characteristics based on laboratory experiments. Cold Reg. Sci. Technol. 2015, 115, 22–29. [Google Scholar] [CrossRef]
  15. Wu, Y.; Wang, Y.; Hu, L. A theoretical model of the soil freezing characteristic curve for saline soil. J. Hydrol. 2023, 622, 129639. [Google Scholar] [CrossRef]
  16. Chen, J.; Mei, S.; Irizarry, J.T.; Rempel, A.W. A Monte Carlo Approach to Approximating the Effects of Pore Geometry on the Phase Behavior of Soil Freezing. J. Adv. Model. Earth Syst. 2020, 12, e2020MS002117. [Google Scholar] [CrossRef]
  17. Bi, J.; Wang, G.; Wu, Z.; Wen, H.; Zhang, Y.; Lin, G.; Sun, T. Investigation on unfrozen water content models of freezing soils. Front. Earth. Sci. 2023, 10, 1039330. [Google Scholar] [CrossRef]
  18. Chai, M.; Zhang, J.; Zhang, H.; Mu, Y.; Sun, G.; Yin, Z. A method for calculating unfrozen water content of silty clay with consideration of freezing point. Appl. Clay Sci. 2018, 161, 474–481. [Google Scholar] [CrossRef]
  19. Li, Z.; Chen, J.; Sugimoto, M. Pulsed NMR Measurements of Unfrozen Water Content in Partially Frozen Soil. J. Cold Reg. Eng. 2020, 34, 04020013. [Google Scholar] [CrossRef]
  20. Teng, J.; Zhong, Y.; Zhang, S.; Sheng, D. A mathematic model for the soil freezing characteristic curve: The roles of adsorption and capillarity. Cold Reg. Sci. Technol. 2021, 181, 103178. [Google Scholar] [CrossRef]
  21. Bittelli, M.; Flury, M.; Campbell, G.S. A thermodielectric analyzer to measure the freezing and moisture characteristic of porous media. Water Resour. Res. 2003, 39, 1041. [Google Scholar] [CrossRef]
  22. Nishimura, S.; Gens, A.; Olivella, S.; Jardine, R.J. THM-coupled finite element analysis of frozen soil: Formulation and application. Geotechnique 2009, 59, 159–171. [Google Scholar] [CrossRef]
  23. Zhou, J. Experimental Study on Characteristics of Unfrozen Water in Clay Mineral and Its Effect on Sand Thawing Characteristics; China University of Mining and Technology: Xuzhou, China, 2020. [Google Scholar]
  24. Wen, Z.; Ma, W.; Feng, W.; Deng, Y.; Wang, D.; Fan, Z.; Zhou, C. Experimental study on unfrozen water content and soil matric potential of Qinghai-Tibetan silty clay. Environ. Earth Sci. 2011, 66, 1467–1476. [Google Scholar] [CrossRef]
  25. Dall’Amico, M.; Endrizzi, S.; Gruber, S.; Rigon, R. A robust and energy-conserving model of freezing variably-saturated soil. Cryosphere 2011, 5, 469–484. [Google Scholar] [CrossRef]
  26. Anderson, D.M.; Tice, A.R. Predicting Unfrozen Water Contents in Frozen Soils from Surface Area Measurements. Highw. Res. Rec. 1972, 393, 12–18. [Google Scholar]
  27. Michalowski, R.L.; Zhu, M. Frost heave modelling using porosity rate function. Int. J. Numer. Anal. Methods Geomech. 2006, 30, 703–722. [Google Scholar] [CrossRef]
  28. Michalowski, R.L. A constitutive model of saturated soils for frost heave simulations. Cold Reg. Sci. Technol. 1993, 22, 47–63. [Google Scholar] [CrossRef]
  29. Osterkamp, T.E.; Romanovsky, V.E. Freezing of the Active Layer on the Coastal Plain of the Alaskan Arctic. Permafr. Periglac. Process. 1997, 8, 23–44. [Google Scholar] [CrossRef]
  30. McKenzie, J.M.; Voss, C.I.; Siegel, D.I. Groundwater flow with energy transport and water–ice phase change: Numerical simulations, benchmarks, and application to freezing in peat bogs. Adv. Water Resour. 2007, 30, 966–983. [Google Scholar] [CrossRef]
  31. Kozlowski, T. A semi-empirical model for phase composition of water in clay–water systems. Cold Reg. Sci. Technol. 2007, 49, 226–236. [Google Scholar] [CrossRef]
  32. Zhang, Y.; Carey, S.K.; Quinton, W.L. Evaluation of the algorithms and parameterizations for ground thawing and freezing simulation in permafrost regions. J. Geophys. Res. 2008, 113, 116. [Google Scholar] [CrossRef]
  33. Nicolsky, D.J.; Romanovsky, V.E.; Panda, S.K.; Marchenko, S.S.; Muskett, R.R. Applicability of the ecosystem type approach to model permafrost dynamics across the Alaska North Slope. J. Geophys. Res. Earth Surf. 2017, 122, 50–75. [Google Scholar] [CrossRef]
  34. Weng, L.; Wu, Z.; Liu, Q.; Chu, Z.; Zhang, S. Evolutions of the unfrozen water content of saturated sandstones during freezing process and the freeze-induced damage characteristics. Int. J. Rock Mech. Min. Sci 2021, 142, 104757. [Google Scholar] [CrossRef]
  35. Westermann, S.; Boike, J.; Langer, M.; Schuler, T.V.; Etzelmüller, B. Modeling the impact of wintertime rain events on the thermal regime of permafrost. Cryosphere 2011, 5, 945–959. [Google Scholar] [CrossRef]
  36. Li, B.; Huang, L.; Lv, X.; Ren, Y. Variation features of unfrozen water content of water-saturated coal under low freezing temperature. Sci. Rep. 2021, 11, 15398. [Google Scholar] [CrossRef]
  37. Qin, Y.; Li, G.; Qu, G. A formula for the unfrozen water content and temperature of frozen soils. In Cold Regions Engineering 2009: Cold Regions Impacts on Research, Design, and Construction; 2009; pp. 155–161. Available online: https://ascelibrary.org/doi/10.1061/41072%28359%2918 (accessed on 15 January 2023).
  38. Kong, L.; Wang, Y.; Sun, W.; Qi, J. Influence of plasticity on unfrozen water content of frozen soils as determined by nuclear magnetic resonance. Cold Reg. Sci. Technol. 2020, 172, 102993. [Google Scholar] [CrossRef]
  39. Kurylyk, B.L.; Watanabe, K. The mathematical representation of freezing and thawing processes in variably-saturated, non-deformable soils. Adv. Water Resour. 2013, 60, 160–177. [Google Scholar] [CrossRef]
  40. Ma, T.; Wei, C.; Xia, X.; Zhou, J.; Chen, P. Soil Freezing and Soil Water Retention Characteristics: Connection and Solute Effects. J. Perform. Constr. Fac. 2017, 31, D4015001. [Google Scholar] [CrossRef]
  41. Zhou, J.; Wei, C.; Lai, Y.; Wei, H.; Tian, H. Application of the Generalized Clapeyron Equation to Freezing Point Depression and Unfrozen Water Content. Water Resour. Res. 2018, 54, 9412–9431. [Google Scholar] [CrossRef]
  42. Zhou, J.; Meng, X.; Wei, C.; Pei, W. Unified Soil Freezing Characteristic for Variably-Saturated Saline Soils. Water Resour. Res. 2020, 56, e2019WR026648. [Google Scholar] [CrossRef]
  43. Wang, L.; Liu, J.; Yu, X.; Wang, T.; Feng, R. A Simplified Model for the Phase Composition Curve of Saline Soils Considering the Second Phase Transition. Water Resour. Res. 2021, 57, e2020WR028556. [Google Scholar] [CrossRef]
  44. Wan, X.; Yang, Z. Pore water freezing characteristic in saline soils based on pore size distribution. Cold Reg. Sci. Technol. 2020, 173, 103030. [Google Scholar] [CrossRef]
  45. Wang, L.; Wang, P.; Liu, J.; Liu, J.; Chen, W.; Zhang, Q.; Wang, T. Crystallization deformation and phase transitions of coarse-grained sulfate saline soils upon cooling. Cold Reg. Sci. Technol. 2023, 209, D4015001. [Google Scholar] [CrossRef]
  46. Tan, X.; Wu, M.; Huang, J.; Wu, J.; Chen, J. Similarity of soil freezing characteristic and soil water characteristic: Application in saline frozen soil hydraulic properties prediction. Cold Reg. Sci. Technol. 2020, 173, 102876. [Google Scholar] [CrossRef]
  47. Xu, X.; Oliphant, J.L.; Tice, A.R. Prediction of unfrozen water content in frozen soil by a two-point or one-point method. In Proceedings of the 4th International Symposium on Ground Freezing, Sapporo, Japan, 5–7 August 1985; Volume 2, pp. 83–87. [Google Scholar]
  48. Banin, A.; Anderson, D.M. Effects of Salt Concentration Changes During Freezing on the Unfrozen Water Content of Porous Materials. Water Resour. Res. 1974, 10, 124–128. [Google Scholar] [CrossRef]
  49. Bi, J.; Wu, Z.; Lu, Y.; Wen, H.; Zhang, Y.; Shen, Y.; Wei, T.; Wang, G. Study on soil freezing characteristic curve during a freezing-thawing process. Front. Earth. Sci. 2023, 10, 1007342. [Google Scholar] [CrossRef]
  50. Jin, X.; Yang, W.; Gao, X.; Zhao, J.Q.; Li, Z.; Jiang, J. Modeling the Unfrozen Water Content of Frozen Soil Based on the Absorption Effects of Clay Surfaces. Water Resour. Res. 2020, 56, e2020WR027482. [Google Scholar] [CrossRef]
  51. Wang, C.; Li, S.; Lai, Y.; Chen, Q.; He, X.; Zhang, H.; Liu, X. Predicting the Soil Freezing Characteristic From the Particle Size Distribution Based on Micro-Pore Space Geometry. Water Resour. Res. 2022, 58, e2021WR030782. [Google Scholar] [CrossRef]
  52. Dall’Amico, M. Coupled Water and Heat Transfer in Permafrost Modeling. Doctoral Thesis, University of Trento, Trento, Italy, 2010. [Google Scholar]
  53. Sheshukov, A.Y.; Nieber, J.L. One-dimensional freezing of nonheaving unsaturated soils: Model formulation and similarity solution. Water Resour. Res. 2011, 47, W11519. [Google Scholar] [CrossRef]
  54. Liu, Z.; Yu, X. Physically Based Equation for Phase Composition Curve of Frozen Soils. Transp. Res. Rec. J. Transp. Res. Board 2013, 2349, 93–99. [Google Scholar] [CrossRef]
  55. Mu, Q.Y.; Ng, C.W.W.; Zhou, C.; Zhou, G.G.D.; Liao, H.J. A new model for capturing void ratio-dependent unfrozen water characteristics curves. Comput. Geotech. 2018, 101, 95–99. [Google Scholar] [CrossRef]
  56. Wen, H.; Bi, J.; Guo, D. Evaluation of the calculated unfrozen water contents determined by different measured subzero temperature ranges. Cold Reg. Sci. Technol. 2020, 170, 102927. [Google Scholar] [CrossRef]
  57. Wang, C.; Luo, Y.; Huo, Z.; Liu, Z.; Liu, G.; Wang, S.; Lin, Y.; Wu, P. Salt Accumulation during Cropping Season in an Arid Irrigation Area with Shallow Water Table Depth: A 10-Year Regional Monitoring. Water 2022, 14, 1664. [Google Scholar] [CrossRef]
  58. Fuchs, M.; Campbell, G.S.; Papendick, R.I. An Analysis of Sensible and Latent Heat Flow in a Partially Frozen Unsaturated Soil. Soil Sci. Soc. Am. J. 1978, 42, 379–385. [Google Scholar] [CrossRef]
  59. Wan, X.; Liu, E.; Qiu, E. Study on ice nucleation temperature and water freezing in saline soils. Permafr. Periglac. Process. 2020, 32, 119–138. [Google Scholar] [CrossRef]
  60. Van Genuchten, M.T. A closed-form equation for predicting the hydraulic conductivity of unsaturated soils. Soil Sci. Soc. Am. J. 1980, 44, 892–898. [Google Scholar] [CrossRef]
  61. Pronk, P. Fluidized Bed Heat Exchangers to Prevent Fouling in Ice Slurry Systems and Industrial Crystallizers. Doctoral Thesis, Universiteit Delft, Delft, The Netherlands, 2006. [Google Scholar]
  62. Chen, H.; Chen, K.; Yang, M.; Xu, P. A fractal capillary model for multiphase flow in porous media with hysteresis effect. Int. J. Multiphas. Flow 2020, 125, 103208. [Google Scholar] [CrossRef]
  63. Wang, X.; Wang, X.; Wang, P.; Huo, Z.; Wang, C. The Effect of Salinity on Soil Seasonal Freezing-Thawing Process in Areas with Shallow Water Table Depth. Unpublished results. 2023. [Google Scholar]
  64. DRIPD. Measuring Soil Salinity. Available online: https://www.agric.wa.gov.au/soil-salinity/measuring-soil-salinity (accessed on 9 January 2023).
  65. Meter. Measurement Volume of Meter Volumetric Water Content Sensors. Available online: https://www.metergroup.com/en/meter-environment (accessed on 15 January 2023).
  66. Wang, X. Monitoring and Simulation of Water, Heat and Salt Process under Freezing-Thawing Conditions in Saline Soil. Doctoral Thesis, China Agricultural University: Beijing, China, 2021. [Google Scholar]
  67. Liu, G.; Wang, C.; Wang, X.; Huo, Z.; Liu, J. Growing season water and salt migration between abandoned lands and adjacent croplands in arid and semi-arid irrigation areas in shallow water table environments. Agric. Water Manag. 2022, 274, 107968. [Google Scholar] [CrossRef]
  68. Tian, Z.; Wang, L.; Ren, T. Measuring soil freezing characteristic curve with thermo-time domain reflectometry. Eur. J. Soil Sci. 2023, 74, e13335. [Google Scholar] [CrossRef]
Figure 1. Location of the Hetao Irrigation District and the location of the sampling point of the laboratory experiments.
Water 16 00670 g001
Figure 2. Lab experiment setup: (a) a soil column in the temperature controlled chamber, (b) the position of a 5TE sensor in a soil column, and (c) the freezing–thawing condition.
Water 16 00670 g002
Figure 3. Sampling point of the field experiment and test equipment. The stars on the left figure illustrate the location of sampling points in the fields, and the right figure illustrates the vertical structure of soil layers in the field.
Water 16 00670 g003
Figure 4. The observed lab non-saline soil SFCC and the simulated SFCC by the GCE Model, the Combined Model, and the GCE-Salt Model.
Water 16 00670 g004
Figure 5. The observed lab of slightly to highly saline soil SFCC and the simulated SFCC by the GCE-Tan Model, Combined Model, and the GCE-Salt Model at three different salinity levels ((a) slightly (SS = 0.2%, cw = 0.75 g∙L−1), (b) moderately (SS = 0.4%, cw = 1.50 g∙L−1), and (c) highly (SS = 0.6%, cw = 2.25 g∙L−1) saline soil) at a target moisture content of 0.35 cm3·cm−3.
Water 16 00670 g005
Figure 6. The observed field of extremely ((a) from the CL1) and slightly ((b) from the SAL) saline soil SFCC and the simulated SFCC by the GCE-Tan Model, Combined Model, and the GCE-Salt Model.
Water 16 00670 g006
Figure 7. Comparing the Combined Model and GCE-Salt Model under different soil salinity levels. ((a) non-saline (cw = 0 g∙L−1), (b) severely (cw = 3.0 g∙L−1), (c) extremely (cw = 3.72 g∙L−1) and (d) extremely (cw = 4.5 g∙L−1) saline soil) at the SAL soil properties.
Water 16 00670 g007aWater 16 00670 g007b
Table 1. The basic characteristics of soil in the study area.
Soil TypesParticle Distribution/%Specific Surface Area m2·g−1Bulk Density g·cm−3
0.01–2.00 µm2.00–50.00 µm50.00–2000.00 µm
Sandy loam a6.07861.25832.6440.7431.5
Note: a a soil texture determined from the USDA Soil Texture Triangle.
Table 2. The soil properties of the experimental fields.
SITESand
(%) a
Silt
(%) a
Clay
(%) a
Texture dρb
(g∙cm−3) a
θr
(cm3∙cm−3) b
θs
(cm3∙cm−3) b
α
(m−1) c
n c
SAL35.3958.036.57silt loam1.510.0460.4790.0801.171
CL125.6661.7612.58silt loam1.530.1010.4500.0472.354
Note: a lab measured. b field monitored. c calibrated by fitting GCE to measured SFCC. d according to USDA.
Table 3. The shared fitted parameters of the GCE model, the Combined Model, and the GCE-Salt model for the lab non-saline soil.
Parameterα (m−1)nmθs (cm3∙cm−3)θr (cm3∙cm−3)
Value0.0141.690.410.400.046
Table 4. Parameters of the fitting by the selected models for field soil.
SiteSS (%)cw (g·L−1)ModelRMSE (cm3∙cm−3)NSE
CL10.050.16GCE-Tan Model0.0980.94
Combined Model0.0170.98
GCE-Salt Model0.0130.99
SAL1.183.72GCE-Tan Model0.0290.62
Combined Model0.0170.86
GCE-Salt Model0.0130.92
Disclaimer/Publisher’s Note: The statements, opinions and data contained in all publications are solely those of the individual author(s) and contributor(s) and not of MDPI and/or the editor(s). MDPI and/or the editor(s) disclaim responsibility for any injury to people or property resulting from any ideas, methods, instructions or products referred to in the content.

