Article

Microstructural Transformations and Prediction Models of an Expansive Soil Subjected to Simulated Rainfall Conditions

1
School of Water Conservancy, North China University of Water Resources and Electric Power, Zhengzhou 450045, China
2
Key Laboratory of Water Environment Simulation and Treatment of Henan Province, Zhengzhou 450046, China
*
Author to whom correspondence should be addressed.
Water 2024, 16(5), 654; https://doi.org/10.3390/w16050654
Submission received: 1 February 2024 / Revised: 19 February 2024 / Accepted: 21 February 2024 / Published: 23 February 2024

Abstract

:
The pore size distributions of an expansive soil under different simulated rainfall conditions were studied using nuclear magnetic resonance (NMR) techniques. Four sets of treatments with different rainfall intensities (light, moderate, heavy, and rainstorm) and durations (0.5 d, 1 d, 2 d, and 3 d) were designed to analyze the effects of rainfall on the microstructure of the expansive soil. Results show that with increasing rainfall duration, micropores gradually form and develop, enlarge, and interconnect in the soil, eventually forming stable seepage channels. Under light and moderate rain conditions, the proportion of micropores gradually decreases, while the proportions of mesopores and macropores gradually increase. Under heavy and rainstorm conditions, the proportion of micropores sharply decreases and then stabilizes, while the proportions of mesopores and macropores increase. With increasing rainfall intensity, the dominant pore size and porosity both initially increase and then stabilize. A quantitative relationship model between pore size, porosity, and rainfall conditions is established and the fitting effect is good. This study shows that rainfall alters the microstructure of expansive soils, which stabilizes after dynamic equilibrium. This provides a theoretical basis for predicting and controlling the engineering behavior of expansive soils under different rainfall conditions.

1. Introduction

Expansive soils are widely distributed across more than 60 countries and regions worldwide [1]. Owing to their unique mineral composition, which includes hydrophilic minerals such as illite and montmorillonite, these soils are highly sensitive to moisture changes. Unsaturated expansive soils exhibit significant volume expansion when wetted, followed by contraction upon drying. This characteristic poses a serious threat to the stability of structures built on them [2,3]. In areas with hot, humid climates and specific geological conditions, disasters in expansive soil regions are frequent [4,5,6]. Rainfall infiltration, a primary environmental factor, activates the expansion and contraction of expansive soils by altering their hydrological mechanisms. It increases the soil’s self-weight and water content, and alters its internal pore structure, rendering the soil unstable [7,8]. Therefore, a thorough understanding of the quantitative relationship between rainfall conditions and the response of the soil’s pore structure volume change is crucial to prevent and address related engineering issues.
Climate change is altering precipitation patterns and is expected to increase the frequency and intensity of extreme rainfall events in many regions. This change exacerbates the harmful effects of expansive soils [9,10]. However, the quantitative relationship between rainfall parameters and the behavior of expansive soils remains inadequately defined. Van Genuchten [11] pioneered the field by proposing a foundational framework for correlating soil–water retention curves with pore size distributions. On this basis, some researchers have used traditional geotechnical testing methods to explore the effects of different water contents on expansive soils [12,13,14]. Despite these advances, most studies have concentrated on the macro-scale swelling properties, with a limited understanding of the microscopic changes in pore structure under rainfall infiltration. Consequently, this area of study necessitates further in-depth research and exploration.
Changes in pore structure are considered a fundamental factor influencing the macroscopic mechanical properties of soils [15,16]. Skvortsova et al. [17] contend that under external environmental influences, soil structure is complex and dynamic, making the geometry of the pore space a crucial indicator of the soil’s structural state. Over decades, several traditional methods for testing pore structure, such as mercury intrusion porosimetry, gas adsorption method, and imaging techniques, have been developed. However, it is apparent that while these traditional pore testing methods are theoretically robust and widely used, they have stringent requirements for specimens and are prone to disturbances during soil sample preparation, limiting their ability to continuously monitor the evolution of the internal structure [18,19,20,21]. In recent years, advanced nuclear magnetic resonance (NMR) relaxation measurement techniques have enabled non-invasive and continuous monitoring of changes in soil pore size distribution. The NMR technique offers the advantages of being rapid, non-destructive, contact-free, and efficient in time usage. Furthermore, the information on pore size distribution, represented through T2 distribution, provides a more comprehensive understanding.
Within this technical framework, Zhiqiang Mao [22] used core nuclear magnetic resonance (NMR) T2 distribution and capillary pressure analysis data, and the pore structure of the rock was revealed more comprehensively. Similarly, Kuan Liu [23] integrated triaxial tests, NMR experiments, and scanning electron microscope (SEM) experiments to observe the effects of wet–dry cycling on the macroscopic mechanical parameters and microstructure of remodeled expansive soil samples. He discovered that as the number of wet–dry cycles increased, the soil’s shear strength decreased, the stress–strain curve became more ductile, and the pore structure shifted from microporous to macroporous. Additionally, G.F. Wei [19] applied NMR techniques to analyze the stage characteristics and mechanisms influencing the swelling curve from the perspective of changes in pore space, noting a decrease in swelling rate with prolonged water absorption. Fugang Shi [24], meanwhile, investigated the alterations in the pore size distribution of expansive soil during dewatering and shrinkage using the NMR relaxation method. These studies demonstrate the effectiveness of NMR techniques in examining the microscopic changes in the pore structure of expansive soils. However, existing research has not yet integrated NMR data with rainfall conditions to establish a quantitative connection between these conditions and microscopic changes in pore volume. Therefore, we have combined NMR measurements with laboratory-simulated rainfall experiments to gain a deeper understanding of the microscopic mechanisms through which water-induced changes in pore structure trigger swelling strains.
In this study, we employed NMR relaxation measurements, complemented by simulated rainfall experiments conducted in the laboratory, to systematically investigate the specific effects of rainfall intensity and duration on the pore structure of expansive soils. This methodology enabled us to delve into the microscopic interactions between wetting events and changes in soil volume, thereby offering new insights into this complex phenomenon. By integrating the relationship between rainfall parameters and pore structure characteristics into a modeling framework grounded in physical principles, our research not only improves the accuracy of predicting the field behavior of expansive soils but also aids in understanding their damage mechanisms. This study holds critical significance in developing disaster response strategies for regions with expansive soils, offering essential guidance for related engineering design and soil management practices.

2. Materials and Methods

2.1. Expansive Soil Characterization

The soil samples used in this study were collected from an expansive soil slope in Ye County, Pingdingshan, alongside the South-to-North Water Diversion Project channel. The sampling location coordinates were 113.15° E and 33.55° N, with a sampling depth of 1–1.5 m. Soil samples are representative of the region. The soil was brownish-red clay, stiff plastic, mostly filled with grayish-green clay.
The retrieved soil samples were divided into ten groups, according to GBT 50123-2019 [25] (China Standard), and a series of basic physical tests were performed on the collected soil samples, taking the average of the results of the test. The test results of the basic physical properties of soil samples and test standard deviations are shown in Table 1, and the particle distribution curve is shown in Figure 1, in which the free expansion rate of soil samples is 43.7%, according to ASTM D 2487-93 [26], and it can be judged that the soil samples taken are low plasticity clay.

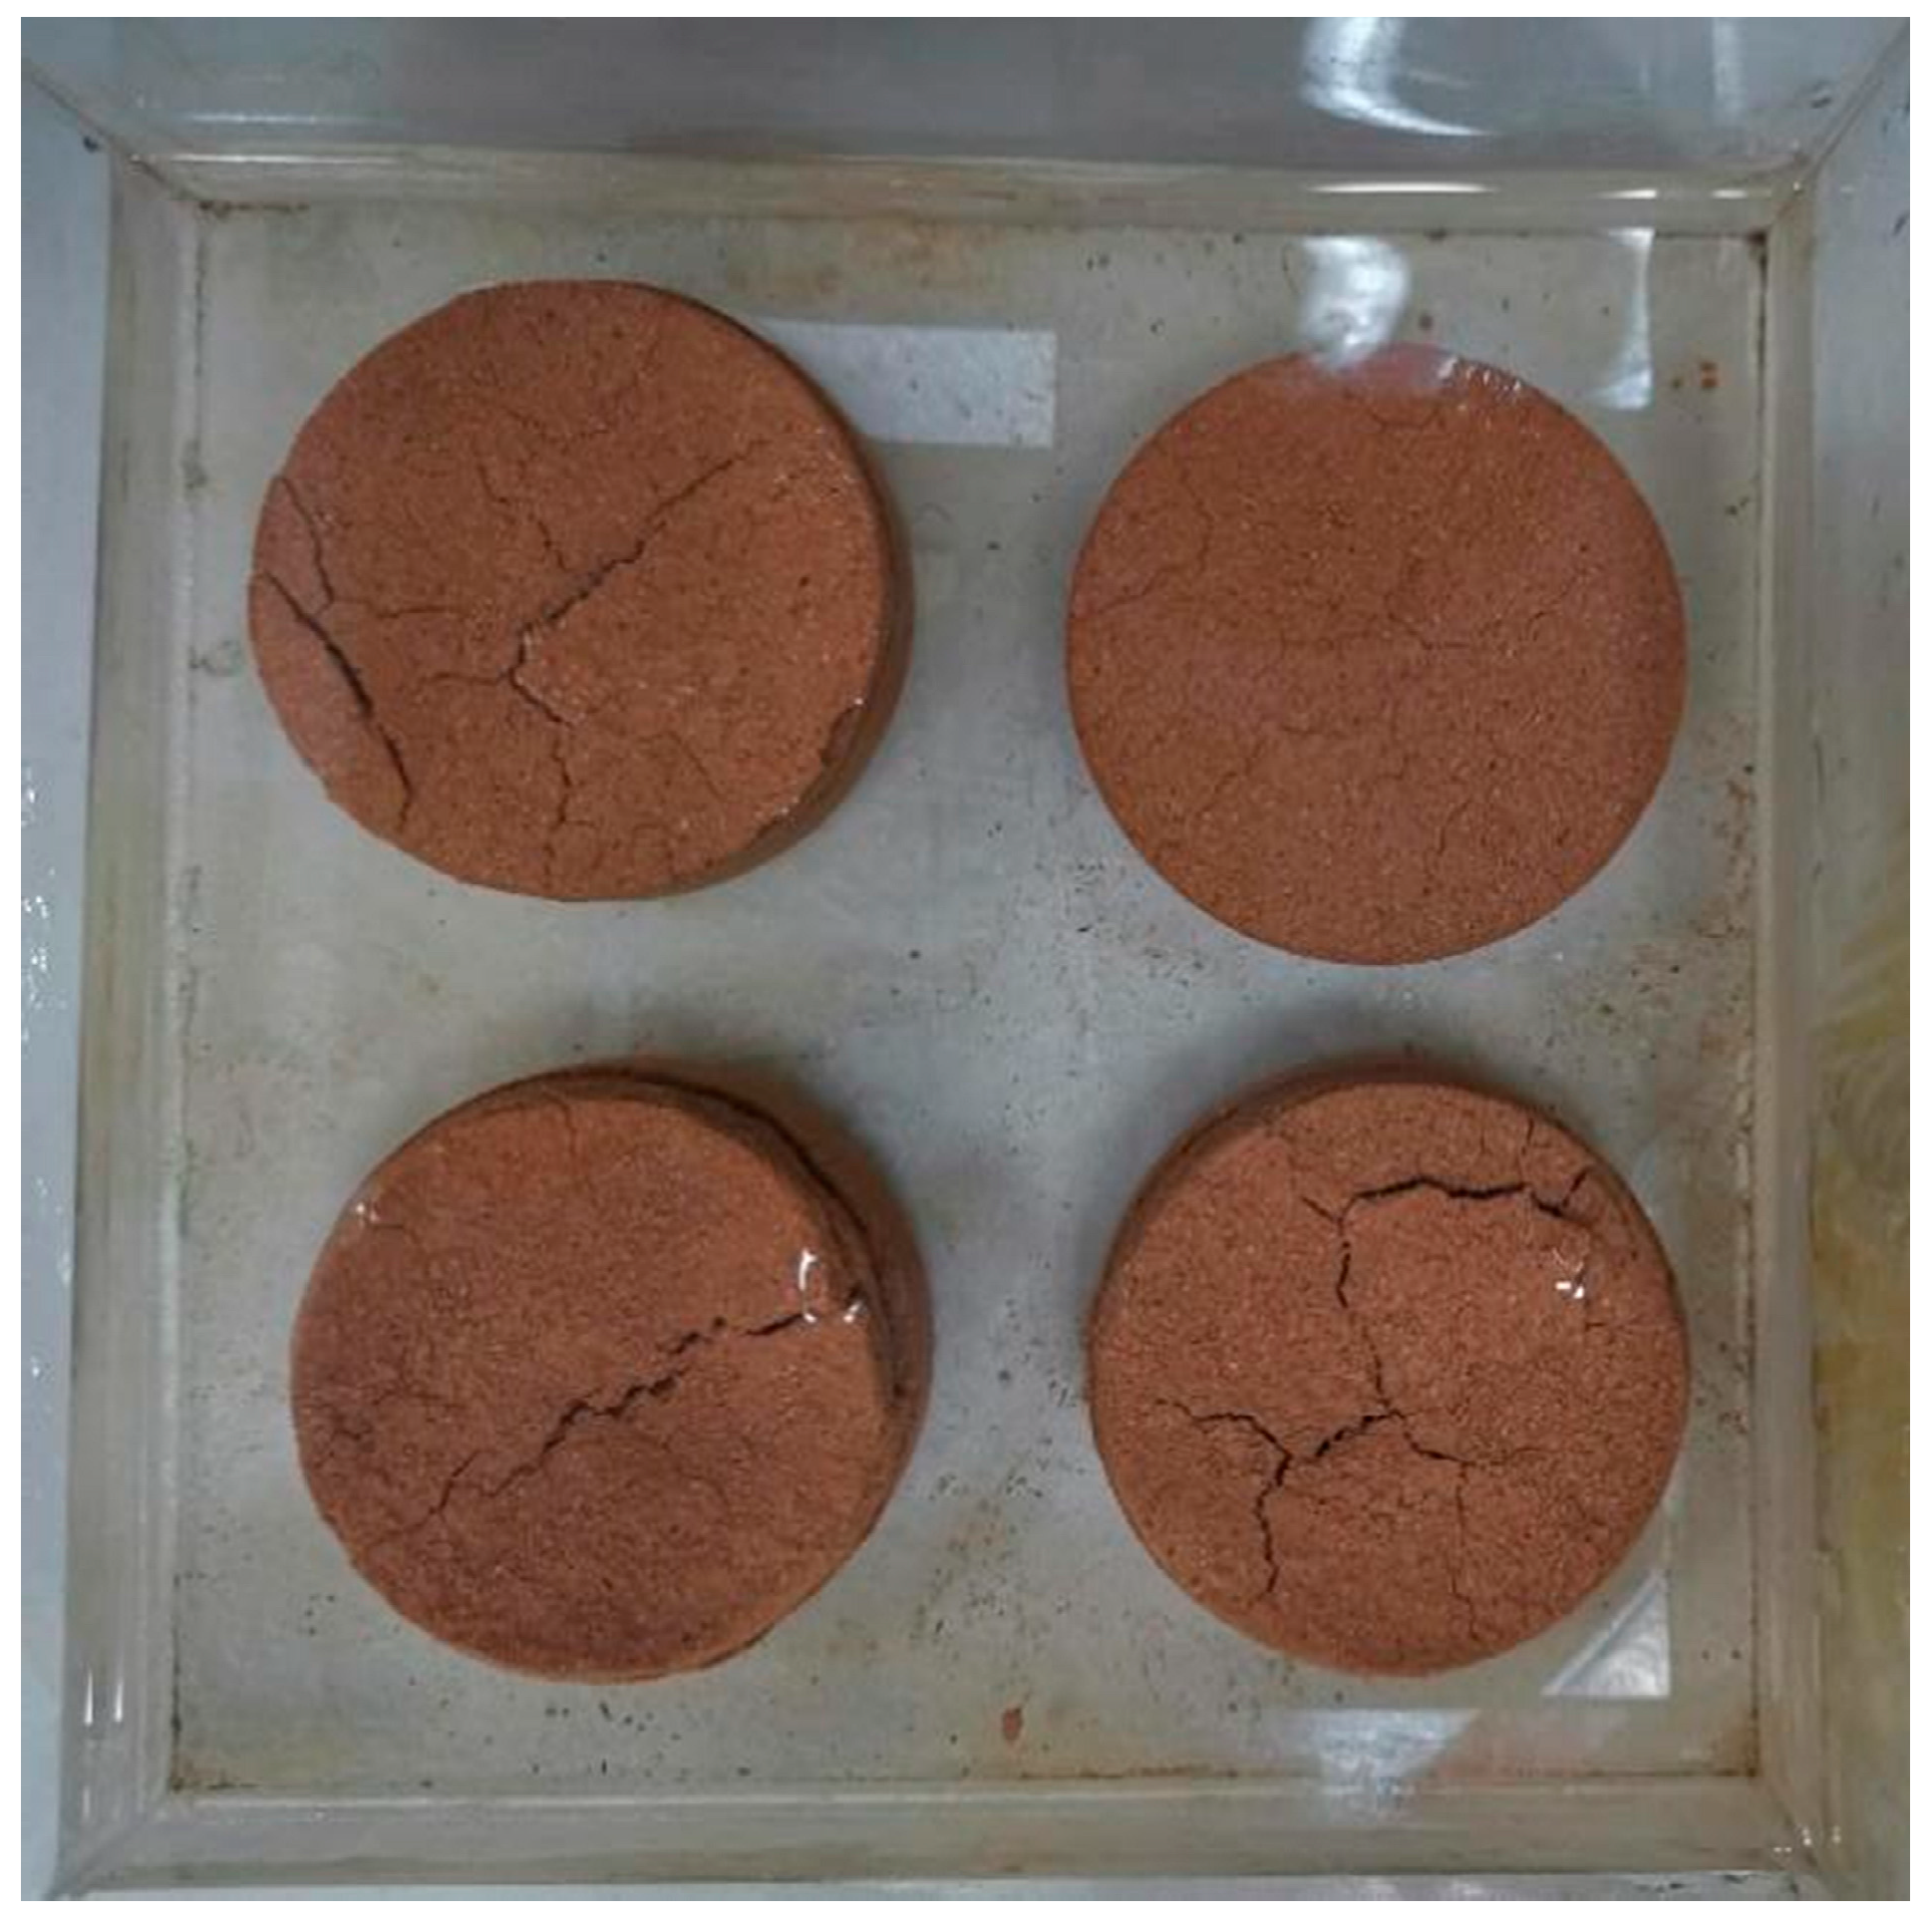
2.2. Sample Preparation Protocol

This study used remolded expansive soils, prepared through the following procedure:
(1) Pre-treatment of soil samples: the collected Pingdingshan expansive soil was naturally air-dried and crushed using a crushing hammer (see Figure 2a).
(2) Sieving and drying: according to GBT 50123-2019 [25] (Chinese standard), the processed soil samples were sieved using a 2 mm aperture sieve mesh, and then the soil samples were put into a 100 °C oven for 24 h.
(3) Adjusting the moisture content of soil samples: after drying, the moisture content of the soil samples was adjusted to 14%, and the soil samples were frequently turned to prevent clumping during the addition of water.
(4) Sealing and resting of soil samples: after adjusting the water content, we sealed the soil samples with plastic film and left them for 24 h to ensure that the soil and water were evenly mixed, as shown in Figure 2b.
(5) Review of water content: after completion of the resting, we re-tested the water content of the soil sample to ensure that it was within the range of 14 ± 1%.
(6) Preparation of specimen: since steel and iron materials will interfere with the magnetic field of the NMR test, it was necessary to apply petroleum jelly between the specimen and the ring cutter for subsequent separation.
(7) Compacting and shaping: We put the soil sample into the ring knife mold with a height of 20 mm and a diameter of 61.8 mm and compacted it 25 times with a compactor, then took out the specimen and flattened the two ends with a chipping knife. Figure 2c shows the compacting instrument of the soil sample.
(8) Separation and weighing: We removed the specimen from the ring knife and weighed the specimen mass. The prepared specimen block is shown in Figure 2d.
(9) Repeat preparation: We repeated the preparation of several sets of test blocks according to the above steps to meet the needs of subsequent tests.
Figure 2. Test block preparation diagram. (a) Crushing. (b) Sealing and resting. (c) Compacting. (d) Molding.
Water 16 00654 g002

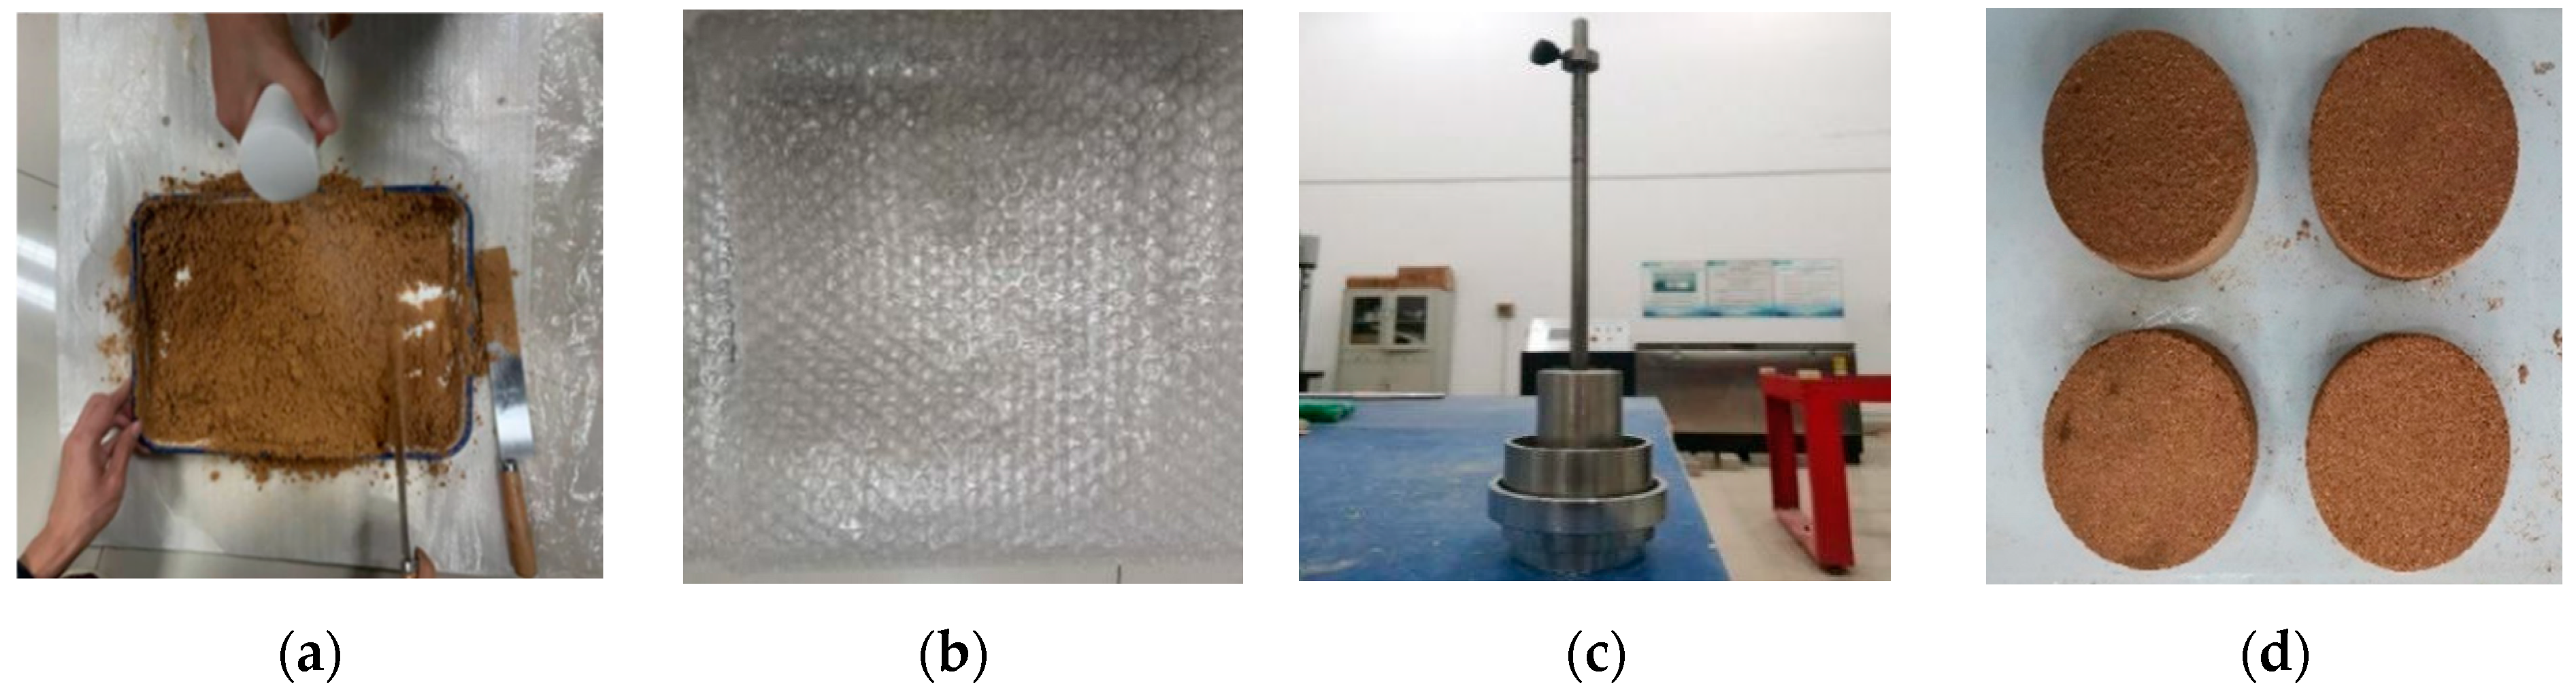
2.3. Simulated Rainfall Equipment

To simulate real rainfall conditions, the concept of rainfall intensity must be introduced. According to the rainfall intensity grading standards (see Table 2), based on GB/T 28592-2012 [27] (Chinese standard), the rainfall intensity is divided into 4 levels—light rain, moderate rain, heavy rain, and rainstorm—for which experiments were carried out separately.
Based on Equation (1) and the rainfall intensity classification criteria, the flow ranges corresponding to different rainfall intensities can be deduced.
Q = A × p t
where Q is the flow rate required to simulate rainfall, mL/h; A is the cross-section area of the ring cutter, m m 2 ; p is the amount of precipitation,   m m ; t is the time of rainfall, h.
Based on the calculated flow rate ranges and rainfall intensity level classifications, the flow controllers in the simulated rainfall device (see Figure 3) were adjusted to simulate rainfall of various intensities (flow rates adjusted to median values). The device consists of three parts from top to bottom: a water storage tank, a flow controller for simulating different rainfall conditions, and a container for holding the soil samples, with small holes at the bottom to provide downward seepage channels for the samples.

2.4. NMR Measurement Parameters

Nuclear magnetic resonance (NMR) techniques detect pore structures in samples by receiving resonance signals from H atoms in the pore spaces; thus, the samples must be saturated with H atom-containing liquid before NMR testing. Since water is an important variable in the simulated rainfall experiments, the samples cannot be saturated with water, based on the relevant literature [28,29]. In this paper, each group of specimens was put into kerosene for saturation treatment after rainwater treatment, and the saturation time was 24 h. After saturation, nuclear magnetic porosity testing was carried out, and the instrument used was MesoMR12-060H-I NMR Permanent Magnet Benchtop MRI Analyzer (Neumay Analytical Instruments Co., Ltd., Suzhou, China), with a magnet frequency of 12.84 MHz and a magnetic field strength of 0.3 ± 0.05 T. Figure 4 shows the specimens that are undergoing the kerosene saturation treatment.
The NMR pore measurement principle is based on the relaxation mechanism of H-atom transitions. Surface relaxation occurs at solid–liquid interfaces, i.e., the particle surfaces of rocks. Its relaxation rate depends on pore size, with smaller pores corresponding to faster relaxation, generally occurring within smaller-sized pores. Under ideal conditions, relaxation satisfies the following equation:
1 T 2 S = ρ 2 ( S V ) p o r e
where T 2 S is the transverse relaxation time; ρ 2 is the transverse surface relaxation rate; S / V is the pore surface area to fluid volume ratio. For simple-shaped pores, S / V is related to pore size. A cylindrical pore model was used in this study. Assuming a pore radius of r and length L, the S / V value is 2/r.

3. Results and Analysis

3.1. Pore Structure Characterization by NMR Relaxometry

This study examined the effects of different rainfall durations on the microstructure of expansive soils. Simulated rainfall experiments with durations of 0.5 d, 1 d, 2 d, and 3 d were carried out for the different rainfall intensity grades, and categorized into light rain, moderate rain, heavy rain, and rainstorm groups.

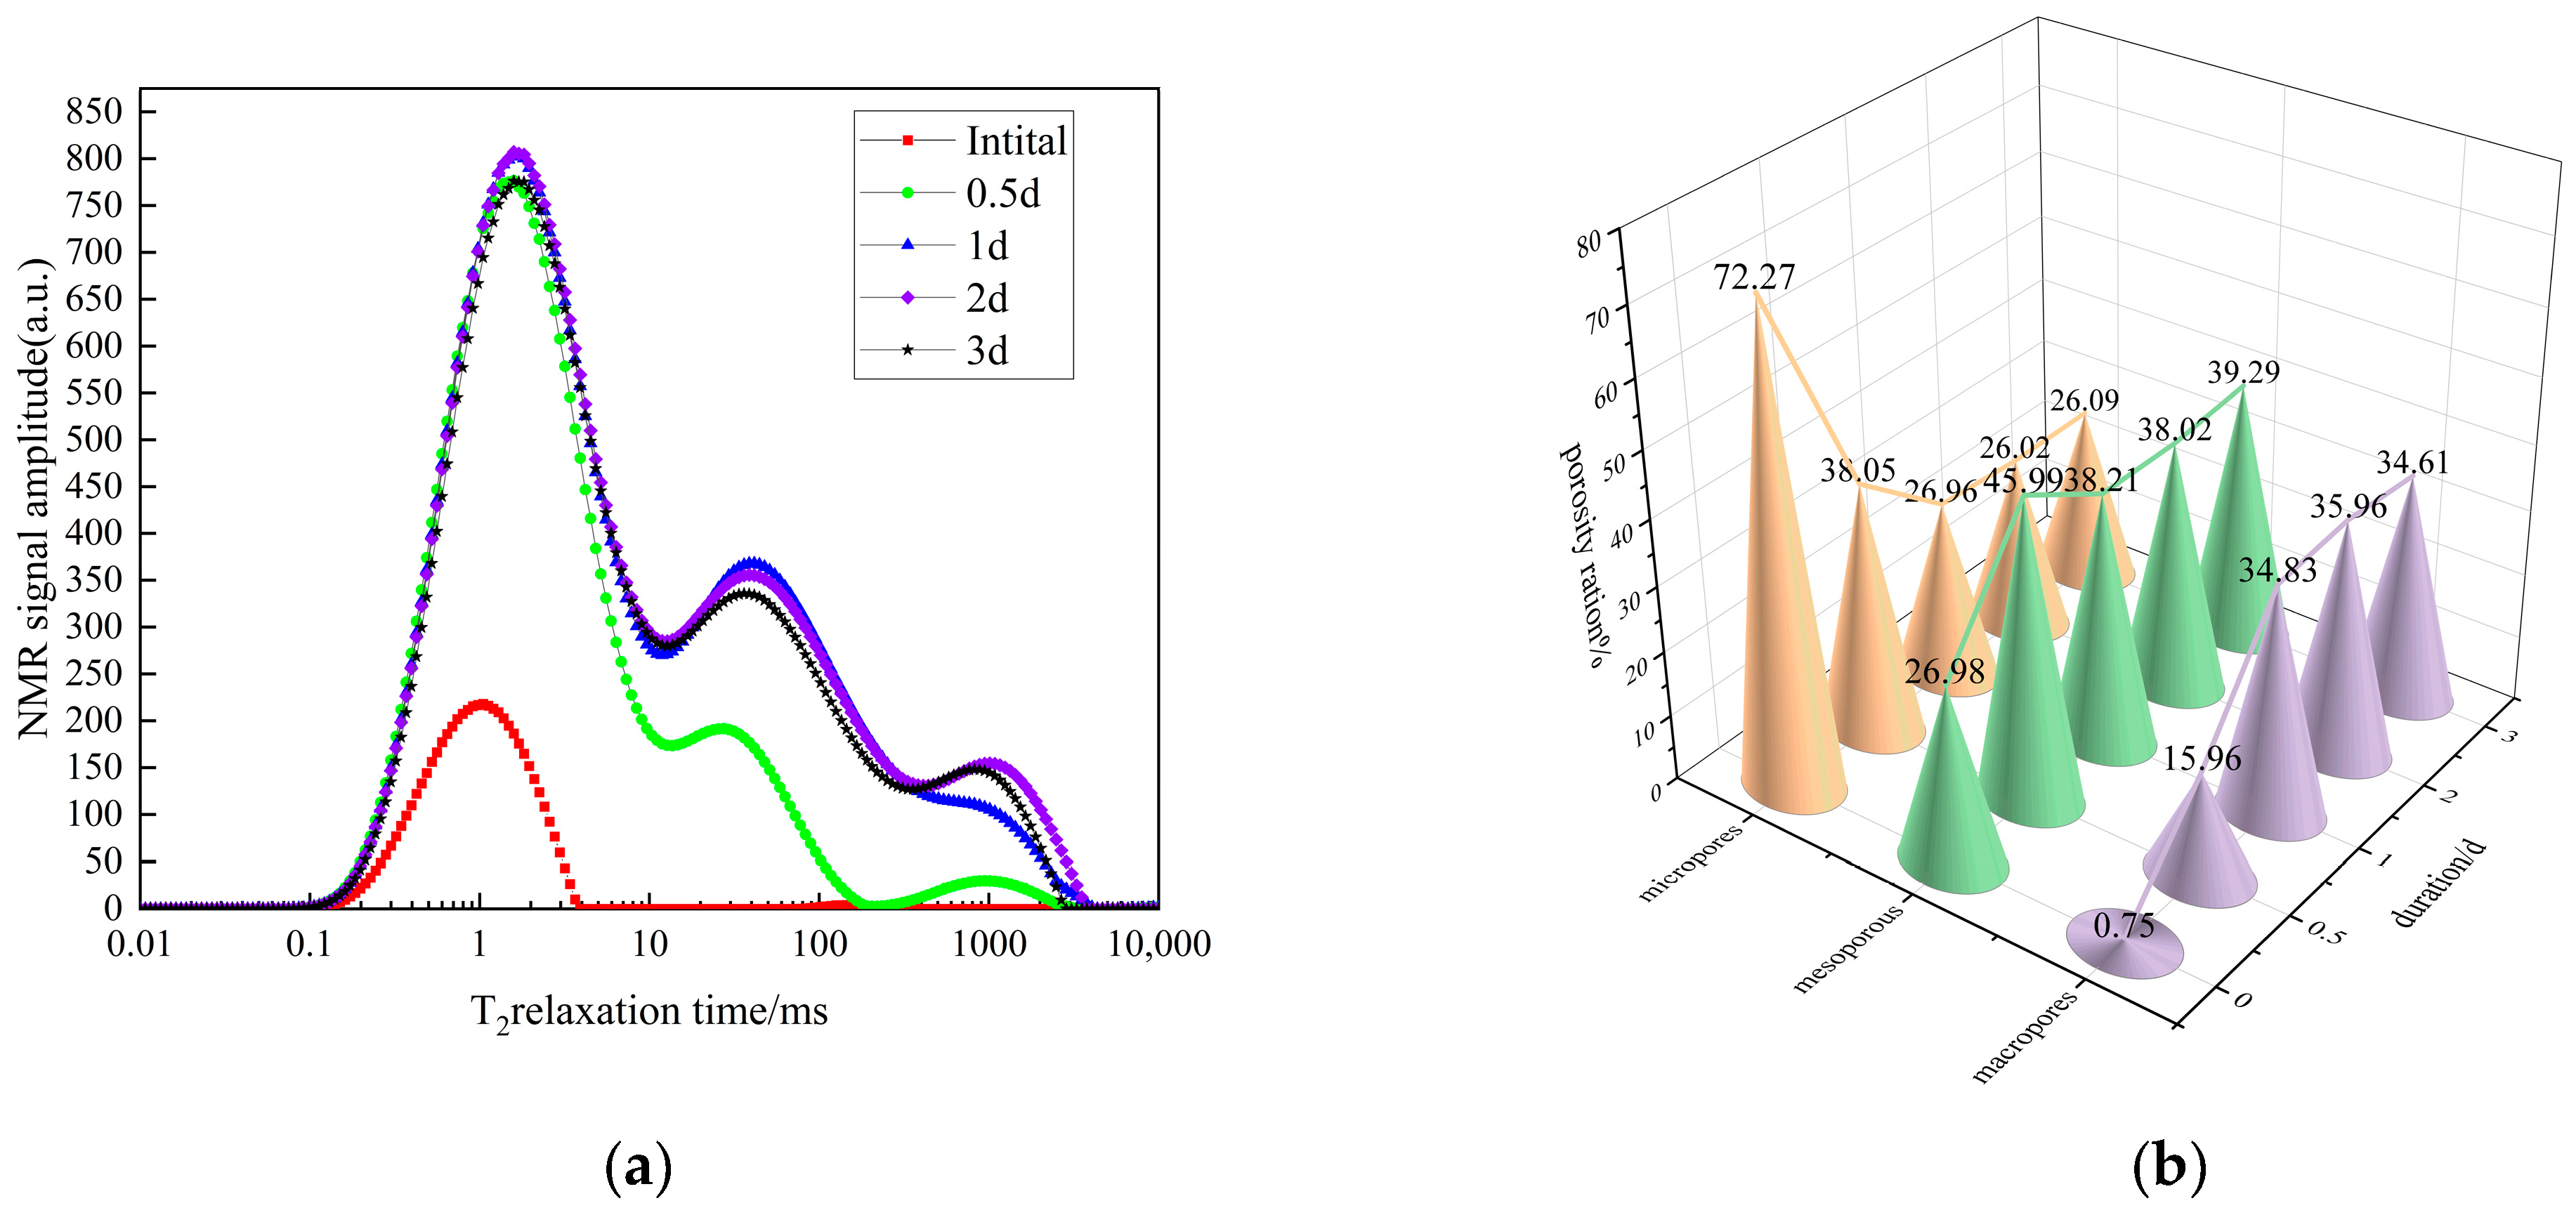
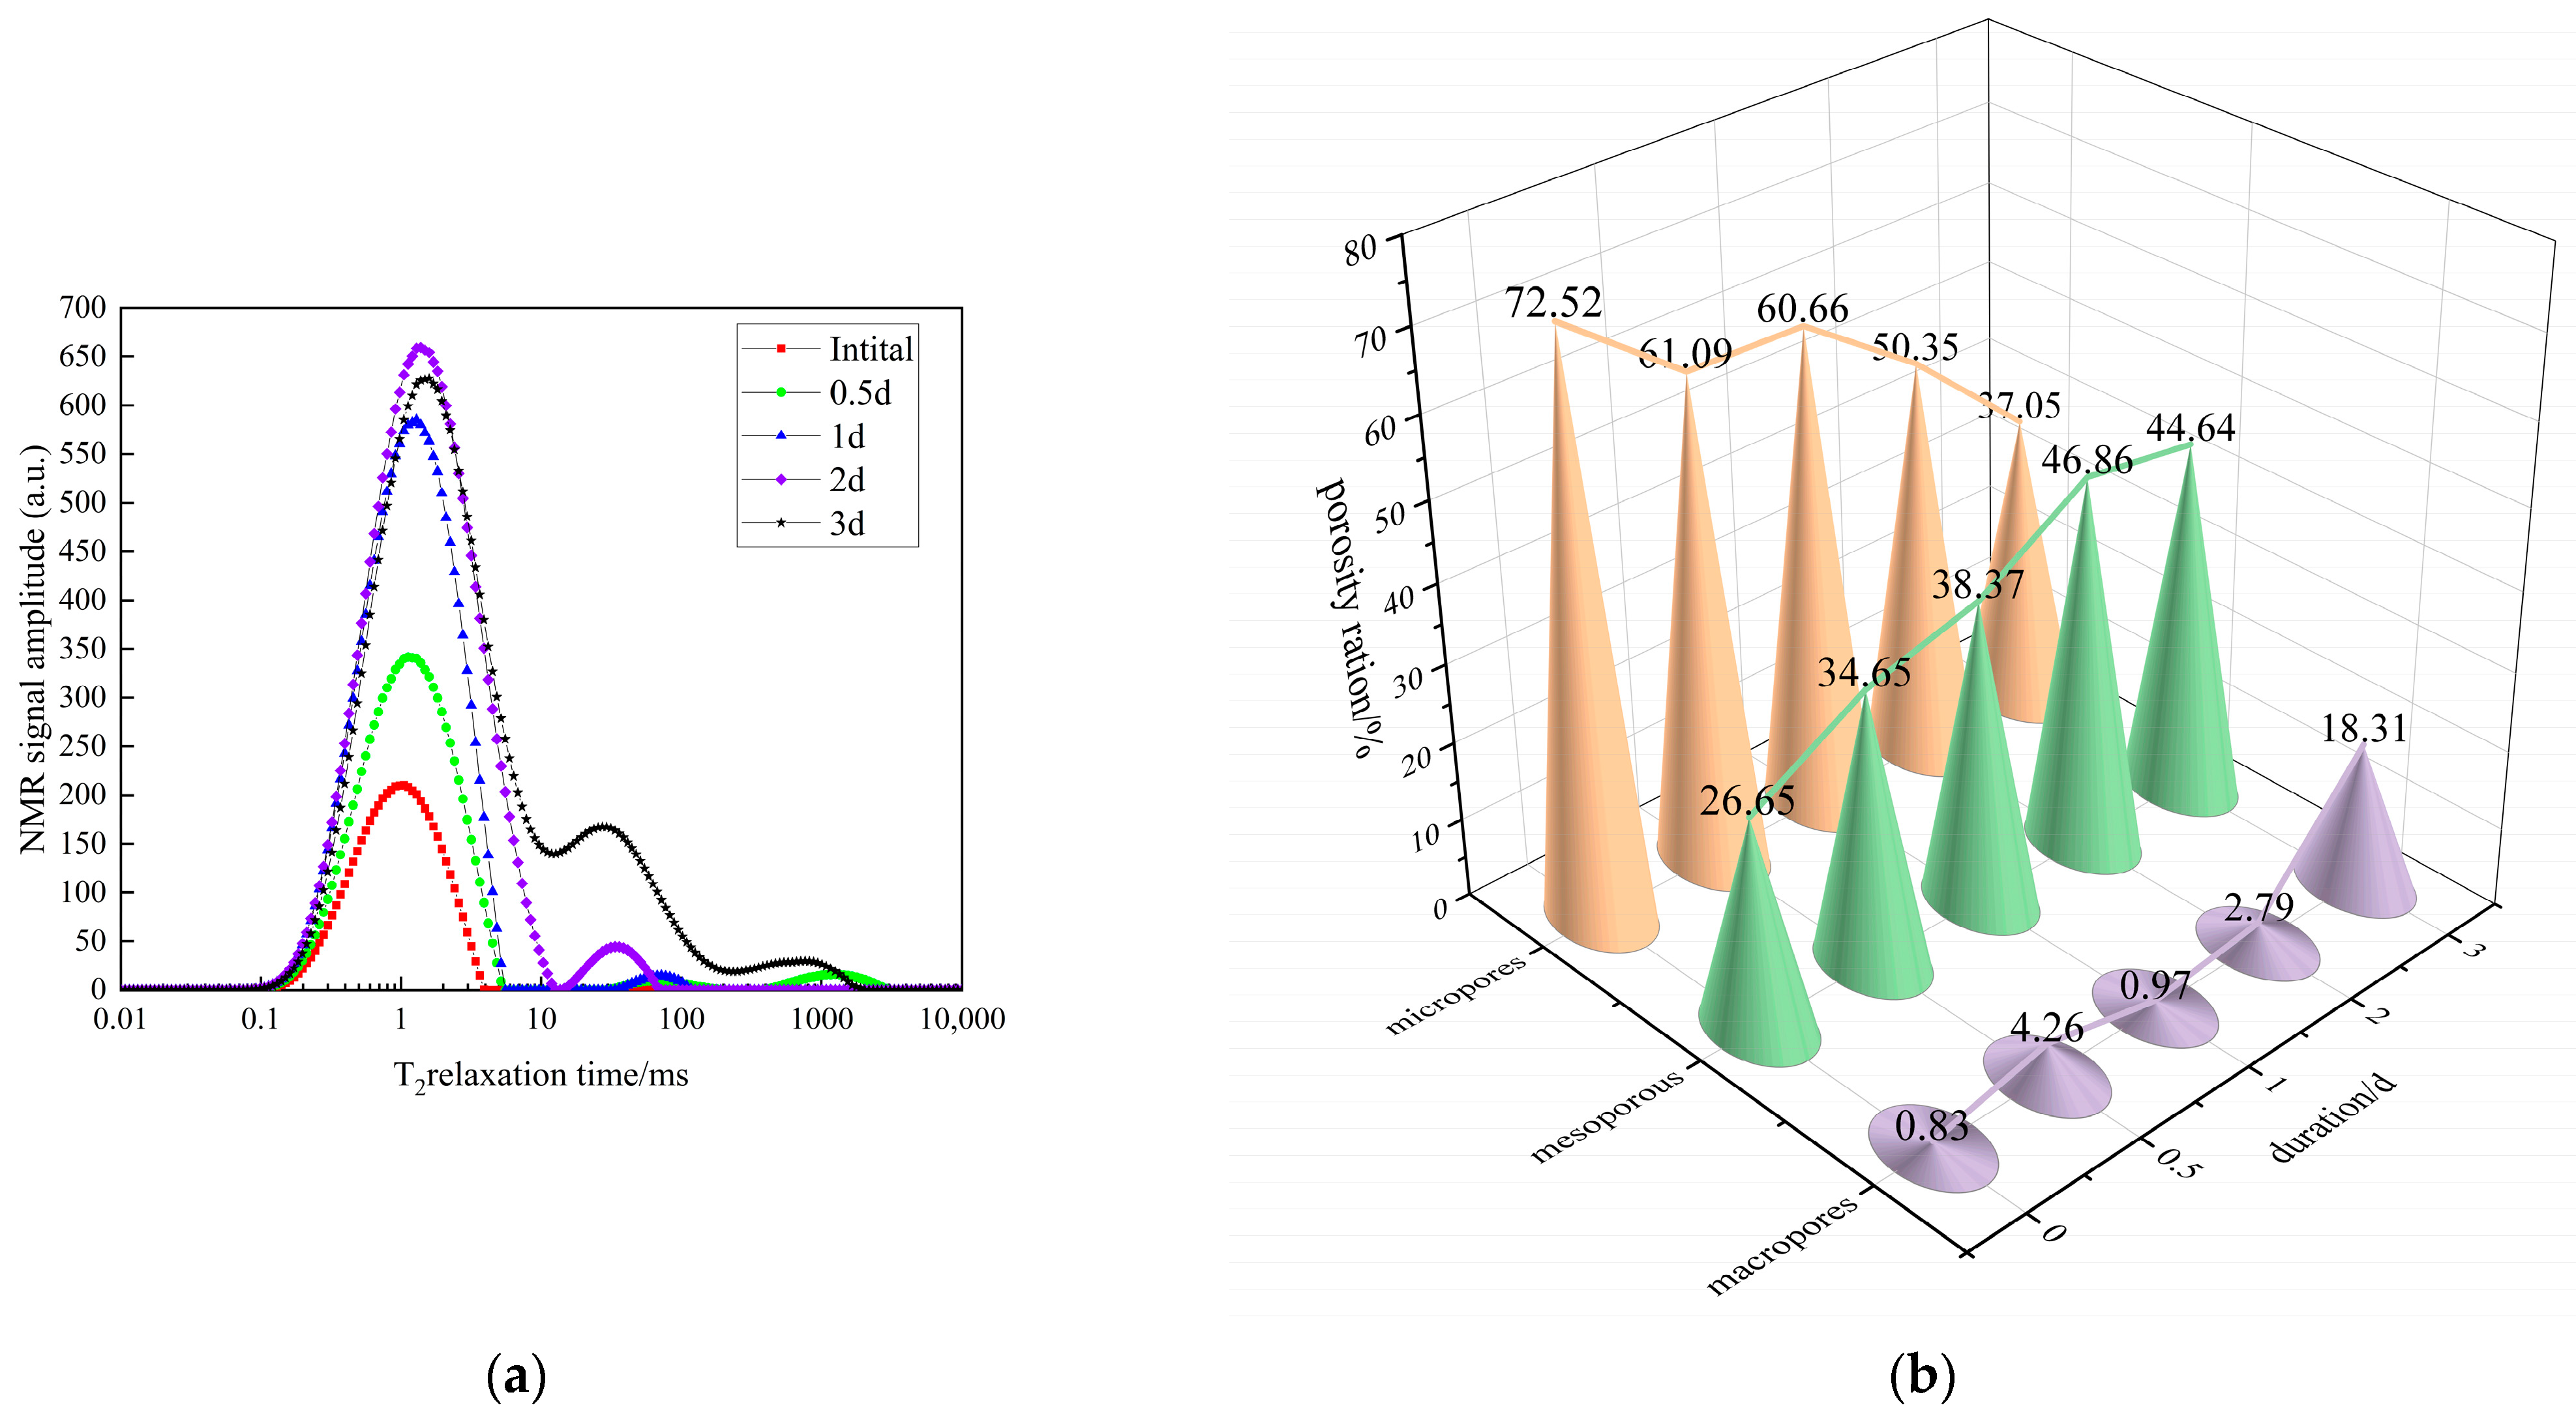
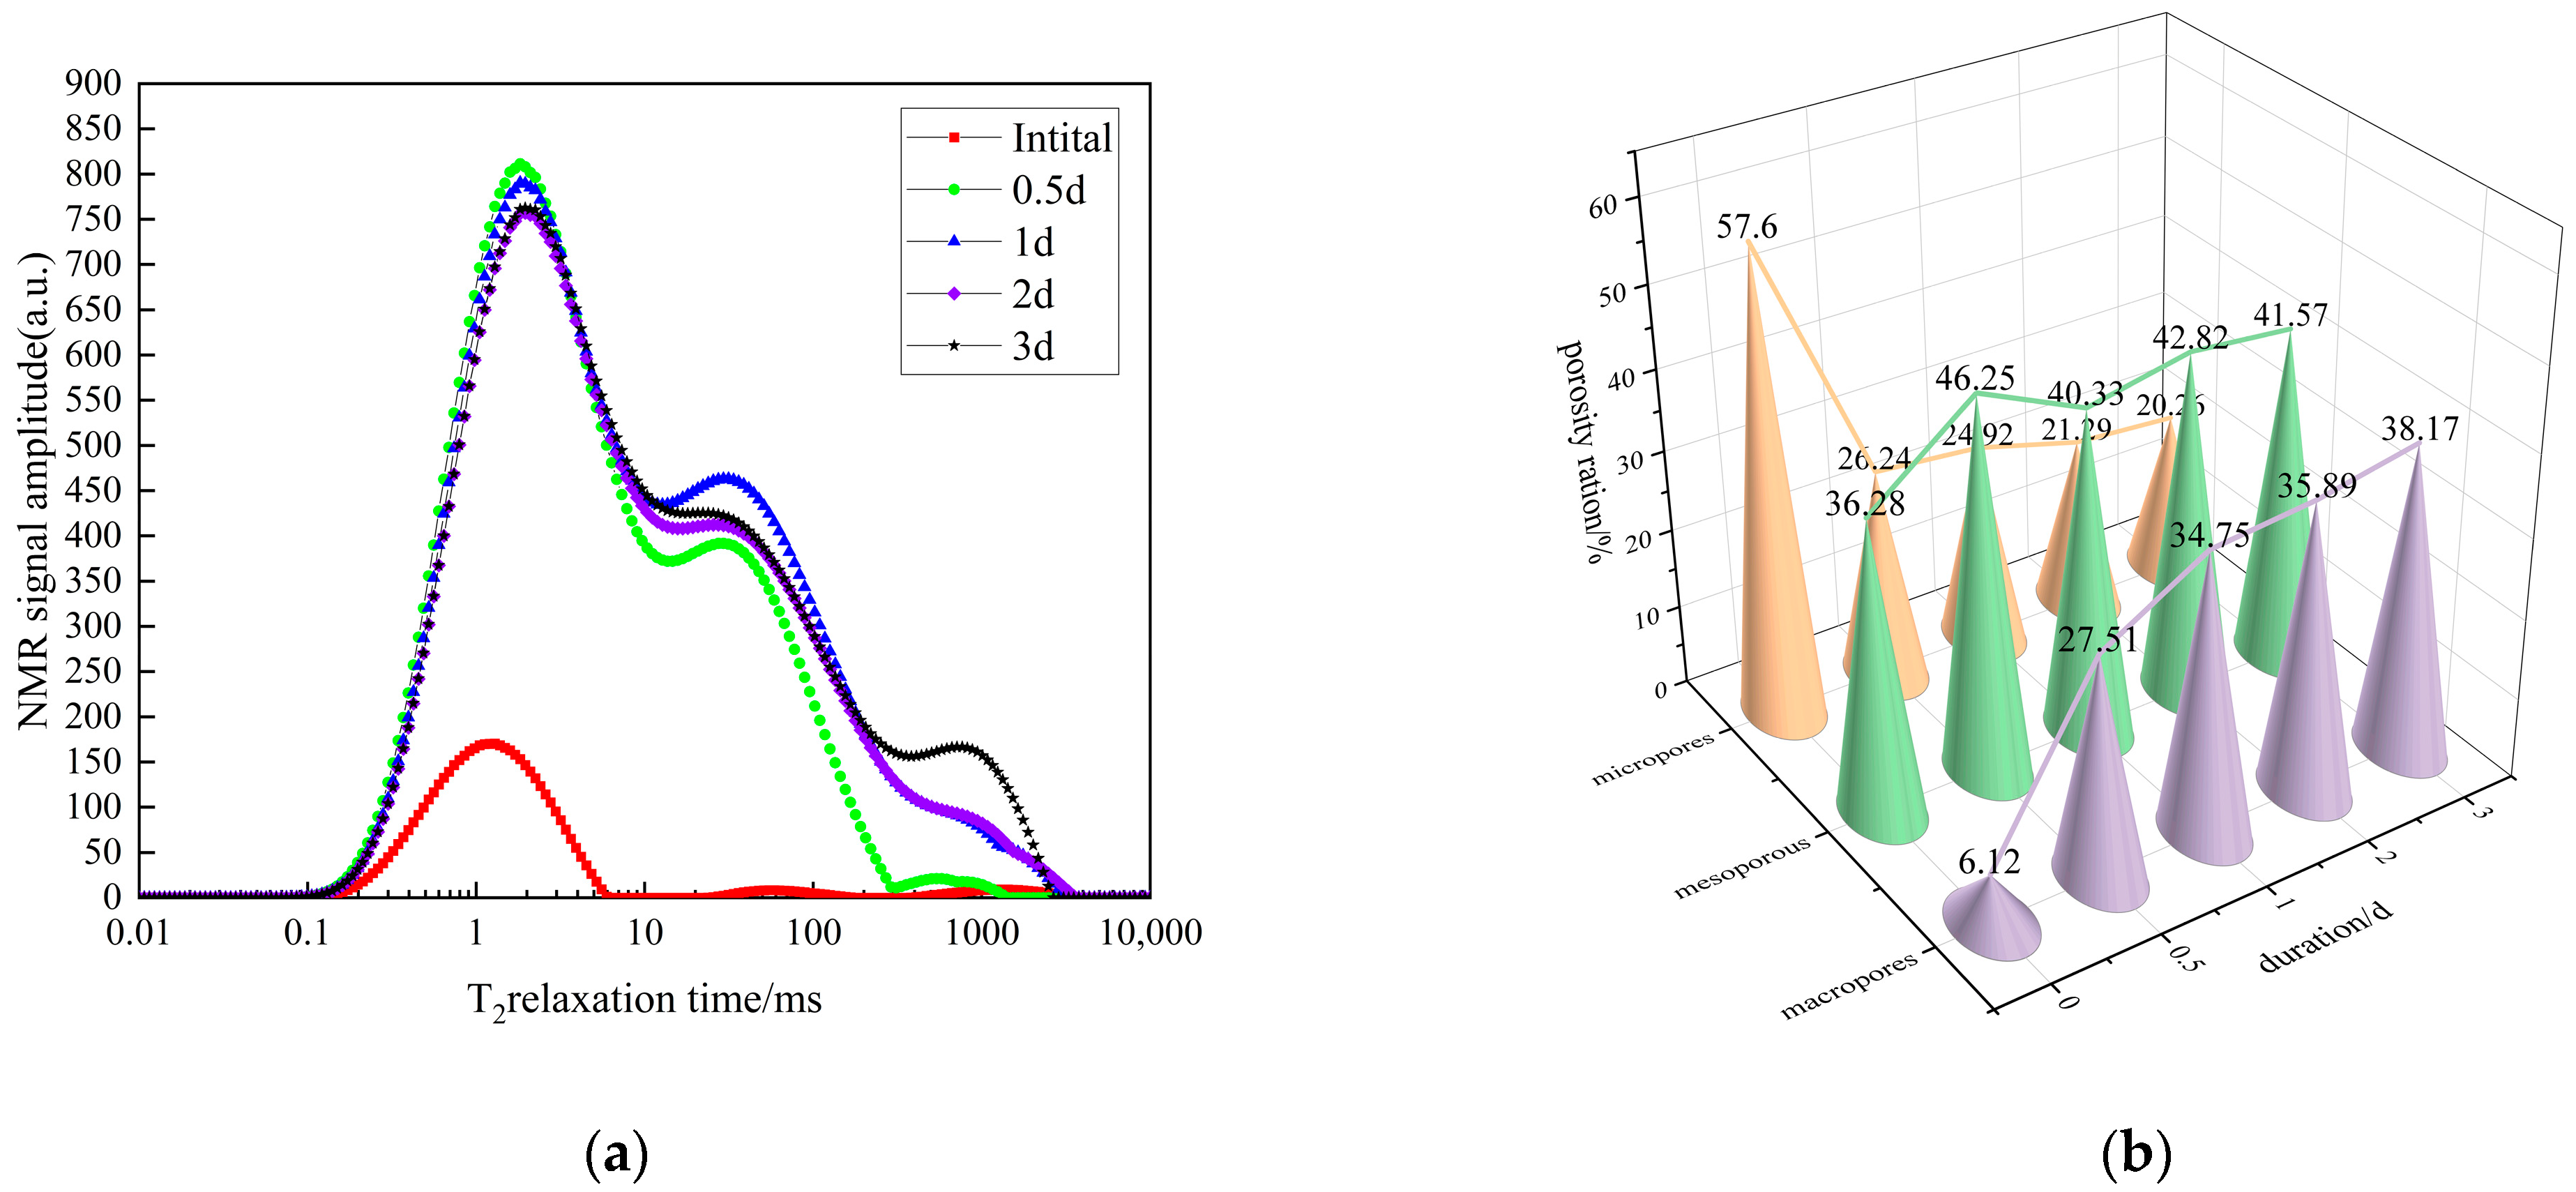
Dynamic Evolution of Pore Size Distributions with Increasing Rainfall Duration

NMR measurements were used to analyze the effects of rainfall duration on expansive soil pore size distributions under light, moderate, heavy, and rainstorm conditions. Following convention [30,31], pores were categorized into three classes by radius size: micropores (r < 1.0 μ m ), mesopores (1.0 μ m   ≤ r < 10 μ m ), and macropores (r ≥ 10 μ m ). Figure 5 shows that within the studied rainfall durations, micropores and mesopores dominate the overall pore volume in light rain samples, exceeding 90%. With increasing rainfall duration, the proportion of micropores exhibited a downward trend, decreasing from 72.52% to 37.05% within 3 days. In contrast, the proportion of mesopores showed an overall upward trend, increasing from 26.65% to 44.64%, despite a slight decrease on the 3rd day. The proportion of macropores initially remained relatively stable but increased markedly to 18.31% on the 3rd day from 0.83%. This indicates that internal structural changes occurred, with the potential to form interconnected flow paths even under light rain intensity given sufficient wetting time.
For the moderate rain samples, similar trends as the light rain conditions were observed (Figure 6). As duration increased, the percentage of micropores continuously decreased, while mesopores and macropores proportions increased over time. However, the decrease rate for micropores and the increase rate for macropores were higher compared to light rain conditions. This implies that greater evolution and interconnection of internal pore structures occurred under moderate rain intensity. After 3 days of wetting, the micropore proportion decreased by 45.44% compared to the initial state, mesopores increased by 10.85%, and macropores increased by 34.59%.
Under heavy rain conditions, a distinct transition of internal pore structures from initial micropore dominance to mesopore dominance after wetting was observed (Figure 7). Specifically, the percentage of micropores decreased sharply within the initial 0.5 days, then remained relatively stable, decreasing minimally with further time. In contrast, the proportions of meso- and macro-pores gradually increased during wetting. Notably, after heavy rain infiltration for 1 d, the pore size distribution stabilized, with little further change. This indicates that an equilibrium pore structure was reached, likely due to sufficient pore enlargement and interconnection to form continuous drainage networks. The data shows that beyond a threshold wetting load, pore features no longer undergo pronounced evolution. Similar structural stabilization was observed under rainstorm conditions, although on an earlier time scale.
In summary, increasing rainfall duration led to pronounced progressive changes in the internal pore structures of the tested expansive soils, which manifested as systematic decreases in micropores and increases in larger pores. Under higher rainfall intensity conditions, the degree and rate of structural evolution were exacerbated. Notably, pore size distributions stabilized after certain wetting durations, which was earlier for rainstorms than heavy rain (Figure 8), indicating that dynamic equilibrium was reached. This implies potential critical threshold values for cumulative rainfall infiltration, beyond which pore structures no longer undergo significant change. Quantifying the relationship between rainfall parameters and pore characteristics lays the foundation for a deeper understanding and simulation of the evolution and stabilization of the pore structure of expansive soils under wet loading.

3.2. Quantification of Dominant Pore Size and Porosity Responses to Rainfall

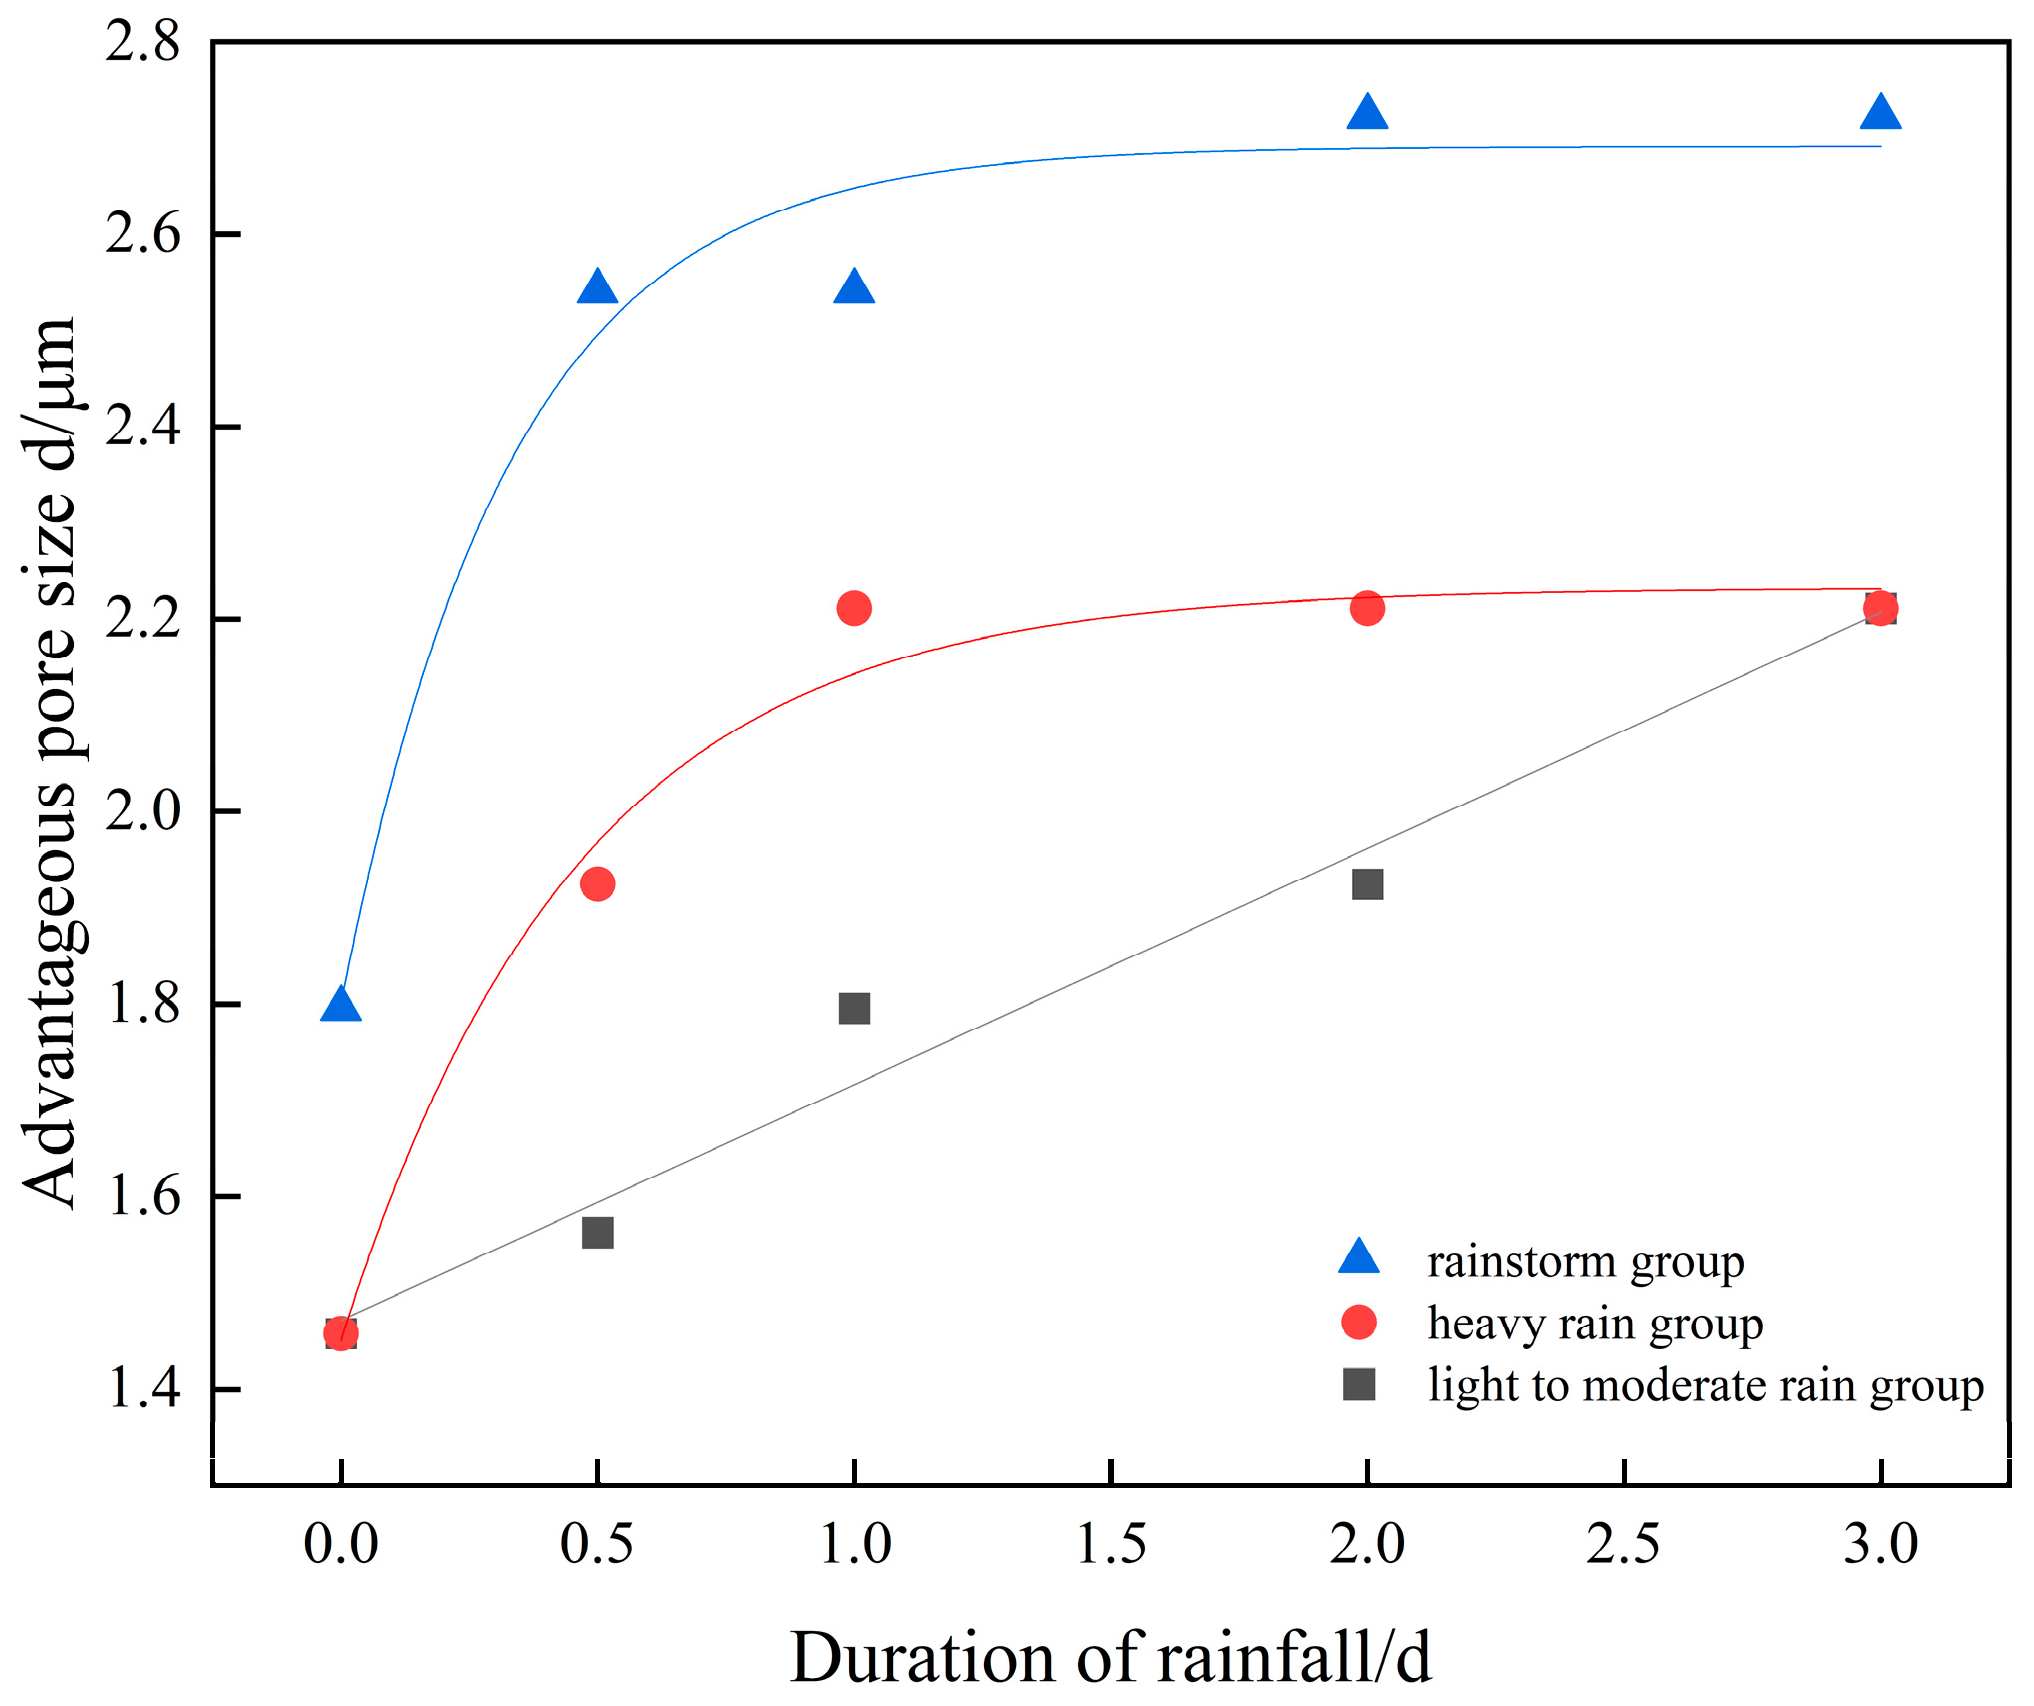
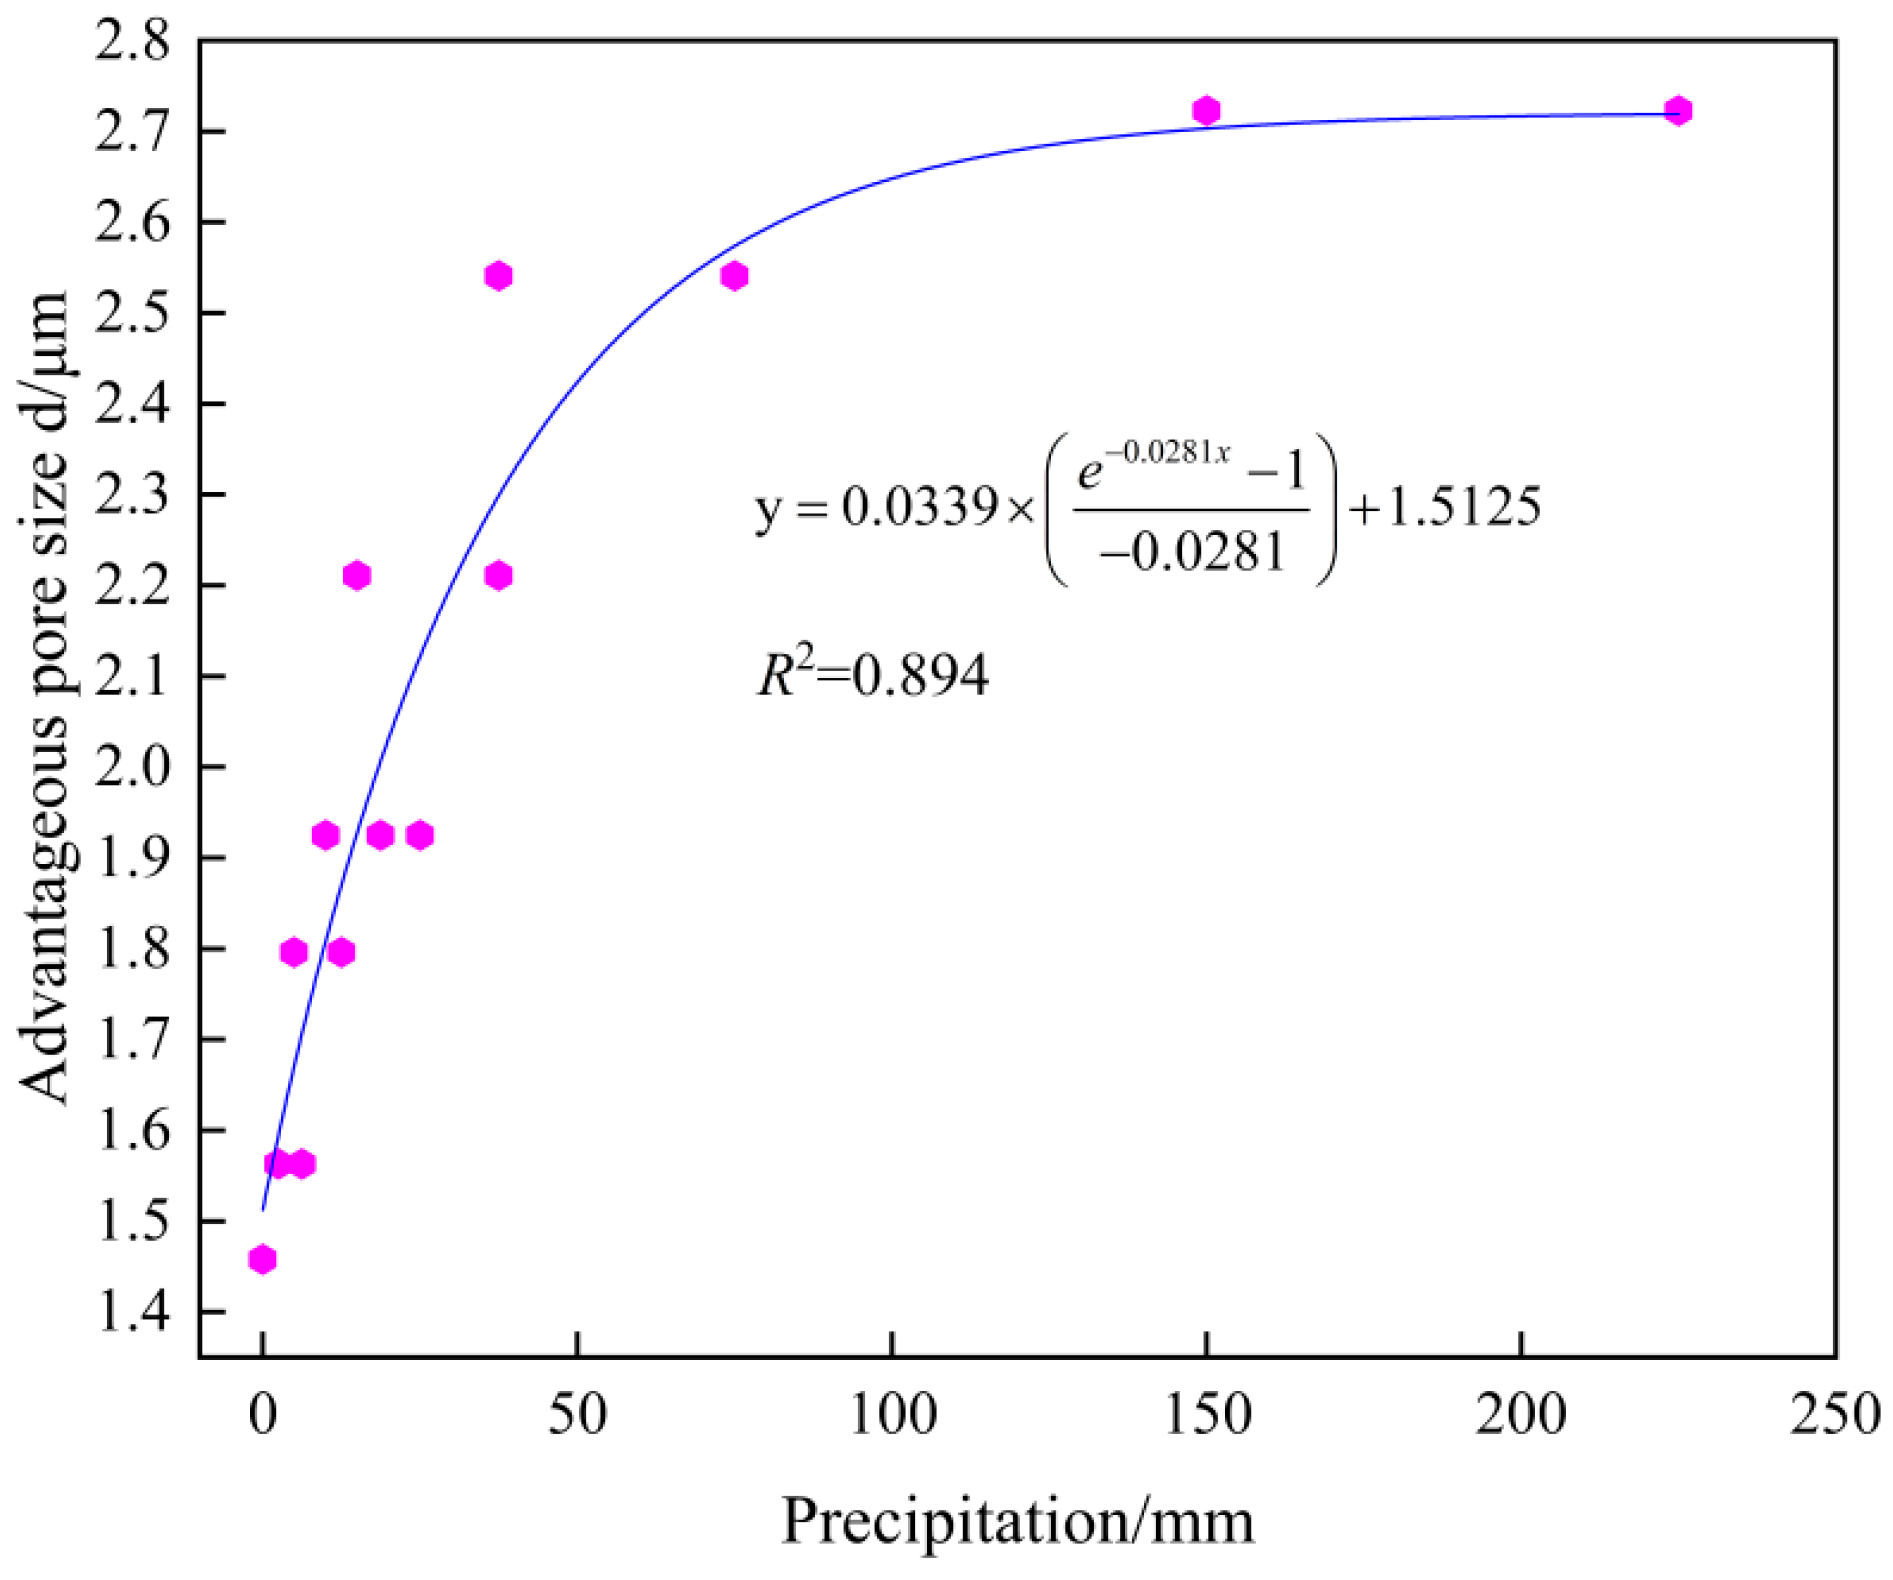
3.2.1. Rainfall-Induced Changes in Dominant Pore Size of Expansive Soils

From the results of the NMR test in the previous section and the related parameter indexes obtained through calculation, it can be seen that the change rule of the dominant pore size with the increase in rainfall duration is consistent in the test blocks of the small rainfall group and the medium rainfall group, so the test data of the two groups of test blocks are combined and analyzed to plot the relationship between the dominant pore size and the duration of wetting under the conditions of small rainfall and moderate rainfall (Figure 9). A strong linear correlation (R2 = 0.975) was observed between the two according to the fitting equation:
y = 0.2451 x + 1.472
where y is the dominant pore size, µm; x is the rainfall duration, d.
This shows that under short-term (≤3 d) low-intensity (daily rainfall ≤ 25 mm) conditions, the dominant pore size of expansive soils increases linearly with increasing wetting duration. The positive correlation implies pores gradually enlarge to form interconnected drainage paths, even under light rain intensity, given sufficient cumulative infiltration time.
Under heavy rain and rainstorm conditions, the pattern of change in the dominant pore size of the medium and small rainfall groups no longer applies, dominant pore sizes did not exhibit a continuous linear increasing trend. Instead, despite continuously extending wetting durations, the pore diameters initially increased and then stabilized at a critical value (Figure 9). The Stirling model was adopted to fit the relationships between dominant pore size and rainfall duration for these conditions:
y = a + b e k x 1 k
where a, b, and k are fitting parameters; y is the dominant pore size, μ m ;   x is the rainfall duration, d.
As shown in Table 3, the Stirling model describes the evolution and stabilization of dominant pore sizes under heavy rain and rainstorm conditions very well, with R2 > 0.97. The fitting curves and parameters indicate that higher rainfall intensities correspond to larger ultimately stabilized dominant pore sizes, which is consistent with experimental trends.
To establish an integrated model encompassing different rainfall conditions, dominant pore sizes across all tested scenarios were compared against the corresponding cumulative precipitation, and calculated as rainfall intensity × duration (Figure 10). A single variable Stirling model was used to fit the data:
y = 0.0339 × ( e 0.0281 x 1 0.0281 ) + 1.5125
where y is the advantageous pore size, μ m ; x is the rainfall duration.
This quantitatively describes the overall trend of initial dominant pore size increase and subsequent stabilization with increasing precipitation. The model enables first-order prediction of expansive soil dominant pore sizes for a given wetness load.
Additionally, a three-dimensional response surface relating dominant pore size to rainfall intensity and duration was generated using multivariate nonlinear regression (Figure 11). The fitting equations were modeled using a Logistic Cumulative (LogisticCum) [32,33] model with the following fitting equations:
z = z 0 + B 1 + e C x D · 1 + e E y F
where z is the dominant pore size, μ m ; x is the 24 h rainfall, mm; y is the rainfall duration, d; z 0 , B ,   C ,   D ,   E ,   F are fitting parameters.
Through fitting, a multivariate mathematical function was derived for dominant pore size, rainfall duration, and rainfall amount, and the calculated parameters for each fit are summarized in Table 4. The LogisticCum equation was well fitted ( R 2   = 0.874), capturing the gradual increasing and stabilizing behaviors of these two variables. The predictive model provides a continuous surface that can be used to estimate the major pore diameters of expansive soils under a range of possible rainfall conditions.

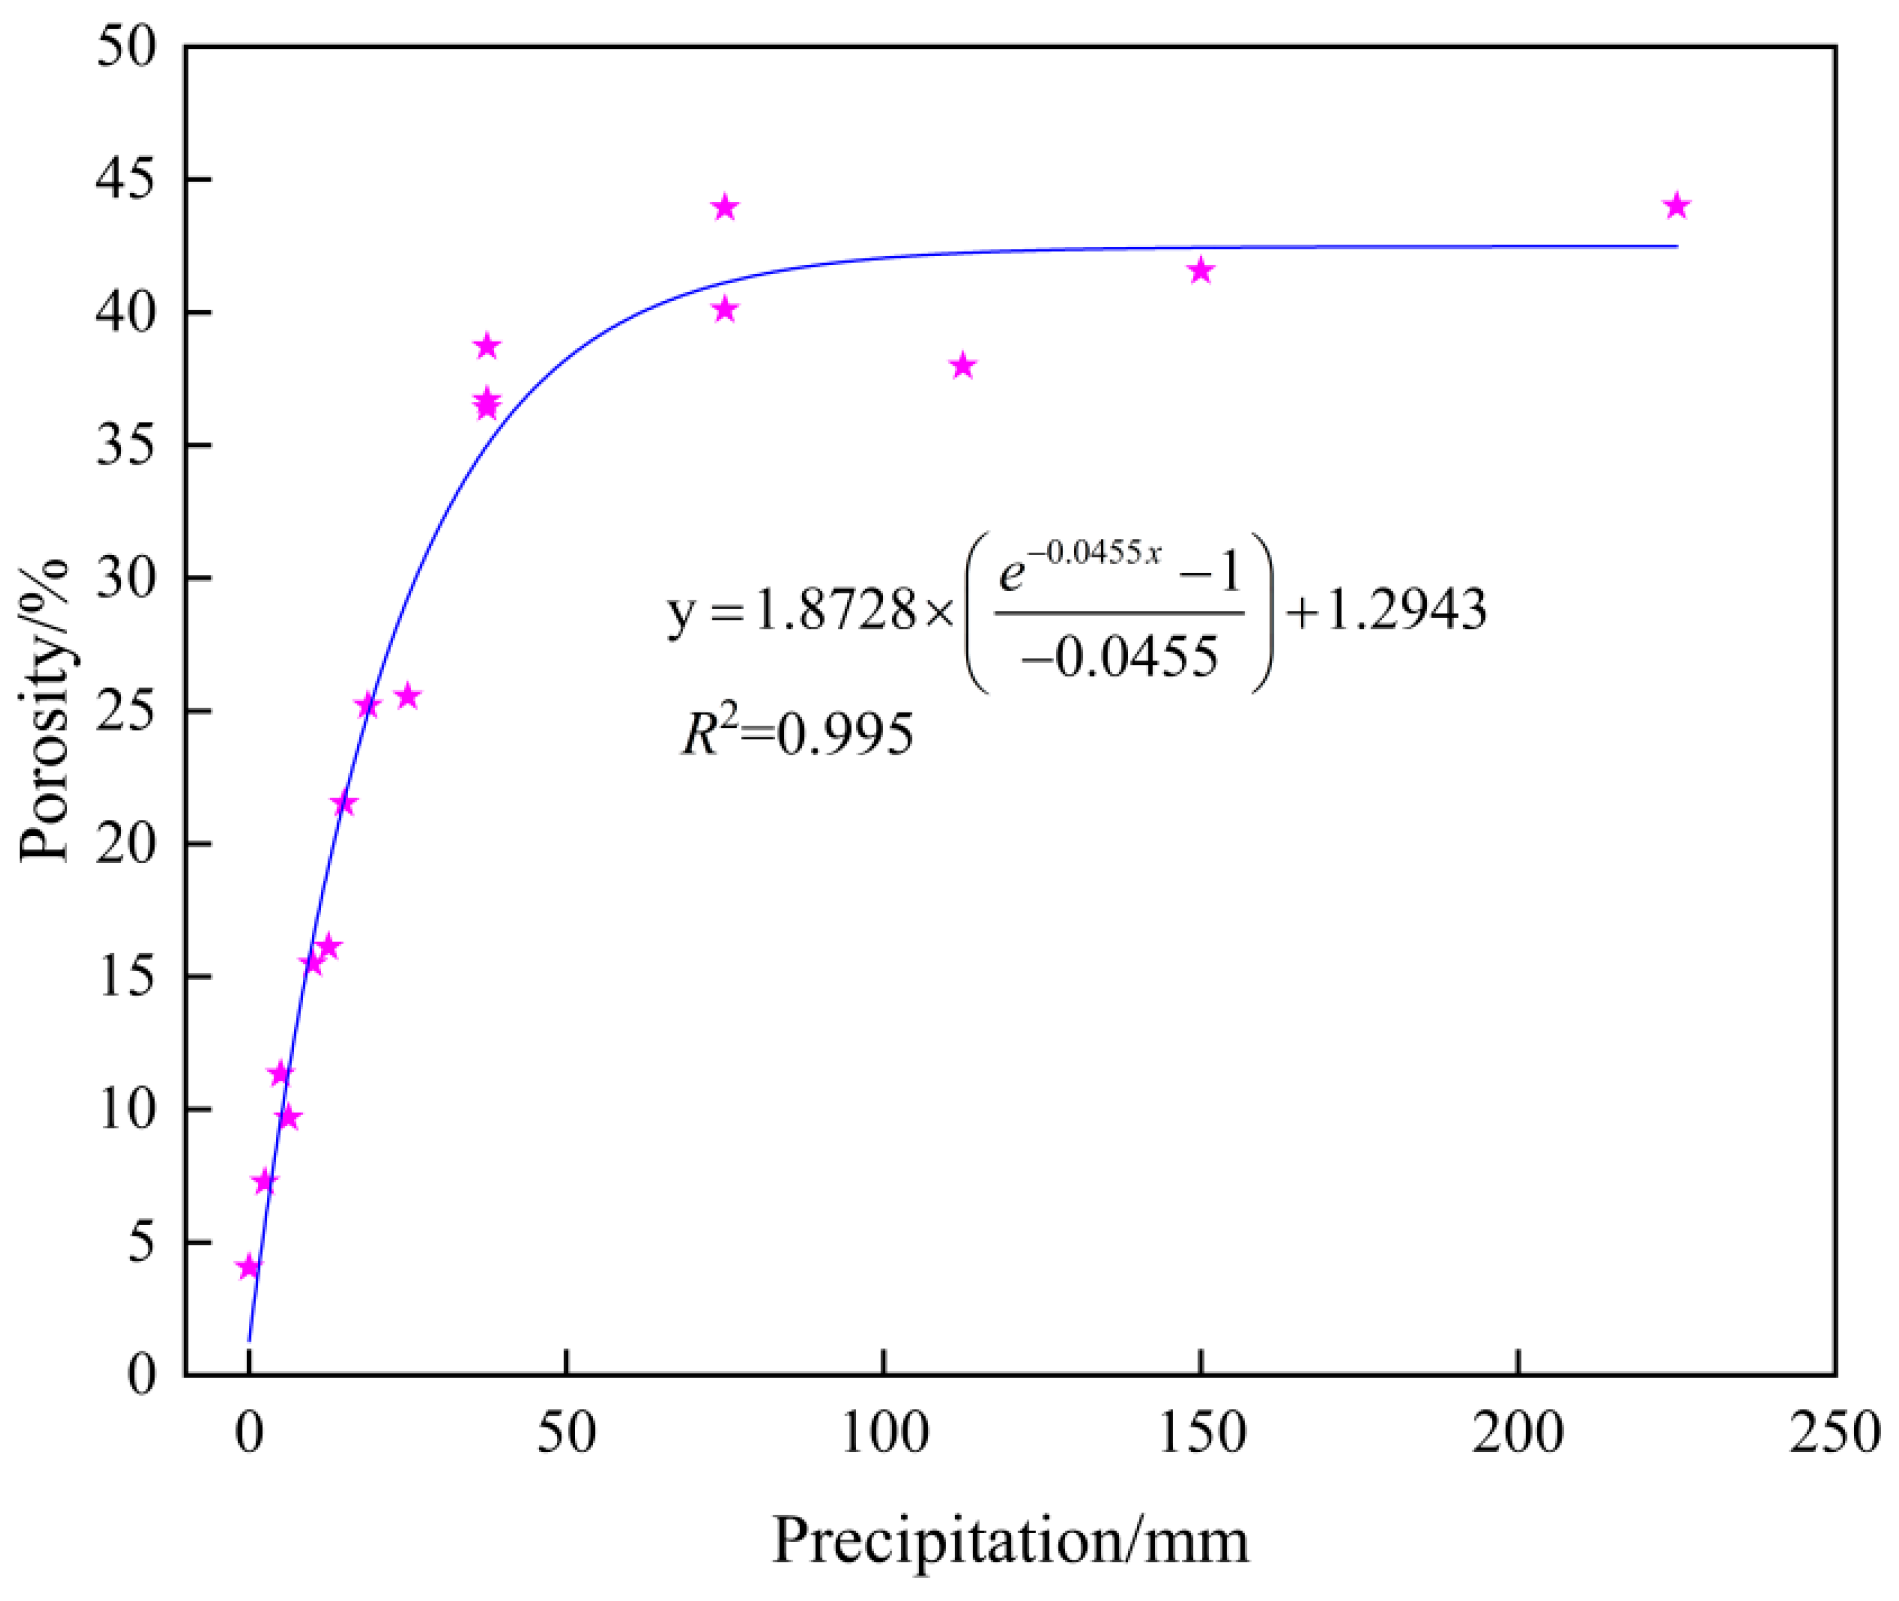
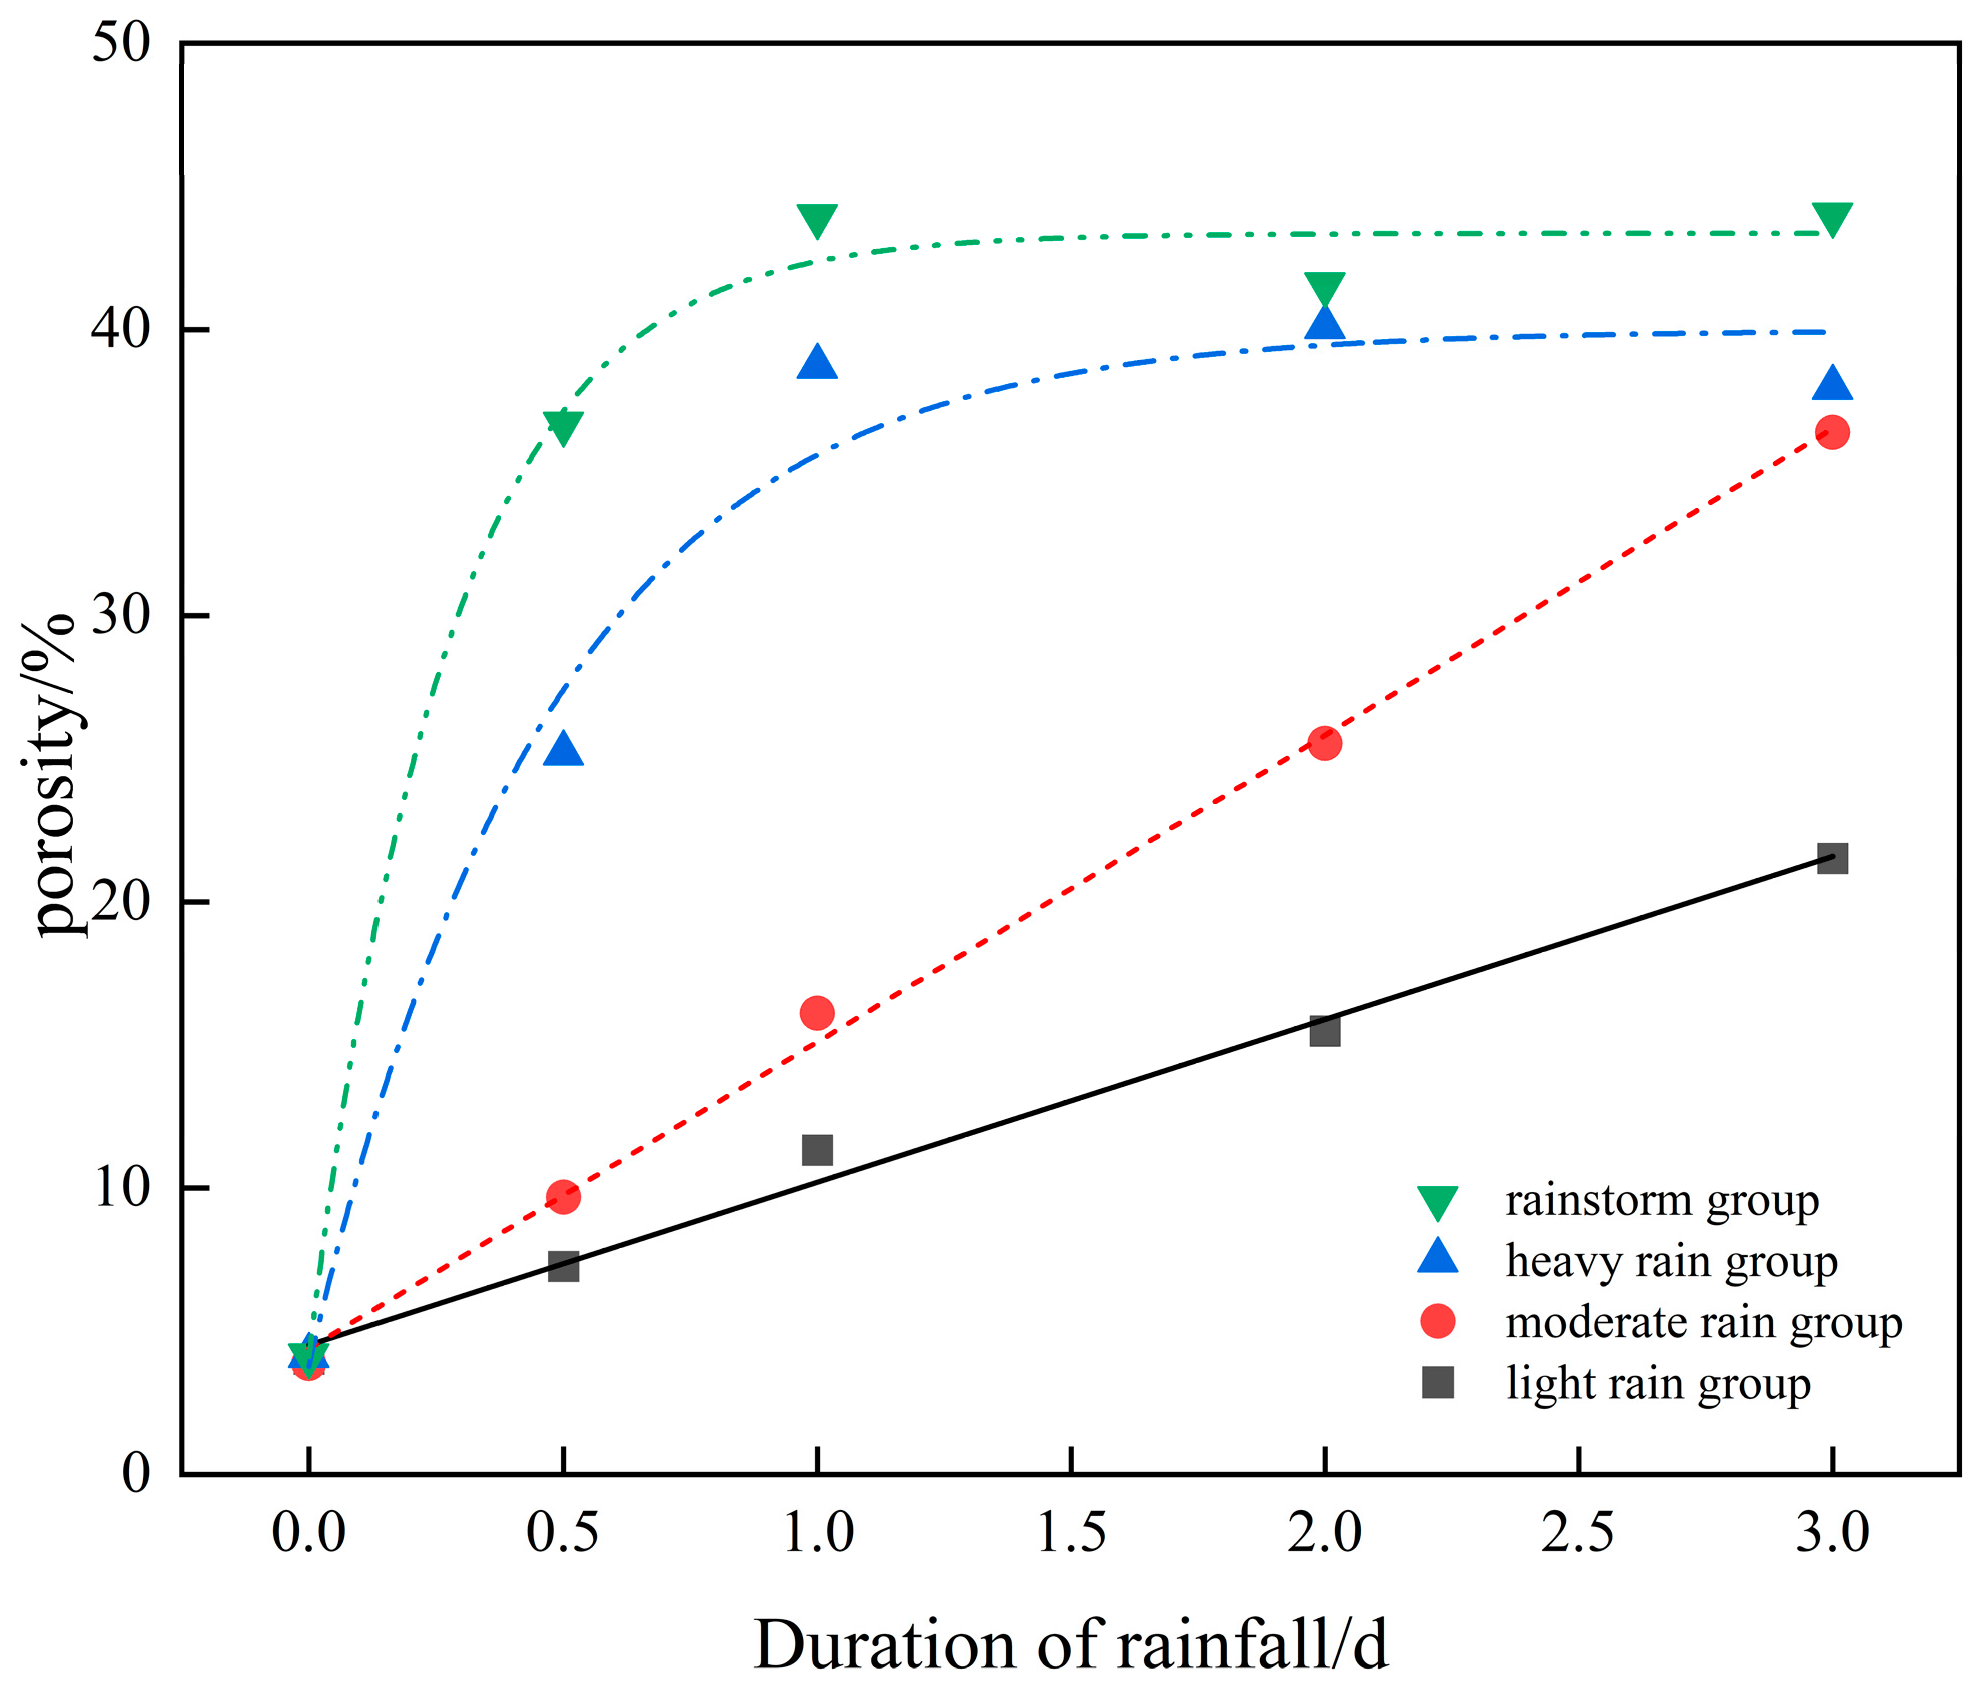
3.2.2. Variations in Porosity of Expansive Soils under Rainfall Conditions

To study the effects of rainfall duration on expansive soil porosity, relationships between porosity and wetting duration under light and moderate conditions were analyzed (Figure 12). Under both conditions, strong linear correlations (R2 > 0.99) were observed, with a higher porosity increase rate for moderate versus light rain (Table 5). This indicates that under short-term, low-intensity rainfall, expansive soil porosity increases linearly with extending wetting time. Furthermore, higher rainfall intensities correspond to greater porosity increase rates, implying that larger internal structural changes occurred.
Under heavy rain and rainstorm conditions, porosity changes deviated from continuous linear increases. Instead, porosity initially increased and then stabilized at a critical value, despite ongoing wetting (Figure 12). The Stirling model was again adopted to capture this trend:
y = b × e k x 1 k + a
where a, b, and k are fitting parameters; y is porosity, %; x is rainfall duration, d.
As shown in Table 6, the model describes the experimental porosity changes under heavy rain and rainstorm conditions very well, with R2 > 0.97. The fitting parameters indicate that higher rainfall intensities correspond to larger ultimately stabilized porosities, consistent with measurements. This implies that a balance in pore structures is reached beyond certain wetting thresholds.
Integrating the different rainfall conditions, relationships between porosity and cumulative precipitation were analyzed (Figure 13). A single variable Stirling model provided good fitting performance (R2 = 0.995):
y = 1.8728 × ( e 0.0455 x 1 0.0455 ) + 1.2943
where y is the porosity, %; x is the rainfall duration, d.
This quantitatively describes the overall trend of initial porosity increase followed by stabilization with increasing precipitation. The model enables first-order prediction of expansive soil porosity changes for a given wetness load.
Additionally, a multivariate logistic model was constructed, relating porosity as a continuous function of rainfall intensity and duration (Figure 14). The fitting equation still uses the LogisticCum model, concerning Formula (6) for the fitting formula. The three variables have a high correlation with the fitting surface equation (R2 = 0.914). The calculated fit parameters are summarized in Table 7, and this prediction surface allows the estimation of expansive soil porosity under various potential rainfall conditions.
This prediction surface captures the gradual increase and stabilization behavior of expansive soil porosity as rainfall intensity and duration increase. The quantitative relationship enables the estimation of porosity changes in expansive soils under various hypothetical rainfall scenarios. Integrating such pore-scale insights into physics-based modeling approaches could enhance predictive capabilities for expansive soil engineering behavior under changing climatic conditions involving more intense rainfall events.

4. Discussion

4.1. Analysis of Microstructural Evolution Mechanisms

The experimental results show that under rainfall infiltration, the micropores of expansive soils show an overall decreasing trend and the mesopores/macropores show an increasing trend, and that this change is not continuous, but ultimately tends toward an equilibrium state. In this process, the internal structure of the expanded soil [34,35] underwent a fundamental transformation: the original tightly connected aggregates of soil particles were gradually disintegrated and replaced by a series of interconnected liquid flow paths. When these paths finally form stable seepage channels, the expansive soil reaches a unique dynamic equilibrium under continuous rainfall. Notably, this structural evolution of the expansive soil is more pronounced under intense rainfall conditions, demonstrating its sensitive response to environmental changes.

4.2. Comparisons with Previous Expansive Soil Studies

Through the use of nuclear magnetic resonance (NMR) technology, the limitations of traditional soil analysis were broken through, providing more accurate and intuitive microstructural data. In designing the experiments, multiple rainfall scenarios were comprehensively considered, thus effectively emphasizing the dynamic effects of rainfall on the microstructure of expansive soils, and revealing in depth the processes of pore formation, development, enlargement, and interconnection, as well as the immediate effects of rainfall on the microstructure of expansive soils. In addition, the LogisticCum model introduced in this study provides an accurate fitting method for the relationship between pore size porosity and rainfall conditions. The application of this model greatly improves our accuracy in predicting the response of expansive soils and effectively bridges the gap between theoretical studies and practical applications.

4.3. Limitations and Prospects

This study explored a limited set of rainfall conditions and soil samples. Further research should examine a wider range of rainfall patterns and soil types. The NMR resolution could also be enhanced to capture smaller-scale pore features. Nevertheless, the integrated experimental methodology provides a new framework for unraveling fundamental mechanisms governing expansive soil behavior under environmental loads. Similar approaches could be applied to study other complex porous media like rocks and concrete under coupled hydro-mechanical stresses.

5. Conclusions

In this study, the pore size distribution of expansive soils in the Pingdingshan area, China, under different rainfall conditions was analyzed in depth by advanced nuclear magnetic resonance (NMR) techniques, revealing the effects of rainfall intensity and rainfall duration on the microstructure of expansive soils. The experimental design covered different rainfall intensities, ranging from light to heavy rainfall, and different durations ranging from 0.5 to 3 days, and comprehensively analyzed the dynamic process of soil micropore to macroporosity changes during rainfall.
The main findings of this study include the following:
(1)
With the increase in rainfall duration, the proportion of micropores in the soil decreased, while the proportion of meso- and macropores increased, indicating that rainfall promoted the interconnectivity of pores and enhanced the permeability and drainage capacity of the soil. Especially under heavy rainfall and storm conditions, this change is more significant and the pore structure rapidly adjusts to reach a new stable state, which provides important information for understanding and predicting the behavior of expansive soils under extreme rainfall events.
(2)
Under different rainfall conditions, the quantitative relationships between dominant pore size, porosity, and rainfall conditions follow the LogisticCum model, which exhibits a highly accurate fit, where the correlation coefficients, R2, reach 0.87 and 0.91, respectively, which suggests that the model is capable of predicting the field performance of expansive soils incorporating rainfall factors, and provides an important predictive tool for engineering design and disaster prevention.
These results emphasize the value of the application of NMR techniques for non-destructive, accurate measurement of the pore structure of expansive soils and the importance of systematic analysis of the effects of rainfall intensity and duration in improving the prediction of engineering behavior of expansive soils. This study not only provides new perspectives for understanding the behavior of expansive soils under different rainfall conditions but also provides a theoretical basis for risk-based engineering analysis and design, especially in preventing and responding to rainfall-induced destabilization of expansive soils.

Author Contributions

L.M. conceptualized this study, and designed and performed the experiments. W.J. and L.H. analyzed the images and data. L.M. and L.H. wrote the manuscript. All authors discussed the results and reviewed the manuscript. All authors have read and agreed to the published version of the manuscript.

Funding

This research received no external funding.

Data Availability Statement

Data are contained within the article.

Conflicts of Interest

The author declares no conflict of interest.

References

  1. Bao, C.-G. Behavior of unsaturated soil and stability of expansive soil slope. Chin. J. Geotech. Eng. 2004, 26, 1–15. [Google Scholar]
  2. Nelson, J.; Miller, D.J. Expansive Soils: Problems and Practice in Foundation and Pavement Engineering; Structure and function in cell signalling; John Wiley & Sons: Hoboken, NJ, USA, 1997. [Google Scholar]
  3. Puppala, A.J.; Manosuthikij, T.; Chittoori, B.C.S. Swell and shrinkage strain prediction models for expansive clays. Eng. Geol. 2014, 168, 1–8. [Google Scholar] [CrossRef]
  4. Chen, Y.; Wang, L.; Wang, L.; Yuan, D.; Liu, D.; Xia, L. Distributions and Mitigations of Expansive Soils in Wulian County, Shandong Province. Soil Eng. Found. 2016, 30, 241. [Google Scholar]
  5. Deng, J.; Li, J. Analysis and Prevention of Foundation Pit Accidents in Hefei District. Struct. Eng. 2011, 27, 105–109. [Google Scholar]
  6. Hou, T.S.; Xu, G.L.; Shen, Y.J.; Wu, Z.Z.; Zhang, N.N.; Wang, R. Formation mechanism and stability analysis of the Houba expansive soil landslide. Eng. Geol. 2013, 161, 34–43. [Google Scholar] [CrossRef]
  7. Zhang, L.Y.; Chen, T.L.; Zhang, D.L. Progressive failure of expansive soil slopes under rainfall. Yantu Gongcheng Xuebao/Chin. J. Geotech. Eng. 2019, 41, 70–77. [Google Scholar]
  8. Cheng, Y.H.; Cheng, Z.L.; Zhang, Y.B. Centrifugal model tests on expansive soil slope under rainfall. Yantu Gongcheng Xuebao/Chin. J. Geotech. Eng. 2011, 33, 409–414. [Google Scholar]
  9. IPCC; Stocker, T.F.; Qin, D.; Plattner, G.K.; Midgley, P.M. The physical science basis. Contribution of Working Group I to the Fifth Assessment Report of the Intergovernmental Panel on Climate Change. Comput. Geom. 2013, 18, 95–123. [Google Scholar]
  10. Wu, Q.H.; Zhang, J.F.; Wu, J.B.; Liu, X.Y. Physical model tests on slopes with control of infiltration by unsaturated drainage structures. Yantu Gongcheng Xuebao/Chin. J. Geotech. Eng. 2017, 39, 154–160. [Google Scholar]
  11. Genuchten, V.M.T. A closed-form equation for predicting the hydraulic conductivity of unsaturated soils. Soil Sci. Soc. Am. J. 1980, 44, 892–898. [Google Scholar] [CrossRef]
  12. Alonso, E.; Gens, A.; Josa, A. A Constitutive Model for Partially Saturated Soils; Thomas Telford Ltd.: London, UK, 1990. [Google Scholar]
  13. Basma, A.A.; Tuncer, E.R. Evaluation and Control of Collapsible Soils. J. Geotech. Eng. 1993, 3, 1491–1504. [Google Scholar] [CrossRef]
  14. Ito, M.; Azam, S. Relation between flow through and volumetric changes in natural expansive soils. Eng. Geol. 2020, 279, 105885. [Google Scholar] [CrossRef]
  15. Tan, Y.Z.; Wu, P.; Fu, W.; Wan, Z.; Zhang, Z.H. Strength and micromechanism of improved silt under freeze-thaw cycle effect. Rock Soil Mech. 2013, 34, 2827–2834. [Google Scholar]
  16. Montoya-Noguera, S.; Lopez-Caballero, F. Effect of coupling excess pore pressure and soil deformation on nonlinear SSI in liquefiable soil deposits. Bull. Earthq. Eng. 2018, 16, 681–705. [Google Scholar] [CrossRef]
  17. Rozhkov, V.A.; Skvortsova, E.B. Tectology of soil megasystems: Universal principles of organization and analysis of data. Eurasian Soil Sci. 2009, 42, 1073–1082. [Google Scholar] [CrossRef]
  18. Azizi, A.; Musso, G.; Jommi, C. Effects of repeated hydraulic loads on microstructure and hydraulic behaviour of a compacted clayey silt. Can. Geotech. J. 2019, 57, 100–114. [Google Scholar] [CrossRef]
  19. Wei, G.F.; Dong, J.G. Swelling Research of Expansive Soil Under Drying-Wetting Cycles: A NMR Method. Soils Rocks 2020, 43, 21–30. [Google Scholar] [CrossRef]
  20. Dai, Z.J.; Chen, S.X.; Luo, H.M.; Lu, D.J. Microstructure and characteristics of expansive soil and rock of middle route of South-to-North Water Diversion Project. Yantu Gongcheng Xuebao/Chin. J. Geotech. Eng. 2013, 35, 948–954. [Google Scholar]
  21. Iassonov, P.; Gebrenegus, T.; Tuller, M. Segmentation of X-ray computed tomography images of porous materials: A crucial step for characterization and quantitative analysis of pore structures. Water Resour. Res. 2009, 45, 706–715. [Google Scholar] [CrossRef]
  22. Mao, Z.Q.; He, Y.D.; Ren, X.J. An Improved Method of Using NMR T2Distribution to Evaluate Pore Size Distribution. Chin. J. Geophys. 2013, 48, 412–418. [Google Scholar] [CrossRef]
  23. Liu, K.; Ye, W.; Gao, H.; Dong, Q. Multi-scale effects of mechanical property degradation of expansive soils under drying-wetting environments. Yanshilixue Yu Gongcheng Xuebao/Chin. J. Rock Mech. Eng. 2020, 39, 2148–2159. [Google Scholar]
  24. Shi, F.; Zhang, C.; Zhang, J.; Zhang, X.; Yao, J. The changing pore size distribution of swelling and shrinking soil revealed by nuclear magnetic resonance relaxometry. J. Soils Sediments 2016, 17, 61–69. [Google Scholar] [CrossRef]
  25. GB/T 50123-2019; Standard for Geotechnical Testing Method. Ministry of Housing and Urban-Rural Development of the People’s Republic of China. State Administration of Market Supervision and Administration of the People’s Republic of China: Beijing, China, 2019; p. 717.
  26. ASTM D2487-2011; Standard Practice for Classification of Soils for Engineering Purposes (Unified Soil Classification System). ASTM International: West Conshohocken, PA, USA, 2011; p. 11P.;A4.
  27. GB/T 28592-2012; General Administration of Quality Supervision, Inspection and Quarantine of the People’s Republic of China. Standardization Administration of the People’s Republic of China: Beijing, China, 2012; p. 8.
  28. Chen, Z.H.; Sun, S.G.; Fang, X.W.; Zhou, H.Q.; Xie, Y. Recent advances of the measuring technology for unsaturated soils and special soils. Chin. J. Geotech. Eng. 2006, 28, 147–169. [Google Scholar]
  29. An, A.J.; Liao, J.Y. Modified mesostructure of Standard Gange Railway expansive soils of Mombasa- Nairobi based on nuclear magnetic resonance and scanning electron microscope. Yantu Gongcheng Xuebao/Chin. J. Geotech. Eng. 2018, 40, 152–156. [Google Scholar]
  30. Cao, Z.; Liu, G.; Zhan, H.; Li, C.; You, Y.; Yang, C.; Jiang, H. Pore structure characterization of Chang-7 tight sandstone using MICP combined with N2GA techniques and its geological control factors. Sci. Rep. 2016, 6, 36919. [Google Scholar] [CrossRef] [PubMed]
  31. Dong, J.; Lyu, H.; Xu, G.; He, C. NMR-Based Study on Soil Pore Structures Affected by Drying–Wetting Cycles. Arab. J. Sci. Eng. 2020, 45, 4161–4169. [Google Scholar] [CrossRef]
  32. Li, F. Experimental Study on the Triaxial Compressive Creep Characteristics of Guss Asphalt Concrete. Yellow River 2019, 41, 123. [Google Scholar]
  33. Guo, J.; Wang, Y.; Xie, W.; Shi, W. Study on Correlation between Loess Collapsibility and Soil Physical Property Index. Northwest Geol. 2021, 54, 212–221. [Google Scholar]
  34. Jie, X.; Jianxiong, G.; Jin, C.; Heping, Y.; Guanyi, C. Effect of acid rain on swelling property and microstructure of natural expansive soil. Arab. J. Geosci. 2021, 15, 25. [Google Scholar]
  35. Chen, Q.; Ghimire, B.; Su, L.; Liu, Y. Micro-scale investigations on the mechanical properties of expansive soil subjected to freeze-thaw cycles. Cold Reg. Sci. Technol. 2024, 219, 104128. [Google Scholar] [CrossRef]
Figure 1. Particle size distribution curve.
Water 16 00654 g001
Figure 3. Schematic diagram of test device.
Water 16 00654 g003
Figure 4. Test block kerosene saturation treatment.
Water 16 00654 g004
Figure 5. Characteristics of rainfall duration distribution in the light rainfall group. (a) T2 spectral curve. (b) Pore distribution.
Water 16 00654 g005
Figure 6. Characteristics of rainfall duration distribution in the moderate rain group. (a) T2 spectral curve. (b) Pore distribution.
Water 16 00654 g006
Figure 7. Characteristics of rainfall duration distribution in the heavy rain group. (a) T2 spectral curve. (b) Pore distribution.
Water 16 00654 g007
Figure 8. Characteristics of rainfall duration distribution in the rainstorm group. (a) T2 spectral curve. (b) Pore distribution.
Water 16 00654 g008
Figure 9. Relationship between dominant aperture and rainfall duration.
Water 16 00654 g009
Figure 10. Relationship between dominant pore diameter of expansive soil and precipitation.
Water 16 00654 g010
Figure 11. Advantageous pore size LogisticCum fitting surface.
Water 16 00654 g011
Figure 12. Relationship between porosity and rainfall duration.
Water 16 00654 g012
Figure 13. Relationship between porosity of expansive soil and precipitation.
Water 16 00654 g013
Figure 14. Porosity LogisticCum fitting surface.
Water 16 00654 g014
Table 1. Basic physical indicators of expansive soil in Pingdingshan.
Natural Moisture Content/%Dry Density/
(g/cm3)
Liquid Limit/% Plastic Limit/%Plasticity IndexMaximum Dry Density/(g/cm3)Optimal Moisture Content/%Free Expansion Rate/%
Average value14.421.7043.620.223.41.7117.4243.7
Standard deviation0.0760.0450.100.0940.110.0270.0310.049
Table 2. Rainfall intensity level classification criteria.
Rainfall Intensity Class24 h Precipitation Totals/mm12 h Precipitation Totals/mm
light rain0.1–9.9≤4.9
moderate rain10.0–24.95.0–14.9
heavy rain25.0–49.915.0–29.9
rainstorm50.0–99.930.0–69.9
Table 3. Fitting parameters of Stirling curve of dominant aperture.
GroupFitting ParameterCorrelation R2
a b k
Heavy Rain Group1.45091.6970−2.17150.984
Rainstorm Group1.80092.6999−3.03380.973
Table 4. Dominant aperture LogisticCum surface fitting parameters.
Fitting Parameter z 0 B C D E F
Value0.9244279.4790611.9602107.03460.11800.7178
Relevance0.997110.9990.9650.840
Table 5. Porosity fitting results of small and medium rain formation test blocks.
GroupFitting Linear EquationsCorrelation R2
Light Rain Groupy = 5.6879x + 4.53570.991
Moderate Rain Groupy = 10.7143x + 4.39940.998
Table 6. Fitting parameters of porosity Stirling curve.
GroupsFitting ParameterCorrelation R2
a b k
Heavy Rain Group3.774876.6230−2.11630.980
Rainstorm Group4.1143144.7679−3.68850.995
Table 7. Porosity LogisticCum surface fitting parameters.
Fitting Parameter z 0 B C D E F
Value−3.816359.194925.649228.88120.48400.3709
Relevance0.9850.9860.9570.9120.8660.733
Disclaimer/Publisher’s Note: The statements, opinions and data contained in all publications are solely those of the individual author(s) and contributor(s) and not of MDPI and/or the editor(s). MDPI and/or the editor(s) disclaim responsibility for any injury to people or property resulting from any ideas, methods, instructions or products referred to in the content.

