Article

Assessment of Effluent Wastewater Quality and the Application of an Integrated Wastewater Resource Recovery Model: The Burgersfort Wastewater Resource Recovery Case Study

Centre for Environmental Management, Faculty of Natural and Agricultural Sciences, University of the Free State, Bloemfontein 9300, South Africa
*
Author to whom correspondence should be addressed.
Water 2024, 16(4), 608; https://doi.org/10.3390/w16040608
Submission received: 22 January 2024 / Revised: 12 February 2024 / Accepted: 14 February 2024 / Published: 18 February 2024

Abstract

:
Rivers in Africa have experienced dire pollution as a result of the poor management of wastewater effluent emanating from water resource recovery facilities (WRRFs). An integrated wastewater resource recovery model was developed and applied to identify ideal wastewater resource recovery technologies that can be used to recover valuable resources from a mixture of wastewater effluents in a case study in the Burgersfort WRRF in the Limpopo province, South Africa. This novel model incorporates the process of biological nutrient removal (BNR) with an extension of conventional methods of resource recovery applicable to wastewater. The assessment of results of effluent quality from 2016 to 2022 revealed that ammonia, chemical oxygen demand, total coliform, fecal coliform, and Escherichia coli levels were critically non-compliant with the permissible effluent guidelines, indicating a stable upward trend in terms of concentrations, and scored a very bad wastewater quality index rating. All variables assessed showed a significant loading, except for orthophosphates, and significant correlations were observed among the variables. The results of the integrated wastewater resource recovery model revealed a high probability of reclaiming recoverable resources such as nutrients, sludge, bioplastics, biofuel, metals, and water from wastewater, which have economic, environmental, and social benefits, thereby improving the effluent quality of a WRRF.

1. Introduction

Water is an essential resource that sustains all life on earth. However, wastewater production has increased tremendously over the years due to the current increase in industrialization, rapid development, and population growth, which have an impact on the quality and availability of freshwater resources [1]. The pollution of freshwater resources by wastewater effluent from water resource recovery facilities (WRRFs) is a critical global issue mostly experienced in developing countries. The United Nations World Water Assessment Programme [2] indicated that 80% of wastewater is not adequately treated globally; therefore, the effluent is channeled into freshwater resources with various pollutants. Sub-Saharan Africa is currently facing a critical challenge regarding the management of wastewater because of the poor effluent quality produced by most of the WRRFs, which pollute water resources, thereby resulting in a rise in public health problems due to poor sanitation [3]. In South Africa, the water sources are mostly polluted by raw and partially treated sewage effluents that constantly enter freshwater resources. For example, the disposal of the final effluent from the Burgersfort WWRF into Spekboom River, located 10 km downstream of the WRRF, has caused the river to become nutrient sensitive, with a low self-purification ability, and eutrophic conditions [4]. Such partially treated sewage is the result of the high production of wastewater, which has caused the different WRRFs to be overwhelmed, and substantially compromised the quality of the effluent that is produced [5,6]. The 2018 master plan of the South African Department of Water and Sanitation [7] reported that 44% of WRRFs are in a poor state, with 11% being entirely dysfunctional. The 2023 Green Drop report [8] revealed that there have been no improvements to the standards of WRRF management in South Africa and that 51% of WRRFs in South Africa are in a critical state and produce non-compliant effluent. Because of WRRF failures in South Africa, the town Hammanskraal in the Gauteng province recently had an outbreak of cholera in which more than 30 people lost their lives [9]. The cholera outbreak was attributed to pollution of the river water that was abstracted for potable water treatment by inefficiently treated wastewater effluent from a WRRF in Hammanskraal [9]. The studies by Oberholster et al. [10], Phungela et al. [6], and Ratola et al. [11] have confirmed the fact that water resources in South Africa are mostly polluted by inadequately treated sewage. There arises a need to explore wastewater resource recovery technologies to improve the current wastewater treatment processes within WRRFs, thereby reducing the pollution of water resources [5,12,13]. The resource recovery practice focuses on recovering reusable resources from wastewater, such as nutrients, sludge, water, bioplastics, and gases in the form of carbon, methane, and nitrogen, which may become pollutants when not adequately removed from effluent emanating from WRRFs [5,12,13,14].
Innumerable measures have been implemented to enhance the effluent quality of WRRFs. For instance, Afzal et al. [15], Borne et al. [16], and Bu and Xu [17] used wetland vegetation, such as Typha, for the treatment of domestic effluent as a polishing phase. However, this vegetation can only eliminate limited amounts of pollutants, which can result in possible pollution to the receiving water bodies because of specific contaminants that are primarily recoverable resources. On the other hand, Oberholster et al. [18] used an algae consortium to treat wastewater effluent in order to remove nutrients, but the recovery of the nutrients from the algae was still required. Resource recovery can play an essential role in enhancing wastewater treatment, as most pollutants can be recovered before the polishing phase of wastewater treatment and disposal [5]. Furthermore, the modification of WRRFs has only focused on technologies that attempt to improve the wastewater effluent quality but do not recover resources, which could be beneficial to humans [1,13,19,20]. Solon et al. [13] expressed that simple and practical wastewater treatment models, which incorporate the biological nutrient removal (BNR) process and resource recovery processes, need to be developed and sustainably applied and implemented to encourage the transition of wastewater treatment facilities to wastewater resource recovery facilities.
Currently, there is a scarcity of information regarding the integration of wastewater resource recovery technologies into daily wastewater treatment processes, particularly the BNR process. Additionally, the relevance of wastewater resource recovery practices in the reduction of the pollution of water resources has not been exploited and there is a need for the sustainable introduction of novel resource recovery technologies into daily water resource recovery processes. The aim of this study was therefore to develop an integrated wastewater resource recovery (IWWRR) model, which incorporates the BNR process and resource recovery processes used to identify valuable resource recovery technologies to recover valuable recoverable resources from wastewater within the Burgersfort WRRF case study. A baseline was formed to manage wastewater by improving wastewater treatment, and by sustainably reducing the pollution of water resources using a holistic approach to wastewater management. The study also assessed the water quality compliance of Burgersfort’s final effluent from 2016 to 2022 against wastewater effluent guidelines; further, the water quality trend over the proposed period was assessed. The overall effluent quality of the Burgersfort WRRF was also computed using a wastewater quality index. Additionally, the primary data that represented the typical water quality of the Burgersfort effluent was computed from a large data set over the period between 2016 and 2022, as well as the relationship between water quality variables, the causative sources of water quality variation, and event drivers of the variation in the effluent water quality. The model developed in this study can contribute to the enhancement of effluent quality from WRRFs worldwide and can further be used as a tool for water resource pollution control, water, and food security, as well as increase nutrient and water recycling for agricultural purposes.

2. Materials and Methods

2.1. Study Area

The Burgersfort WRRF is situated in the Sekhukhune District Municipality in the Limpopo province of South Africa at latitude −24.6638173° S, longitude 30.3378395° E (Figure 1). Burgersfort was built in 2003 and is designed to treat 1.5 million liters of wastewater daily. The wastewater originates from storm water, as well as agricultural, domestic, and industrial sewage water, and the final effluent is then discharged into the Spekboom River. Raw sewage from such sources is characterized by high chemical oxygen demand, nutrients, heavy metals, and salt content. The surrounding area constitutes a diverse range of land uses, such as residential and commercial areas, subsistence farming, and mining activity. The treatment technology in Burgersfort involves the primary, secondary, and tertiary treatment processes. For the primary treatment, a screen is used to remove large floating objects, such as rags and sticks that might clog pipes or damage equipment, as well as a grit channel that removes solid debris from wastewater to prepare the water for further treatment in the subsequent treatment processes. The secondary treatment utilizes the Phoredox configuration for activated sludge, which is a three-stage BNR process that exists within the biological reactor comprising the anaerobic zone for breaking down organic matter, the anoxic zone for nitrogen removal, and the aeration zone for microbial growth promotion, which stabilizes the wastewater. The bioreactor is used to biologically remove nutrients and dissolved organic and inorganic substances such as ammonia and chemical oxygen demand. This process is then followed by sludge removal in the clarifier. For tertiary treatment, Burgersfort utilizes chlorine gas for disinfection and sometimes calcium hypochlorite tablets. The continually changing land-use activities in the vicinity of Burgersfort have threatened the integrity of the treatment process and possibly reduced the efficacy of the treatment works, thereby polluting the receiving water body and the environment.
The weather in the vicinity of Burgersfort is characterized by warm, wet, and mostly partly cloudy summers, with winters that are cold, short, and dry. The temperature varies from 48 °F to 83 °F, and is rarely below 43 °F or above 91 °F.

2.2. Sample Site and Collection

For this retrospective study, historical data from January 2016 to October 2022, generated by Burgersfort, were used for this study. The wastewater samples were collected at the effluent discharge point within Burgersfort, latitude −24.67214° S, longitude 30.33848° E, using the grab sampling method. This site was chosen as the sampling point to accurately reflect the effluent quality produced by the facility after the wastewater has undergone the treatment processes and is ready for disposal. Wastewater samples were collected fortnightly at the discharge point of the treatment facility for the measurement of chemical variables, including orthophosphates (−PO4−3), sulphates (SO42−), nitrates (NO3), ammonia (NH3), chloride (Cl), chemical oxygen demand (COD), and the microbiological variables, including total coliforms (TC), fecal coliforms (FC), and Escherichia coli (E. coli). However, the physical water quality variables such as temperature, electrical conductivity (EC), pH, and one chemical variable, free chlorine, were measured on-site at Burgersfort. The wastewater effluent samples were collected at least 50 cm below the wastewater effluent interface in sterile 250 mL glass bottles that were marked for both physicochemical and microbiological testing. The wastewater samples were then transported on ice in a cooler box to the accredited Lepelle Northern Water laboratory, where the variables were analyzed. For quality control purposes, the sampling bottles were washed with soap and autoclaved after each single use.

2.3. Measurements

2.3.1. Measurement of Physical, Chemical, and Microbiological Variables

The physical variables, including pH, EC, and temperature were measured in situ, using a HACH multimeter reader and probes (HQ40d). Specific probes connected to the HACH instrument for the different measurements were plunged into the wastewater samples and allowed to stand for three minutes while the measurements were performed. On the other hand, free chlorine was measured in situ using the HACH pocket colorimeter, following prescriptions from the instrument user manual.
The concentrations of −PO4−3, SO42−, NO3−, NH3, Cl, and COD were determined in the wastewater effluent because of their association with various land-use activities in the area. The chemical variables such as −PO4−3, SO42−, NO3−, and NH3 were measured at the Lepelle Northern Water laboratory using the HACH DR2000 spectrophotometer, following the specifications in the instrument user manual. COD was measured using the closed reflux, colorimetric method with the use of HACH DR2000 dichromate high range tubes [21], while Cl was measured using Mohr’s method. The following equation was used to determine the Cl ion concentration [22]:
C h l o r i d e s i n   m g / L = V 1 V 2 × 500   m L V
On the other hand, the IDEXX Colilert-18® and Quanti-Tray 2000 methods were used to simultaneously detect E. coli, TC, and FC in the wastewater samples [23].

2.3.2. Quality Assurance and Quality Control

The analysis of the samples was performed at the Lepelle Northern Water laboratory, which is accredited by the South African National Accreditation System for laboratories. Certified reference materials, including the certified standards of the National Institute of Standards and Technology were used for quality control procedures. The quality control procedures were performed daily to validate the performance of the tests, and all the equipment used for the analysis were calibrated and verified daily per the manufacturer’s guidelines. Additionally, the wastewater samples were also analyzed in duplicate, and a blank was run before the analysis of the samples. The data were double recorded manually on worksheets and electronically into the database, and the technical signatories of the South African National Accreditation System further checked the data after being recorded into the database.
For compliance purposes, the means of the water quality data were assessed against international and local wastewater effluent guidelines for the disposal of wastewater effluent into the environment and water resources. The guidelines were adapted from the study of Owusu-Ansah et al. [24], a report by the Department of Water Affairs [25], and the set operational wastewater effluent quality standards by Lepelle Northern Water.

2.4. Data Analysis

2.4.1. Statistical Analysis

The data for this study were analyzed using IBM SPSS Statistics, version 25.0. The descriptive analysis was performed to summarize the physical, chemical, and microbiological characteristics of the effluent. The Mann–Kendall sequential trend analysis was performed to investigate how significantly the variables changed over time, as well as to obtain an overall perception of the water quality data trend. The Mann–Kendall sequential trend analysis was computed particularly for NH3, COD, TC, FC, and E. coli, which were critically non-compliant with the permissible effluent guidelines, to track the concentration changes of the variables during the study period. A principal component analysis (PCA) was computed to identify the loadings of negative, positive, or complex variables in order to determine how each variable is related to a component factor. This was performed to extract the primary data that represented the typical water quality of the Burgersfort effluent from large data and to present these data as a new set of independent variables for the principal component analysis. A variable was considered significant when the component loading factor was >0.3 on one component factor, while a loading factor of <−0.5 was considered a negative variable, and a variable was complex when the component loading factor was >0.3 on two or more component factors. On the other hand, Spearman’s rank-order correlation coefficient (rho) nonparametric matrices were performed to determine the relation and dependence of variables on one another and to define the causative sources and event drivers of the changes in the effluent quality. Variables with a correlation coefficient (CC) of >0.2 were considered to have a positive correlation, while a CC of <−0.2 was considered a negative correlation; a p value of <0.05 was used for significance.

2.4.2. Assessment of Overall Wastewater Quality Using the Weighted Arithmetic Water Quality Index

The Weighted Arithmetic Water Quality Index, adapted from Ayoub and El-Morsy [26], was used in this study to calculate the overall wastewater quality index (WWQI). We chose this index because it was easy to compute, and it incorporated all the water quality variables used in this study, and because it gave a single value that specifically described the state of each variable. This index was then calculated by using the following steps:
Step 1. Constituents of the WWQI equation were determined, where qn represents the rating of the calculated water quality variable of interest, and Wn represents the unit weight of the calculated water quality variable of interest.
W W Q I = q n   W n W n
Step 2. Constituents of the quality rating (qn) were then calculated by using the following equation:
q n = ( V n V i d S n V i d ) × 100
For this equation, Vn = the average value of the calculated water quality variable. Vid = the ideal value for the calculated variable. For example, the required COD effluent value was 35 mg/L for Burgersfort; therefore, for COD, Vid = 35. Sn = the standard acceptable value for the tested water quality variable according to the National Wastewater Effluent Guidelines. For COD, the guideline is 75 mg/L; therefore, for COD, Sn = 75.
Step 3. Constituents of the unit weight (Wn) were computed by using the following equation:
W n = K S n
For this equation, Sn = the standard acceptable value for the tested water quality variable according to the National Wastewater Effluent Guidelines. K = the proportionality of the constant, and was calculated by using the following equation:
K = 1 1 S n
Finally, the WWQI was calculated, as well as the level of the WWQI, and the matching wastewater quality ratings that were used are displayed in Table 1.

2.4.3. Application of the Integrated Wastewater Resource Recovery Model for the Burgersfort Wastewater Treatment Facility Effluent

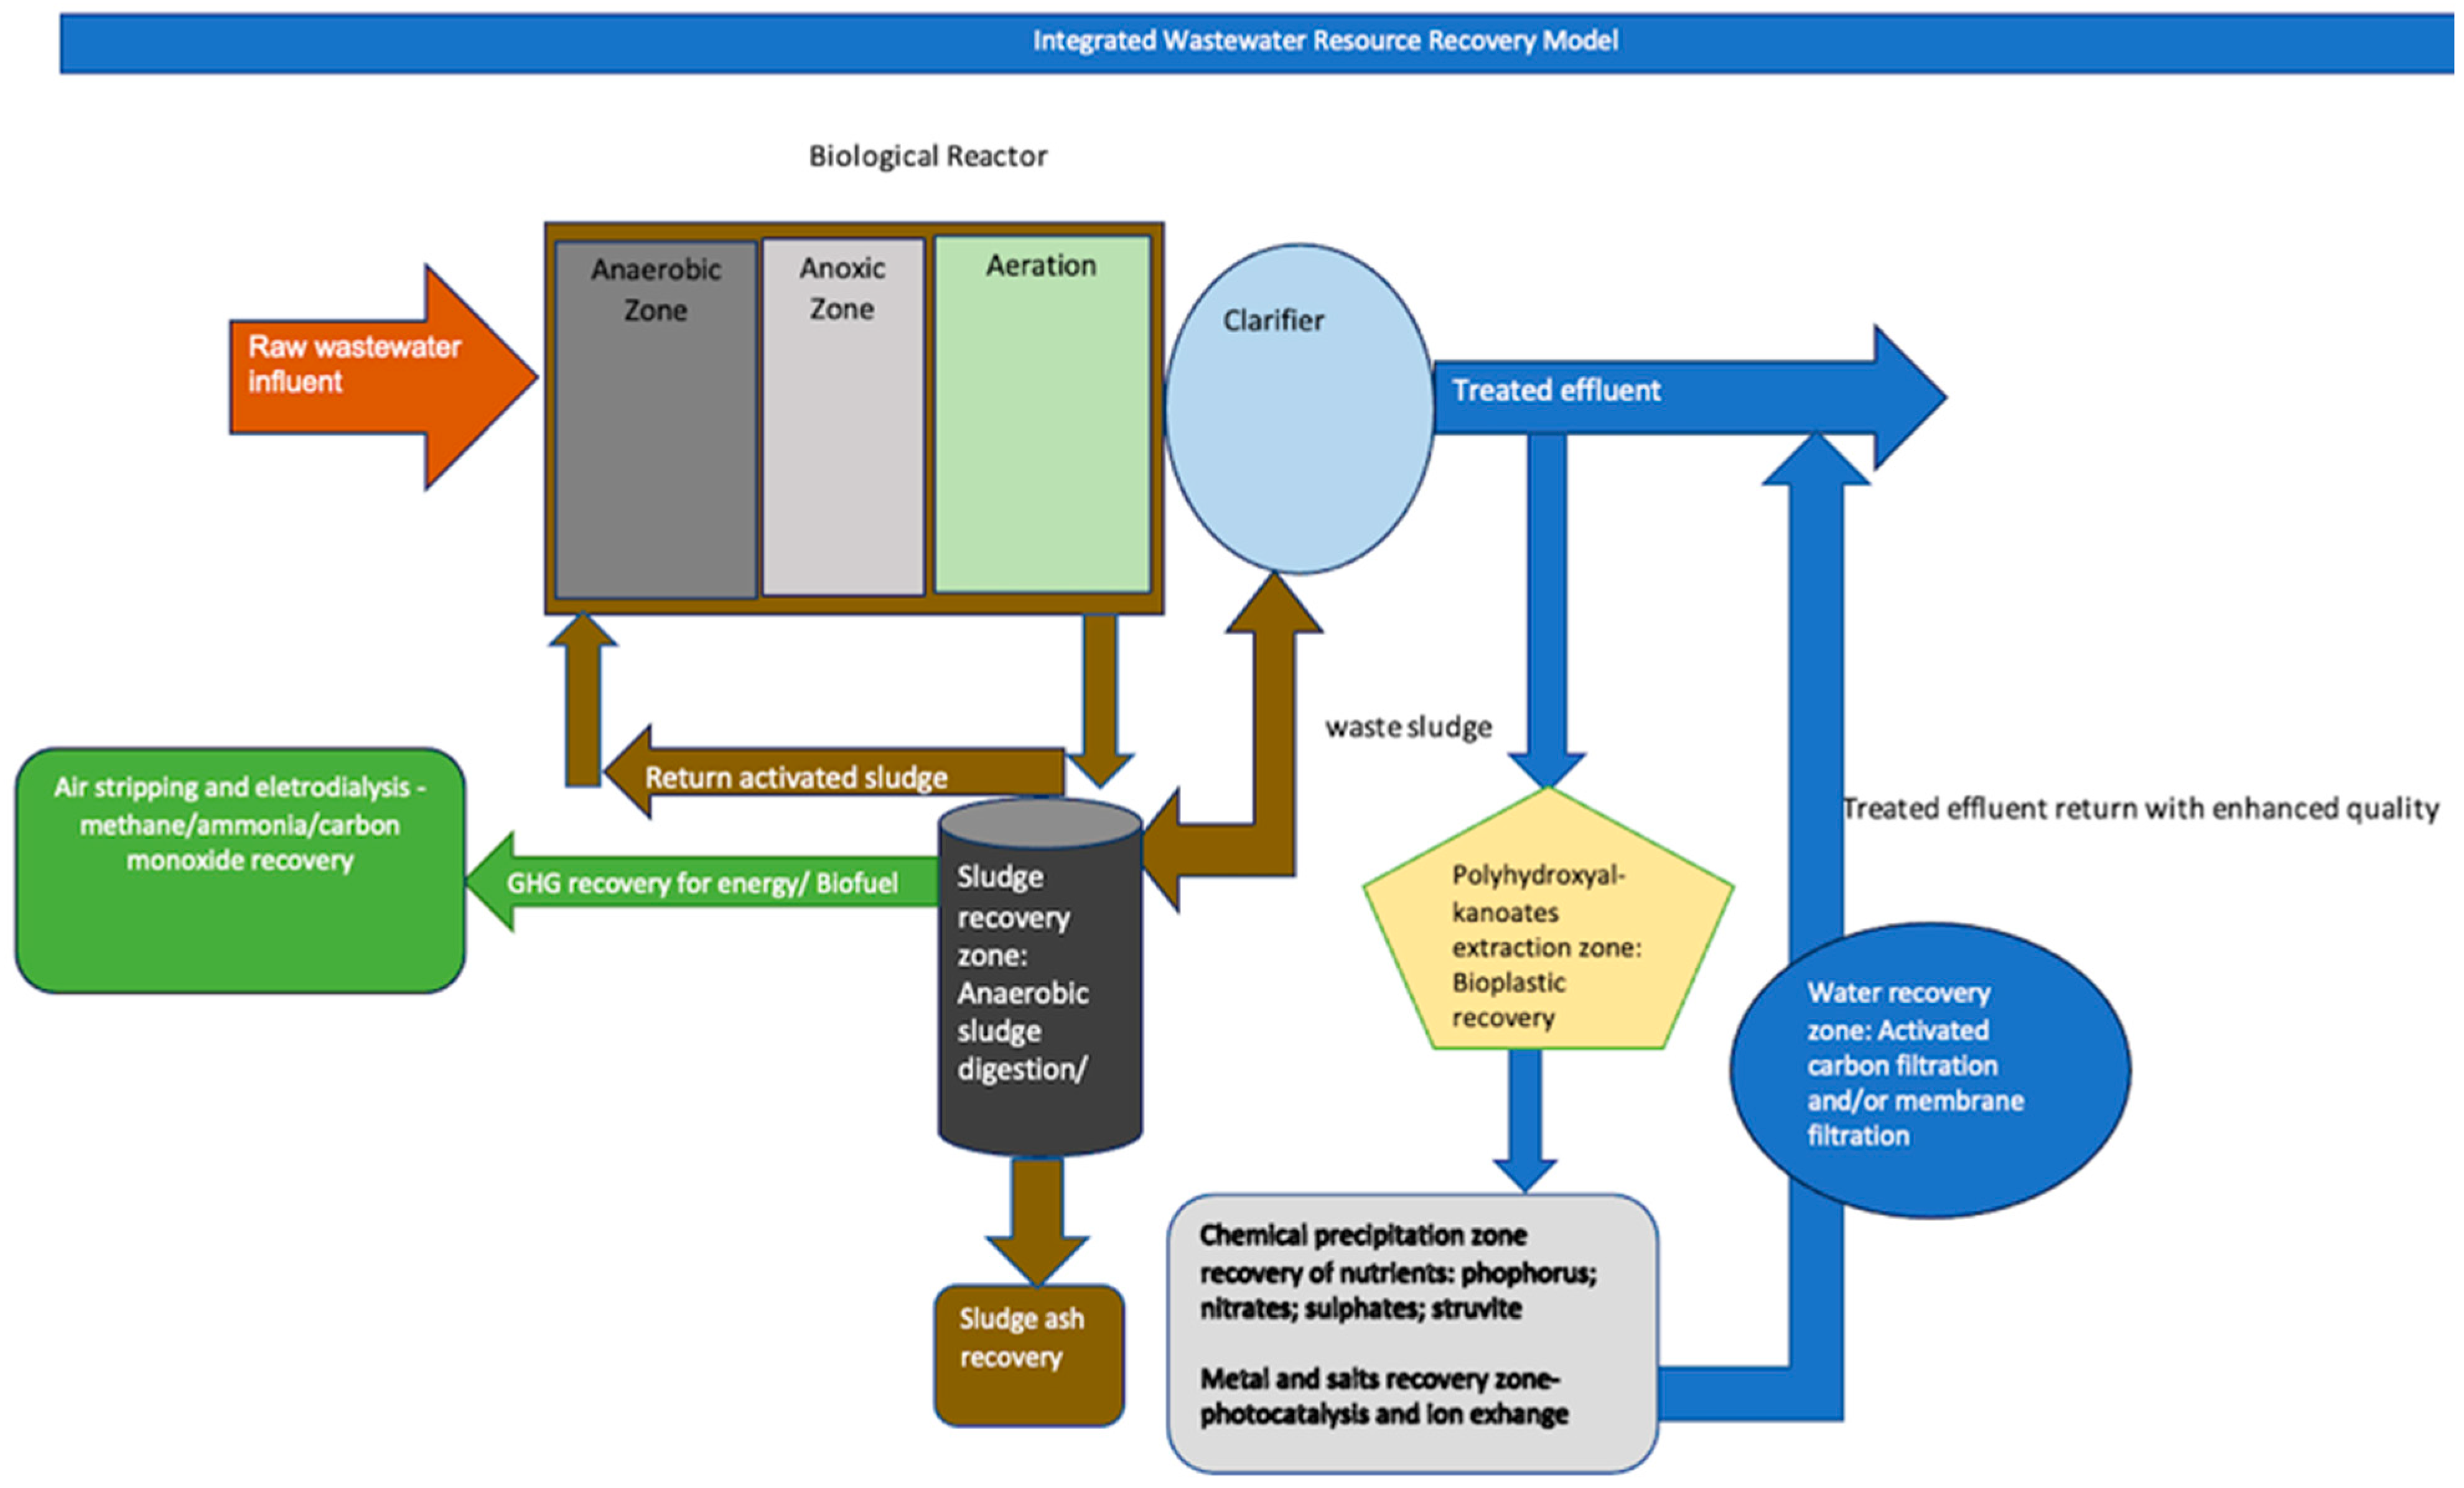
The IWWRR model was used to determine the relevant wastewater resource recovery technologies and the recoverable resources for the Burgersfort effluent. The model was developed and applied, based on previous studies by Azmi et al. [27], Mohan et al. [12], Montwedi et al. [5], Solon et al. [13], and Wu and Vaneeckhaute [28], which focused on wastewater resource recovery. This model incorporates the BNR process with an extension of conventional methods of resource recovery applicable to wastewater. The selection criteria for resource recovery technologies and recoverable resources were based on the variables that had significant loadings from the PCA results, which define the major factor that represents the water quality of the effluent, and the WWQI rating results, which define the overall effluent quality.
Figure 2 shows the integrated wastewater resource recovery model for wastewater treatment.

3. Results and Discussion

3.1. Results of the Physicochemical and Microbiological Variables

In this study, the means of the physical, chemical, and microbiological variables from 2016 to 2022 were determined and then assessed against the international guidelines set by the Environmental Protection Agency [29], the local guidelines set by the Department of Water Affairs, South Africa [30], and Burgersfort WRRF (Table 2). The results showed that EC, pH, temperature, free chlorine, NO3, and −PO4−3 were found to have met all the requirements of the wastewater effluent guidelines. Although the temperature met the guideline limits and had a mean of 21.5 °C, Alisawi [31] conducted a study on a WRRF facility in the North-West province in South Africa, and reported that the ideal temperature for microbes in the BNR treatment process to remove pollutants at the optimum rate was 37.5 °C. Moreover, 30 °C was identified as the mean temperature for optimum microbial performance [32]. These findings contradicted the mean temperature in this study; thus, it can be deduced that the temperature of Burgersfort compromised the treatment process.
In contrast, NH3 and COD levels were found to be non-compliant with any of the guidelines. Such outcomes depicted that the wastewater treatment process failed to reduce such variables. Ritter [33] and Sucu et al. [20] reported that the failure of the bioreactor in wastewater treatments leads to the retention of COD and NH3. However, the descriptive analysis results showed that a high standard deviation was recorded for EC, NH3, COD, SO42−, and Cl variables, ranging from 12.86 to 167.67 with high kurtosis and skewness. On the other hand, a low standard deviation was recorded for pH, temperature, free chlorine, and NO3, ranging from 0.26 to 4.27 with low kurtosis and skewness. These observations suggested that the EC, NH3, COD, SO42−, and CI values varied greatly, which further implied possible sources of wastewater influent that substantially increased the concentrations of such variables [33]. The pH, temperature, free chlorine, and NO3 indicated consistency in terms of concentrations and reflected limited variations.
The means of all the microbiological variables were non-compliant when compared to the limit guidelines. TC, FC, and E. coli resulted in critically high standard deviations, kurtosis, and skewness. These results indicated critically high concentrations of these microorganisms in the Burgersfort effluent and the failure of disinfection. Similarly, studies by Edokpayi et al. [34] and Gupta et al. [35] found that pathogenic microorganisms and fecal matter were present in wastewater because of poor organic content removal and inefficient disinfection.

3.2. Mann–Kendall Sequential Trend Analysis Results

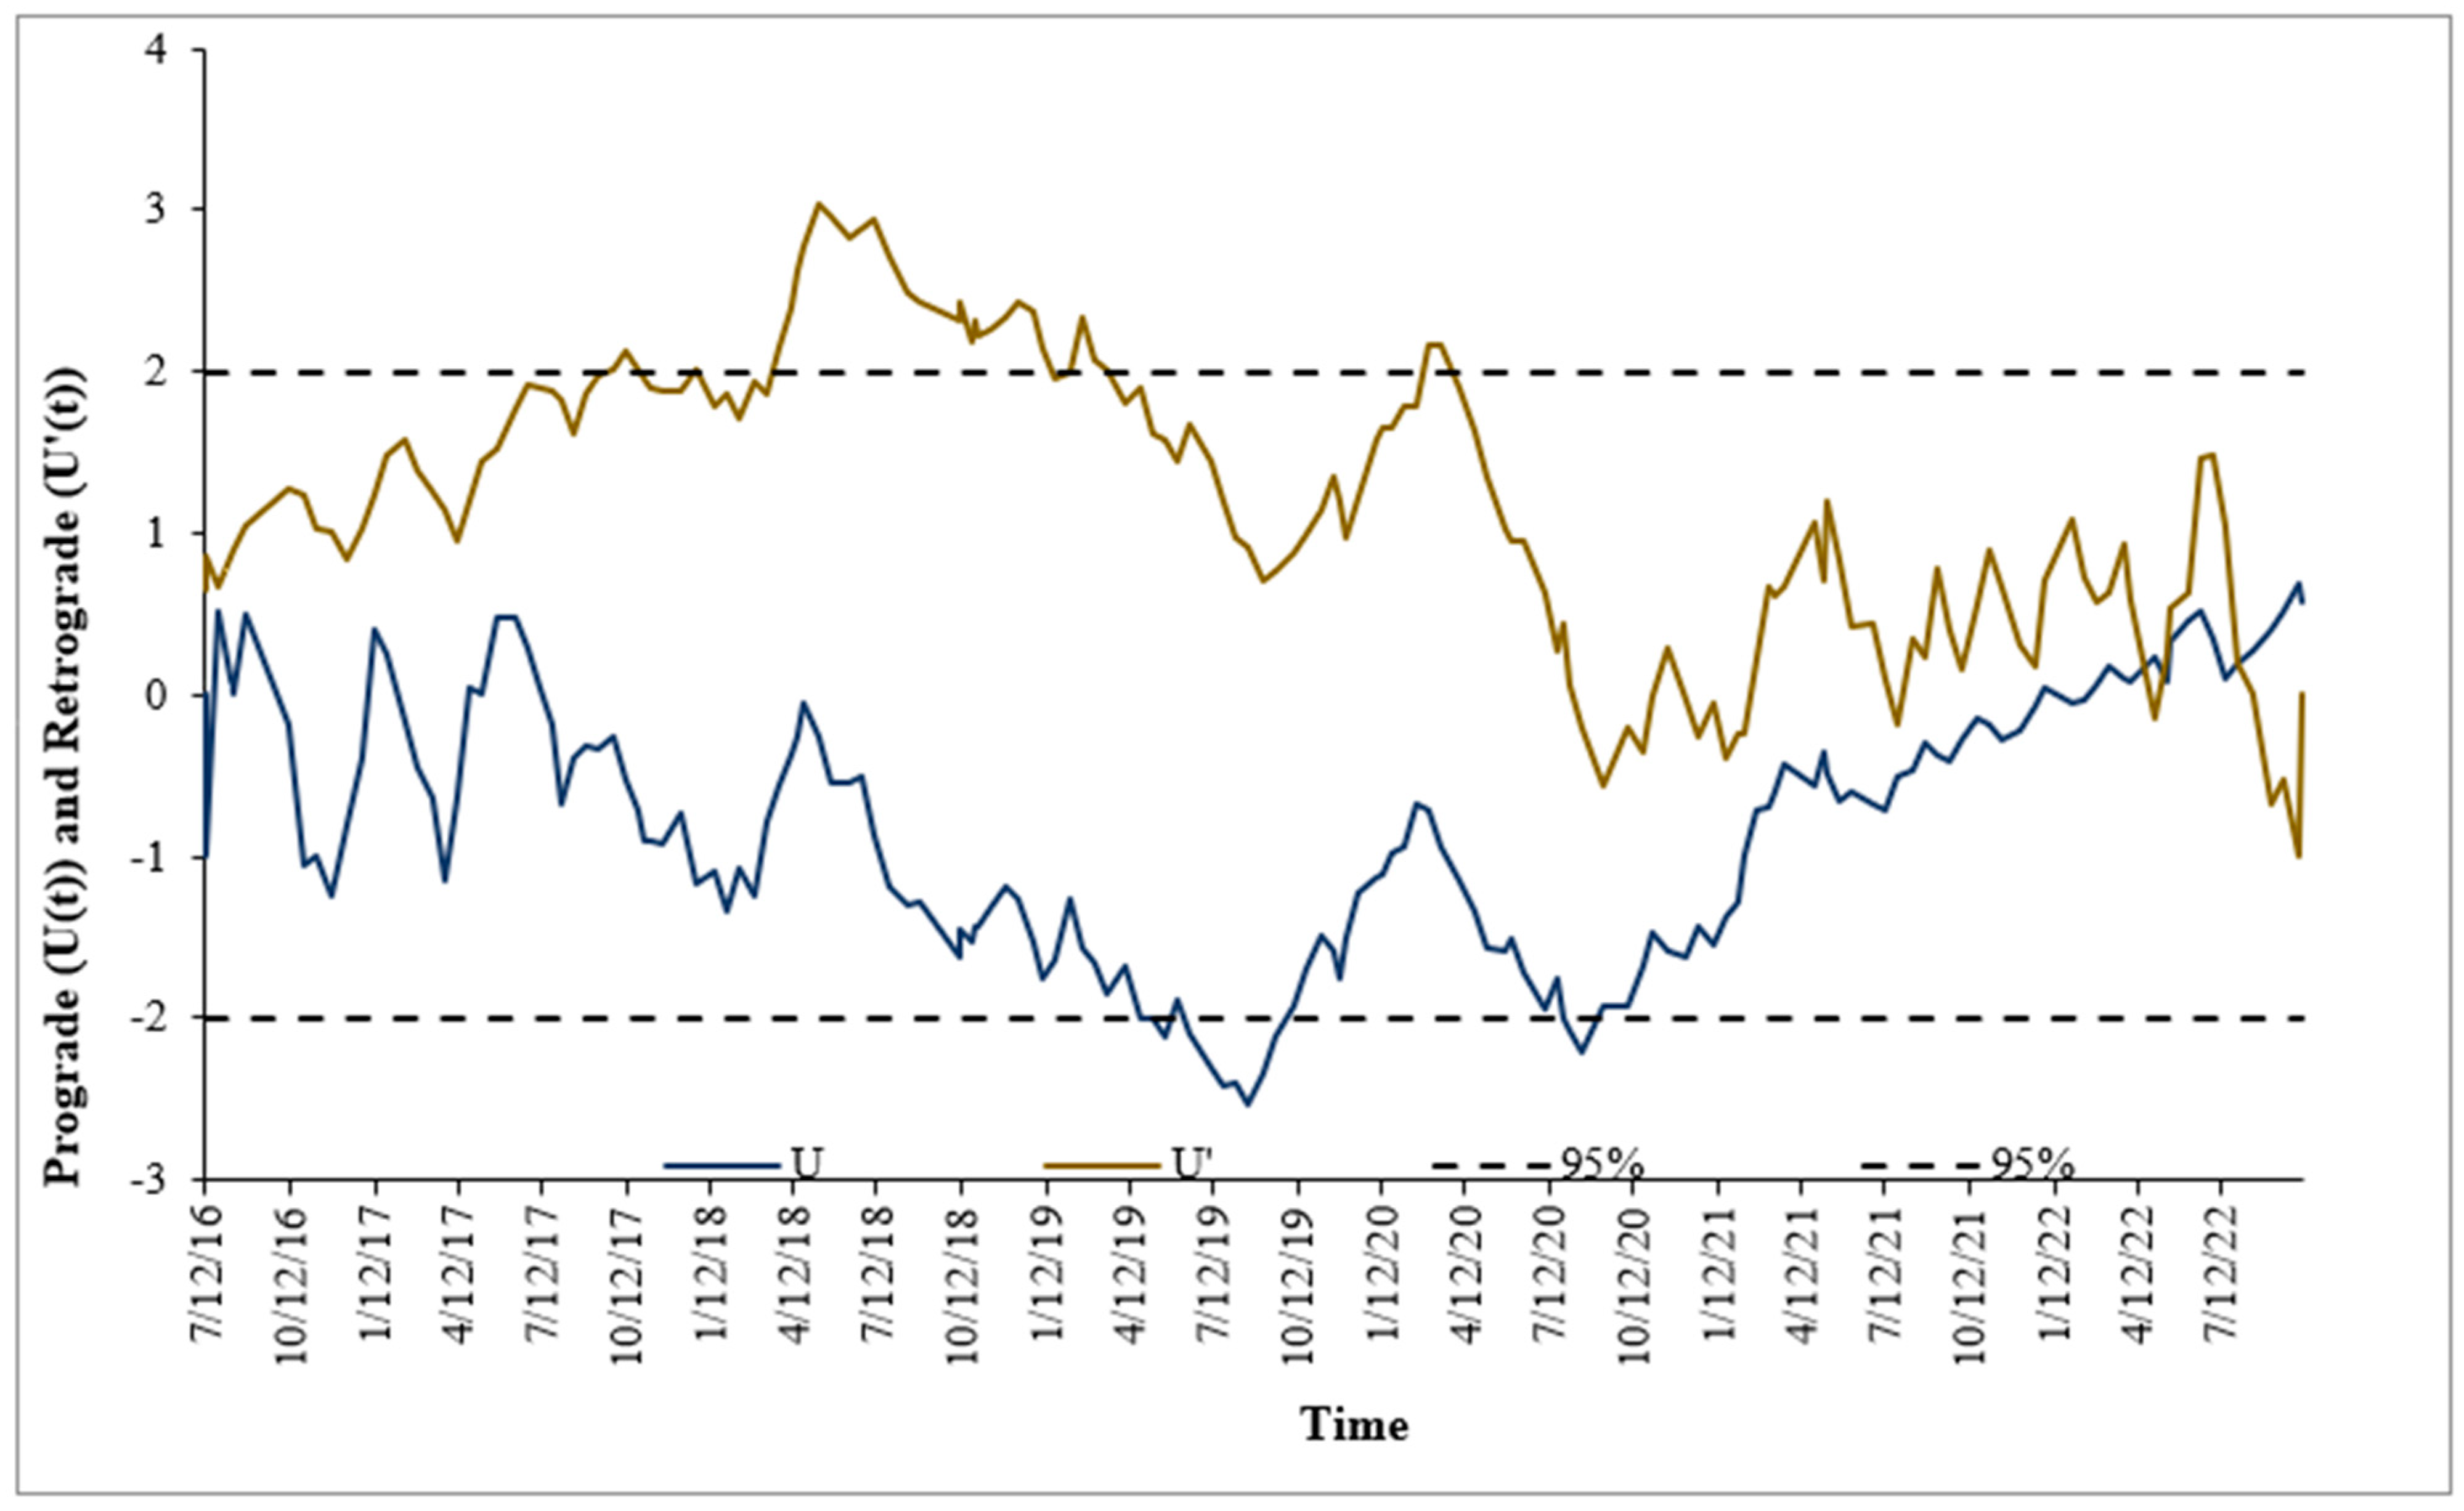
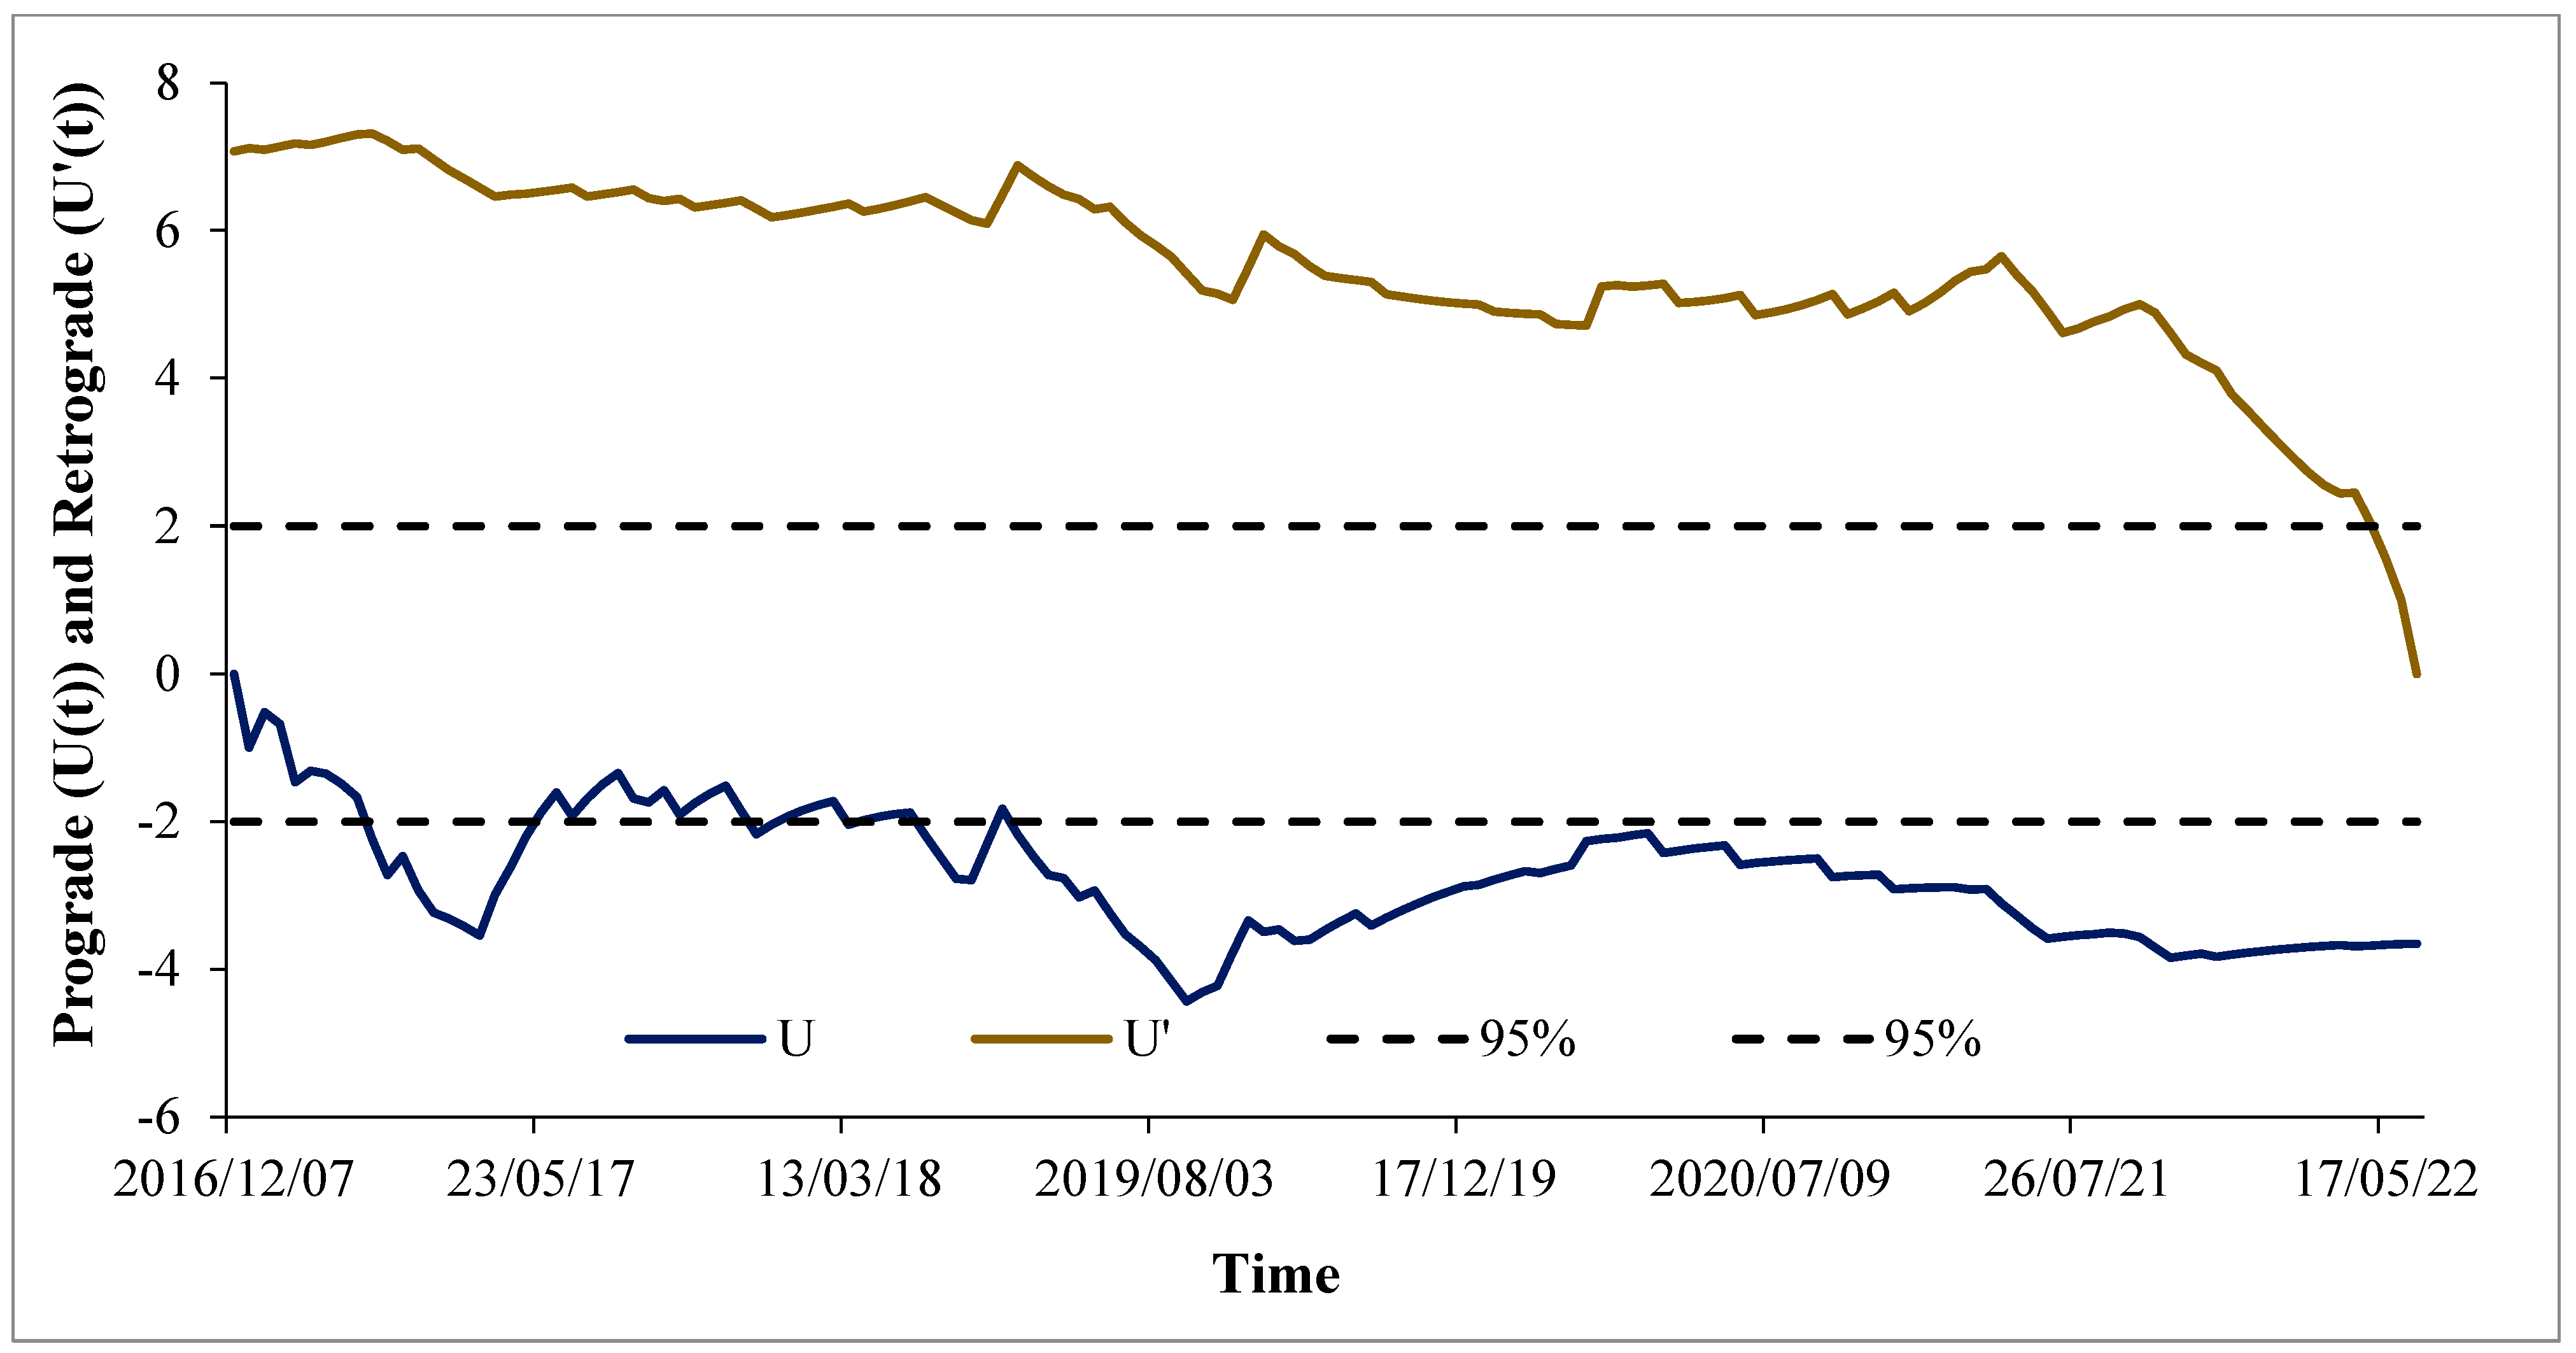
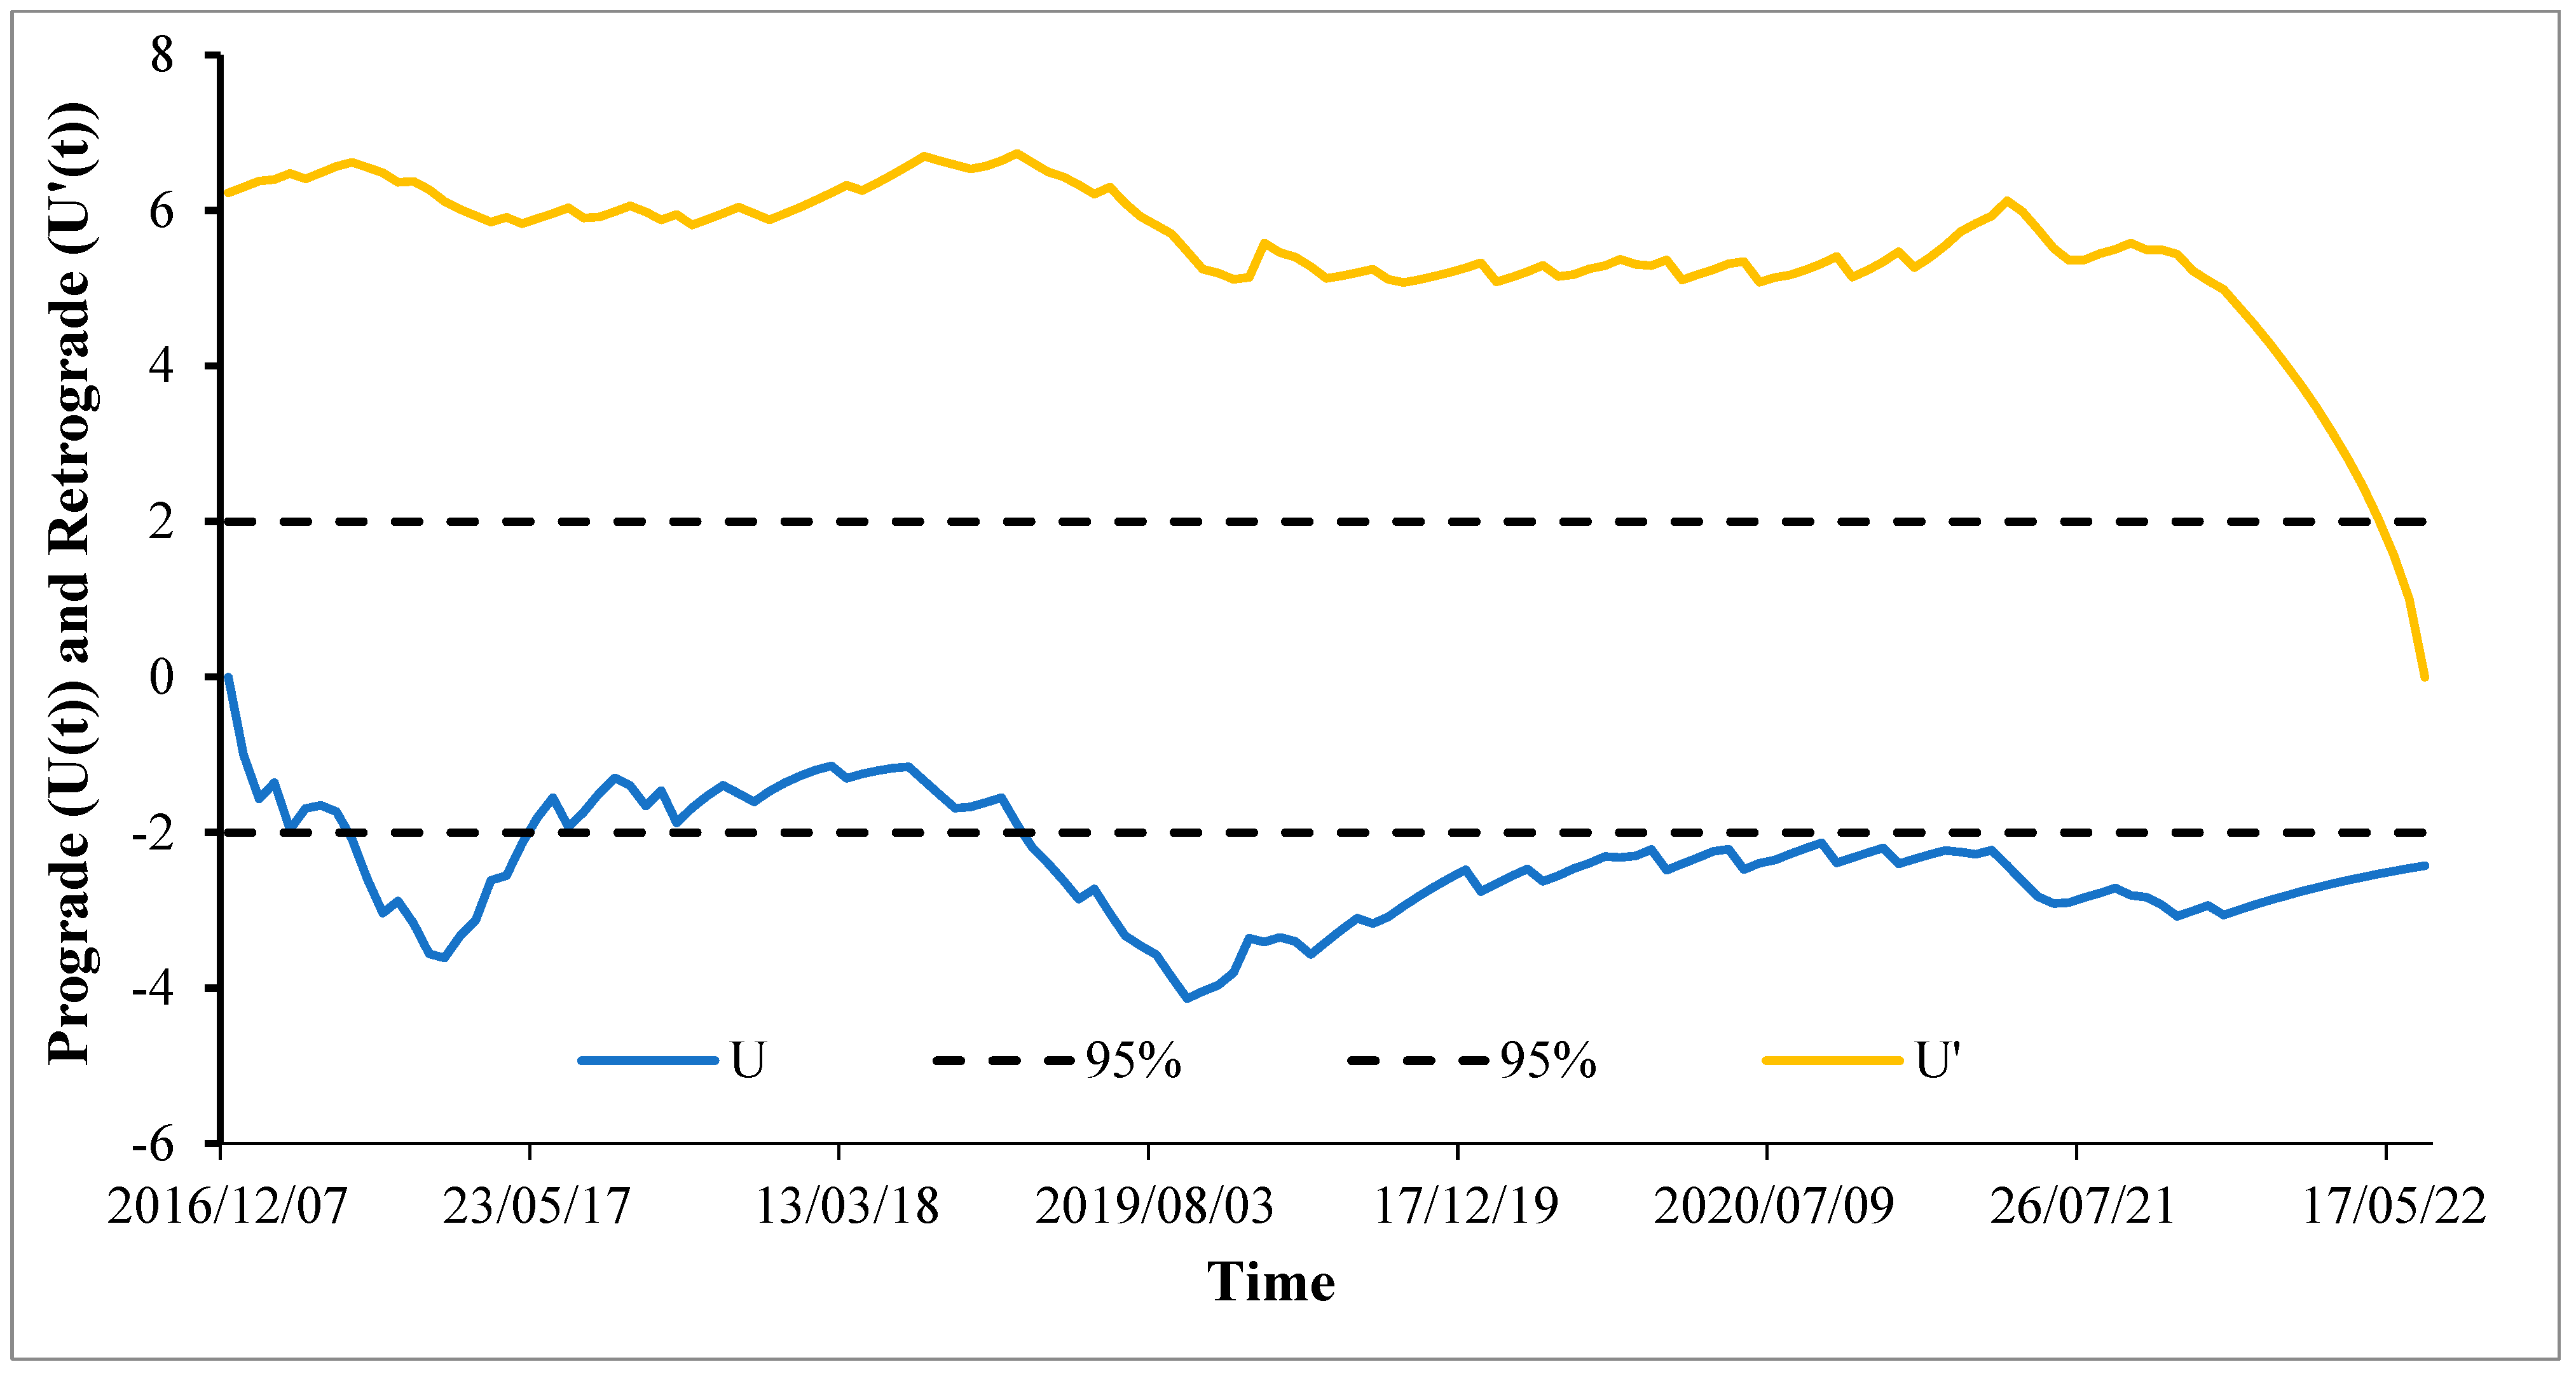
The Mann–Kendall sequential trend analysis tests displayed in Figure 3, Figure 4, Figure 5, Figure 6 and Figure 7 showed a significant increasing trend with minute changes for the variables assessed, including NH3, COD, TC, FC, and E. coli. From June 2019 to October 2022, NH3 declined after the second point of convergence in August 2018 until 2022. This trend could have resulted from the improvement in the nitrifying bacteria and sufficient desludging of the bioreactor. Likewise, Madkour et al. [36] reported significantly varying concentrations of NH3 and −PO4−3 in domestic wastewater due to changes in the hydraulic and organic load and varying bacteria populations that remove such nutrients. A significant increasing trend for COD from July 2020 to October 2022 with sporadic spikes from 2016 to 2022 was observed. This trend showed unstable concentrations of organic matter in the wastewater and less oxygen concentrations. Moreover, the increasing trend from July 2020 could be attributed to an influx of domestic wastewater that could have resulted from the COVID-19 national lockdown in 2020, which led to the production of high volumes of domestic sewage. Comparably, Saleh and Kayi [37] and Halicki and Halicki [38] reported that high organic content and failure in the oxidation of wastewater leads to the inundation of COD. On the other hand, NO3 depicted a steady trend, indicating minute variations, particularly from June 2020 to October 2022. This showed less NO3 concentrations or the limited conversion of NH3 to NO3. According to Faragò et al. [39], NO3 formation in wastewater is limited due to insufficient nitrification but results in abundant NH3.
All microbiological variables, namely TC, FC, and E. coli, had a similar trend that showed no points of convergence and depicted a stable and steady upward trend. This could be because of abundant fecal matter present in wastewater and insufficient disinfection. Gupta et al. [35] reported that pathogens in wastewater thrive and grow exponentially when there is insufficient disinfection, thus leading to effluents containing pathogens. Therefore, the Burgersfort effluent needed an advanced method of disinfection.

3.3. Principal Component Analysis Results for Physicochemical Variables

Nine physicochemical water quality variables were used to conduct the PCA, and seven of these variables were observed to have a significant loading; the presentation of their loadings was performed on four component factors (Table 3). For Component 1, positive significant loadings (component factor >0.3) for pH and NH3 were observed. This showed increased hydrogen ions in the wastewater affecting the pH, decomposition activity, and increasing NH3 gas retention. Dey et al. [40] and Hariri and Botte [41] observed that untreated organic matter in WRRFs decomposes over time; this results in pH imbalances, as well as the proliferation of NH3. Temperature had a negative significant loading (component loading <−0.5); this indicated low temperature levels which lead to minimal microbial reactions and the extirpation of gases such as NH3, CO2, and CH4. Alisawi [31] and Makuwa et al. [42] found that treating microbial communities through wastewater treatment processes is dependent on temperature. This outcome presents the temperature as a limiting factor to the treatment process at Burgersfort and indicates the need to explore other wastewater treatment methods that are not nature-based or affected by environmental conditions.
For Component 2, significant positive loadings for EC and COD were observed (component factor >0.3). This signified an abundance of ions, organic load, and insufficient oxidation of the wastewater. Due to the high organic content and limited aeration, anaerobic conditions are prevailing; this inhibits the performance of the aerobic bacteria to reduce COD, and this increases EC concentrations as well. Similarly, Saleh and Kayi [37] and Halicki and Halicki [38] observed high EC and COD loadings in wastewater effluent due to a failure in microbial populations because of insufficient aeration, which aids in the organic treatment of wastewater.
For Component 3, SO42− and Cl had significant positive loadings (component factor >0.3). This implied possible increased metal ions and salinity in the Burgersfort effluent. Zhou et al. [43] reported that SO42− and Cl in wastewater accumulate in sludge and are often recycled with the return activated sludge; thus, high salinity and metal ion levels in wastewater effluent are maintained. Consequently, this signals that although metals are not monitored in the Burgersfort effluent, they potentially exist in the effluent, since the WRRF also treats industrial effluent.
For Component 4, pH and NO3 had significant positive loadings (component factor >0.3). Further, pH was found to be a complex variable resulting in significant loadings on Components 1 and 4. This outcome postulated that pH affects a variety of variables in wastewater and their concentrations and rate of removal. Kokina et al. [44] likewise reported that wastewater treatment processes require a correctly balanced pH level of between 6.5 to 8.5 for the efficient treatment of wastewater; thus, their findings demonstrate the importance of pH balance in wastewater treatment processes. The significant positive loading of NO3 signified the prevalence of nitrogen and the failure of removal. Dey et al. [40] and Hariri and Botte [41] reported that NO3 is positively influenced by nitrogen in water, thus resulting in abundant NO3 levels.

3.4. Principal Component Analysis Results for Microbiological Variables and Free Chlorine

The microbiological variables and free chlorine presented significant loadings, as shown in Table 4. All microbial variables showed a significant positive loading on Component 1 (component factor >0.3), where free chlorine had no significant loading. Subsequently, on Component 2, where free chlorine had a significant positive loading (component factor >0.3), microbial variables had no significant loading. These results showed an abundance of pathogens and ample free chlorine in the Burgersfort effluent. Furthermore, these results implied that the disinfection method used was not sufficient. Zerva et al. [45] also observed poor disinfection by chlorine due to its limited effect on the bacterial structure of TC, FC, and E. coli. Therefore, chlorination needs to be applied in tandem with other disinfection methods such as ozonation.

3.5. Spearman’s Rank-Order Correlation Coefficient Analysis for Physicochemical and Microbiological Variables

The results of Spearman’s rho analysis of the physicochemical and microbiological variables (provided in Table 5) showed that most water quality variables are interdependent, particularly the microbiological variables. EC had a significant difference with COD and −PO4−3 (p value < 0.05). This implied that EC concentrations depend on the concentrations of COD and −PO4−3. Similarly, Kim et al. [46] and Mathur et al. [47] found a direct relationship between EC and −PO4−3 and reported that EC can be used to estimate concentrations of −PO4−3 in wastewater. Moreover, a high organic load resulting from food waste and domestic wastewater enhances COD, which increases EC. Therefore, the findings of this study affirmed the direct relationship among EC, COD, and −PO4−3. The pH concentration significantly varied with the temperature and NH3 (p value < 0.05). This denoted that the changes in temperature and NH3 influenced the pH concentration. According to Makuwa et al. [42], temperature influences ion concentrations, which in turn affects ion-dependent variables such as pH and +NH3. This outcome speaks to the need to monitor pH and temperature because of their influence on the wastewater treatment process and other water quality variables.
NH3 showed a positive correlation (CC > 0.2) with pH and COD, and depicted a significant difference with temperature (p value < 0.05). Such results suggested that the concentration and removal of N H 3 is dependent upon temperature, pH, and COD concentrations. Yadu et al. [48] reported that pH and temperature influence the concentration of NH3; moreover, the COD and NH3 ratio influences the denitrification and nitrification processes in wastewater treatment. Therefore, NH3 and COD depicted a linear relationship in this study. CI showed a positive correlation (CC > 0.2) and a significant difference (p value of <0.05) with EC, NO3, and SO42−. These findings indicated that ion-dependent variables such as EC, NO3, pH, and SO42−, are enhanced by a high concentration of Cl. It can also be deduced that Cl has increased salinity in Burgersfort, impeding the bacteria responsible for denitrification and nitrification. This has also led to the increase of NO3 and SO42− concentrations in the return activated sludge, which contributes to the overloading of nutrients in the bioreactor. Venâncio et al. [49] indicated that SO42− can bind with Cl to form sulphate-chlorides. Hong et al. [50] and Phungela et al. [6] reported a significant reduction in the removal of nutrients and organic matter in the BNR wastewater treatment system due to high Cl levels. Therefore, Cl reduction is required to avoid the formation of compounds such as sulphate-chlorides that are laborious to treat. Also, influent sources such as mining, industrial, and agricultural sewage that are attributed to high EC, pH, NH3, COD, NO3, −PO4−3, SO42−, and Cl require sewage pretreatment prior to disposal into the facility. The mechanical and biological failure of the bioreactor further intensifies the failing wastewater quality variables. Ultimately, the lack of the implementation of relevant by-laws that should be imposed on industries supplying the facility with wastewater also enhances the poor effluent quality.
The Spearman’s rho analysis results of microbiological variables and free chlorine depicted that free chlorine had no correlation and no significant difference (p value > 0.05) with TC, FC, and E. coli. This signified an inverse relationship between free chlorine and the microbial variables, and that chlorine is an effective disinfectant in wastewater when applied correctly. Bekink and Nozaic [51] denoted that when chlorine is correctly used, most pathogens are destroyed, whereas TC, FC, and E. coli, had a significant difference (p value < 0.05), and a strong positive correlation (CC > 0.2) among each other. This implied that most microbial pathogens are co-dependent, co-exist, and are all from common sources. These findings are consistent with the findings by Bega [52] and Edokpayi et al. [34], which showed the interdependence that exists among microbial variables by illustrating that the detection of TC in wastewater indicates the possibility of elevated levels of FC and E. coli. These findings connote domestic sewage that contains fecal matter as the main causative source of pathogens in wastewater effluent and poor disinfection as a driver of high pathogen numbers in wastewater effluent.

3.6. Wastewater Quality Index

The WWQI results summarized in Table 6 denote that the physical variables scored a good to regular WWQI rating, the chemical variables scored an excellent to very bad WWQI rating, and the microbiological variables all scored a very bad WWQI rating. The EC, pH, and temperature scored a good to regular WWQI rating. This shows that overall, the physical variables were within acceptable limits. Ayoub and El-Morsy [26] found an excellent WWQI rating for physical variables because of sufficient dilution by the hydraulic load; these findings were in line with the findings in this study. For the chemical variables, NH3 and COD scored a very bad water quality rating; this can be attributed to the heavy organic load coupled with the inefficient removal of organic matter during treatment. A high sewage concentration, according to Ayoub and El-Morsy [26], profusely enhances NH3 and COD levels; this results in effluents with unmanageable NH3 and COD levels. On the other hand, NO3 and −PO4−3 scored an excellent overall WWQI rating. This could be attributed to the inefficient conversion of NH3 to NO3 and −PO4−3. The latter could have been low due to a limited concentration from the inflow. Similarly, Raut et al. [53] and Jamshidzadeh and Barzi [54] observed that the NO3 WWQI rating projects a better rating than the NH3 WWQI rating due to failing denitrification and nitrification processes in the BNR process, and the −PO4−3 WWQI rating depended on the p concentration in the influent and sufficient treatment. The free chlorine scored an excellent WWQI rating, thus indicating sufficient chlorination. A WWQI rating could not be determined for Cl and SO42− because there were no limit guidelines for such variables in this study.
All microbiological variables scored a very bad WWQI rating, depicting heavy fecal content and insufficient disinfection. These findings indicated that although Burgersfort was shown to have sufficient chlorination, disinfection was not attained. Failure in disinfection could be ascribed to the high organic content and suspended solids which the pathogens stick to [45]. Also, the limited contact or retention time of wastewater with chlorine, and the exposure of the contact channel to sunlight hindered the disinfection process [55,56]. It can be deduced from the findings of this study that the extirpation of TC, FC, and E. coli required the right dosage of chlorine, and sufficient contact time, as well as the avoidance of environmental conditions such as sunlight, since chlorine gas is particularly sensitive to sunlight and high temperatures [45].

3.7. Integrated Wastewater Resource Recovery Model Results

Some water quality variables of the Burgersfort effluent showed significant loadings and scored relatively poor WWQI ratings, revealing the prevalence of recoverable wastewater resources in the effluent (Table 7). EC and pH showed significant loadings, which brings attention to the possibility of ion variations. This implied that wastewater resources such as metals could be recovered from the effluent, based on the IWWRR model results. Azmi et al. [27] conducted electroplating in the form of ion exchange and photocatalysis on wastewater samples with the aim of recovering metals, which was found to be successful. Such technologies could be applied to the Burgersfort effluent to manage the possibility of metal pollution in the environment.
The chemical water quality variables NH3 and COD both presented significant loadings and a very bad WWQI rating. This signified an abundance of NH3 gas and organic matter. According to the IWWRR model, these results implied that sludge can be recovered to produce manure, and the manure can be digested anaerobically, or be incinerated to produce biofuel. Also, with the current energy crisis faced in South Africa that disturbs WRRF operations, this assertion then alludes to the dire need to recover biofuel from wastewater for power supply. This will enable researchers to ascertain the energy self-reliance of WRRFs and help to produce uncompromised effluent quality. Moreover, this is a sustainable practice that warrants sludge recycling. Gowd et al. [57], Kehrein et al. [14], and Mohan et al. [12] reported the practice of recovering sludge using sludge incineration for biofuel production, and the practice of recovering NH3, CH4, and CO through air stripping and electrodialysis from wastewater as being feasible practices that further minimize the effects of greenhouse gases, such as NH3, CH4, CO, and CO2 on climate change. Plastic traces have been found in sludge and wastewater effluent [13]. Although plastic traces have not been tested in the Burgersfort effluent, based on the sludge production and generally poor water quality and land-use activities, the IWWRR model suggests the recovery of bioplastics. Bioplastics can be extracted through PHA extraction from bacterial cells by the selective digestion of bacterial biomass from wastewater to produce bioplastics that are biodegradable and environmentally friendly [13].
Nitrates, sulphates, and chlorides all presented significant loadings, thus indicating high concentrations of nutrients such as nitrogen and sulphur, and also salinity, and the potential prevalence of ion metals in the Burgersfort effluent. Based on the IWWRR model results, these outcomes call for the use of struvite precipitation to recover nitrogen and phosphorus, and photocatalysis and ion exchange recovery methods to recover salts and precious metals. Shamaiaa-Sata et al. [1], Naidoo and Olaniran [58], and Phungela et al. [6] demonstrated that the BNR method only removes 20–60% of nutrients from wastewater, and it is sensitive to salinity and metals. All these findings deem this study relevant and call for the immediate intervention of resource recovery practices, particularly in the BNR wastewater treatment processes. Also, the improved removal of nutrients and organic matter will ameliorate the microbial quality of wastewater effluent and reduce the possible nutrient pollution that is predominantly reported in Africa, as well as other developing countries [9,12,14,28]. Although most of the resource recovery technologies have expensive capital and operational costs, the benefits of utilizing such technologies could prove to outweigh such costs. The production of good quality recovered water resources could lead to the recovery of costs because of the resource sales to local communities, and such cashflow would support the economic feasibility and sustainable operation of the wastewater resource recovery facility [59].

4. Conclusions

  • The IWWRR model developed in this study was used to propose possible resource recovery technologies that could be implemented in a WWRF that utilizes the BNR treatment system to recover reusable resources from wastewater effluent, thereby improving on the current wastewater treatment processes and thus reducing the pollution of water resources. The application of this model to the Burgersfort WWRF case study provided evidence of the prevalence of recoverable resources in the effluent, such as nutrients, water, sludge, metals, bioplastics, and biofuel.
  • Based on the IWWRR model results, the different technologies that could be incorporated in a WWRF to recover valuable resources from wastewater effluent include the anaerobic digestion of manure or incineration to produce biofuel, the use of struvite precipitation to recover nitrogen and phosphorus, and photocatalysis and ion exchange recovery methods to recover salts and precious metals. However, even though plastic traces were not tested in the case study of Burgersfort effluent, based on the sludge production and poor water quality, and land-use activities in the study area, the IWWRR model suggests the recovery of bioplastics through PHA extraction from bacterial cells by selective digestion of bacterial biomass from wastewater to produce bioplastics that are biodegradable and environmentally friendly.
  • On the other hand, the assessment of the effluent quality from the WRRF case study identified NH3, COD, TC, FC, and E. coli water quality variables as critically non-compliant and suggests severe pollution threats to the receiving water body. Such findings from the effluent quality assessment were confirmed by the WWQI results, which revealed a very bad water quality rating for NH3 and COD, as well as all the microbiological variables, TC, FC, and E. coli. If effluent with such poor water quality is disposed into water resources, there is bound to be organic pollution threats, high probability of eutrophication, as well as microbial pollution threats to the environment.
  • Based on the findings of this study, we recommend that wastewater resource recovery technologies for nutrients, water, sludge, metals, bioplastics, and biofuel need to be incorporated into the BNR process treatment system as per the results of the water quality and the IWWRR model. By doing so, the pollutants within the effluent of the WRRF will be significantly reduced, and the wastewater treatment facility will be transformed into a wastewater resource recovery facility, thus protecting the receiving water body, the environment, and ensuring the management of wastewater in a holistic and integrated way. The model developed in this study can contribute to the enhancement of effluent quality from WRRFs worldwide and can further be used as a tool in water resource pollution control, water, and food security, as well as an increase in nutrient and water recycling for agricultural purposes.

5. Recommendations for Further Research

  • The precise determination of the existence of bioplastics and metal traces in the sludge and wastewater effluent would have added value to this study and directly link such contaminants to factories and mining industries. Therefore, further research is required where the sludge samples and effluent samples are both analyzed for such contaminants to inform decision-making processes in wastewater resource recovery practices; this would have increased this study’s dimensions.
  • The availability of raw influent wastewater data samples could have added more value to this study. The raw wastewater data were unavailable on record because raw water samples were not regularly monitored. The raw influent data samples would have informed the level of pollution received at the plant, and if long-term records were kept, this would have informed the need to improve the treatment process much quicker than with the treated effluent quality data. Therefore, more research on wastewater resource recovery is needed that includes long-term assessments of raw influent wastewater quality data and final effluent wastewater quality data.
  • A more complex study with diversified sampling positions such as sampling and analysis from different stages of the biological reactor would inform the concentration changes of nutrients or other substances during the reaction process. This would lead to a precise determination of the treatment component that is less efficient in treating the wastewater.

Author Contributions

Conceptualization, S.M.; methodology, S.M.; data curation, S.M.; writing—original draft preparation, S.M.; writing—review and editing, S.M., G.B. and P.O.; supervision, G.B. All authors have read and agreed to the published version of the manuscript.

Funding

This research received no external funding.

Data Availability Statement

Data for this study will be shared upon reasonable request.

Acknowledgments

The authors extend their appreciation to the University of the Free State, as well as the Lepelle Northern Water for providing support for this work.

Conflicts of Interest

The authors have no conflicts of interest to declare and therefore hope that the manuscript will be acceptable for publication in its current form.

References

  1. Shaimaa-Satae, M.A.; Abdul-Kareem, L.; Abdul-Hussein, N.A. New approach for treatment of pollutants in municipal waste water. Turk. J. Physiother. Rehabil. 2019, 32, 11537–11551. Available online: https://sustainability.uobabylon.edu.iq/uploaded/Sustain_2021_1088914.pdf (accessed on 1 June 2023).
  2. United Nations World Water Assessment Programme. The United Nations World Water Development Report 2017. Wastewater: The Untapped Resource; UNESCO: Paris, France, 2017; Available online: https://reliefweb.int/attachments/ffa40d52-7333-3d19-9f45-3fa8c95d6f17/247153e.pdf (accessed on 1 June 2023).
  3. Onu, M.A.; Ayeleru, O.O.; Oboirien, B.; Olubambi, P.A. Challenges of wastewater generation and management in sub-Saharan Africa: A Review. Environ. Chall. 2023, 11, 100686. [Google Scholar] [CrossRef]
  4. Oberholster, P.J.; Oberholster, P.F.; Truter, C.; Botha, A.M. Assessing Rivers Self-Purification Capacity Down WWTPs in a Lowland Catchment Using a Phosphorus Sensitive Index. In Advances in Environmental Research; Daniels, J.A., Ed.; Nova Science Publishers, Inc.: Hauppauge, NY, USA, 2017; pp. 160–182. [Google Scholar]
  5. Montwedi, M.; Munyaradzi, M.; Pinoy, L.; Dutta, A.; Ikumi, D.S.; Motoasca, E.; Van der Bruggen, B. Resource recovery from and management of wastewater in rural South Africa: Possibilities and practices. J. Water Process. Eng. 2021, 40, 101978. [Google Scholar] [CrossRef]
  6. Phungela, T.T.; Maphanga, T.; Chidi, B.S.; Madonsela, B.S.; Shale, K. The impact of wastewater treatment effluent on Crocodile River quality in Ehlanzeni District, Mpumalanga province, South Africa. S. Afr. J. Sci. 2022, 118, 61–71. [Google Scholar] [CrossRef]
  7. Department of Water and Sanitation, South Africa. National Water and Sanitation Master Plan. Volume 2: Plan to Action. Ready for the Future and Ahead of the Curve; USA, 2018. Available online: https://www.dws.gov.za/National%20Water%20and%20Sanitation%20Master%20Plan/Documents/Volume2%20(Printed%20version%20).pdf (accessed on 1 June 2023).
  8. Department of Water and Sanitation, South Africa. Green Drop Watch Report: Technical Assessment of the Condition of Municipal Wastewater Conveyance and Treatment Systems in South Africa; Pretoria, South Africa, 2023. Available online: https://ws.dws.gov.za/IRIS/releases/GDWR.pdf (accessed on 1 April 2023).
  9. Radebe, B. Competent People to be Recruited to Resolve Challenge in Hammanskraal. SABC News. 9 June 2023. Available online: https://www.sabcnews.com/sabcnews/competent-people-to-be-recruited-to-resolve-challenge-in-hammanskraal (accessed on 14 August 2023).
  10. Oberholster, P.J.; Botha, A.-M.; Chamier, J.; De Klerk, A.R. Longitudinal trends in water chemistry and phytoplankton assemblage downstream of the Riverview WWTP in the Upper Olifants River. Ecohydrol. Hydrobiol. 2013, 13, 41–51. [Google Scholar] [CrossRef]
  11. Ratola, N.; Cincinelli, A.; Alves, A.; Katsoyiannis, A. Occurrence of organic microcontaminants in the wastewater treatment process. A mini review. J. Hazard. Mater. 2012, 239–240, 1–18. [Google Scholar] [CrossRef]
  12. Mohan, T.R.; Chanakya, H.M.; Mohan Kumar, M.S.; Rao, L. Achieving biological nutrient removal in an old sewage treatment plant through process modifications—A simulation and experimental study. J. Water Process Eng. 2022, 45, 102461. [Google Scholar] [CrossRef]
  13. Solon, K.; Flores-Alsina, X.; Mbamba, C.K.; Ikumi, D.; Volcke, E.I.P.; Vaneechaute, C.; Ekama, G.; Vanrolleghem, P.A.; Batstone, D.J.; Gernaey, K.V.; et al. Plant-wide modelling of phosphorus transformations in wastewater treatment systems: Impacts of control and operational strategies. Water Res. 2017, 113, 97–110. [Google Scholar] [CrossRef] [PubMed]
  14. Kehrein, P.; Van Loosdrecht, M.; Osseweijer, P.; Garfí, M.; Dewulf, J.; Posada, J. A critical review of resource recovery from municipal wastewater treatment plants—Market supply potentials, technologies and bottlenecks. Environ. Sci. Water Res. Technol. 2020, 6, 877–910. [Google Scholar] [CrossRef]
  15. Afzal, M.; Arslan, M.; Müller, J.A.; Shabir, G.; Islam, E.; Tahseen, R.; Anwar-ul-Haq, M.; Hashmat, A.J.; Iqbal, S.; Khan, Q.M. Floating treatment wetlands as a suitable option for large-scale wastewater treatment. Nat. Sustain. 2019, 2, 863–871. [Google Scholar] [CrossRef]
  16. Borne, K.E.; Fassman, E.A.; Tanner, C.C. Floating treatment wetland retrofit to improve stormwater pond performance for suspended solids, copper and zinc. Ecol. Eng. 2013, 54, 173–182. [Google Scholar] [CrossRef]
  17. Bu, F.; Xu, X. Planted floating bed performance in treatment of eutrophic river water. Environ. Monit. Assess. 2013, 185, 9651–9662. [Google Scholar] [CrossRef] [PubMed]
  18. Oberholster, P.; Cheng, P.-H.; Genthe, B.; Steyn, M. The environmental feasibility of low-cost algae-based sewage treatment as a climate change adaptation measure in rural areas of SADC countries. J. Appl. Phycol. 2018, 31, 355–363. [Google Scholar] [CrossRef]
  19. Muga, E.M.; Mihelcic, R.J. Sustainability of wastewater treatment technologies. J. Environ. Manag. 2008, 88, 437–447. [Google Scholar] [CrossRef]
  20. Sucu, S.; Van Schaik, M.O.; Esmeli, R.; Ouelhadj, D.; Holloway, T.; Williams, J.B.; Cruddas, P.; Martinson, D.B.; Chen, W.; Cappon, H.J. A conceptual framework for a multi-criteria decision support tool to select technologies for resource recovery from urban wastewater. J. Environ. Manag. 2021, 300, 113608. [Google Scholar] [CrossRef] [PubMed]
  21. La Para, T.M.; Allenman, J.E.; Pope, P.G. Miniaturized closed reflux, colorimetric method for the determination of chemical oxygen demand. Waste Manag. 2000, 20, 295–298. [Google Scholar] [CrossRef]
  22. Belcher, R.; Macdonald, A.M.G.; Parry, E. On mohr’s method for the determination of chlorides. Anal. Chim. Acta 2002, 16, 524–529. [Google Scholar] [CrossRef]
  23. Kinzelman, J.L.; Singh, A.; Ng, C.; Pond, K.R.; Bagley, R.C.; Gradus, S. Use of IDEXX Colilert-18® and Quanti-Tray/2000 as a rapid and simple enumeration method for the implementation of recreational water monitoring and notification programs. Lake Reserv. Manag. 2005, 21, 73–77. [Google Scholar] [CrossRef]
  24. Owusu-Ansah, E.d.G.J.; Sampson, A.; Amponsah, S.K.; Abaidoo, R.C. Performance, compliance and reliability of waste stabilization pond: Effluent discharge quality and environmental protection agency standards in Ghana. Res. J. Appl. Sci. Eng. Technol. 2015, 10, 1293–1302. [Google Scholar] [CrossRef]
  25. Department of Water Affairs, South Africa. Discharge Limits and Conditions Set Out in the National Water Act; Government Gazette 20526: Pretoria, South Africa, 1999. [Google Scholar]
  26. Ayoub, M.; El-Morsy, A. Applying the wastewater quality index for assessing the effluent quality of recently upgraded Meet Abo El-koum Wastewater Treatment Plant. J. Ecol. Eng. 2021, 22, 128–133. [Google Scholar] [CrossRef]
  27. Azmi, A.A.; Zamanhuri, N.A.; Yahya, A. Precious metals recovery from electroplating wastewater: A review. IOP Conf. Ser. Mater. Sci. Eng. 2018, 358, 012024. [Google Scholar] [CrossRef]
  28. Wu, H.; Vaneeckhaute, C. Nutrient recovery from wastewater: A review on the integrated physicochemical technologies of ammonia stripping, adsorption and struvite precipitation. Chem. Eng. J. 2022, 433, 133664. [Google Scholar] [CrossRef]
  29. Environmental Protection Agency. Wastewater Treatment Manuals—Primary, Secondary and Tertiary Treatment; EPA: Wexford, Ireland, 1997; Available online: https://sanihub.info/wp-content/uploads/2023/08/EPA-Ireland_1997_Waste-water-treatment-manuals-primary-secondary-and-tertiary-treatment.pdf (accessed on 1 May 2023).
  30. Department of Water Affairs, South Africa. Quality of Domestic Water Supply. Volume 4: Treatment Guide. Pretoria. 2002. Available online: http://www.dwa.gov.za/iwqs/AssessmentGuides/TreatmentGuide/TreatmentGuide.pdf (accessed on 1 June 2023).
  31. Alisawi, H.A.O. Performance of wastewater treatment during variable temperature. Appl. Water Sci. 2020, 10, 12–21. [Google Scholar] [CrossRef]
  32. Tchobanoglous, G.; Burton, F.L.; Stensel, H.D. Wastewater Engineering: Treatment and Reuse, 4th ed.; Metcalf & Eddy, Inc.: New York, NY, USA, 2003. [Google Scholar]
  33. Ritter, J.A. Water Quality: Principles and Practices of Water Supply Operations, 4th ed.; American Water Works Association: Denver, CO, USA, 2010. [Google Scholar]
  34. Edokpayi, J.N.; Odiyo, J.O.; Durowoju, O.S. Impact of Wastewater on Surface Water Quality in Developing Countries: A Case Study of South Africa. In Water Quality; Tutu, H., Ed.; InTechOpen: London, UK, 2017; pp. 401–416. [Google Scholar] [CrossRef]
  35. Gupta, V.; Shekhawat, S.S.; Kulshreshtha, N.M.; Gupta, A.B. A systematic review on chlorine tolerance among bacteria and standardization of their assessment protocol in wastewater. Water Sci. Technol. 2022, 86, 261–291. [Google Scholar] [CrossRef]
  36. Madkour, A.G.; Hamed, M.M.; Dar, M.A. Removal of ammonia and orthophosphate from domestic wastewater using marine actinomycetes. Egypt. J. Aquat. Biol. Fish. 2019, 23, 455–465. Available online: https://ejabf.journals.ekb.eg/article_48322_6d4e225e5e5458ac35e6021826e334ba.pdf (accessed on 30 April 2023). [CrossRef]
  37. Saleh, B.A.; Kayi, H. Prediction of chemical oxygen demand from the chemical composition of wastewater by artificial neural networks. J. Phys. Conf. Ser. 2021, 1818, 012035. [Google Scholar] [CrossRef]
  38. Halicki, W.; Halicki, M. From domestic sewage to potable water quality: New approach in organic matter removal using natural treatment systems for wastewater. Water 2022, 14, 1909. [Google Scholar] [CrossRef]
  39. Faragò, M.; Damgaard, A.; Madsen, J.A.; Andersen, J.K.; Thornberg, D.; Andersen, M.H.; Rygaard, M. From wastewater treatment to water resource recovery: Environmental and economic impacts of full-scale implementation. Water Res. 2021, 204, 117554. [Google Scholar] [CrossRef] [PubMed]
  40. Dey, S.; Haripavan, N.; Basha, S.R.; Babu, G.V. Removal of ammonia and nitrates from contaminated water by using solid waste bio-adsorbents. Curr. Res. Chem. Biol. 2021, 1, 100005. [Google Scholar] [CrossRef]
  41. Hariri, M.B.; Botte, G.G. Simultaneous removal of ammonia and nitrate from wastewater using pulse electrolysis technique. J. Electrochem. Soc. 2023, 170, 67–74. [Google Scholar] [CrossRef]
  42. Makuwa, S.; Tlou, M.; Fosso-Kankeu, E.; Green, E. The effects of dry versus wet season on the performance of a wastewater treatment plant in Northwest Province, South Africa. Water SA 2022, 48, 54–67. [Google Scholar] [CrossRef]
  43. Zhou, Z.; Huang, J.; Zeng, G.; Yang, R.; Xu, Z.; Zhou, Z.; Lyu, S. Insights into the removal of organic contaminants by calcium sulfite activation with Fe (III): Performance, kinetics, and mechanism. Water Res. 2022, 221, 118792. [Google Scholar] [CrossRef] [PubMed]
  44. Kokina, K.; Mezule, L.; Gruskevica, K.; Neilands, R.; Golovko, K.; Juhna, T. Impact of rapid pH changes on activated sludge process. Appl. Sci. 2022, 12, 5754. [Google Scholar] [CrossRef]
  45. Zerva, I.; Remmas, N.; Kagalou, I.; Melidis, P.; Ariantsi, M.; Sylaois, G.; Ntougias, S. Effect of chlorination on microbiological quality of effluent of a full-scale wastewater treatment plant. Life 2021, 11, 68. [Google Scholar] [CrossRef] [PubMed]
  46. Kim, K.-S.; Yoo, J.-S.; Kim, S.; Lee, H.J.; Ahn, K.-H.; Kim, I.S. Relationship between the electric conductivity and phosphorus concentration variations in an enhanced biological nutrient removal process. Water Sci. Technol. 2007, 2, 203–208. [Google Scholar] [CrossRef] [PubMed]
  47. Mathur, L.; Kim, I.-H.; Bhardwaj, A.; Singh, B.; Park, J.-Y.; Song, S.-J. Structural and electrical properties of novel phosphate based composite based composite electrolyte for low-temperature fuel cell. Compos. Part B Eng. 2020, 202, 18–24. [Google Scholar] [CrossRef]
  48. Yadu, A.; Sahariah, B.P.; Anandkumar, J. Influence of COD/ammonia ratio on simultaneous removal of NH4+-N and COD in surface water using moving bed batch reactor. J. Water Process Eng. 2018, 22, 66–72. [Google Scholar] [CrossRef]
  49. Venâncio, L.V.L.; Farinha, A.S.F.; Gomes, M.T.S.R. Analysing sulphate and chloride in mineral drinking water by flow injection analysis with a single acoustic wave sensor. Talanta 2018, 189, 65–70. [Google Scholar] [CrossRef] [PubMed]
  50. Hong, C.C.; Chan, S.-K.; Shim, H. Effect of chloride on biological nutrient removal from wastewater. J. Appl. Sci. Environ. Sanit. 2008, 2, 85–92. [Google Scholar]
  51. Bekink, M.J.; Nozaic, D.J. Assessment of a chlorine dioxide proprietary product for water and wastewater disinfection. Water SA 2013, 39, 157–165. [Google Scholar] [CrossRef]
  52. Bega, S. Invasive Water Hyacinth Explodes on Hartbeespoort Dam. Mail & Guardian. 27 January 2023. Available online: https://mg.co.za/environment/2023-01-27-invasive-water-hyacinth-explodes-on-hartbeespoort-dam/?amp (accessed on 16 August 2023).
  53. Raut, S.B.; Anaokar, G.S.; Dharnaik, A.S. Determination of wastewater quality index of municipal wastewater treatment plant using fuzzy rule base. Eur. J. Adv. Eng. Technol. 2017, 4, 733–738. Available online: https://ejaet.com/PDF/4-10/EJAET-4-10-733-738.pdf (accessed on 30 May 2023).
  54. Jamshidzadeh, Z.; Barzi, M.T. Wastewater quality index (WWQI) as an assessment tool of treated wastewater quality for agriculture: A case of North Wastewater Treatment Plant effluent of Isfahan. Environ. Sci. Pollut. Res. 2020, 27, 7366–7378. [Google Scholar] [CrossRef] [PubMed]
  55. Ahuja, S. Handbook of Water Purity and Quality; Academic Press: New York, NY, USA, 2009. [Google Scholar]
  56. Water Environment Federation. Operation of Municipal Wastewater Treatment Plants. Volume 2: Liquid Processes; McGraw-Hill Education: New York, NY, USA, 2008. [Google Scholar]
  57. Gowd, S.C.; Ramakrishna, S.; Rajendran, K. Wastewater in India: An untapped and under-tapped resource for nutrient recovery towards attaining a sustainable circular economy. Chemosphere 2022, 291, 132753. [Google Scholar] [CrossRef] [PubMed]
  58. Naidoo, S.; Olaniran, A.O. Treated wastewater effluent as a sources of microbial pollution of surface water resources. Int. J. Environ. Res. Public Health 2014, 11, 249–270. [Google Scholar] [CrossRef] [PubMed]
  59. Al-Qodah, Z.; Al-Zoubi, H.; Hudaib, B.; Omar, W.; Soleimani, M.; Abu-Romman, S.; Frontistis, Z. Sustainable vs. Conventional Approach for Oil Wastewater Mangement: A Review of the State of the Art. Water 2022, 14, 1695. [Google Scholar] [CrossRef]
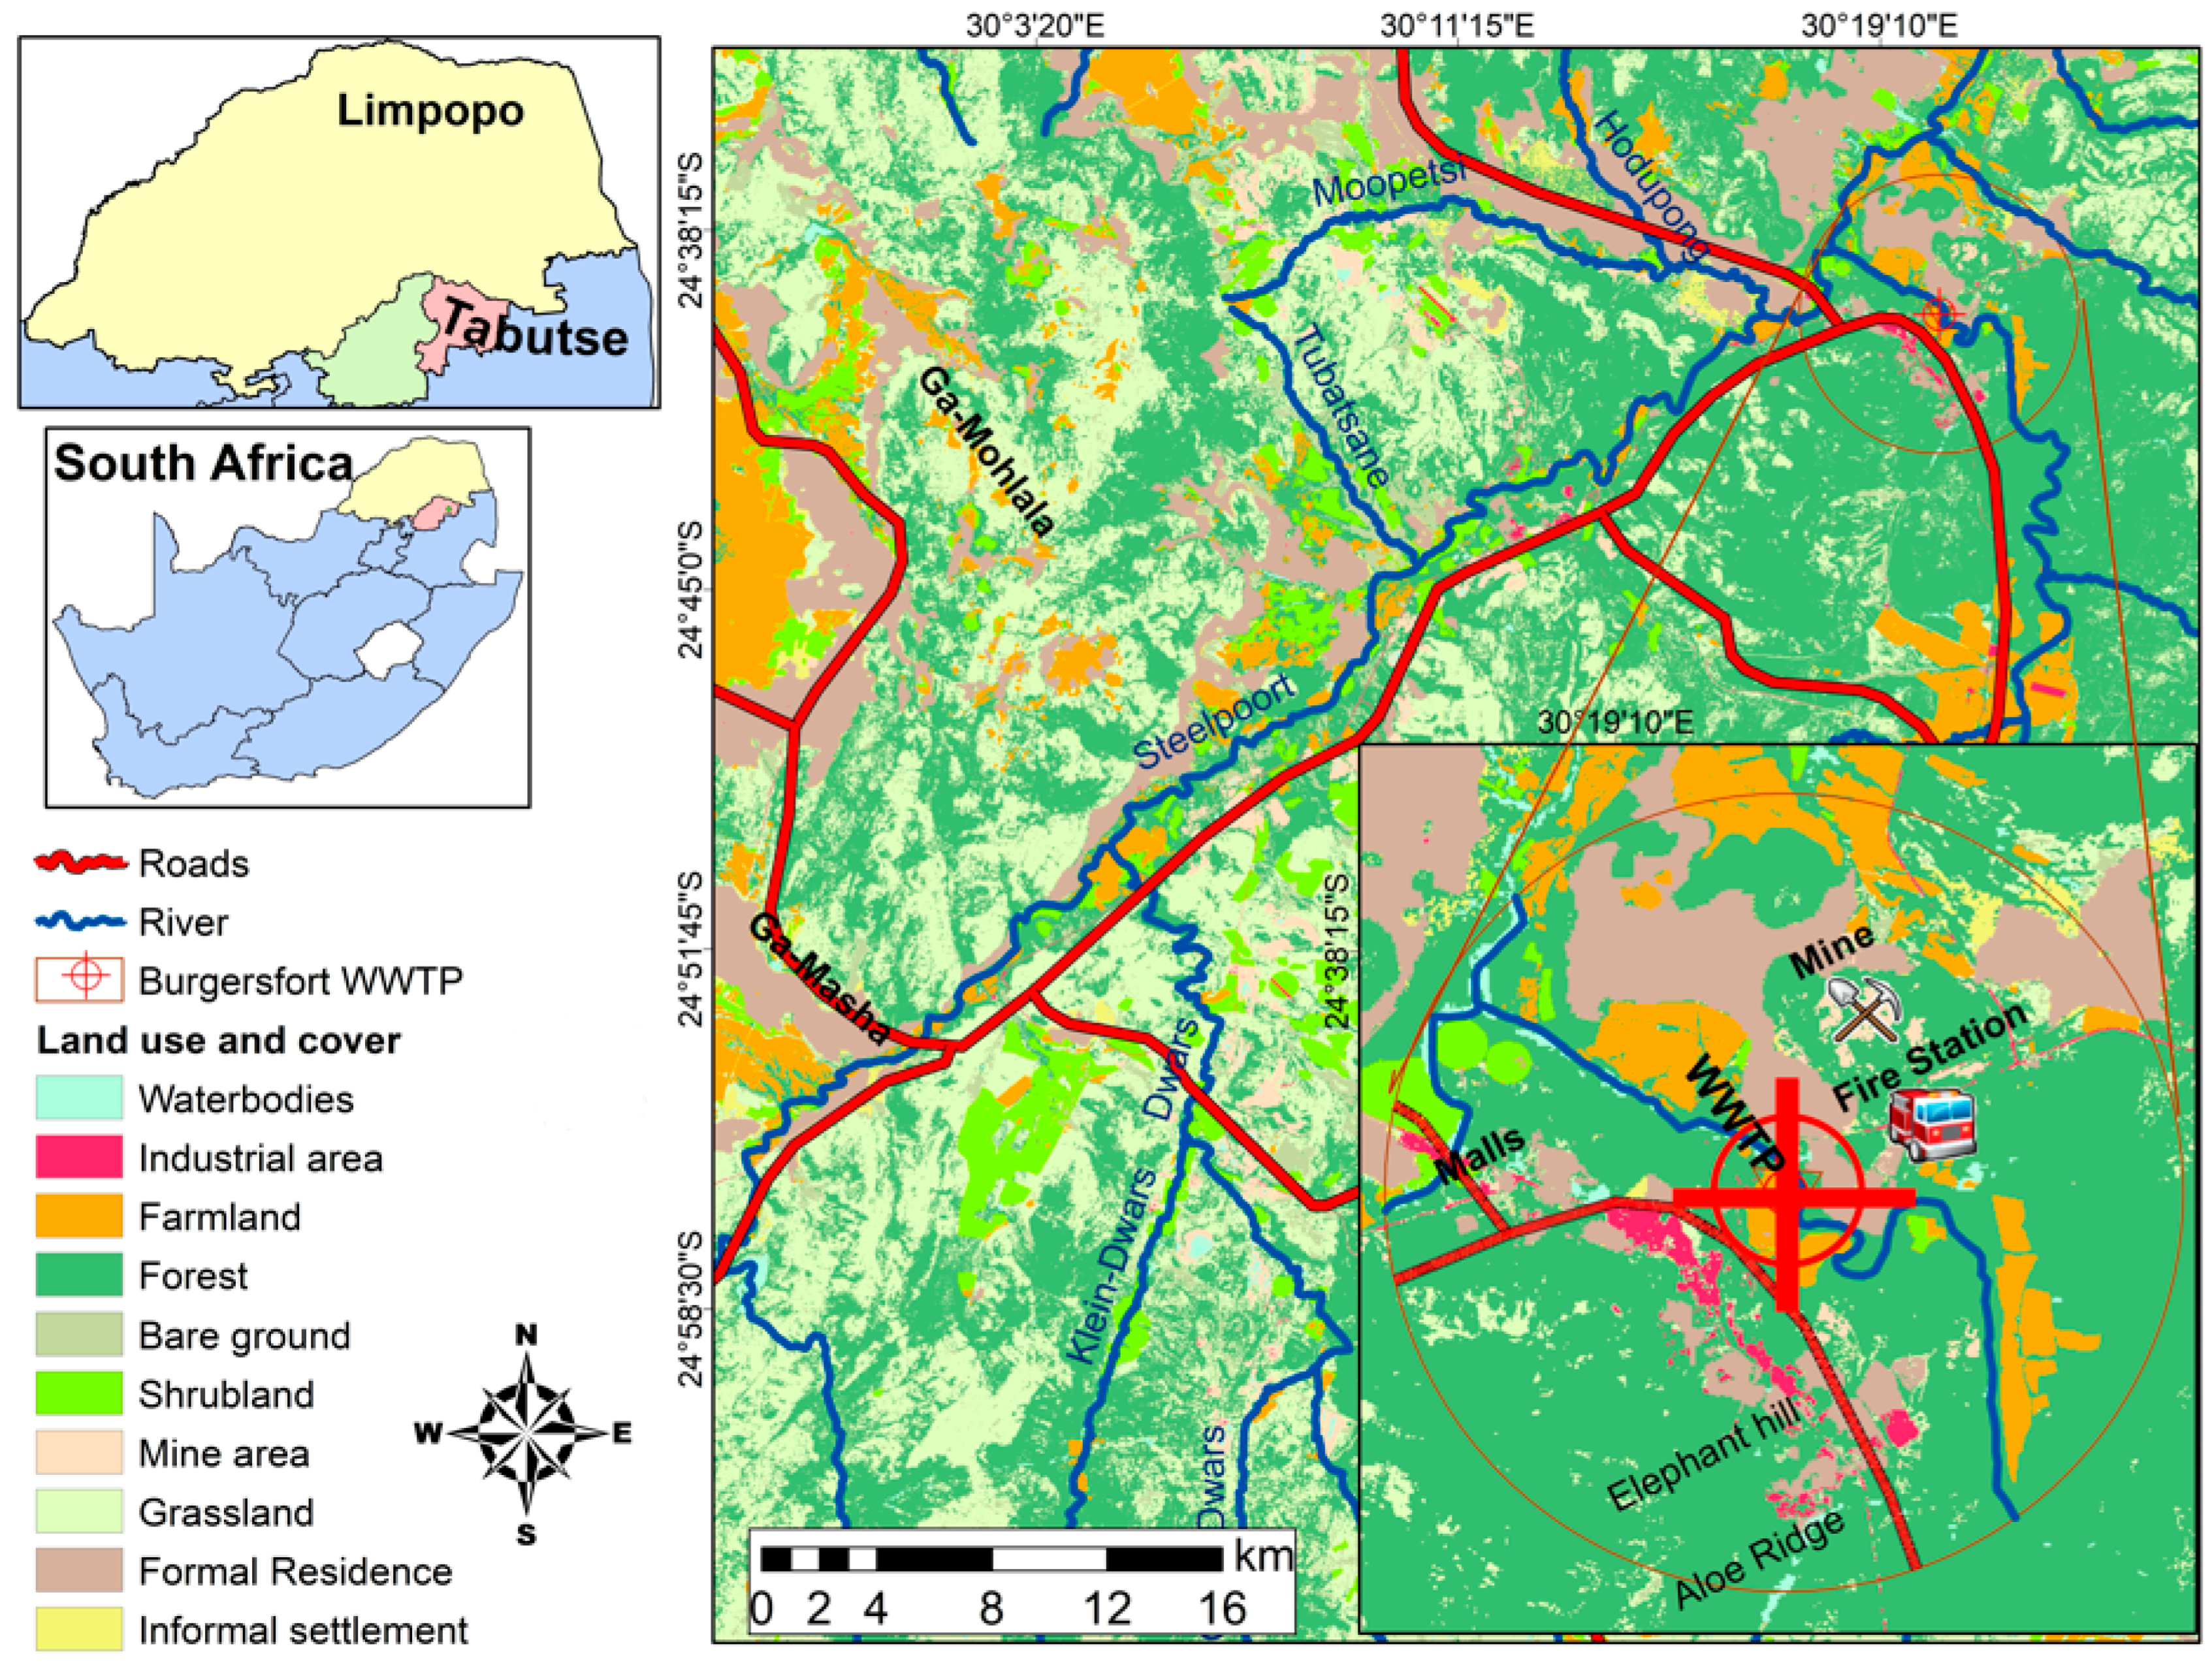
Figure 1. Aerial map of the Burgersfort wastewater treatment works and the surrounding land uses (Map by Owolabi S based on Google Maps data).
Water 16 00608 g001
Figure 2. Integrated wastewater resource recovery model (Authors’ own, 2023): Blue arrows represents water movement from one unit to the other; Brown arrows indicate movement of sludge from one unit to the other, while green arrows show movement of gases from one unit to the other.
Water 16 00608 g002
Figure 3. Ammonia sequential Mann–Kendall plot.
Water 16 00608 g003
Figure 4. Chemical oxygen demand sequential Mann–Kendall plot.
Water 16 00608 g004
Figure 5. Total coliforms sequential Mann–Kendall plot.
Water 16 00608 g005
Figure 6. Fecal coliform sequential Mann–Kendall plot.
Water 16 00608 g006
Figure 7. E. coli sequential Mann–Kendall plot.
Water 16 00608 g007
Table 1. Wastewater quality grades.
Wastewater Quality Index LevelWastewater Quality Rating
0–25Excellent
26–50Good
51–75Regular
76–100Bad
≥101Very bad
Note: Source: Ayoub and El-Morsy [26].
Table 2. Descriptive analysis and water quality guideline results.
Descriptive Analysis and Water Quality GuidelinesPhysical Water Quality VariablesChemical Water Quality VariablesMicrobiological Water Quality Variables
EC (μS/cm)pHTemperature (°C)Free Chlorine
(mg/L)
NO3
(mg/L)
−PO4−3 (mg/L)NH3 (mg/L)COD (mg/L)SO42− (mg/L)Cl− (mg/L)TC (MPN/100 mL)FC (MPN/100 mL)E. coli (MPN/100 mL)
EPA limits756–9<30N/A50N/A1250N/AN/A400N/A10
DWA limits70–1505.5–9.5N/A0.251510375N/AN/AN/A1000N/A
Burgersfort WRRF limits<1505.5–7.5N/A0.301510130N/AN/A100010001000
Minimum70.46.414.00.10.169.90.11491581.5111
Maximum219.58.027.12.1333.415948.5968767398.12.5 × 1062.4 × 1062.4 × 106
Mean 121.67.221.51.001.53.913.5250.251.685.61.8 × 1051.5 × 1051.4 × 105
Standard deviation24.20.32.70.44.76.312.9167.765.255.63.0 × 1052.3 × 1052.2 × 105
Kurtosis1.80.70.30.419.473.8−0.62.192.98.83.0 × 10572.375.6
Skewness0.8−0.3−0.7−0.24.27.50.61.48.62.16.47.27.5
Note: EPA = Environmental Protection Agency; DWA = Department of Water Affairs; MPN = most probable number; N/A = Not applicable; WRRF = Water Resource Recovery Facility.
Table 3. Principal component analysis results for physicochemical variables.
Rotated Component Matrix (a)
Component Factor
Variables1234
NH30.5809−0.31000.0658−0.2613
COD−0.24440.8044−0.0863−0.26969
EC0.11690.83190.17060.203424
NO3−0.1884−0.0671−0.00320.832893
−PO4−3−0.1258−0.02960.0073−0.38417
pH0.74260.04050.01300.370187
SO42−0.0167−0.13870.8218−0.01921
Temperature−0.7109−0.0217−0.02600.0155
Cl0.05110.22720.74080.002734
Table 4. Principal component analysis results for free chlorine and microbiological variables.
Rotated Component Matrix (a)
Component Factor
Variables1 2
Free chlorine01
TC0.8510.031
FC0.964−0.006
E. coli0.967−0.029
Table 5. Spearman’s rho nonparametric analysis results.
Spearman’s Rho Nonparametric AnalysisPhysical Water Quality VariablesChemical Water Quality VariablesMicrobiological Water Quality Variables
ECpHTempNH3CODClNO3SO42−−PO4−3Free ChlorineTCFCE. coli
ECCC10.09−0.05−0.090.330.350.140.090.21----
p value-0.270.500.234.7 × 10−55.1 × 10−60.100.220.006----
pHCC0.091−0.210.21−0.180.040.160.08−0.06----
p value0.27-0.0060.0070.030.650.060.340.45----
Tempera-tureCC−0.05−0.211−0.170.16−0.07−0.07−0.070.02----
p value0.500.006-0.040.050.390.360.400.82----
NH3CC−0.090.21−0.171−0.270.130.090.150.16----
p value0.230.0070.04-0.0010.1110.270.050.04----
CODCC0.33−0.180.16−0.2710.07−0.01−0.090.08----
p value4.7 × 10−50.030.050.001-0.340.870.280.34----
C l CC0.350.04−0.070.130.0710.340.380.15----
p value5.1 × 10−60.650.390.1110.34-3.1 × 1054.3 × 1070.06----
N O 3 CC0.140.16−0.070.09−0.010.3410.180.19----
p value0.100.060.360.270.873.1 × 105-0.030.02----
S O 4 2−CC0.180.08−0.070.15−0.090.380.1810.02----
p value0.030.340.400.050.284.3 × 1070.03-0.77----
P O 4 −3CC0.21−0.060.020.160.080.150.190.021----
p value0.0060.450.820.040.340.060.020.77-----
Free
chlorine
CC---------10.070.070.03
p value----------0.420.390.67
TCCC---------0.0710.870.87
p value---------0.42-4 × 10−462 × 10−46
FCCC---------0.070.8710.95
p value---------0.394 × 10−46-4 × 10−75
E. coliCC---------0.040.880.951
p value---------0.672 × 10−454 × 10−75-
Table 6. Weighted Arithmetic Water Quality Index Method assessment results.
VariablesWastewater Quality LevelWastewater Quality Index Rating
EC43.2Good
pH70Regular
Temperature 42.9Good
NH3260Very bad
COD4880Very bad
NO34.3Excellent
−PO4−310Excellent
Free chlorine5.7Excellent
TC35.505Very bad
FC29.900Very bad
E. coli28.100Very bad
Table 7. Integrated wastewater resource recovery model results.
VariablePrincipal Component Analysis Significant LoadingWWQI RatingResource
Recovery Technology
Recoverable Resource
EC>0.3GoodElectroplating—Ion exchangeMetals
pH>0.3ExcellentElectroplating—PhotocatalysisMetals
NH3>0.3Very badAir stripping and electrodialysisAmmonia gas
COD>0.3Very badSludge digestion
Sludge incineration
Polyhydroxyalkanoates extraction
Air stripping and electrodialysis
Sludge
Methane gas
Carbon monoxide gas
Bioplastics
Biofuel
NO3>0.3ExcellentChemical precipitation—Struvite precipitationNitrogen gas and phosphorus
SO42−>0.3N/AElectroplating–
Ion exchange then air stripping
Metals and sulphur
Cl>0.3N/AElectroplating—Photocatalysis/
Ion exchange
Chlorides/Salts
Metals
Disclaimer/Publisher’s Note: The statements, opinions and data contained in all publications are solely those of the individual author(s) and contributor(s) and not of MDPI and/or the editor(s). MDPI and/or the editor(s) disclaim responsibility for any injury to people or property resulting from any ideas, methods, instructions or products referred to in the content.