Article

Landscape Changes in the Bavarian Foothills since the 1960s and the Effects on Predicted Erosion Processes and Control

1
Blattfisch e.U., 4600 Wels, Austria
2
Fisheries Association Bavaria, 85764 Munich, Germany
3
Institute of Hydraulic Engineering and River Research, University of Natural Resources and Life Sciences, 1200 Vienna, Austria
*
Author to whom correspondence should be addressed.
Water 2024, 16(3), 417; https://doi.org/10.3390/w16030417
Submission received: 12 December 2023 / Revised: 8 January 2024 / Accepted: 24 January 2024 / Published: 27 January 2024

Abstract

:
Socio-economic changes, technical progress, and a variety of funding and planning interventions have significantly changed land use in Central Europe since World War II. The aim of this study was to illustrate these changes in the Alpine foothills in Bavaria and to calculate the effects of these changes on soil erosion. This was performed in a two-step procedure: a GIS-based orthophoto evaluation and a cause–effect model using the revised universal soil loss equation (RUSLE). Key findings were that field sizes (+370%) and lengths (+35%) have changed significantly since the 1960s. Moreover, the uninterrupted runoff paths on arable land have increased in length by about 70% on average, with corresponding effects on soil erosion. The discussion shows that the possibilities for erosion control measures in the field are already severely limited due to the effects of the climate crisis and structural changes in agriculture. Furthermore, the often-assumed rule, according to which only a small part of the arable land causes a large share of the eroded material, was largely confirmed. The findings underline the overlapping impacts of land use change and climate crisis on agriculture erosions rates with the need for integrative and adaptive management.

1. Introduction

Soil erosion is a wide-ranging problem with many implications for human development. For instance, soil erosion was associated with the decline of human cultures in the past, assumedly due to the combination of land use changes and climatic processes [1,2,3]. In particular, the intensification of crop farming, the sealing of surfaces, and large open areas due to other uses (e.g., construction, clearcutting in forests) have contributed to this. In addition to the increased sources of erosion, the network through which eroded material enters water bodies directly has also become considerably denser.
Today, we find ourselves in an era where the intensification of land use has reached unprecedented levels in anthropogenically used areas all over the globe. The impacts of climate change (e.g., type and intensity of precipitation, more frequent wildfires [4,5]) alter vegetation cover and types, soil conditions, and parameters, like the erosivity of rain and flood events.
All these altered conditions hence have increased, accordingly superimposing the existing problems of land use changes [6,7,8]. Thus, a further increase in soil erosion caused by the climate crisis and other anthropogenic impacts seems likely [6,7,9].
In addition to its effects on agriculture, landscapes, and consequently, human development, soil erosion has also a significant impact on water bodies. In addition to factors such as slope, discharge, water temperature, and structural features, life in riverine ecosystems is strongly influenced by sediment conditions [10,11,12]. Sediment transport, deposited bedload, and suspended load sediments shape the riverbed, provide structures, and thus determine the presence or absence of habitats for different fish species [12,13,14] and other aquatic organisms [15,16,17,18]. There is a common agreement that in addition to the status of the water body, the surrounding land use has a major influence on the fish species composition [19]. Both nutrient and fine sediment influxes are stressors for aquatic ecosystems [11,20,21,22]. Here, some studies also suggest that the physical effects of fine sediment on the habitat quality even exceed the trophic effects of nutrient alteration [17].
In the past 100 years in particular, humans have intervened very strongly in water bodies, floodplains, and their catchments, thus greatly changing the sediment supply conditions [11,21,22,23]. This, among other interventions, is responsible for an increased risk of not achieving the requirements of the European Union Water Framework Directive (WFD). It should be noted that this seems evident from an ecological point of view, but a legal implementation of the sediment issue in national laws in Austria and Germany is still missing. This major shortcoming is due to the fact that the aims of the Water Framework Directive are very much focused on the status of indicator organisms. The underlying hydro-morphological and sedimentological processes are just considered as underlying/supporting conditions. Methods for estimating and calculating processes of erosion, however, are available and used in engineering practice. One basic tool that can help quantify and visualize the processes of soil erosion is, e.g., the Universal Soil Loss Equation (RUSLE) [24,25,26,27]. Nevertheless, a critical discussion in terms of implementation into integrative river management, supporting improved processes understanding for the WFD, is still largely missing.
Restoration efforts can also be severely impeded by deficits in the sediment regime (e.g., siltation, bedload deficits, etc.) due to fine sediment accumulation based on reduced bottom shear stress in case of river widenings or a reduced slope by increasing the river length (e.g., support meander developments) [28,29]. However, human-induced increases in fine sediment loads play a major role in aquatic ecosystems and in interrelated pressures of anthropogenic uses like inland fisheries, water supply, or flood protection [30,31]. In most studies, particles smaller than 2 mm are regarded as “fine sediment” [31,32]. Hence, the grain fractions of fine sand, silt, and clay are included in the technical definition of fine sediments. Nevertheless, particles < 0.63 mm are of particular importance, especially with regard to biogeochemical processes and properties. Many nutrients and pollutants adhere to this fraction and are transported with it [18,31].
A variety of causes and their mutual effects were identified as possible reasons for increased fine sediment inputs in a lot of watercourses in countries of Central Europe [33]. The main causes are (i) increased erosive processes (due to changes in land use, changes in precipitation, etc.), (ii) dense networks of entry paths (e.g., drainages, roadside ditches, etc.) [34], (iii) changes in both hydrology and river morphology that lead to areas of higher siltation, and (iv) disruption of the river–riparian linkage by river bed incision and dykes and thus less frequent flooding events and reduced sediment deposition in the wetlands. The combination of increased inputs of fines, the lower bed load supply [12], increased transport capacity for bed load in terms of floodings [35], and unfavorable morphological conditions, which increase the deposition of fine material in the riverbed and a lack of natural deposition in riparian areas, is amplified by the complex impacts of the climate crisis [6,36]. Although many studies are published referring to the impact of bed load supply and bed load transport changes on the aquatic environment [12,31], there is only scattered information on how land use and land use change affect fine sediment supply in specific regions in Central Europe with consequences on river systems from a process point of view.
Despite the scientific evidence of the problems associated with soil erosion, in Central Europe, it is often just seen as a major problem in other regions of the world. The latest readjustment of European and national agricultural support programs with regard to the topic also shows a large discrepancy in the scope of the expected changes and the necessary mitigation measures.
Thus, the objective of this study is to present a systematic analysis of (i) the changes in land use, (ii) the altered parcel structure, and flow paths. Based on this, the RUSLE will be used to show (iii) how these large-scale structural changes, together with climatic changes, affect soil erosion in an integrative view of the driving processes. Furthermore, the subsequent increasing limitation of the scope of action in agricultural practice is discussed. This is an attempt to depict the ongoing changes in land use and related alterations in erosion processes in areas with evident fine sediment problems in the watercourse. Mainly, this study is based on field mapping and GIS analysis of soil erosion under different scenarios.

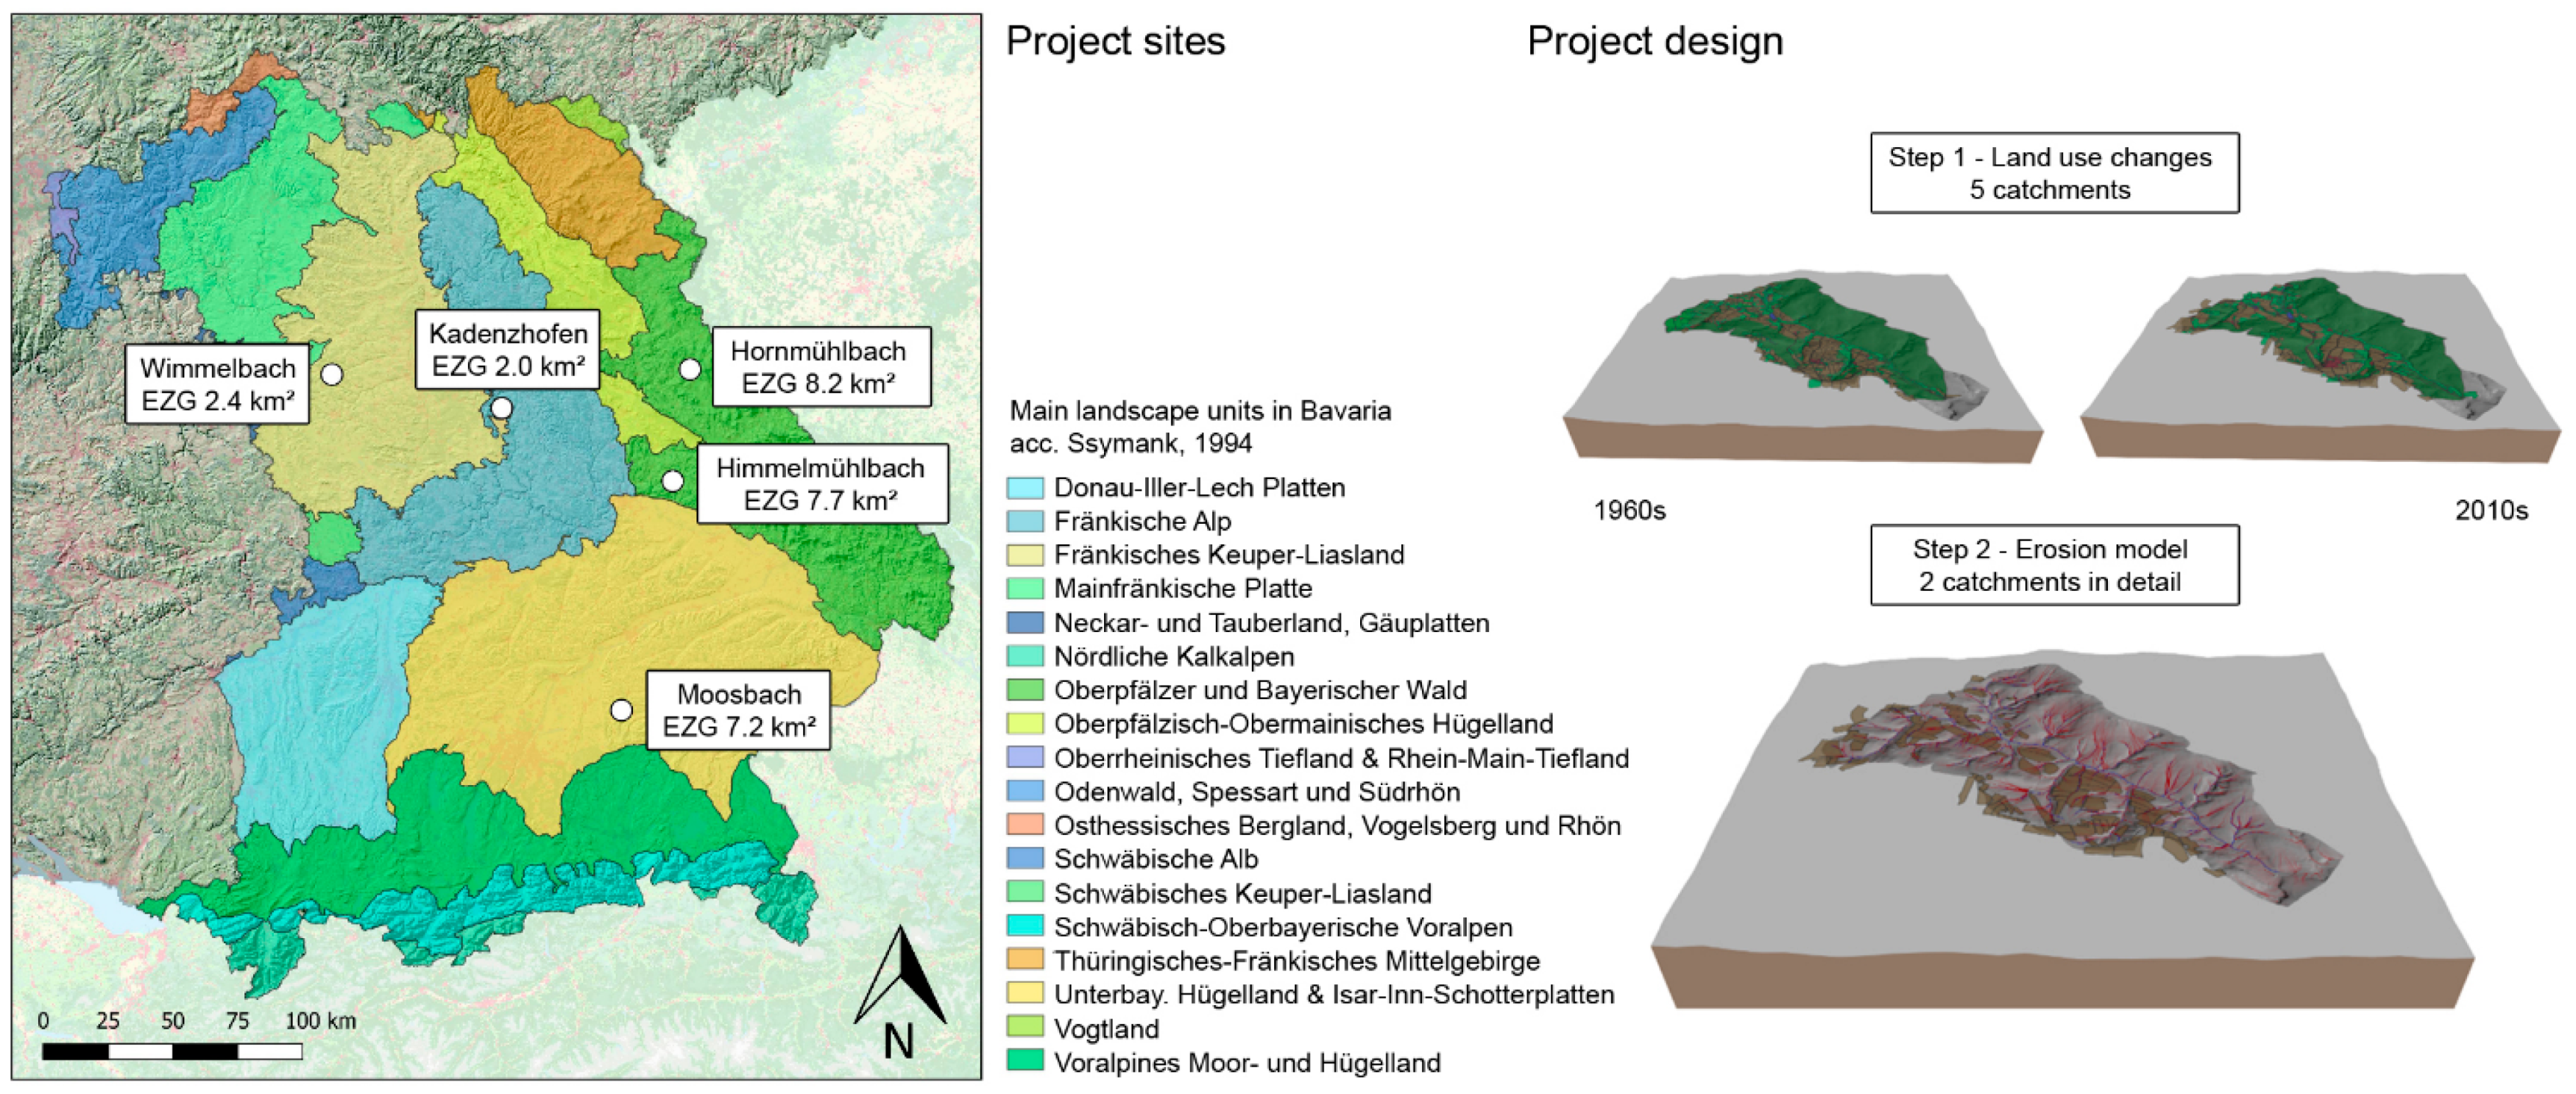
2. Materials and Methods

The change in landscape structures in the Bavarian Alpine foothills is elaborated on and presented by the example of five project areas that are distributed widely across the intensively used cultural land in Bavaria in order to cover different landscape units and different geological conditions (Figure 1). The areas were selected rather randomly. There were specifications from the Bavarian Fisheries Association regarding the regions known to have fine sediment problems in its waters, and the catchment areas had to be between 1 and 10 km2 in size, as this has proven to be a good scale in the past for depicting the changes [33,37]. Furthermore, old aerial photographs from the post-war period had to be available. The selected catchments cover very different landscape types that are distinguished in Bavaria according to [38]. The geological conditions, slope gradients, and precipitation data represent the range of possible conditions in the Bavarian Alpine foothills and other similar parts of Central Europe. The resulting land use coverage and soil erosion rates were related to land use distributions and calculations provided by the state offices [39,40,41] and also, in this case, consistent assumptions resulted.

2.1. Land Use Changes between the 1960s and 2010s

The basis for the analysis was the digitization of aerial photographs from the 1960s (aerial surveys by the American allies after World War II from the years 1963 to 1968) and from the 2010s (2016–2018) in QGIS 2.18 (www.qgis.org, CC BY-SA 3.0) by the project team (Figure 1 and Figure 2). These were, at the time of this study, the earliest and most recent aerial photographs available that allowed a distinction of land uses. The landscape changes observed within those five decades, as well as the changes in the resulting uninterrupted runoff paths on arable land, were evaluated (for details, see Section 2.2). The land use was digitized for both time steps and assigned to land use categories such as forestry, agriculture subdivided into grassland and arable land or not assignable, settlements, roads, and paths, as well as to “green” landscape elements, e.g., hedges. Moreover, the quality of the orthophotos allowed differentiation of the farm tracks and roads in terms of their sealing.

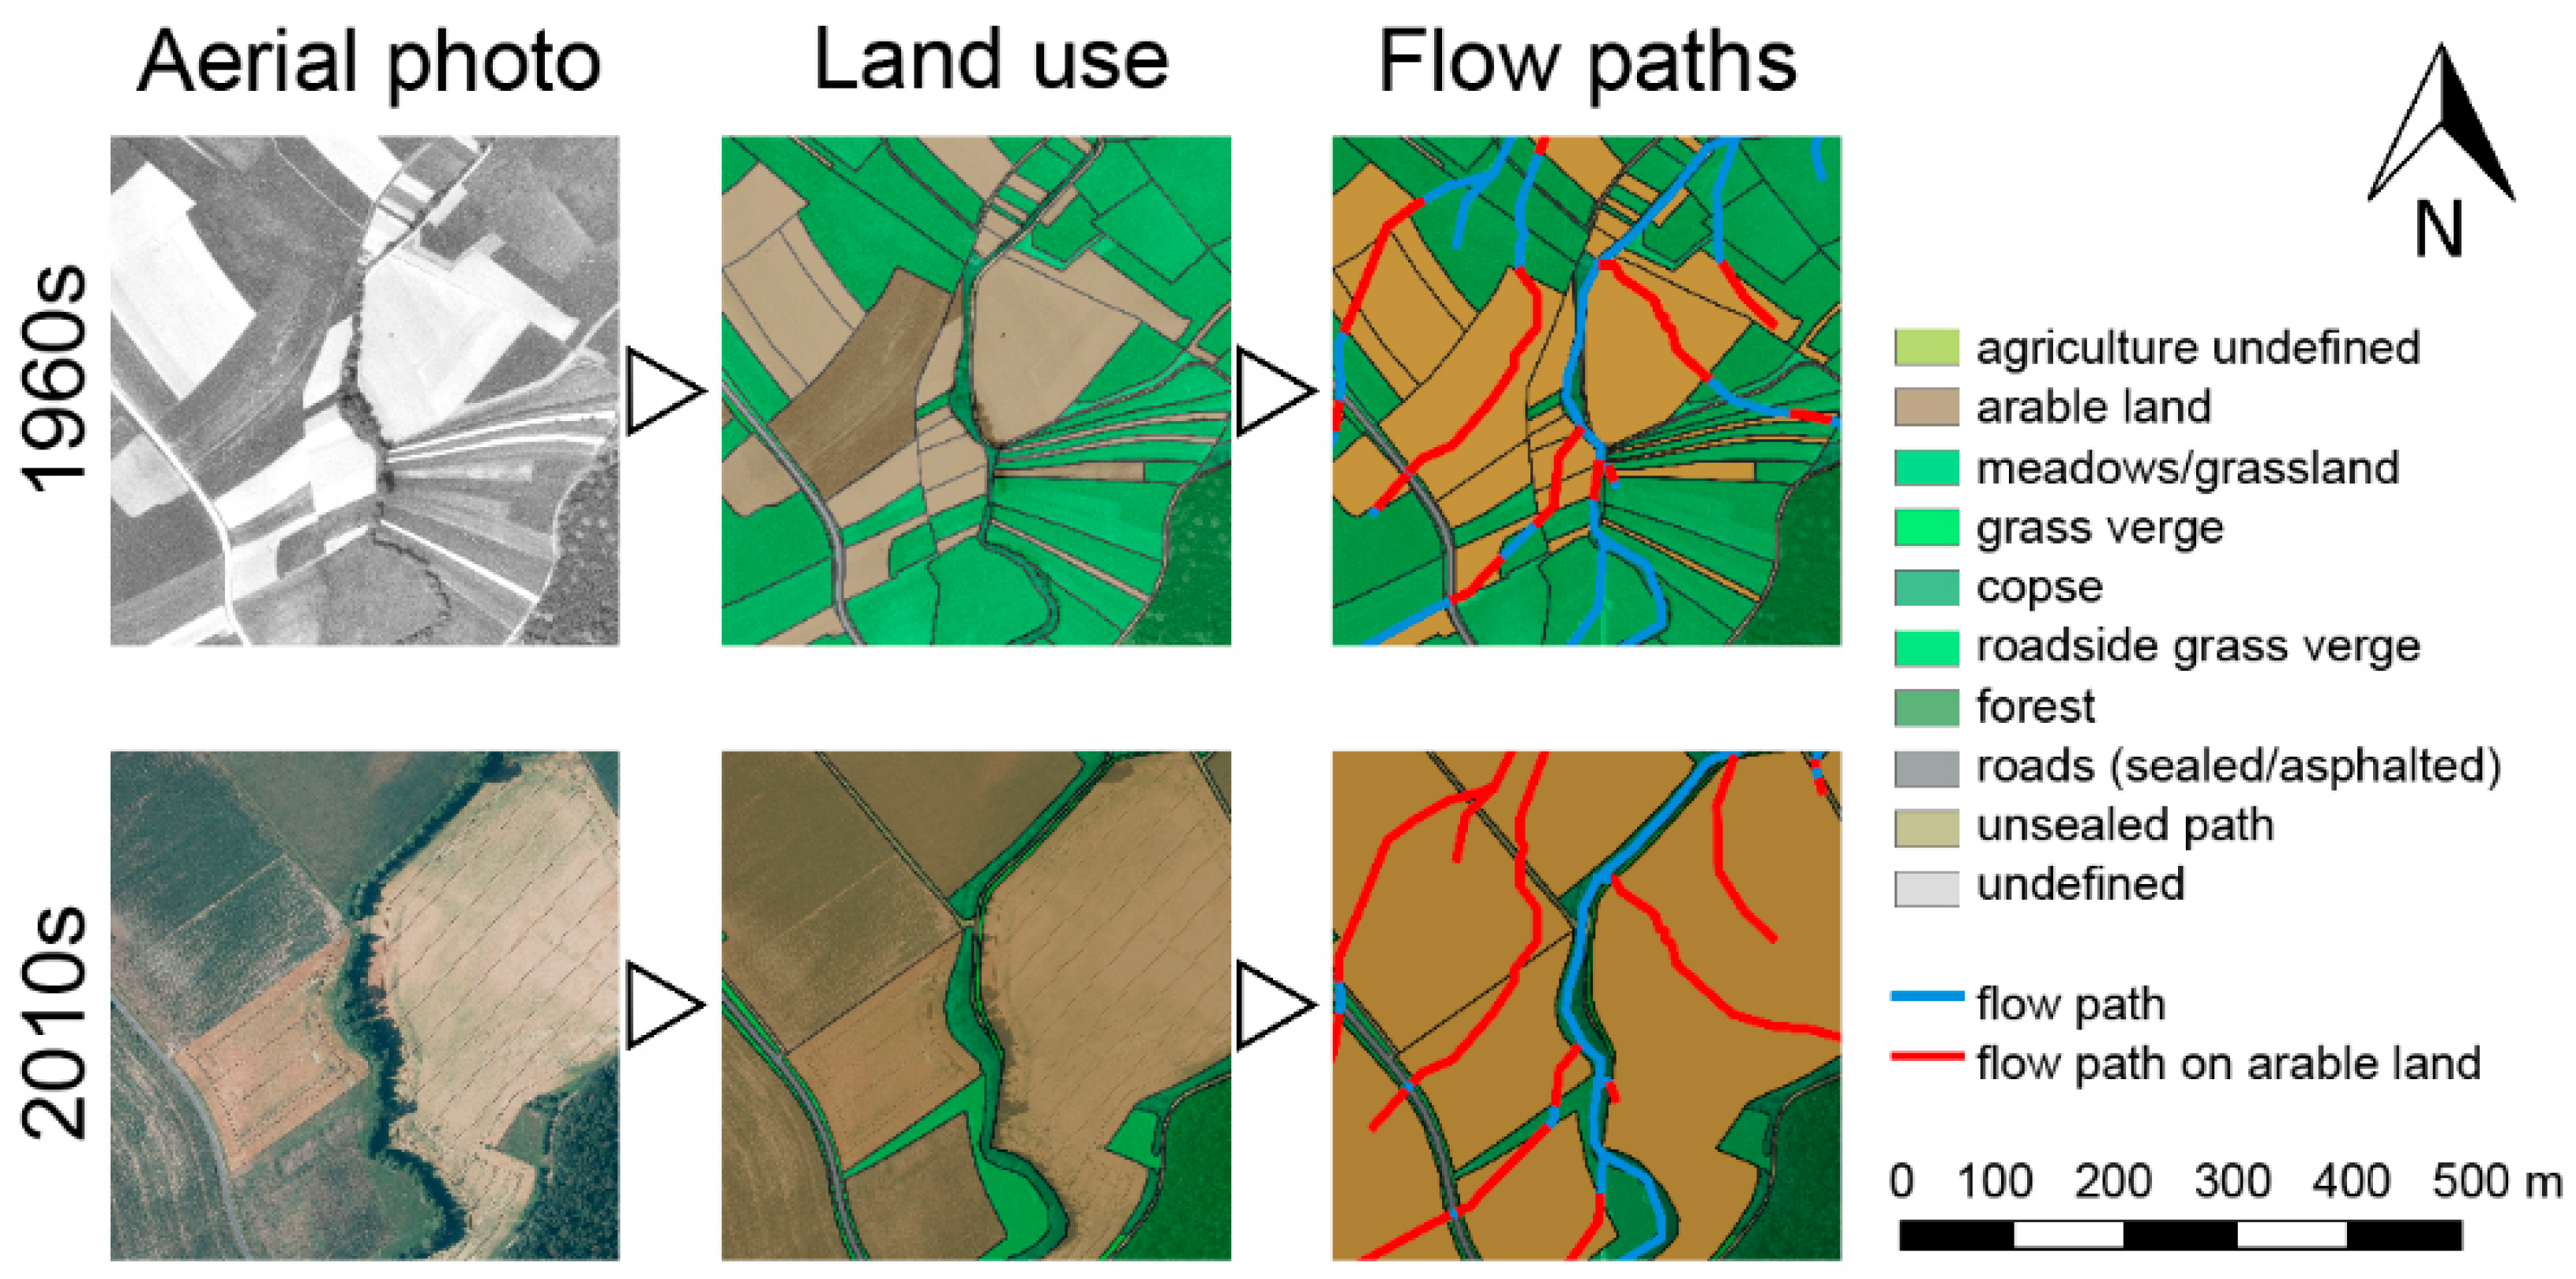
2.2. Development of Parcel Structures and Flow Paths on Arable Land

In addition to land use, the shaping of the parcels in terms of geometry was also evaluated (e.g., area, longest extension). A parcel in this context means an area occupied by the same land use, more precisely by the same crop for arable land. This is intended to show how the so-called land consolidation procedures have affected the landscape structure in the last decades. The runoff paths were calculated using the digital elevation model (1 × 1 m grid) and the r.flow tool (available in QGIS 2.18). The initiation of surface runoff was visually validated in the orthophotos via detectable erosion phenomena (e.g., erosion rills) (Figure 2). The result was intersected with the arable land polygons of the two time steps.

2.3. Effects of Structural Landscape Alterations and Climatic Changes on Soil Erosion

In the second step (Figure 1), erosion rates were calculated on the basis of the Revised Universal Soil Loss Equation (RUSLE [24,25,26,27]). The result of the RUSLE is a long-term mean soil loss in tons per hectare and year (A, t ha−1 a−1). The formula reads as follows:
A = R × K × C × (LS) × P
where the calculation is based on the rainfall–runoff erosivity factor (R) (MJ mm ha−1 h−1 yr−1), the soil erodibility factor (K) (t h MJ−1 mm−1), the cover management factor (C), the slope length factor (L), the slope gradient factor (S), and the erosion control practice factor (P). The factors L, S, C, and P are dimensionless.
The input parameters of the RUSLE are determined by the geomorphological conditions, soil composition, and cultivation, and must be determined individually.
For the R-factor, official data from the erosion atlas of Bavaria [42] were available and are presented in Table 1. Generally, precipitation erosivity is assumed to be constant over longer periods of time. The factor, however, has increased considerably between the time steps throughout Germany (+42% to +67% in the project catchments). According to the Bavarian State Research Center for Agriculture, these adaptions were necessary due to manifest alterations in the course of the climate change [9,42].
Furthermore, the Erosion Atlas of Bavaria [42] provides the soil erodibility (K) in the catchment areas.
With regard to cultivation, representative crop rotations and erosion protection measures on site, e.g., intercropping, the cultivation factor (C) can be determined via the LfL website: ABAG interaktiv [43]. The factor was calculated individually for the specific questions and scenarios shown below (see also Table 2).
The slope length (L) and slope gradient (S) result from the topography of the catchment area. Using the formula of Moore and Wilson (1992) [44], the summarized LS factor can be calculated for each 1 m × 1 m cell from the digital terrain model. The formula for calculating the LS factor is:
L S = A s 22.13 m sin θ 0.0896 n
where As is the runoff accumulation (m), θ is the slope gradient (rad), and m (0.4–0.56) and n (1.2–1.3) are the exponents.
The erosion protection factor (P) was set to 1.0, and thus all simulations were calculated without specific erosion protection measures (e.g., terracing) that go beyond the management factors included in the C-factor.
First, a generalized approach was used to illustrate the background differences between the individual project areas and the climatic changes. For this, the effects of changes in landscape structures on soil loss, considering the altered rain erosivity in recent decades due to climate change [42] (see Table 1), were exemplified by means of a generalized and representative maize field in conventional cultivation on a 5° sloping surface (8.8%). The value was used because areas with such a slope are often still cultivated with row crops without further erosion control measures. To ensure comparability, the C-factor (cover and cultivation) and the P-factor (soil protection)—those that are normally influenced by the farmer’s work—were assigned the same value for all catchments. Thus, only the climatic changes and the landscape structure changes are reflected in the calculations, at constant cultivation. The climatic and geological conditions were adapted to the five project areas (according to the official Bavarian datasets [42]), and the change between the two time steps due to the change in runoff length/effective slope length was calculated from the data.
In a further step, the RUSLE model was applied to the whole area of two catchments, the Hornmühlbach and the Moosbach. The required input parameters for both time steps were derived from actual land use and topography (LS-factor) or taken from provided maps (R-factor, K-factor) and finally combined as raster-based spatial information in QGIS and calculated individually for each cell using the raster calculator (Figure 3). Four scenarios were developed for the C-factor (cover and management factor) in order to reflect the changes in land use (Table 2). While the first two scenarios aim at depicting the conditions in the 1960s and 2010s realistically, the 2020+ and 2020++ scenarios predict the effects of erosion control measures of varying effectiveness on the fields. The 2020+ scenario includes measures that are relatively often used nowadays, such as intercropping (cultivation of plants that maintain and strengthen soil fertility between actual crops when the soil would otherwise be without cover) and undersowing (cultivation of plants that maintain and strengthen soil fertility below maize and other row crops), with proportions of row crops remaining high. The 2020++ scenario considers far-reaching changes in agricultural management, such as no-tillage or a significant reduction in row crops, such as maize. The resulting C-factors were calculated by means of the tool provided by the Bavarian Regional Office for Agriculture [43] (see Table 2).

3. Results

3.1. Land Use Changes between the 1960s and 2010s

In all investigated areas (n = 5), there was a slight overall decrease in the share of agricultural land from 57.8% to 54.7% (Table 3). Within the agricultural areas, however, the share of grassland dropped markedly from 49.4% to 34.9%, whereas the shares of arable land increased by two-thirds. The majority of the remaining total area is related to forests, which show a slight increase, and anthropogenically sealed land (infrastructure and settlements). Settlement areas, in particular, more than doubled (from 1.0% to 2.1%). For infrastructure, sealing also increased clearly, as many farm roads had been asphalted. While in the past, about half of the paths and roads were unsealed farm tracks, such tracks account for only about one-third of today’s infrastructure network. On the whole, the total area of sealed surfaces doubled across all five catchments.

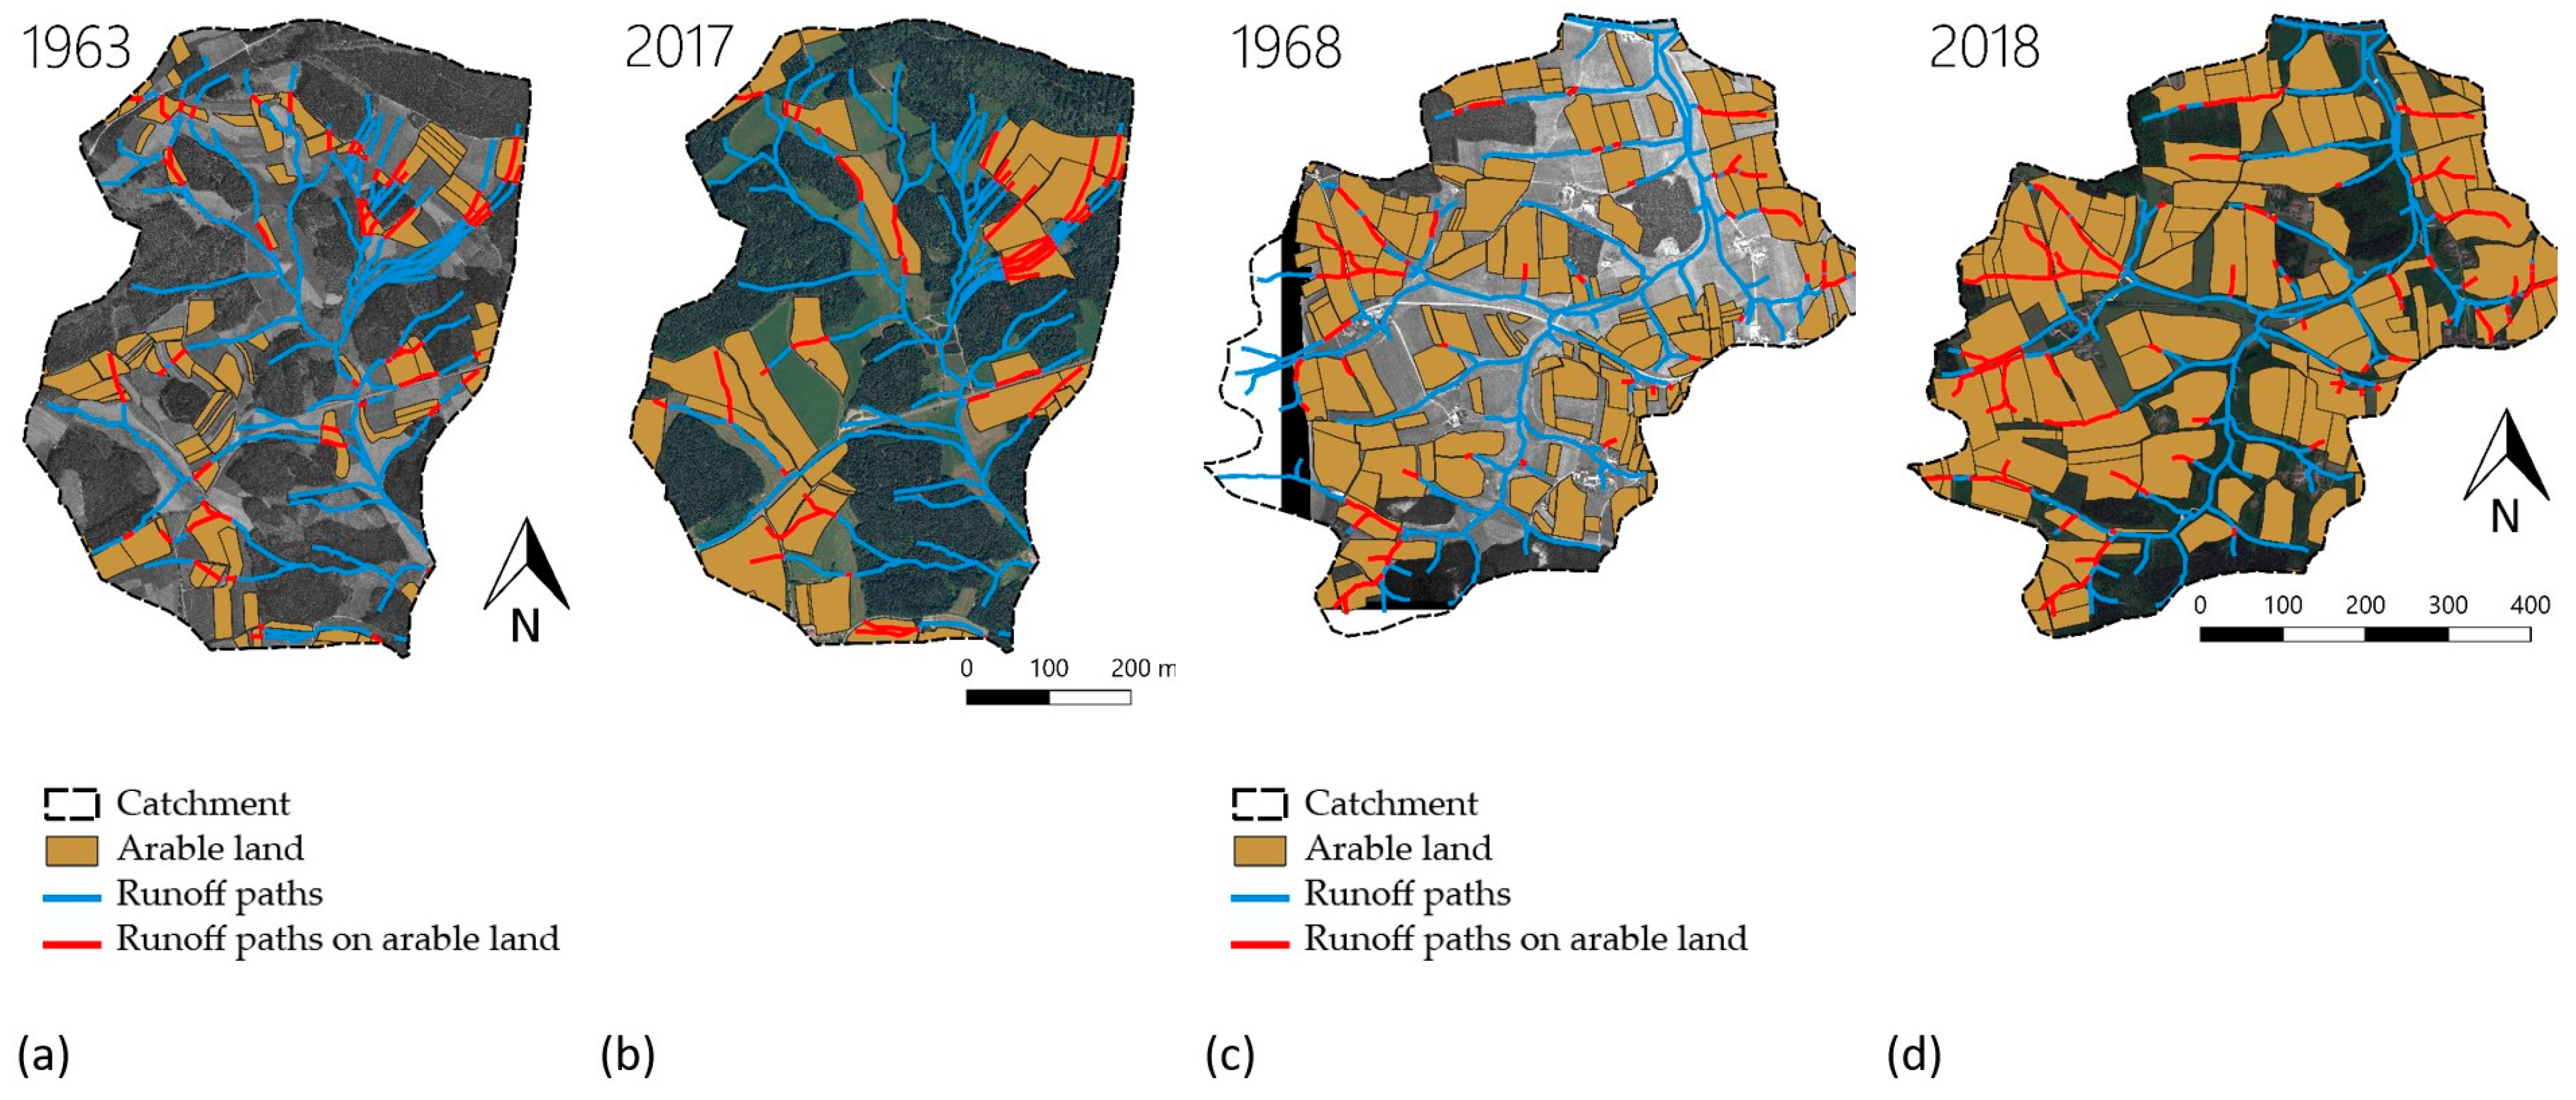
3.2. Development of Parcel Structures and Flow Paths on Arable Land

Apart from the proportion of land use in the catchment areas, the structure of agricultural land has also changed over the past 50 to 60 years. The following parameters showed a clear alteration (percentages related to the median values from the two time steps across all five areas):
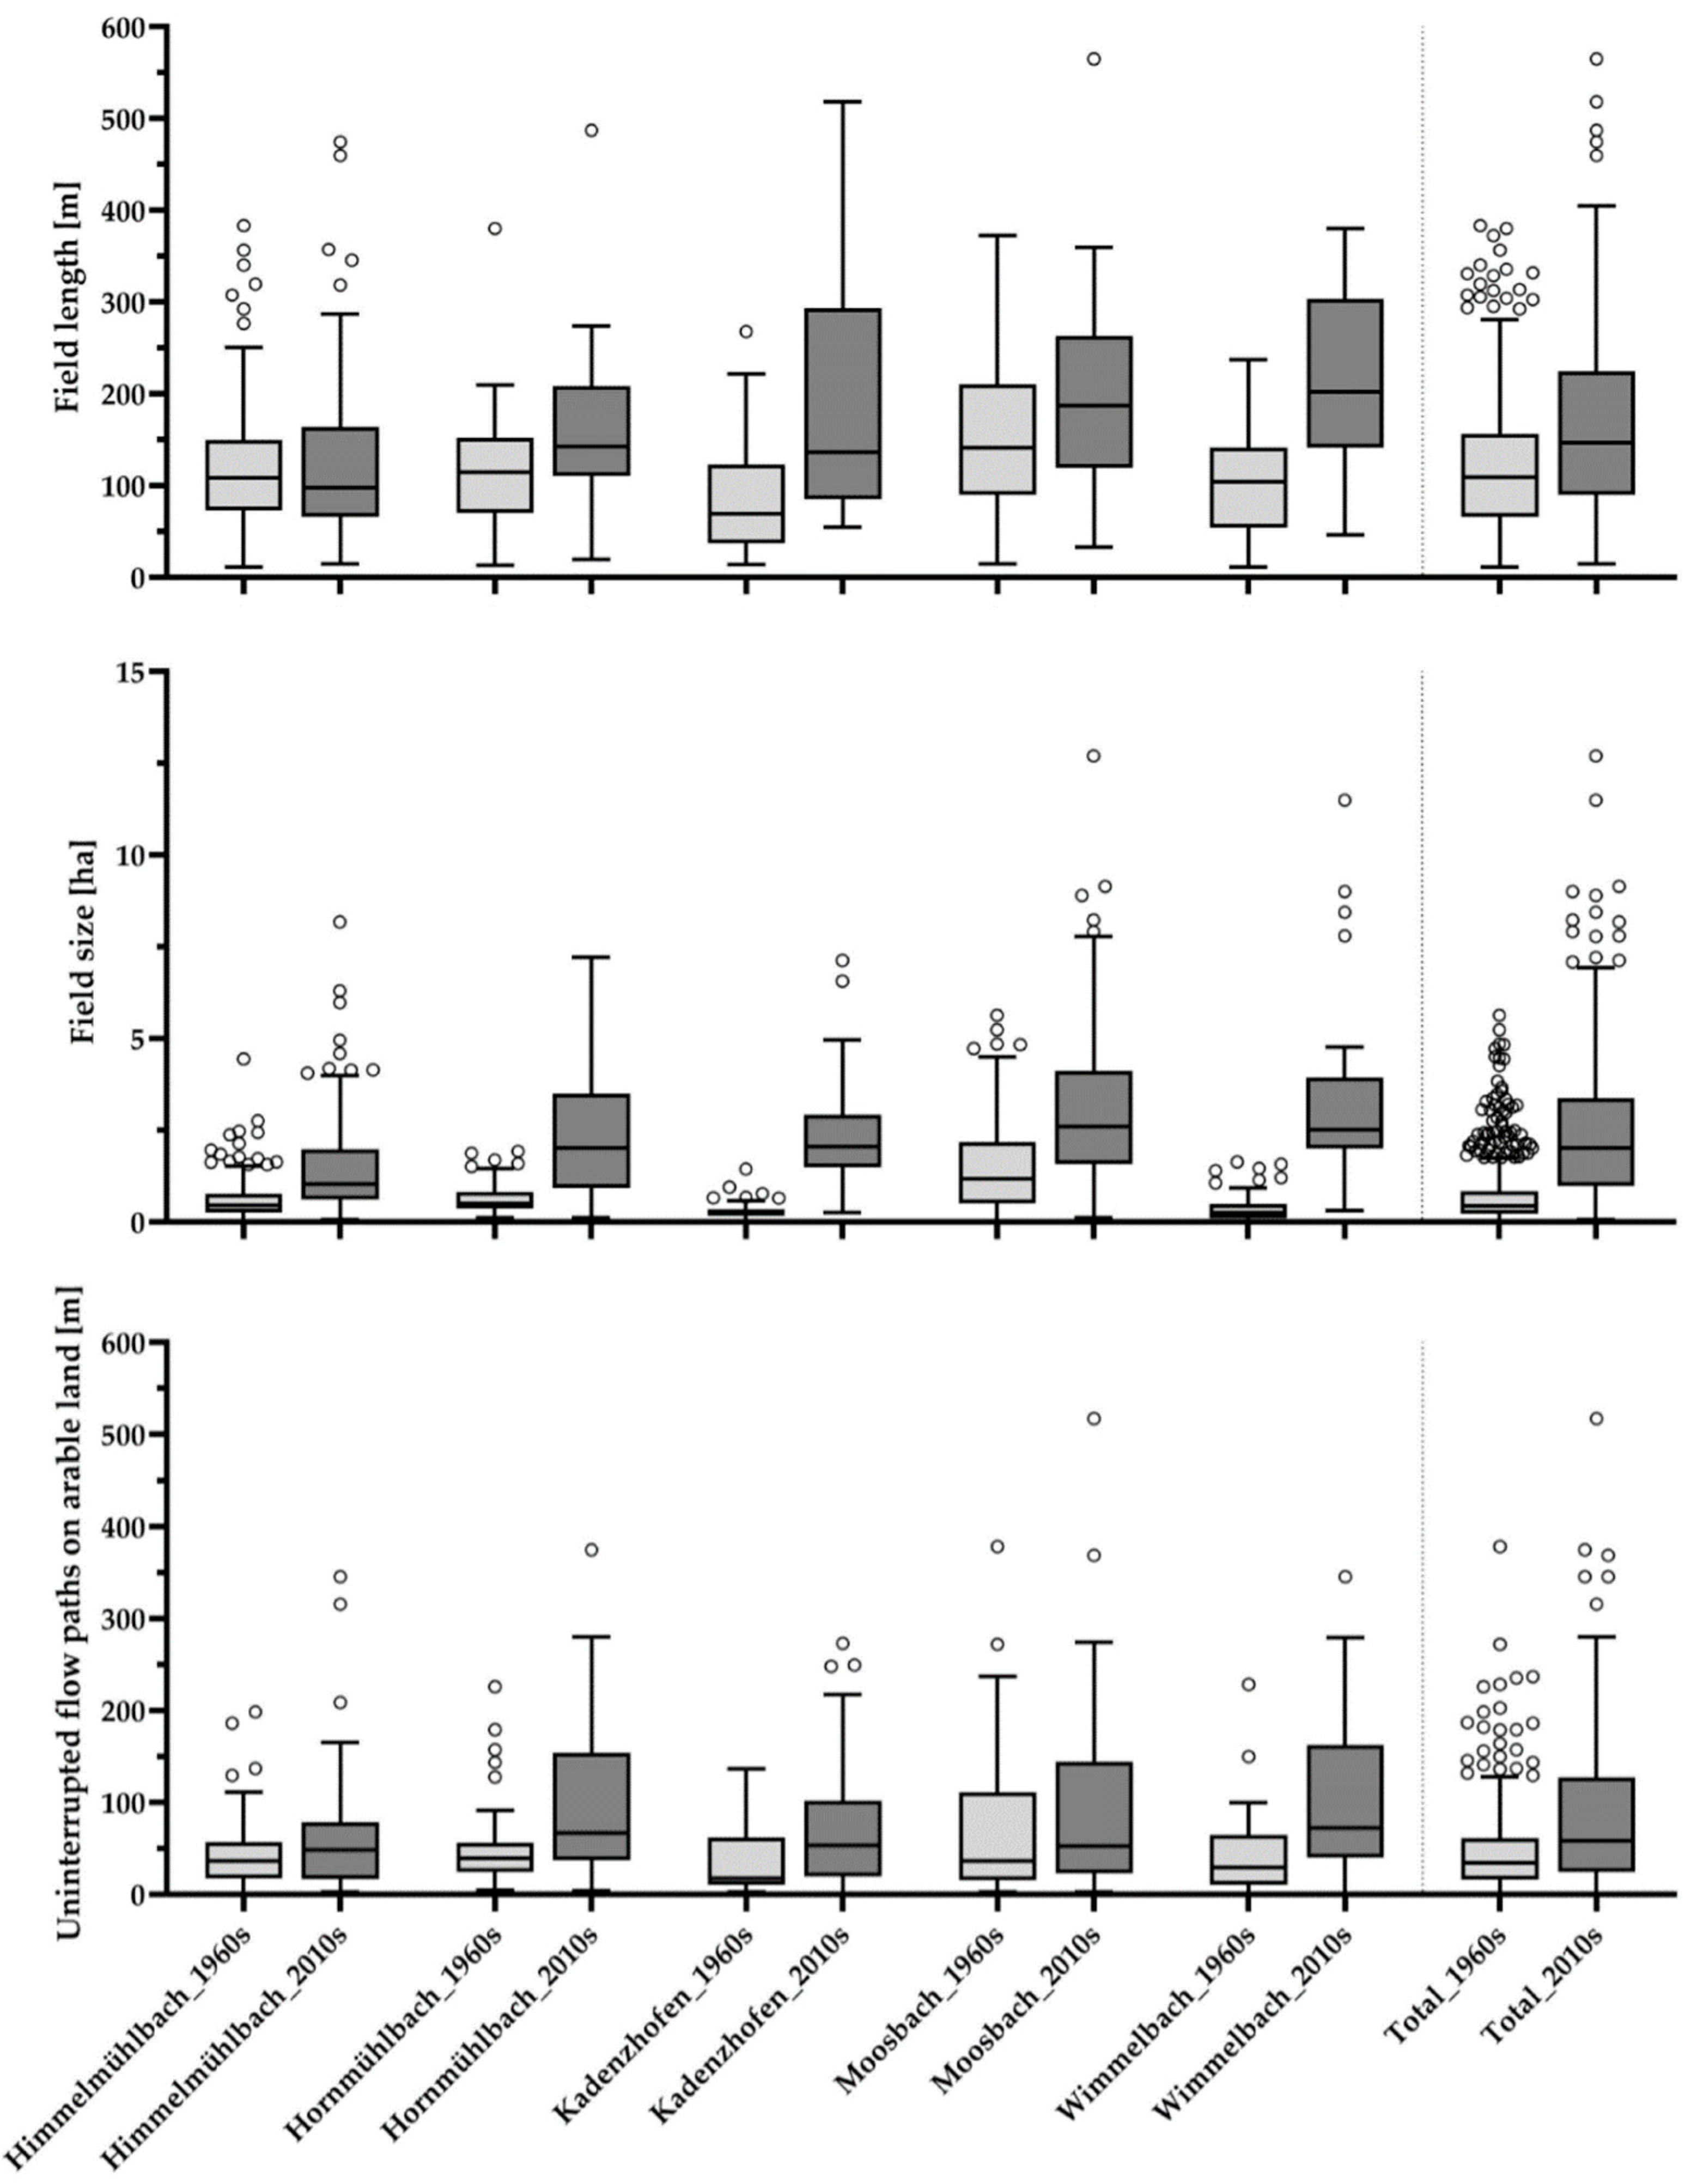
  • The median length of the fields increased by more than one-third (+35%). Figure 3 shows this increase in the median from 109 m in the 1960s to 147 m in the 2010s. The maximum (without outliers) was 280 m in the 1960s and increased to 404 m within five decades. The median field length decreased slightly from 108 m to 98 m in the Hornmühlbach catchment, with maximum values having increased all the same.
  • Regarding the total area of the single fields, there was almost a fourfold increase (+370% related to the median) (see Figure 4). The median of the total area for all catchments increased from 0.43 ha in the 1960s to 2.01 ha in the current period. Similarly, the interquartile range (the middle 50% of values) increased from 0.22 ha to 0.83 ha in the 1960s to 0.98 ha to 3.37 ha in the 2010s.
  • The median length of uninterrupted runoff paths on arable land shown in Figure 4 increased from 34 m to 58 m over the past 60 years. (+70%). The longest uninterrupted runoff path on arable land was found in the catchment area of the Moosbach. In 1968, it was 378 m long and extended to a current length of 515 m. What is more, the maximum values have experienced major increases as well.

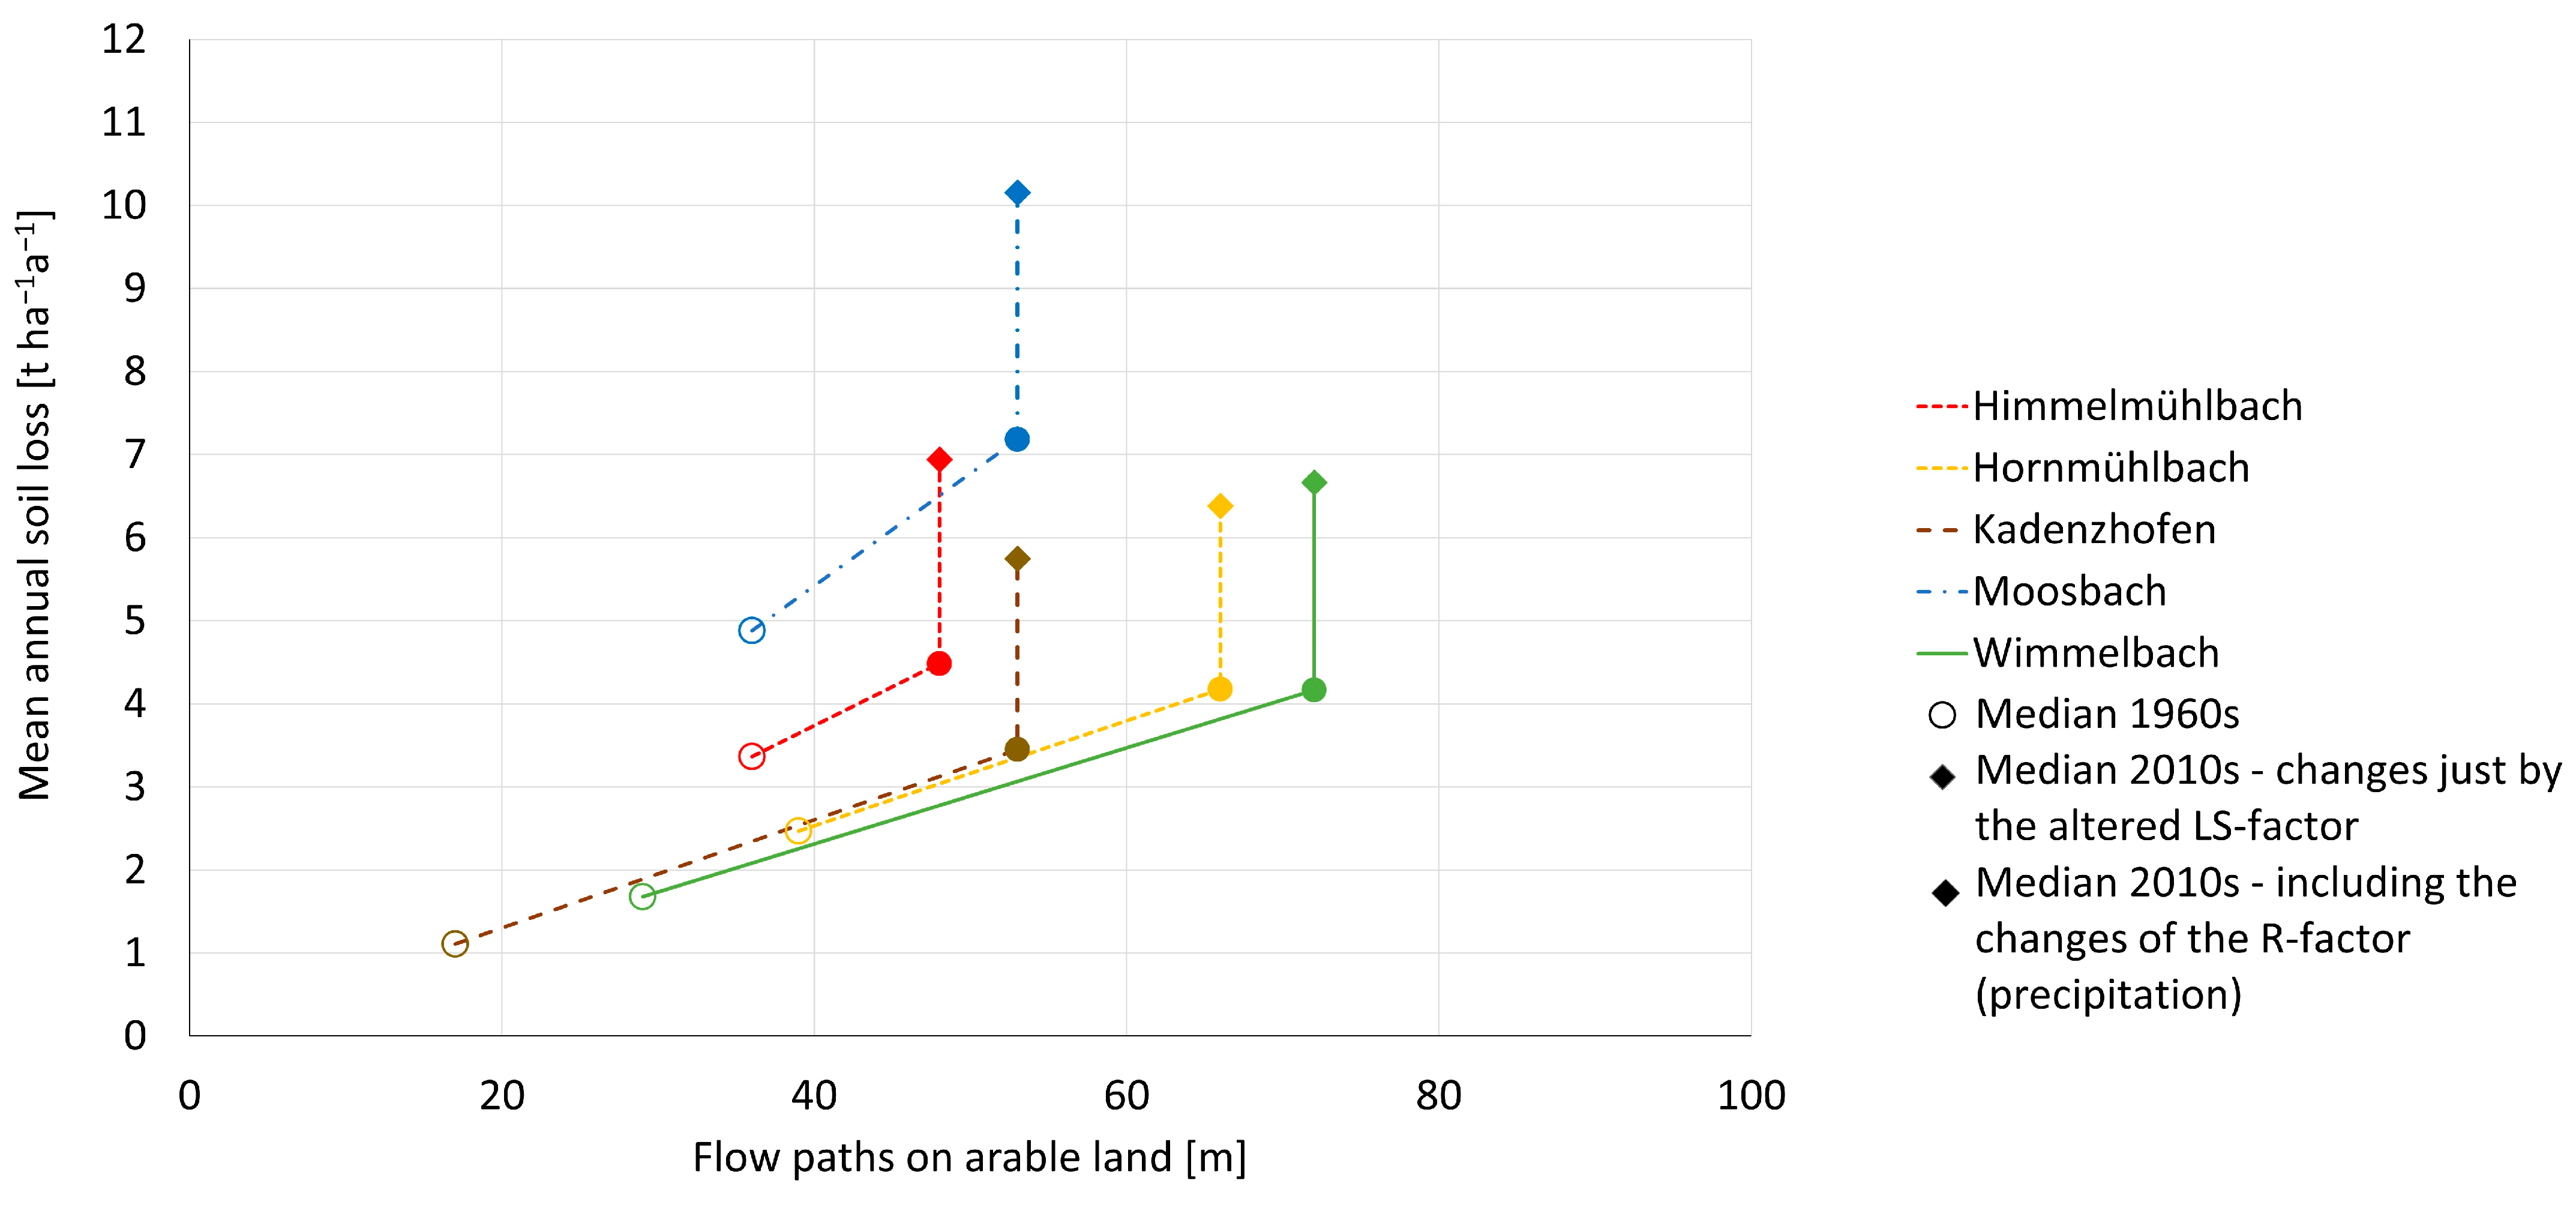
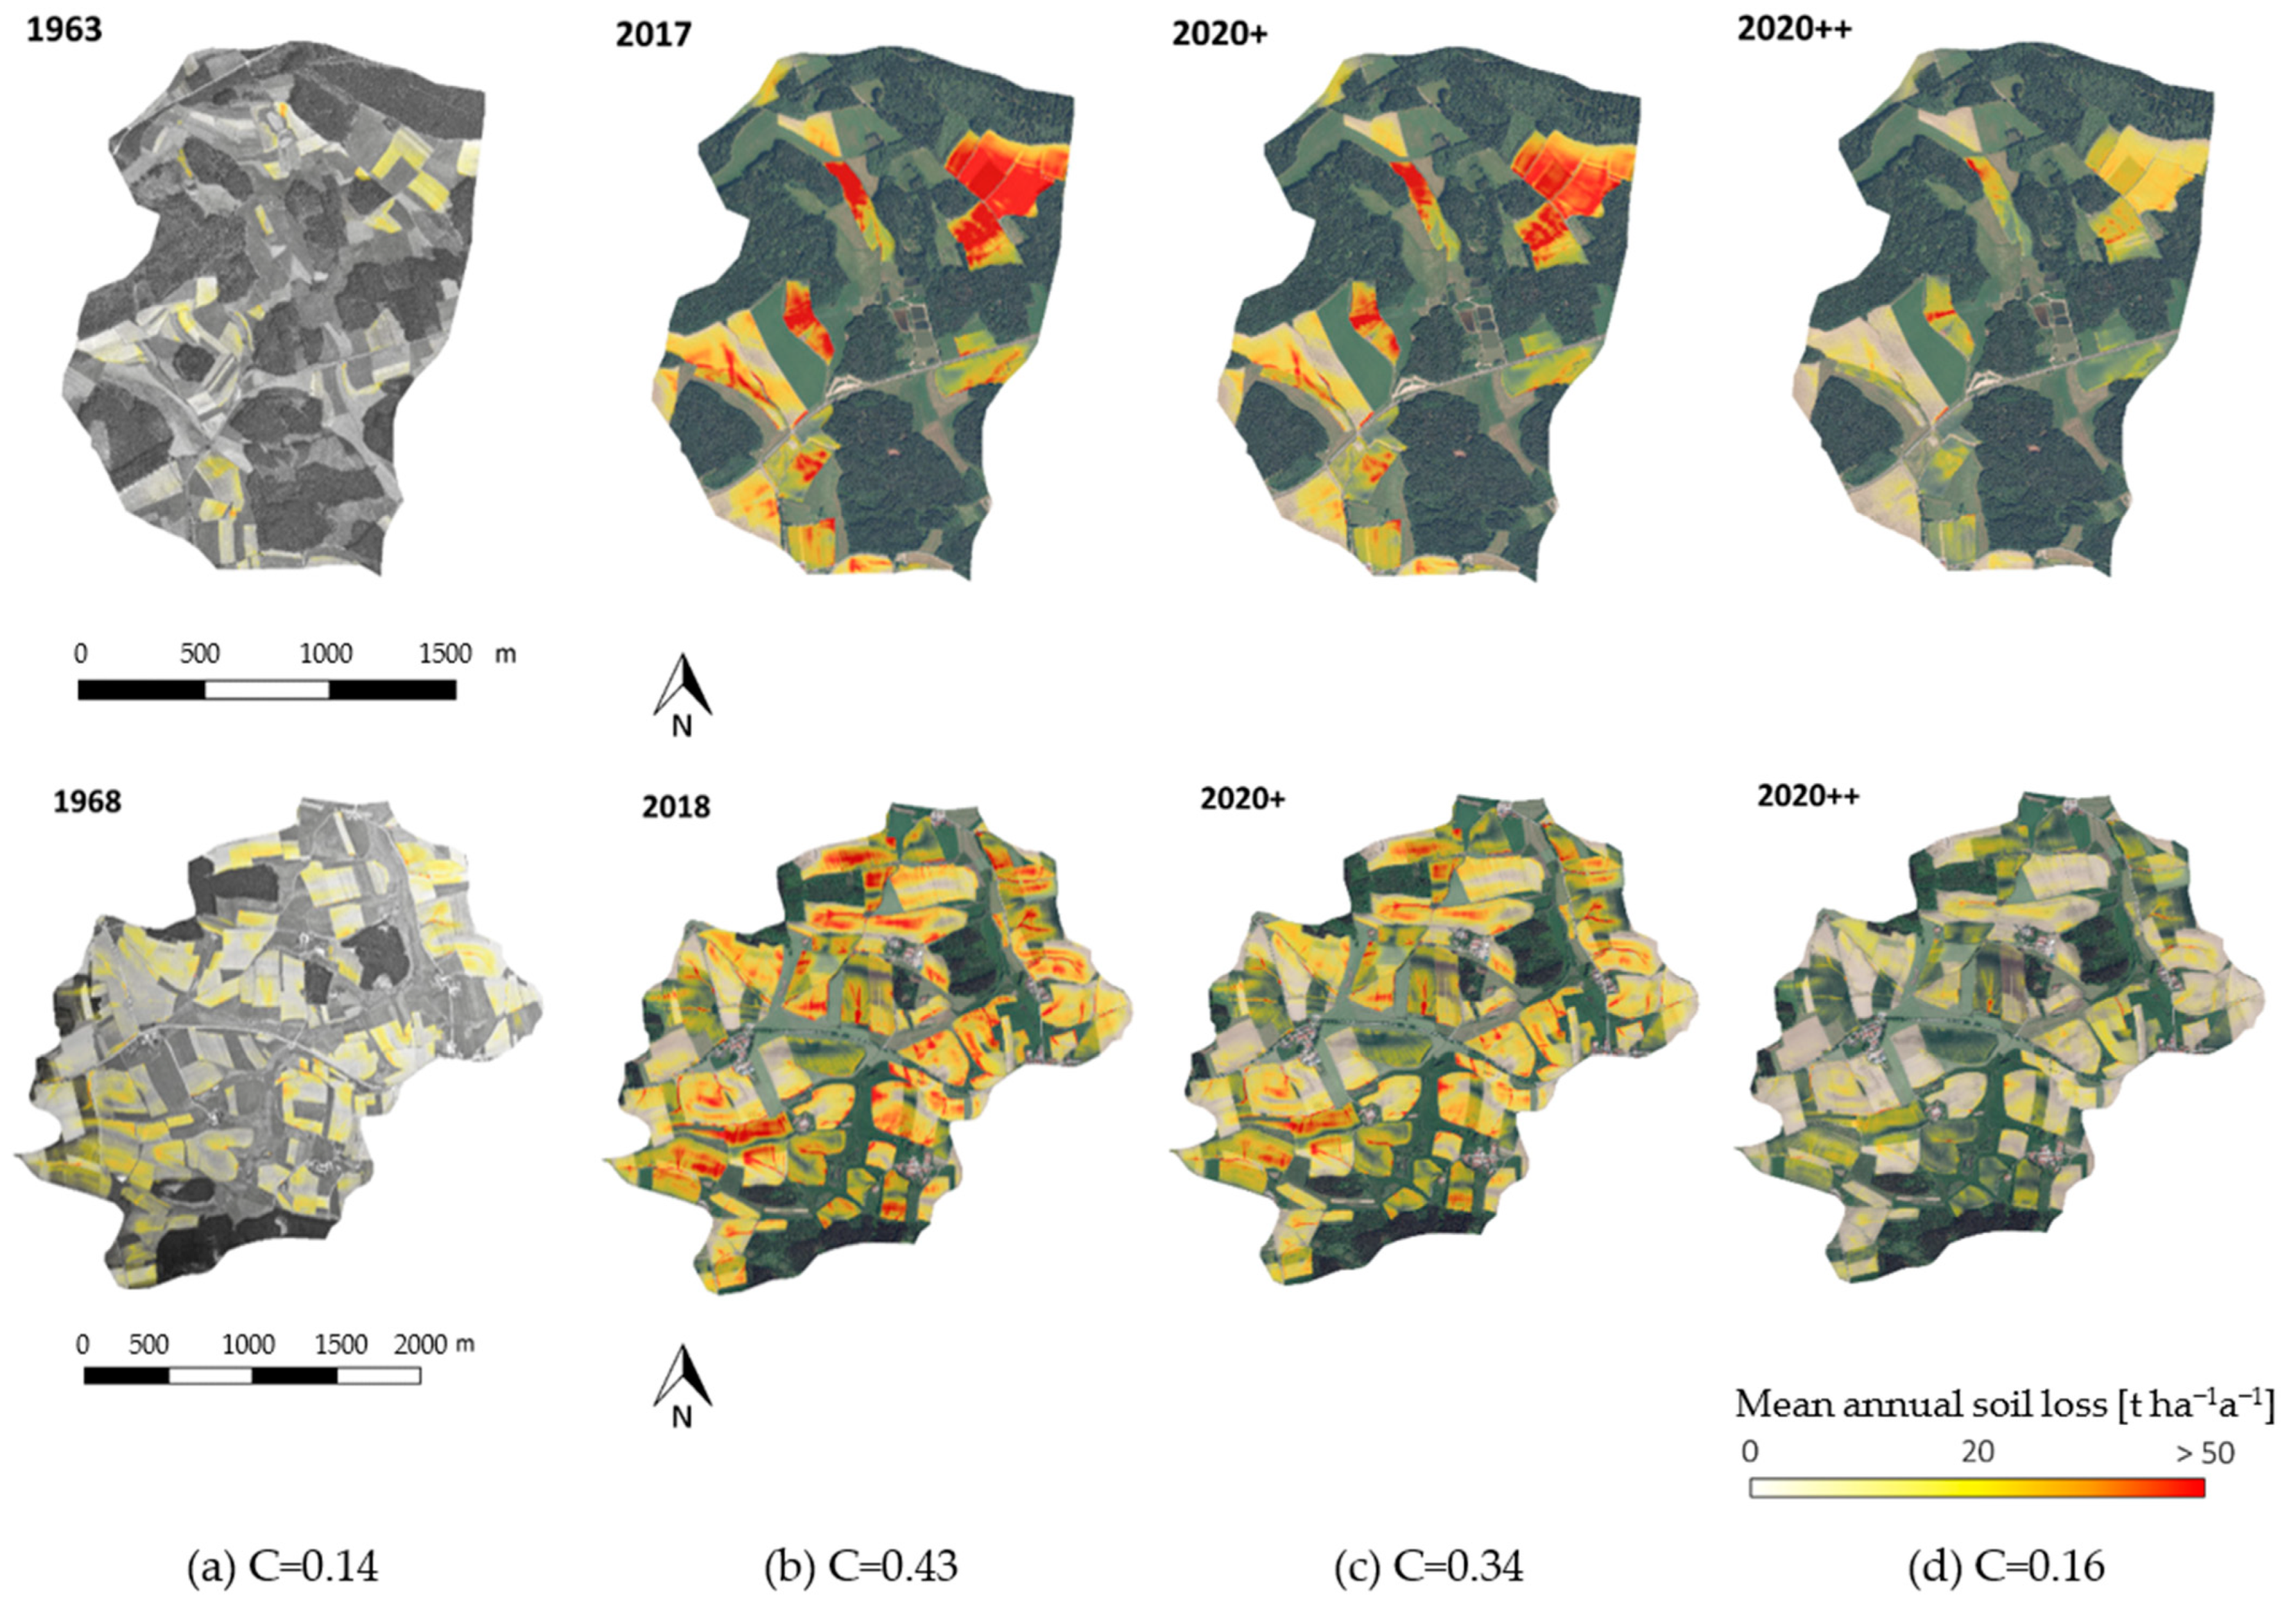
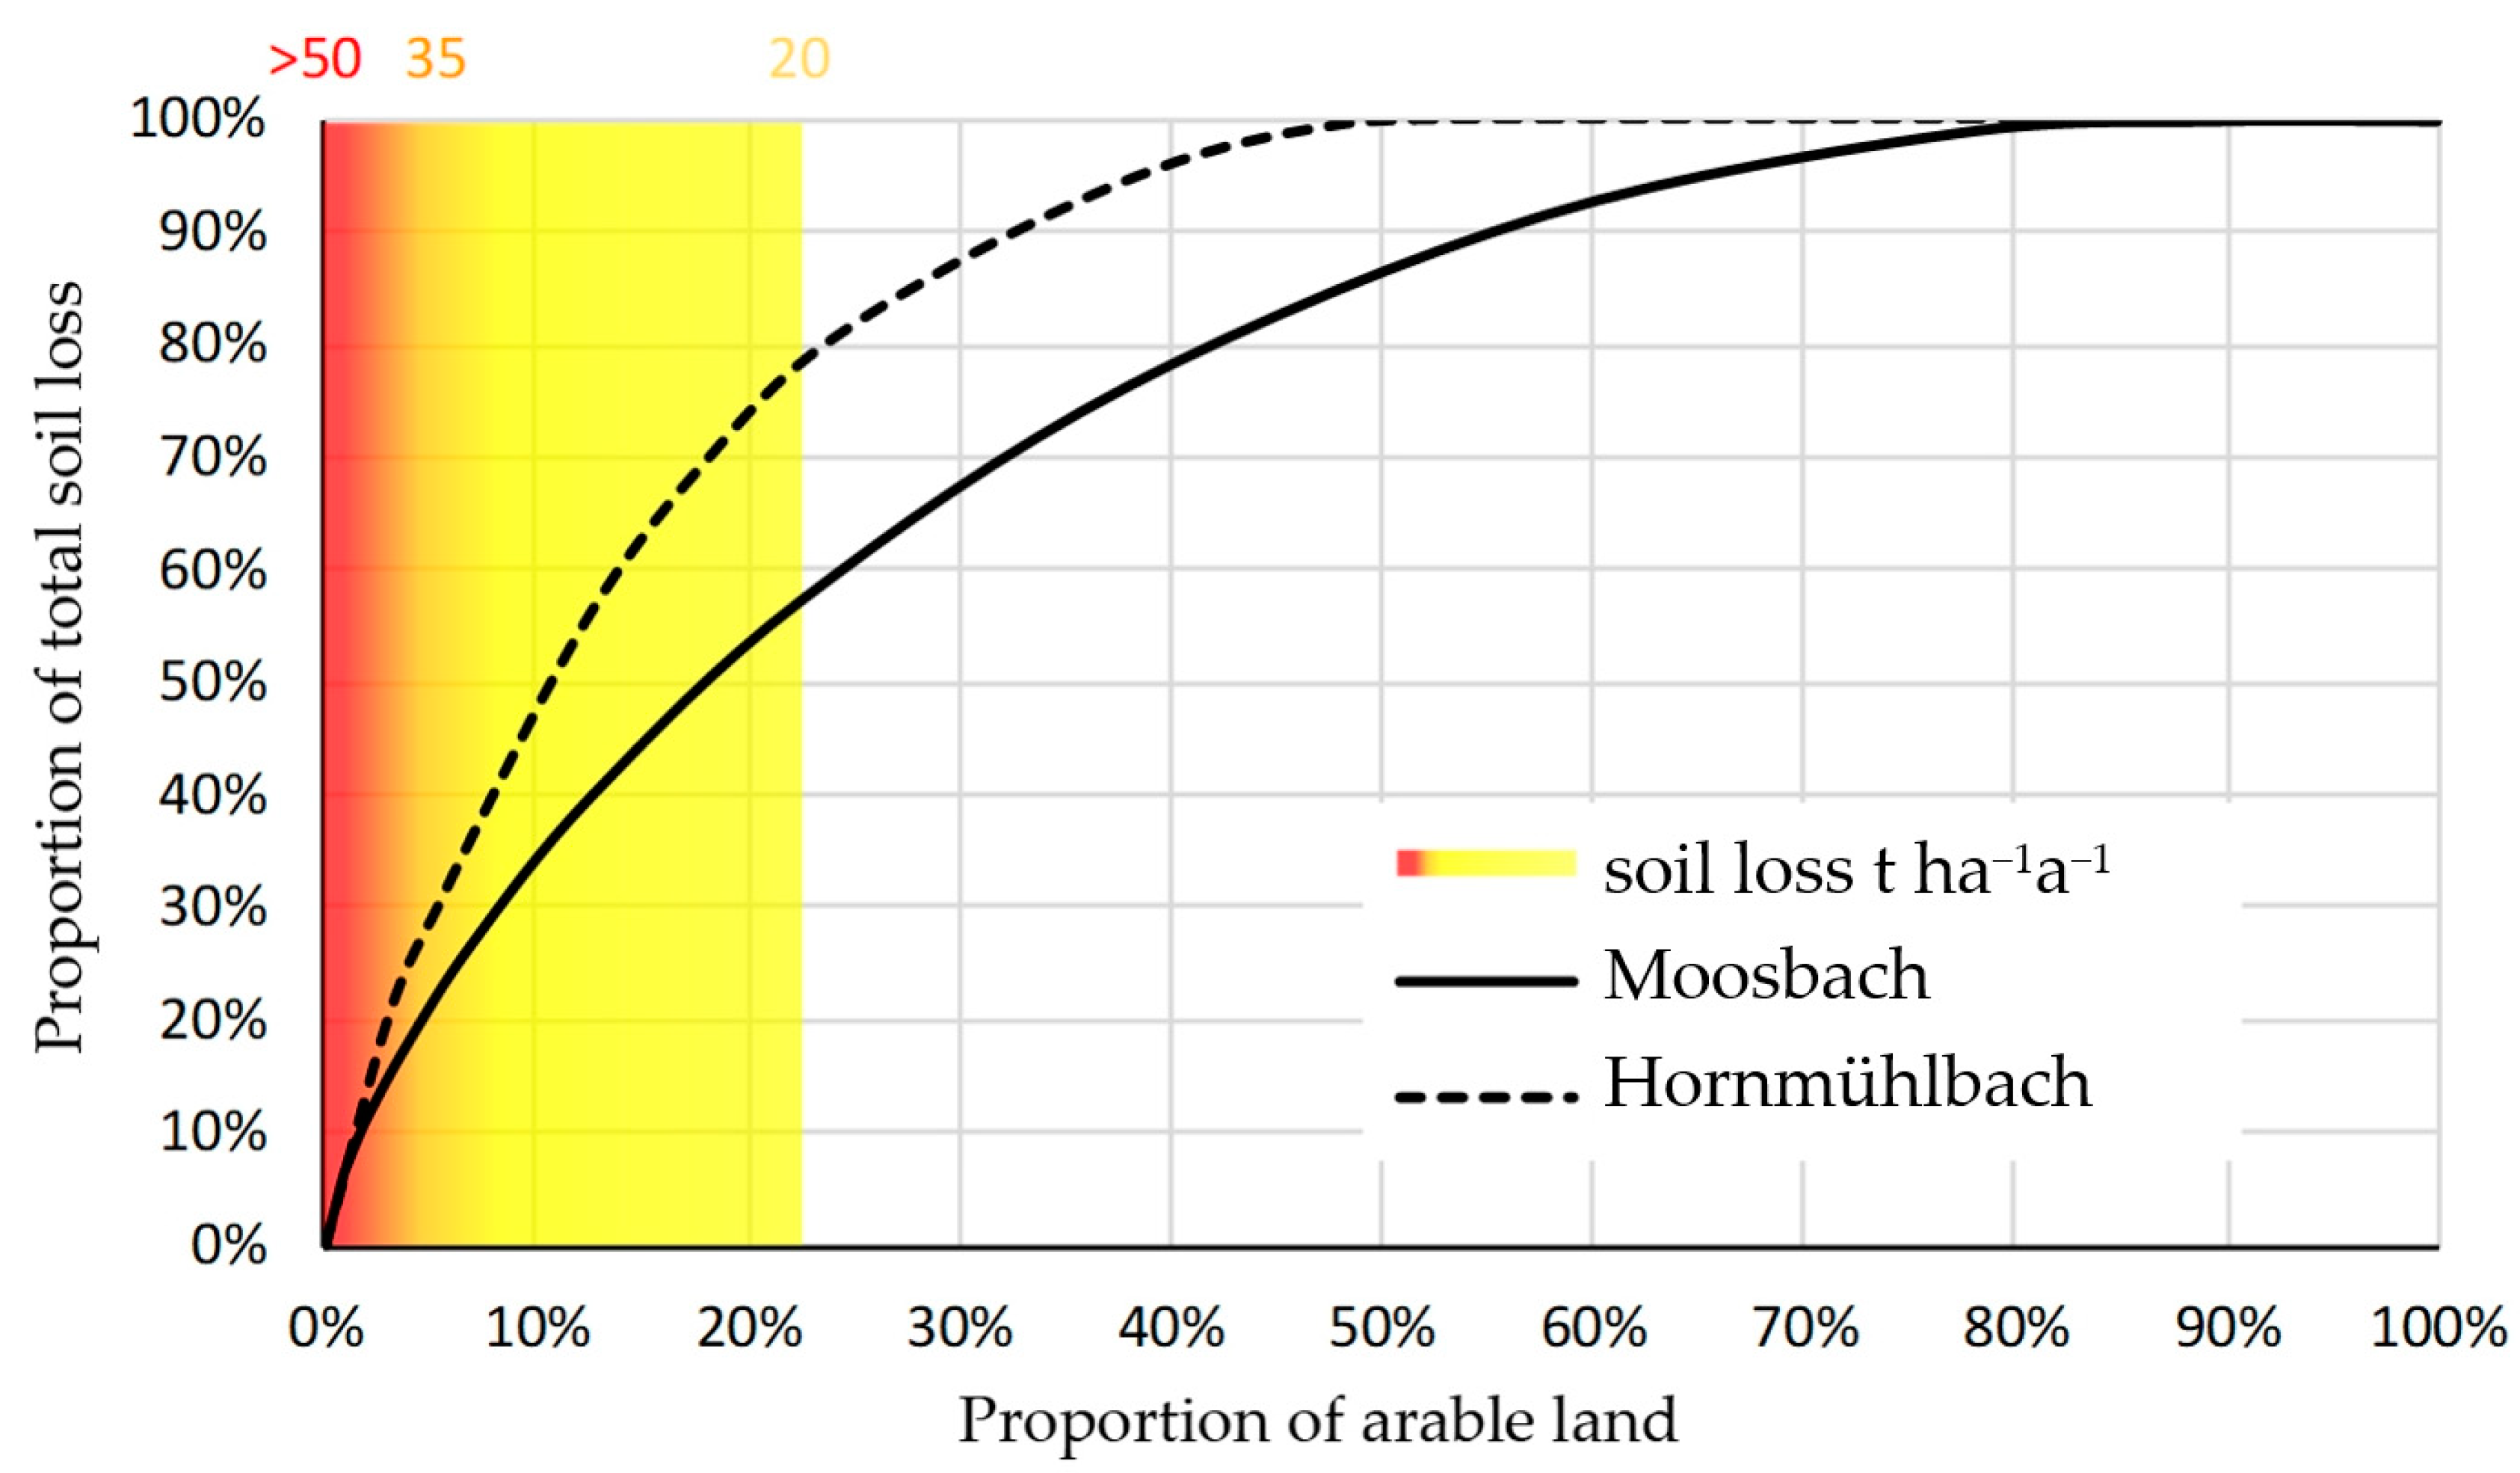
3.3. Effects of Structural Landscape Alterations and Climatic Changes on Soil Erosion

Depending on the underlying geological and hydrological conditions, different erosion rates for a respective generalized maize field were predicted in each of the five catchments. Figure 5 shows the relationship between slope lengths (in this case the runoff paths on arable land) and soil erosion on each standardized maize field. As the slope (S), the cover and cultivation factor (C), and the soil protection factor (P) were assumed to be identical in all catchments, the differences in the 1960s time step values in Figure 5 are driven by the local soil erodibility factor (K), the differences in the rainfall factor (R), and the runoff path length at that time. The mean erosion rates over catchments in that scenario range from 1.11 to 4.88 t ha−1a−1. The increase in the erosion rate is determined by the lengthening of the flow paths, and thus the changed LS factor led to values from 3.45 to 7.18 t ha−1a−1 for the 2010s time step. Depending on the catchment area, this results in an increase by a factor of 1.33 to 3.12. The additional adjustment of the R-factor [9,42], which was necessary due to the climatic changes, accounts for a further significant increase in erosion rates, resulting in mean catchment values from 5.75 to 10.15 t ha−1a−1. Overall, this resulted in increases between the two time steps by factors between 2.06 and 5.20, with the latter value standing out. On average, there was a threefold increase (3.18) in mean soil erosion in the five catchments for the maize field outlined.
Due to their underlying geogenic and climatic conditions, the Moosbach and Himmelmühlbach catchments showed the highest erosion rates. But even in areas where very low values were calculated for the 1960s, considerable rates of increase occurred due to the extension of the runoff paths due to a change in the parcel structure. The maps in Figure 6 show the results of the areal erosion modeling for the different time steps in the Hornmühlbach and Moosbach catchments. The first two pictures in each row show the situation in the 1960s and in the 2010s. The following maps (2020+ and 2020++) are forecasts for different erosion-reducing soil management scenarios (see Table 2). In the 1960s, the calculated mean long-term soil loss exceeded 20 t ha−1a−1 only very locally. In the current situation with conventional management and a high proportion of maize cultivation, erosion values of even more than 40 t ha−1a−1 were calculated. The same is true for the 2020+ scenario where erosion control measures, like soil cover by greening, etc., are assumed. Slight improvements can be observed when such mitigation measures are implemented, but they are not sufficient to push erosion rates below 20 t ha−1a−1 on a large scale. Only very ambitious changes in management or crop rotations (2020++) can reduce soil erosion almost to the rates observed in the 1960s.
In order to quantify the proportion of land required for erosion control measures, the results of the erosion modeling are depicted as a cumulative line of land use in Figure 7. The vertical axis shows the share of total erosion and the horizontal axis shows the share of arable land where erosion occurs. The two functions represent the respective results of the two catchments and reflect their different characteristics such as use, management, or topography. The slope in the diagram represents the erosion per unit area. The yellow-orange-red marked area shows the proportion of land that exceeds soil erosion values of 20, 35, and 50 t ha−1a−1, respectively. Areas with increased erosion values only take up about 22% of the arable land but cause 60% to 80% of the erosion in the two model catchments, depending on the respective underlying conditions.

4. Discussion

4.1. Land Use Changes between the 1960s and 2010s

Soil erosion has always been linked with human development and the associated changes in land use. In Central Europe, this process started with the onset of the Neolithic period at around 7500 BC [1,2]. Since then, phases of increases and decreases in soil erosion alternated but had an apparent and steady overall upward trend. Individual peaks in soil erosion were observed in rain-intensive phases, especially in the first half of the 14th and in the mid-18th to the early 19th centuries [1,45]. The success or failure of human cultures has always been linked to a certain extent to the preservation of soil fertility. Therefore, soil erosion is considered one of the great challenges for mankind [7,46,47]. The already implemented adaptions of the R-factor [9,42] (Austria: project ErosAT) [48,49] and request for further changes [50] show that once more, an epoch with increased precipitation events has begun [9]. Together with structural changes (above all the length of runoff paths on fields), these changes clearly dominate soil erosion [37,51]. The present study shows that the changes in land use in the Bavarian foothills were not so much a matter of shifts between the main land use categories (agriculture, forestry, settlement, etc.) but rather a matter of intensification within those classes with consequences on erosion processes and thus fine sediment supply to downstream brooks and rivers. Arable land has replaced grassland in some areas, forest management has intensified, and sealed surfaces have increased considerably. These developments can vary greatly from region to region [51]. For example, they have resulted in an increase in field size and the L-factor, whilst the percentage of arable land decreased in the Belgian loam belt due to a shift to more pastures and woodland in steeper areas. In other regions, arable land decreased as well due to forestation along the Iron Curtain, e.g., at the Malše River on the Austrian–Czech border [52]. However, developments similar to those considered in the present project area can be assumed for the entire intensively farmed region north of the Alpine arc in Bavaria, Upper Austria, and Lower Austria (see also [49,53]).

4.2. Development of Parcel Structures and Flow Paths on Arable Land

The summarizing maps of the two catchments of detailed investigations (Figure 8) predicted that the increase and structural change in arable land occurred especially at the starting points of the runoff paths, thus extending the continuous runoff paths onto arable land. This might correspond with the underlying conditions that lead to different valley and slope formations, depending on the geomorphological development. In the small catchments, there is no plain valley, but agricultural use takes place in the slopes between the watercourse and the forested in the steep uppermost catchments. Technical progress in forestry and agriculture enabled and simplified the cultivation of larger parcels and areas that were previously more difficult to cultivate [54]. Moreover, the number of farms has decreased drastically while the surface area of arable land in total has not changed substantially [55]. Today, management is often carried out through leasing contracts, especially in connection with the expansion of biogas plants and the associated increase in maize cultivation. On leased agricultural land, tenants tend to focus on economic optimization, whereas long-term conservation of the soil is mostly pursued on owned property. This is a long-known phenomenon [56,57] that has become increasingly apparent in Bavaria due to the biogas boom and the change in agriculture in general. The large demand for biogas feed has—together with other requirements—changed the composition of the cultivated crops [58]. While maize fields occupied 56,000 hectares across Germany in 1960, 2.57 million hectares were used for maize production in 2014 [59].
Three major developments, (i) climate change, (ii) lengthening of arable fields, and (iii) cultivation of crops susceptible to erosion, resulted in a clearly depicted increase in soil loss when comparing the two time steps in the presented study. Such changes also have a major impact on connectivity, as there are hardly any more interruptions, field margins, and crop changes along the runoff paths. In contrast to the biological connectivity in rivers, the increased connectivity of fine sediment transport routes can be seen negatively for the entire environmental status of brooks and rivers. Additionally, many new, well-maintained drainage routes were added with the expansion of sealed roads [33]. Enhanced connectivity is one of the main drivers of increased erosion rates and at the same time causes higher delivery ratios into the watercourses [2,37,60].

4.3. Effects of Structural Landscape Alterations and Climatic Changes on Soil Erosion

Like all models, the universal soil loss equation is a theoretical assumption of natural processes. Thus, calculated tonnes per hectare and year must be interpreted with all the uncertainties resulting from the limitations of the RUSLE [24,27]. First, the derivation of the individual factors must be discussed. In the present case, most of them were taken from public agencies or calculated by GIS tools. On the one hand, this seems valid, but on the other hand, it certainly ignores small-scale differences, e.g., caused by innovative farmers. Regarding the C-factor, the values for the current scenario can be regarded as a realistic worst-case scenario, as high proportions of row crops are found in many regions in Central Europe these days, especially due to the boom of biogas plants [41,58].
Additionally, various hydraulic processes (e.g., infiltration) are disregarded in the RUSLE; there is no simulation of the deposition of the material in the landscape, and the input parameters are based on comparatively general assumptions in the first place. Nevertheless, it is still a widely used model to approach the topic of soil erosion with a manageable set of parameters that enables the identification of areas that should be protected from erosion [25,42]. Results of 50 t ha−1 a−1 erosion from a specific area do not necessarily mean this amount is actually eroded or transported into a nearby watercourse, but such areas are at least to be considered hotspots where very high erosion rates are very likely to occur. Further limitations of the model are its focus on a long-term average and that it was not developed to quantify the total sediment loss of a catchment or that it can be used for short-term heavy precipitation events, which increased due to climate change [48,61], whereby there are large regional differences in the R-factor [62] and its developments. A total sum at the catchment level is not permissible [63,64].
Especially in areas where higher erosion rates are caused by climatical and geological processes, considerable additional inputs are to be expected due to increased runoff path lengths [65]. Moreover, the structural changes alone, especially the lengthening of the runoff paths and the adjustment of the R-factor due to climate change, have increased erosion on the standardized maize fields by a factor of 3 to 5, according to the presented study. Without addressing the climatic alterations, especially the structural changes, all decisions made by farmers, such as the choice of crop types, erosion control measures, machining direction, etc., only have the potential for a limited range of improvement. The period of the agricultural subsidy program valid since 2023 includes measures to this aim. The framework for this is set at the EU level and the details are set at the state level. For Austria [53], we have presented a detailed study about the effectiveness of the different soil-conserving measures.
Generally, the results of the presented study show that in some areas even with a complete shift in agriculture towards soil-conserving farming methods and a restriction of erosion-promoting crops, the average long-term soil erosion in many areas cannot be reduced to the status of the 1960s. As cultivated areas have grown significantly since then, there are still isolated erosion hotspots with values above 40 t ha−1a−1 that cannot be mitigated. In these local hotspot areas, no cropping, or at least the consistent subdivision of the slope length, buffer strips, terracing [66], or check dams, would likely be the best solution in terms of preventing soil erosion. How much of the eroded soil actually reaches the water bodies cannot be estimated with the calculations carried out [63]. However, since connectivity has increased clearly, a very large proportion can be assumed.
In order to mitigate the problem of increasing soil erosion, especially under the impact of the changed land structures and the accelerating climate change, more improved measures than those currently applied are needed [47]. Approaches like greening, undersowing, or the like show only limited improvements [67]. Thus, it is expected that the highest reductions can be achieved if long runoff paths are interrupted again and if hotspot areas are taken out of intensive use [58]. Grassed waterways [68,69], sedimentation areas, like retention ponds, and buffer strips in roadside ditches are also effective options [67]. In order to achieve as many positive effects as possible, measures ought to be realized individually at well-suited spots in relatively small catchments [37]. Measures that are not applied precisely or in the wrong place—for example, buffer strips along the main watercourse when it is the tributaries that carry the influxes—often do not fulfill the initial aim of the measure [67,70]. What could be shown in this regard is that even with comparatively simple tools, including uncertainties in the consideration of all relevant processes, hotspot areas can be effectively identified.
The identification and implementation of measures on such sites are also of enormous importance for the achievement of good ecological status of water bodies, as washed-off fine particles, as well as nutrients and pollutants associated with them, are seen as driving factors in most multi-stressed river ecosystems in Central Europe [21,22]. All biological quality elements mentioned in the Water Framework Guidelines are affected by human increased fine sediment loads. In the case of fish, gravel-spawning fish species are particularly suitable for depicting the effects [12,13,71]; disadvantages in the evaluation of fish fauna result from the high mobility of the animals and many other influencing variables. The phytobenthos is very well suited to represent the nutrient alterations associated with the influxes [72,73]. But, benthic invertebrates are the most informative with respect to immediate sediment conditions [16,17,74,75]. It is, therefore, strongly recommended, especially with regard to measurement evaluation and adaptation, that the two fields of agricultural erosion prevention and aquatic ecology be brought much closer together. Boundaries of responsibility, separation of authorities, and very distant areas of expertise often stand in the way of this. Clearly, more integrative approaches need to be found here, both in practice and in science.

5. Conclusions

The results presented in this study show that there has been a significant acceleration of soil erosion over the last 50–60 years in Central Europe. Structural changes in the landscape due to so-called land consolidation processes have a major influence on predicted soil erosion. Of particular note in this regard is (i) the increase in the size of the fields and (ii) the resulting lengthening of uninterrupted flow paths on arable land. In addition, however, (iii) the climate crisis is already showing a clear increase in erosion rates due to altered precipitation erosivity. Preserving soil as a valuable resource in such a way that it will be able to feed future societies is one of the great challenges of the coming years. The same applies to the preservation and restoration of ecologically functional water bodies. A reduction in erosive inputs and generally a near-natural sediment balance will be of great importance for the ecological resilience of streams, rivers, and stagnant waters. Since this study clearly showed that the options for erosion control measures on the fields are severely limited due to structural and climatic challenges, it is clear that only a strong set of measures implemented from the field to the water bodies can reduce the problems. A combination of measures in the catchment area (e.g., erosion prevention, water retention, a reduction in influences from urban areas) and ecological improvement measures in the watercourses (e.g., structuring, near-natural connection to the surrounding area, functioning floodplains) is required to achieve a good ecological status in water bodies. In order to achieve an effect, the spatially targeted and integrated implementation of measures is of crucial importance.

Author Contributions

Conceptualization, S.H., F.R., J.S. and C.H.; data curation, S.H. and G.R.; funding acquisition, C.G. and J.S.; investigation, S.H. and G.R.; methodology, S.H. and G.R.; project administration, S.H., C.G. and F.R.; resources, G.R., F.R. and C.H.; software, G.R.; supervision, C.H.; validation, F.R. and C.H.; visualization, S.H. and G.R.; writing—original draft, S.H. and G.R.; writing—review and editing, C.G., F.R., J.S. and C.H. All authors have read and agreed to the published version of the manuscript.

Funding

This research was funded by the Bavarian Fisheries Association (Bayerischer LandesFischereiverband e.V. https://lfvbayern.de/ accessed on 20 December 2023).

Data Availability Statement

The data presented in this study are available on request from the corresponding author. The data are not publicly available due to privacy restrictions.

Acknowledgments

The authors would like to thank the responsible persons of the Bavarian Fisheries Association. Thanks to their vision, the fisheries association in Bavaria looks beyond the waters and tries to solve the ecological problems holistically. Christian Pichler-Scheder deserves a heartfelt thanks for proofreading the article.

Conflicts of Interest

The authors declare no conflicts of interest.

References

  1. Dotterweich, M. The History of Soil Erosion and Fluvial Deposits in Small Catchments of Central Europe: Deciphering the Long-Term Interaction between Humans and the Environment—A Review. Geomorphology 2008, 101, 192–208. [Google Scholar] [CrossRef]
  2. Dreibrodt, S.; Lubos, C.; Terhorst, B.; Damm, B.; Bork, H.R. Historical Soil Erosion by Water in Germany: Scales and Archives, Chronology, Research Perspectives. Quat. Int. 2010, 222, 80–95. [Google Scholar] [CrossRef]
  3. Poschlod, P. Geschichte Der Kulturlandschaft 2. Aktualisierte Auflage; Ulmer: Stuttgart, Germany, 2015. [Google Scholar]
  4. Stefanidis, S.; Alexandridis, V.; Spalevic, V.; Luiz Mincato, R. Critical Success Factors of Small and Medium Wildfire Effects on Soil Erosion Dynamics: The Case of 2021 Megafires in Greece. AgricultForest 2022, 68, 49–63. [Google Scholar] [CrossRef]
  5. Vieira, D.C.S.; Borrelli, P.; Jahanianfard, D.; Benali, A.; Scarpa, S.; Panagos, P. Wildfires in Europe: Burned Soils Require Attention. Environ. Res. 2023, 217, 114936. [Google Scholar] [CrossRef] [PubMed]
  6. Borrelli, P.; Robinson, D.A.; Panagos, P.; Lugato, E.; Yang, J.E.; Alewell, C.; Wuepper, D.; Montanarella, L.; Ballabio, C. Land Use and Climate Change Impacts on Global Soil Erosion by Water (2015–2070). Proc. Natl. Acad. Sci. USA 2020, 117, 21994–22001. [Google Scholar] [CrossRef] [PubMed]
  7. Panagos, P.; Borrelli, P.; Poesen, J.; Ballabio, C.; Lugato, E.; Meusburger, K.; Montanarella, L.; Alewell, C. The New Assessment of Soil Loss by Water Erosion in Europe. Environ. Sci. Policy 2015, 54, 438–447. [Google Scholar] [CrossRef]
  8. Hancock, G.R. A Catchment Scale Assessment of Increased Rainfall and Storm Intensity on Erosion and Sediment Transport for Northern Australia. Geoderma 2009, 152, 350–360. [Google Scholar] [CrossRef]
  9. Elhaus, D.; Winterrath, T.; Auerswald, K.; Fischer, F. Klimawandel Und Bodenerosion—Neue Erkenntnisse Zur Regenerosivität Und Konsequenzen Für Die Abschätzung Der Erosionsgefährdung. Bodenschutz 2019, 24, 136–141. [Google Scholar]
  10. Cordone, A.J.; Kelley, D.W. The Influence of Inorganic Sediment on the Aquatic Life of Streams; Conservation of Wildlife through Education; California Department of Fish and Game: Sacramento, CA, USA, 1961; Volume 47, pp. 189–228. [Google Scholar]
  11. Waters, T.F. Sediment in Streams: Sources, Biological Effects, and Control; American Fisheries Society: Bethesda, MA, USA, 1995. [Google Scholar]
  12. Hauer, C.; Leitner, P.; Unfer, G.; Pulg, U.; Habersack, H.; Graf, W. The Role of Sediment and Sediment Dynamics in the Aquatic Environment. In Riverine Ecosystem Management; Springer International Publishing: Cham, Switzerland, 2018; pp. 151–169. [Google Scholar]
  13. Kemp, P.; Sear, D.A.; Collins, A.L.; Naden, P.; Jones, J.I. The Impacts of Fine Sediment on Riverine Fish. Hydrol. Process. 2011, 25, 1800–1821. [Google Scholar] [CrossRef]
  14. Jensen, D.W.; Steel, E.A.; Fullerton, A.H.; Pess, G.R. Impact of Fine Sediment on Egg-to-Fry Survival of Pacific Salmon: A Meta-Analysis of Published Studies. Rev. Fish. Sci. 2009, 17, 348–359. [Google Scholar] [CrossRef]
  15. Scheder, C.; Lerchegger, B.; Flödl, P.; Csar, D.; Gumpinger, C.; Hauer, C. River Bed Stability versus Clogged Interstitial: Depth-Dependent Accumulation of Substances in Freshwater Pearl Mussel (Margaritifera Margaritifera L.) Habitats in Austrian Streams as a Function of Hydromorphological Parameters. Limnologica 2015, 50, 29–39. [Google Scholar] [CrossRef]
  16. Mathers, K.L.; Rice, S.P.; Wood, P.J. Temporal Effects of Enhanced Fine Sediment Loading on Macroinvertebrate Community Structure and Functional Traits. Sci. Total Environ. 2017, 599–600, 513–522. [Google Scholar] [CrossRef] [PubMed]
  17. Wagenhoff, A.; Townsend, C.R.; Matthaei, C.D. Macroinvertebrate Responses along Broad Stressor Gradients of Deposited Fine Sediment and Dissolved Nutrients: A Stream Mesocosm Experiment. J. Appl. Ecol. 2012, 49, 892–902. [Google Scholar] [CrossRef]
  18. Mueller, M.; Pander, J.; Wild, R.; Lueders, T.; Geist, J. The Effects of Stream Substratum Texture on Interstitial Conditions and Bacterial Biofilms: Methodological Strategies. Limnologica 2013, 43, 106–113. [Google Scholar] [CrossRef]
  19. Bierschenk, A.M.; Mueller, M.; Pander, J.; Geist, J. Science of the Total Environment Impact of Catchment Land Use on Fi Sh Community Composition in the Headwater Areas of Elbe, Danube and Main. Sci. Total Environ. 2019, 652, 66–74. [Google Scholar] [CrossRef] [PubMed]
  20. Townsend, C.R.; Uhlmann, S.S.; Matthaei, C.D. Individual and Combined Responses of Stream Ecosystems to Multiple Stressors. Journal of Applied Ecology. J. Appl. Ecol. 2008, 45, 1810–1819. [Google Scholar] [CrossRef]
  21. Lemm, J.U.; Feld, C.K. Identification and Interaction of Multiple Stressors in Central European Lowland Rivers. Sci. Total Environ. 2017, 603–604, 148–154. [Google Scholar] [CrossRef]
  22. Schinegger, R.; Trautwein, C.; Melcher, A.; Schmutz, S. Multiple Human Pressures and Their Spatial Patterns in European Running Waters. Water Environ. J. 2012, 26, 261–273. [Google Scholar] [CrossRef]
  23. Haun, S. Advanced Methods for a Sustainable Sediment Management in Reservoirs; Mitteilung: Stuttgart, Germany, 2022. [Google Scholar]
  24. Wischmeier, W.H.; Smith, D.D. Predicting Rainfall Erosion Losses; Science and Education Administration, United States Department of Agriculture in cooperation with Purdue Agricultural Experiment Station: Washington, DC, USA, 1978. [Google Scholar]
  25. Renard, K.G.; Foster, G.R.; Weesies, G.A.; McCool, D.K.; Yoder, D.C. Predicting Soil Erosion by Water: A Guide to Conservation Planning with the Rivised Univeral Soil Loss Equation (RUSLE); United States Department of Agriculture: Washington, DC, USA, 1997; ISBN 0-16-048938-5. [Google Scholar]
  26. McCool, D.K.; Foster, G.R.; Renard, K.G.; Yoder, D.C.
  27. Renard, K.G.; Yoder, D.C.; Lightle, D.T.; Dabney, S.M. Universal Soil Loss Equation and Revised Universal Soil Loss Equation, Handbook of Erosion Modelling, 1st ed.; Morgan, R.P.C., Nearing, M.A., Eds.; Blackwell Publishing Ltd.: Hoboken, NJ, USA, 2010; pp. 137–167. [Google Scholar]
  28. Graf, W.; Leitner, P.; Hanetseder, I.; Ittner, L.D.; Dossi, F.; Hauer, C. Ecological Degradation of a Meandering River by Local Channelization Effects: A Case Study in an Austrian Lowland River. Hydrobiologia 2016, 772, 145–160. [Google Scholar] [CrossRef]
  29. Höfler, S.; Gumpinger, C.; Hauer, C. Ecologically Oriented Measures for Small and Medium-Sized Rivers: Impacts on the Quality Elements of the European Water Framework Directive and the Limits of Efficacy—With Particular Consideration of Siltation. Osterreichische Wasser Abfallwirtsch. 2016, 11, 519–533. [Google Scholar] [CrossRef]
  30. Kondolf, G.M.; Gao, Y.; Annandale, G.W.; Morris, G.L.; Jiang, E.; Zhang, J.; Cao, Y.; Carling, P.; Fu, K.; Guo, Q.; et al. Sustainable Sediment Management in Reservoirs and Regulated Rivers: Experiences from Five Continents. Earth’s Future 2014, 2, 256–280. [Google Scholar] [CrossRef]
  31. Owens, P.N.; Batalla, R.J.; Collins, A.J.; Gomez, B.; Hicks, D.M.; Horowitz, A.J.; Kondolf, G.M.; Marden, M.; Page, M.J.; Peacock, D.H.; et al. Fine-Grained Sediment in River Systems: Environmental Significance and Management Issues. River Res. Appl. 2005, 21, 693–717. [Google Scholar] [CrossRef]
  32. Wood, P.J.; Armitage, P.D. Biological Effects of Fine Sediment in the Lotic Environment. Environ. Manag. 1997, 21, 203–217. [Google Scholar] [CrossRef] [PubMed]
  33. Höfler, S.; Piberhofer, B.; Gumpinger, C.; Hauer, C. Status, Sources, and Composition of Fine Sediments in Upper Austrian Streams. J. Appl. Water Eng. Res. 2018, 6, 283–297. [Google Scholar] [CrossRef]
  34. Schönenberger, U.; Stamm, C. Hydraulic Shortcuts Increase the Connectivity of Arable Land Areas to Surface Waters. Hydrol. Earth Syst. Sci. 2021, 25, 1727–1746. [Google Scholar] [CrossRef]
  35. Hauer, C.; Habersack, H. “Nature-Based Solutions” Im Integrativen Wasserbau. Osterr. Wasser Abfallwirtsch. 2023, 75, 19–23. [Google Scholar] [CrossRef]
  36. Gudmundsson, L.; Boulange, J.; Do, H.X.; Gosling, S.N.; Grillakis, M.G.; Koutroulis, A.G.; Leonard, M.; Liu, J.; Schmied, H.M.; Papadimitriou, L.; et al. Globally Observed Trends in Mean and Extreme River Flow Attributed to Climate Change. Science 2021, 371, 1159–1162. [Google Scholar] [CrossRef]
  37. Zessner, M.; Höfler, S.; Weinberger, C.; Gabriel, O.; Kuderna, M.; Strenge, E.; Gumpinger, C. Feinsediment- Und Phosphorproblematik in Oberösterreichischen Fließgewässern Und Ansätze Zur Lösung; Office of the State Government of Upper Austria: Linz, Austria, 2019. [Google Scholar]
  38. Ssymank, A. Neue Anforderungen Im Europäischen Naturschutz. Das Schutzgebietssystem Natura 2000 Und Die FFH-Richtlinie Der EU. Nat. Landsch. 1994, 69, 395–406. [Google Scholar]
  39. Bayerisches Landesamt für Statistik. Bodennutzung Der Landwirtschaftlichen Betriebe in Bayern 2017; Bayerisches Landesamt für Statistik: München, Germany, 2018; p. 20. [Google Scholar]
  40. Bayerische Landesanstalt für Landwirtschaft (LfL). Agrarstrukturentwicklung in Bayern IBA-Agrarstrukturbericht 2014; Bayerische Landesanstalt für Landwirtschaft (LfL): Freising, Germany, 2015; p. 21. [Google Scholar]
  41. Bayerische Landesanstalt für Landwirtschaft (LfL). Biogas in Numbers—Statistics on Bavarian Biogas Production. Available online: https://www.lfl.bayern.de/iba/energie/031607/ (accessed on 20 November 2023).
  42. Bayerische Landesanstalt für Landwirtschaft (LfL). Erosionsatlas Bayern. Available online: https://www.lfl.bayern.de/iab/boden/029288/ (accessed on 20 November 2023).
  43. Brandhuber, R.; Auerswald, K.; Lang, R.; Müller, A.; Treisch, M. ABAG Interaktiv. Available online: https://abag.lfl.bayern.de/ (accessed on 20 November 2023).
  44. Moore, I.D.; Wilson, J. Length-Slope Factors for the Revised Universal Soil Loss Equation: Simplified Method of Estimation. J. Soil Water Conserv. 1992, 47, 423–428. [Google Scholar]
  45. Bork, H.-R.; Bork, H.; Dalchow, C.; Faust, B.; Piorr, H.-P.; Schatz, T. Landschaftsentwicklung in Mitteleuropa—Wirkung Des Menschen Auf Landschaften; Klett-Perthes: Gotha, Germany, 1998. [Google Scholar]
  46. Poesen, J. Soil Erosion in the Anthropocene: Research Needs. Earth Surf. Process. Landf. 2018, 43, 64–84. [Google Scholar] [CrossRef]
  47. Montanarella, L.; Pennock, D.J.; McKenzie, N.J.; Badraoui, M.; Chude, V.; Baptista, I.; Mamo, T.; Yemefack, M.; Aulakh, M.S.; Yagi, K.; et al. World’s Soils Are under Threat. Soil Discuss. 2015, 2, 1263–1272. [Google Scholar] [CrossRef]
  48. Johannsen, L.L.; Schmaltz, E.M.; Mitrovits, O.; Klik, A.; Smoliner, W.; Wang, S.; Strauss, P. An Update of the Spatial and Temporal Variability of Rainfall Erosivity (R-Factor) for the Main Agricultural Production Zones of Austria. Catena 2022, 215, 106305. [Google Scholar] [CrossRef]
  49. Strauss, P.; Schmaltz, E.; Krammer, C.; Zeiser, A.; Weinberger, C.; Kuderna, M.; Dersch, G. Bodenerosion in Österreich—Eine Nationale Berechnung Mit Regionalen Daten Und Lokaler Aussagekraft Für ÖPUL; Federal Agency for Water Management: Petzenkirchen, Austria, 2020; p. 149. [Google Scholar]
  50. Benavidez, R.; Jackson, B.; Maxwell, D.; Norton, K. A Review of the (Revised) Universal Soil Loss Equation (R/USLE): With a View to Increasing Its Global Applicability and Improving Soil Loss Estimates. Hydrol. Earth Syst. Sci. 2018, 22, 6059–6086. [Google Scholar] [CrossRef]
  51. Van Oost, K.; Govers, G. Evaluating the Effects of Changes in Landscape Structure on Soil Erosion by Water and Tillage. Landsc. Ecol. 2000, 15, 577–589. [Google Scholar] [CrossRef]
  52. Hauer, C.; Höfler, S. Interreg Malšemuschel—Final Report 2017-2020; Office of the State Government of Upper Austria: Linz, Austria, 2021. [Google Scholar]
  53. Schmaltz, E.M.; Krammer, C.; Dersch, G.; Weinberger, C.; Kuderna, M.; Strauss, P. The Effectiveness of Soil Erosion Measures for Cropland in the Austrian Agri-Environmental Programme: A National Approach Using Local Data. Agric. Ecosyst. Environ. 2023, 355, 108590. [Google Scholar] [CrossRef]
  54. van der Sluis, T.; Pedroli, B.; Kristensen, S.B.P.; Lavinia Cosor, G.; Pavlis, E. Changing Land Use Intensity in Europe—Recent Processes in Selected Case Studies. Land Use Policy 2016, 57, 777–785. [Google Scholar] [CrossRef]
  55. Statista GmbH Anzahl Der Landwirtschaftlichen Betriebe Und Bauernhöfe in Deutschland Bis 2020. Available online: https://de.statista.com/statistik/daten/studie/36094/umfrage/landwirtschaft---anzahl-der-betriebe-in-deutschland/ (accessed on 15 November 2023).
  56. Lee, L.K. The Impact of Landownership Factors on Soil Conservation. Am. J. Agric. Econ. 1980, 62, 1070–1076. [Google Scholar] [CrossRef]
  57. Ervin, D.E. Soil Erosion Control on Owner-Operated and Rented Cropland. J. Soil Water Conserv. 1982, 37, 285–288. [Google Scholar]
  58. Vogel, E.; Deumlich, D.; Kaupenjohann, M. Bioenergy Maize and Soil Erosion—Risk Assessment and Erosion Control Concepts. Geoderma 2016, 261, 80–92. [Google Scholar] [CrossRef]
  59. Rath, J. Deutsches Maiskomitee e. V. (DMK). Available online: https://www.maiskomitee.de/ (accessed on 15 November 2023).
  60. Poeppl, R.E.; Fryirs, K.A.; Tunnicliffe, J.; Brierley, G.J. Managing Sediment (Dis)Connectivity in Fluvial Systems. Sci. Total Environ. 2020, 736, 139627. [Google Scholar] [CrossRef] [PubMed]
  61. Panagos, P.; Ballabio, C.; Meusburger, K.; Spinoni, J.; Alewell, C.; Borrelli, P. Towards Estimates of Future Rainfall Erosivity in Europe Based on REDES and WorldClim Datasets. J. Hydrol. 2017, 548, 251–262. [Google Scholar] [CrossRef]
  62. Bezak, N.; Mikoš, M.; Borrelli, P.; Liakos, L.; Panagos, P. An In-Depth Statistical Analysis of the Rainstorms Erosivity in Europe. Catena 2021, 206, 105577. [Google Scholar] [CrossRef]
  63. Alewell, C.; Borrelli, P.; Meusburger, K.; Panagos, P. Using the USLE: Chances, Challenges and Limitations of Soil Erosion Modelling. Int. Soil Water Conserv. Res. 2019, 7, 203–225. [Google Scholar] [CrossRef]
  64. Risse, L.M.; Nearing, M.A.; Laflen, J.M.; Nicks, A.D. Error Assessment in the Universal Soil Loss Equation. Soil Sci. Soc. Am. J. 1993, 57, 825–833. [Google Scholar] [CrossRef]
  65. Khosh Bin Ghomash, S.; Caviedes-Voullieme, D.; Hinz, C. Effects of Erosion-Induced Changes to Topography on Runoff Dynamics. J. Hydrol. 2019, 573, 811–828. [Google Scholar] [CrossRef]
  66. Bettoni, M.; Maerker, M.; Bosino, A.; Conedera, M.; Simoncelli, L.; Vogel, S. Land Use Effects on Surface Runoff and Soil Erosion in a Southern Alpine Valley. Geoderma 2023, 435, 116505. [Google Scholar] [CrossRef]
  67. Zessner, M.; Strenge, E.; Hepp, G.; Kuderna, M.; Weinberger, C.; Gabriel, O. Prognose Der Nährstoffbelastung in Oberösterreichischen Gewässern Für Den Zeitraum 2015—2020, Ableitung von Handlungsoptionen Sowie Quantifizierung Ihrer Wirksamkeit; Im Auftrag des Amtes der Oberösterreichischen Landesregierung AUWR-2015-231931/41-StU; Office of the State Government of Upper Austria: Linz, Austria, 2018; p. 80. [Google Scholar]
  68. Fiener, P.; Auerswald, K. Effectiveness of Grassed Waterways in Reducing Runoff and Sediment Delivery from Agricultural Watersheds. J. Environ. Qual. 2003, 32, 927–936. [Google Scholar] [CrossRef] [PubMed]
  69. Lees, C.; de Baets, S.; Rickson, J.; Simmons, R.W. Selecting Plant Traits for Soil Erosion Control in Grassed Waterways under a Changing Climate: A Growth Room Study. Eur. J. Soil Sci. 2021, 72, 2381–2397. [Google Scholar] [CrossRef]
  70. Davies, B.; Biggs, J.; Williams, P.; Thompson, S. Making Agricultural Landscapes More Sustainable for Freshwater Biodiversity: A Case Study from Southern England. Aquat. Conserv. Mar. Freshw. Ecosyst. 2009, 19, 439–447. [Google Scholar] [CrossRef]
  71. Dürregger, A.; Pander, J.; Palt, M.; Mueller, M.; Nagel, C.; Geist, J. The Importance of Stream Interstitial Conditions for the Early-Life-Stage Development of the European Nase (Chondrostoma Nasus L.). Ecol. Freshw. Fish 2018, 27, 920–932. [Google Scholar] [CrossRef]
  72. Masouras, A.; Karaouzas, I.; Dimitriou, E.; Tsirtsis, G.; Smeti, E. Benthic Diatoms in River Biomonitoring—Present and Future Perspectives within the Water Framework Directive. Water 2021, 13, 478. [Google Scholar] [CrossRef]
  73. Law, R.J. A Review of the Function and Uses of, and Factors Affecting, Stream Phytobenthos. Freshw. Rev. 2011, 4, 135–166. [Google Scholar] [CrossRef]
  74. Gieswein, A.; Hering, D.; Lorenz, A.W. Development and Validation of a Macroinvertebrate-Based Biomonitoring Tool to Assess Fine Sediment Impact in Small Mountain Streams. Sci. Total Environ. 2019, 652, 1290–1301. [Google Scholar] [CrossRef] [PubMed]
  75. Harrison, E.T.; Norris, R.; Wilkinson, S. The Impact of Fine Sediment Accumulation on Benthic Macroinvertebrates: Implications for River Managemen. In Proceedings of the 5th Australian Stream Management Conference, Albury, Australia, 21–25 May 2007; Australian Rivers: Making a Difference; Charles Sturt University Thurgoona: New South Wales, Australia, 2007; pp. 139–144. [Google Scholar]
Figure 1. Overview of the five study sites in different Bavarian landscape units [38] and the general project design.
Water 16 00417 g001
Figure 2. Illustration of the method to digitalize aerial photos of different time steps and calculate the length of uninterrupted runoff path lengths on arable land.
Water 16 00417 g002
Figure 3. Calculation scheme for the raster-based erosion modeling (* multiplication).
Water 16 00417 g003
Figure 4. Development of field length, field size, and length of uninterrupted flow paths on arable land between the two time steps.
Water 16 00417 g004
Figure 5. Development of the mean annual soil loss between the 1960s and the 2010s on a standardized maize field with a 5° slope in the five catchments.
Water 16 00417 g005
Figure 6. Modeled mean annual soil loss in the two catchments (top row: Hornmühlbach, bottom row: Moosbach) according to the four defined scenarios: (a) 1960s scenario (b), current situation (c), 2020+ scenario (d), 2020++ scenario.
Water 16 00417 g006
Figure 7. Cumulative curve of mean annual soil erosion by area.
Water 16 00417 g007
Figure 8. Summarized development of field sizes and runoff paths: (a) Hornmühlbach 1963 (b), Hornmühlbach 2017 (c), Moosbach 1968 (d), Moosbach 2018.
Water 16 00417 g008
Table 1. Change in precipitation erosivity (MJ mm ha−1 h−1 a−1) in this study’s areas (according to [42]).
19602010Increase
OtterbachHimmelmühlbach6510055%
AschaHornmühlbach709536%
SchwarzachKadenzhofen6010067%
Große VilsMoosbach7511047%
ZennWimmelbach508060%
Table 2. Assumptions for the C-factor calculation of the four scenarios and the values for the other factors of the RUSLE.
Scenarios for the C-Factor196020102020+2020++
Cultivation systempotato–grain rotationmaize–grain rotation (also mixture of row crops)
Soil cover during winter before row crop/potatoesnonoyesyes
Intercroppingnonoyesyes
Tillage before row crop/potatoesyesyesyesno-tillage
Potato dam plantationspring---
Seed conditioning before row crop-arealarealareal
Tillage/Ploughing before grainyes---
Soil cover with straw or intercrop cover after sowing row crop-<5%<10%<10%
Share of row crop25%75%75%50%
Resulting management factor (C-factor)0.140.430.340.16
Other factors of the RUSLE
R Moosbach (MJ mm ha−1 h−1 year−1) [42]75106106106
R Hornmühlbach (MJ mm ha−1 h−1 year−1) [42]70107107107
K Moosbach [42]0.40.40.40.4
K Hornmühlbach [42]0.250.250.250.25
LS factorindividual cell value
P-factor1111
Table 3. Change in the land use shares for all five project sites.
Share of Total Area1960s2010s
Agriculture57.8%54.7%
  of which is arable land40.9%65.1%
  of which is grassland49.4%34.9%
  of which is other agricultural land9.7%0.0%
Forestry35.3%36.9%
Sealed areas1.9%3.5%
 Settlement area1.0%2.1%
 Infrastructure1.8%2.0%
   of which are asphalted roads50.8%68.0%
    of which are farm tracks49.2%32.0%
Structural elements3.5%3.7%
   of which are roadside areas16.9%27.8%
Disclaimer/Publisher’s Note: The statements, opinions and data contained in all publications are solely those of the individual author(s) and contributor(s) and not of MDPI and/or the editor(s). MDPI and/or the editor(s) disclaim responsibility for any injury to people or property resulting from any ideas, methods, instructions or products referred to in the content.

