Article

Study on a Geomorphic Indicator for Evaluating Sediment Transport Capacity in Mountainous Rivers

by
Naoko Nagumo
1,2,3,*,
Daisuke Harada
3 and
Shinji Egashira
3
1
Waseda Research Institute for Science and Engineering, Waseda University, Tokyo 1698555, Japan
2
Interfaculty Initiative in Information Studies, The University of Tokyo, Tokyo 1130033, Japan
3
International Centre for Water Hazard and Risk Management, Public Works Research Institute, Tsukuba 3058516, Japan
*
Author to whom correspondence should be addressed.
Water 2024, 16(24), 3688; https://doi.org/10.3390/w16243688
Submission received: 7 August 2024 / Revised: 24 October 2024 / Accepted: 24 October 2024 / Published: 20 December 2024
(This article belongs to the Special Issue Challenges to Interdisciplinary Application of Hydrodynamic Models)

Abstract

:
Flooding of water, sediment, and driftwood and its associated landform changes often occurs downstream of debris-flow deposition zones in small, mountainous river basins. This type of flooding occurs due to a sudden decrease in the sediment transport capacity of river channels, resulting in considerable damage. Despite the significant need for appropriate countermeasures to mitigate damage, it has been a challenge to plan and implement these across all river basins at risk of these hazards. However, if a simple but reliable tool is available to identify hazardous areas in advance, this would be extremely useful for prioritizing such areas and designing and implementing the required measures. To this end, this paper examines the geomorphic characteristics of recent flood events in Japan and proposes a method for identifying hazardous areas due to inundation by flood flows with sediment. We first explain the occurrence of sediment inundation by focusing on longitudinal changes in sediment transport capacity using the geomorphic indicator defined as the product of the drainage area A and bed slope i . In addition, we investigate the longitudinal profiles of the sediment transport capacity along the study channels using a one-dimensional governing equation for flood flows and, based on the results, discuss that finding that the computed longitudinal profiles of the sediment transport capacity are consistent with the longitudinal distribution of the A i . Our findings indicate that the A i is an effective indicator for identifying areas prone to inundation by flood flows with sediment.

1. Introduction

The Japanese islands, where our study area is located, lie within the circum-Pacific orogenic belt, where mountains are undergoing active uplift. They also have abundant rainfall, especially due to heavy rainfall events caused by typhoons and atmospheric fronts during summer and autumn, which facilitate active sediment production. Since river channels in Japan are steep, rapid rainfall-runoff results, with flood flows carrying abundant sediment that reaches lowlands quickly and forms various micro-landforms on alluvial plains [1,2,3,4,5,6]. Land development is actively conducted, allowing dense settlements not only in alluvial plains but also on mountain slopes in some areas. Given these circumstances, landslides and debris flows have long been addressed as prominent issues in addition to flood disasters. In 2000, the Sediment Disaster Prevention Law was enacted with the aim of protecting human lives, assets, and public facilities from such hazards. As a result, building-structure regulations, relocation support, and other measures have been implemented, and warning and evacuation systems have been developed and installed. Furthermore, each time a severe sediment disaster occurs, this law is amended; therefore, disaster policies backed by the law have been updated, and measures for sediment disaster prevention have evolved for more effectiveness [7,8,9,10].
Figure 1 is a schematic diagram illustrating the sediment transport form from mountain slopes to torrents to downstream, mild channels in a small, mountainous river basin. When landslides and debris flows occur, the sediment masses released from them are transported in the river channel and deposited throughout the transport process until river-channel and other conditions cause them to stop. The mobility of sediment masses depends on their physical characteristics and the sediment concentration. The runout distance increases with increases in the fine sediment fraction or with decreases in the sediment concentration. As a result, debris flow sediment is usually deposited with a surface slope ranging from 8 to 4 degrees. If we define this deposited sediment as primary deposited sediment, it is often eroded and transported by flood flows that result from heavy rainfall or subsequent floods. During such sediment transport processes, sediment is carried as a bed load or suspended load by flood flows, depending on their sediment transport capacity. However, if the sediment transport capacity decreases suddenly, sediment can be deposited, causing rapid riverbed aggradation and subsequent overflows of floodwaters with sediment, along with sediment sorting. If the primary deposited sediment includes driftwood, the driftwood will also spill out of the river channel and spread over a wide area. In this way, flooding of water, sediment, and driftwood occurs, bringing significant changes in micro-landforms. Recently, hazards involving this type of flooding have often occurred in small, mountainous river basins in Japan and have resulted in severe damage, e.g., that described in [11,12,13,14,15,16,17].
Scientific knowledge on the characteristics of landslide and debris-flow occurrences has been accumulated based on parameters such as rainfall, topography, and bed materials. The behavior of landslides and debris flows has been represented using physical models by many researchers, e.g., as reported in [18,19,20,21,22,23,24,25,26,27]. Additionally, numerous observations, experiments, and numerical simulations have been conducted globally to understand the processes of riverbed changes due to sediment and driftwood transportation, e.g., as reported in [28,29,30,31,32,33,34]. However, few studies have clarified the characteristics and processes of inundation caused by flood flows with sediment and accompanying landform changes arising at locations downstream of debris-flow deposition zones. Furthermore, these downstream sections are typically lowlands or transition zones between mountains and lowlands, often overlapping with human settlements. Therefore, it is necessary to implement appropriate countermeasures to mitigate disaster damage. However, since a substantial number of river basins with hazardous areas exposed to sediment-filled inundation exist in Japan and overseas, preparing practical measures for all of them is extremely challenging.
With current technologies and knowledge, it is feasible to evaluate the characteristics of potential hazards and determine the types of required measures using simulation models [35,36,37,38,39] if areas prone to inundation by flood flows with sediment can be identified in advance. In addition, if it becomes possible to detect high-risk areas easily and reliably, this would be extremely useful for prioritizing them for advanced implementation of countermeasures. This paper proposes a method for identifying areas highly exposed to flood hazards, including inundation by flood flows with sediment that may occur in small, mountainous river basins. First, we analyze the geomorphic conditions leading to the hazards that have recently occurred in Japan, and investigate the relationship between these geomorphic characteristics and the hydraulic variables that constitute sediment transport equations. Then, we propose an indicator that represents the sediment transport capacity. In addition, we investigate the relationship between the areas where flooding with sediment occurred and the longitudinal distribution of the sediment transport capacity expressed by the indicator, showing the effectiveness of the proposed indicator for identifying areas prone to flooding. Finally, we calculate the total sediment load by using bed load formulas that have different functional forms and a formula for the equilibrium concentration of the suspended sediment. This paper includes a reconstitution of results and discussions previously published in Japanese papers [40,41].

2. Overview of Target River Basins and Disasters
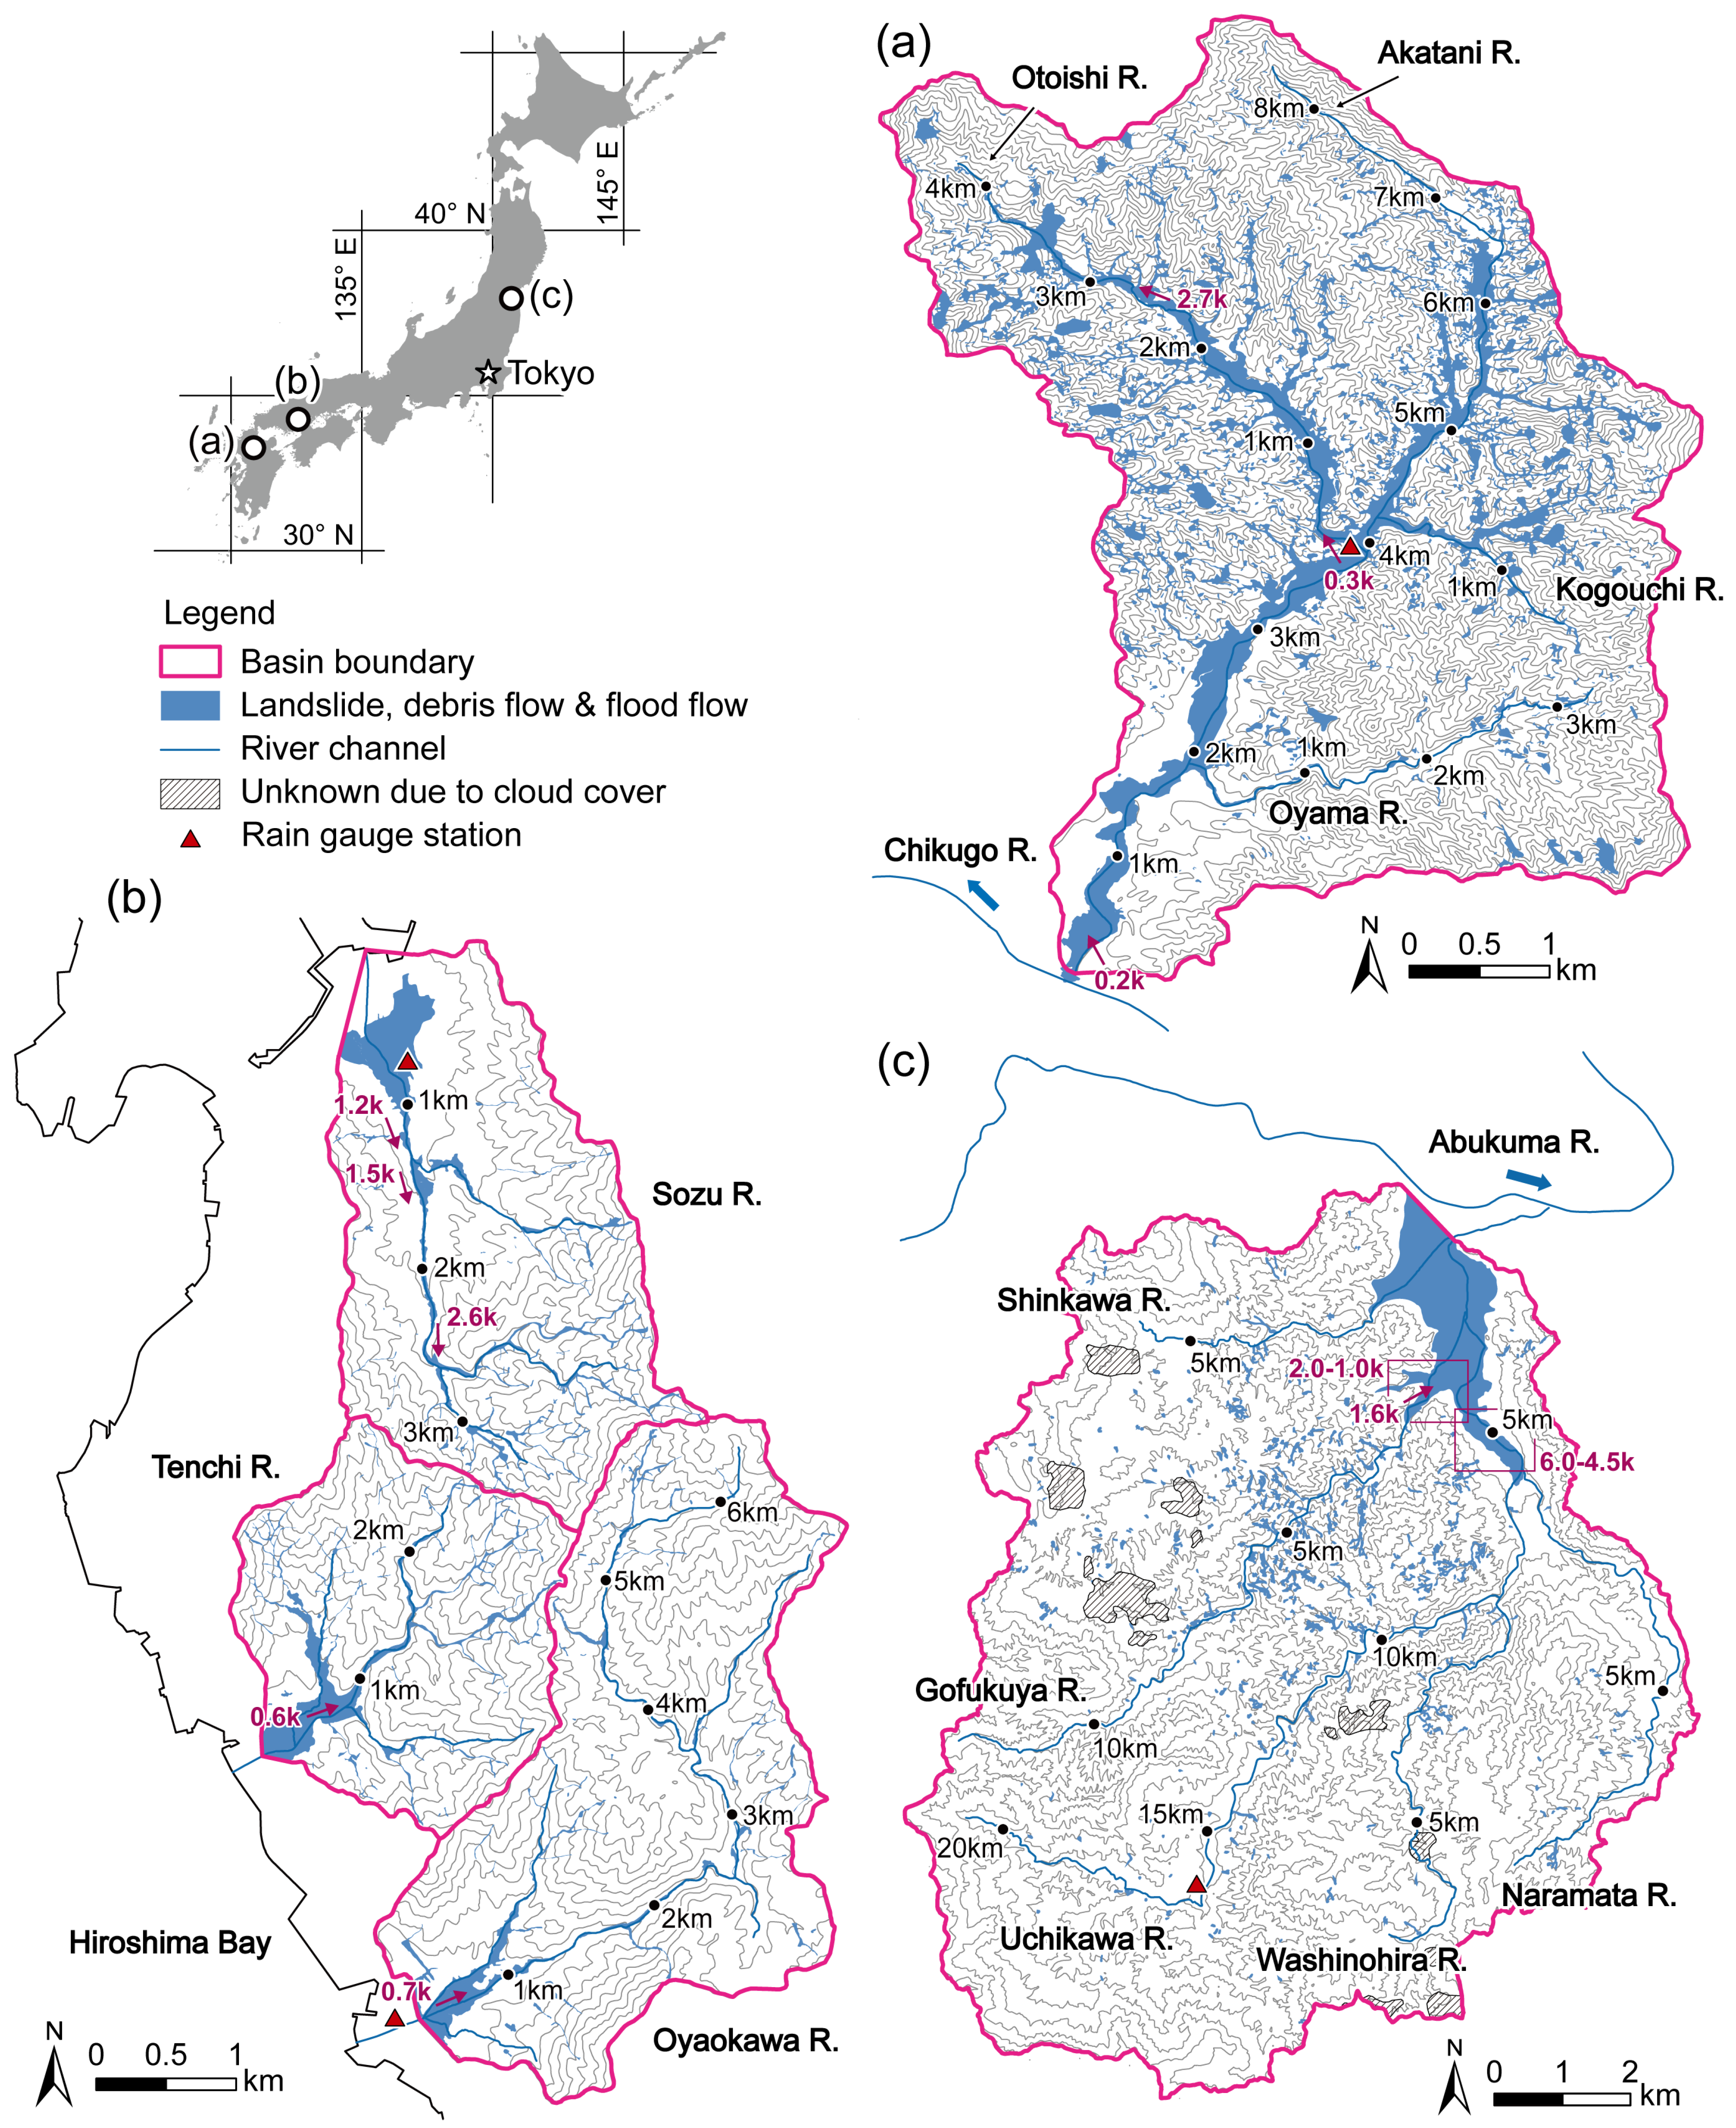
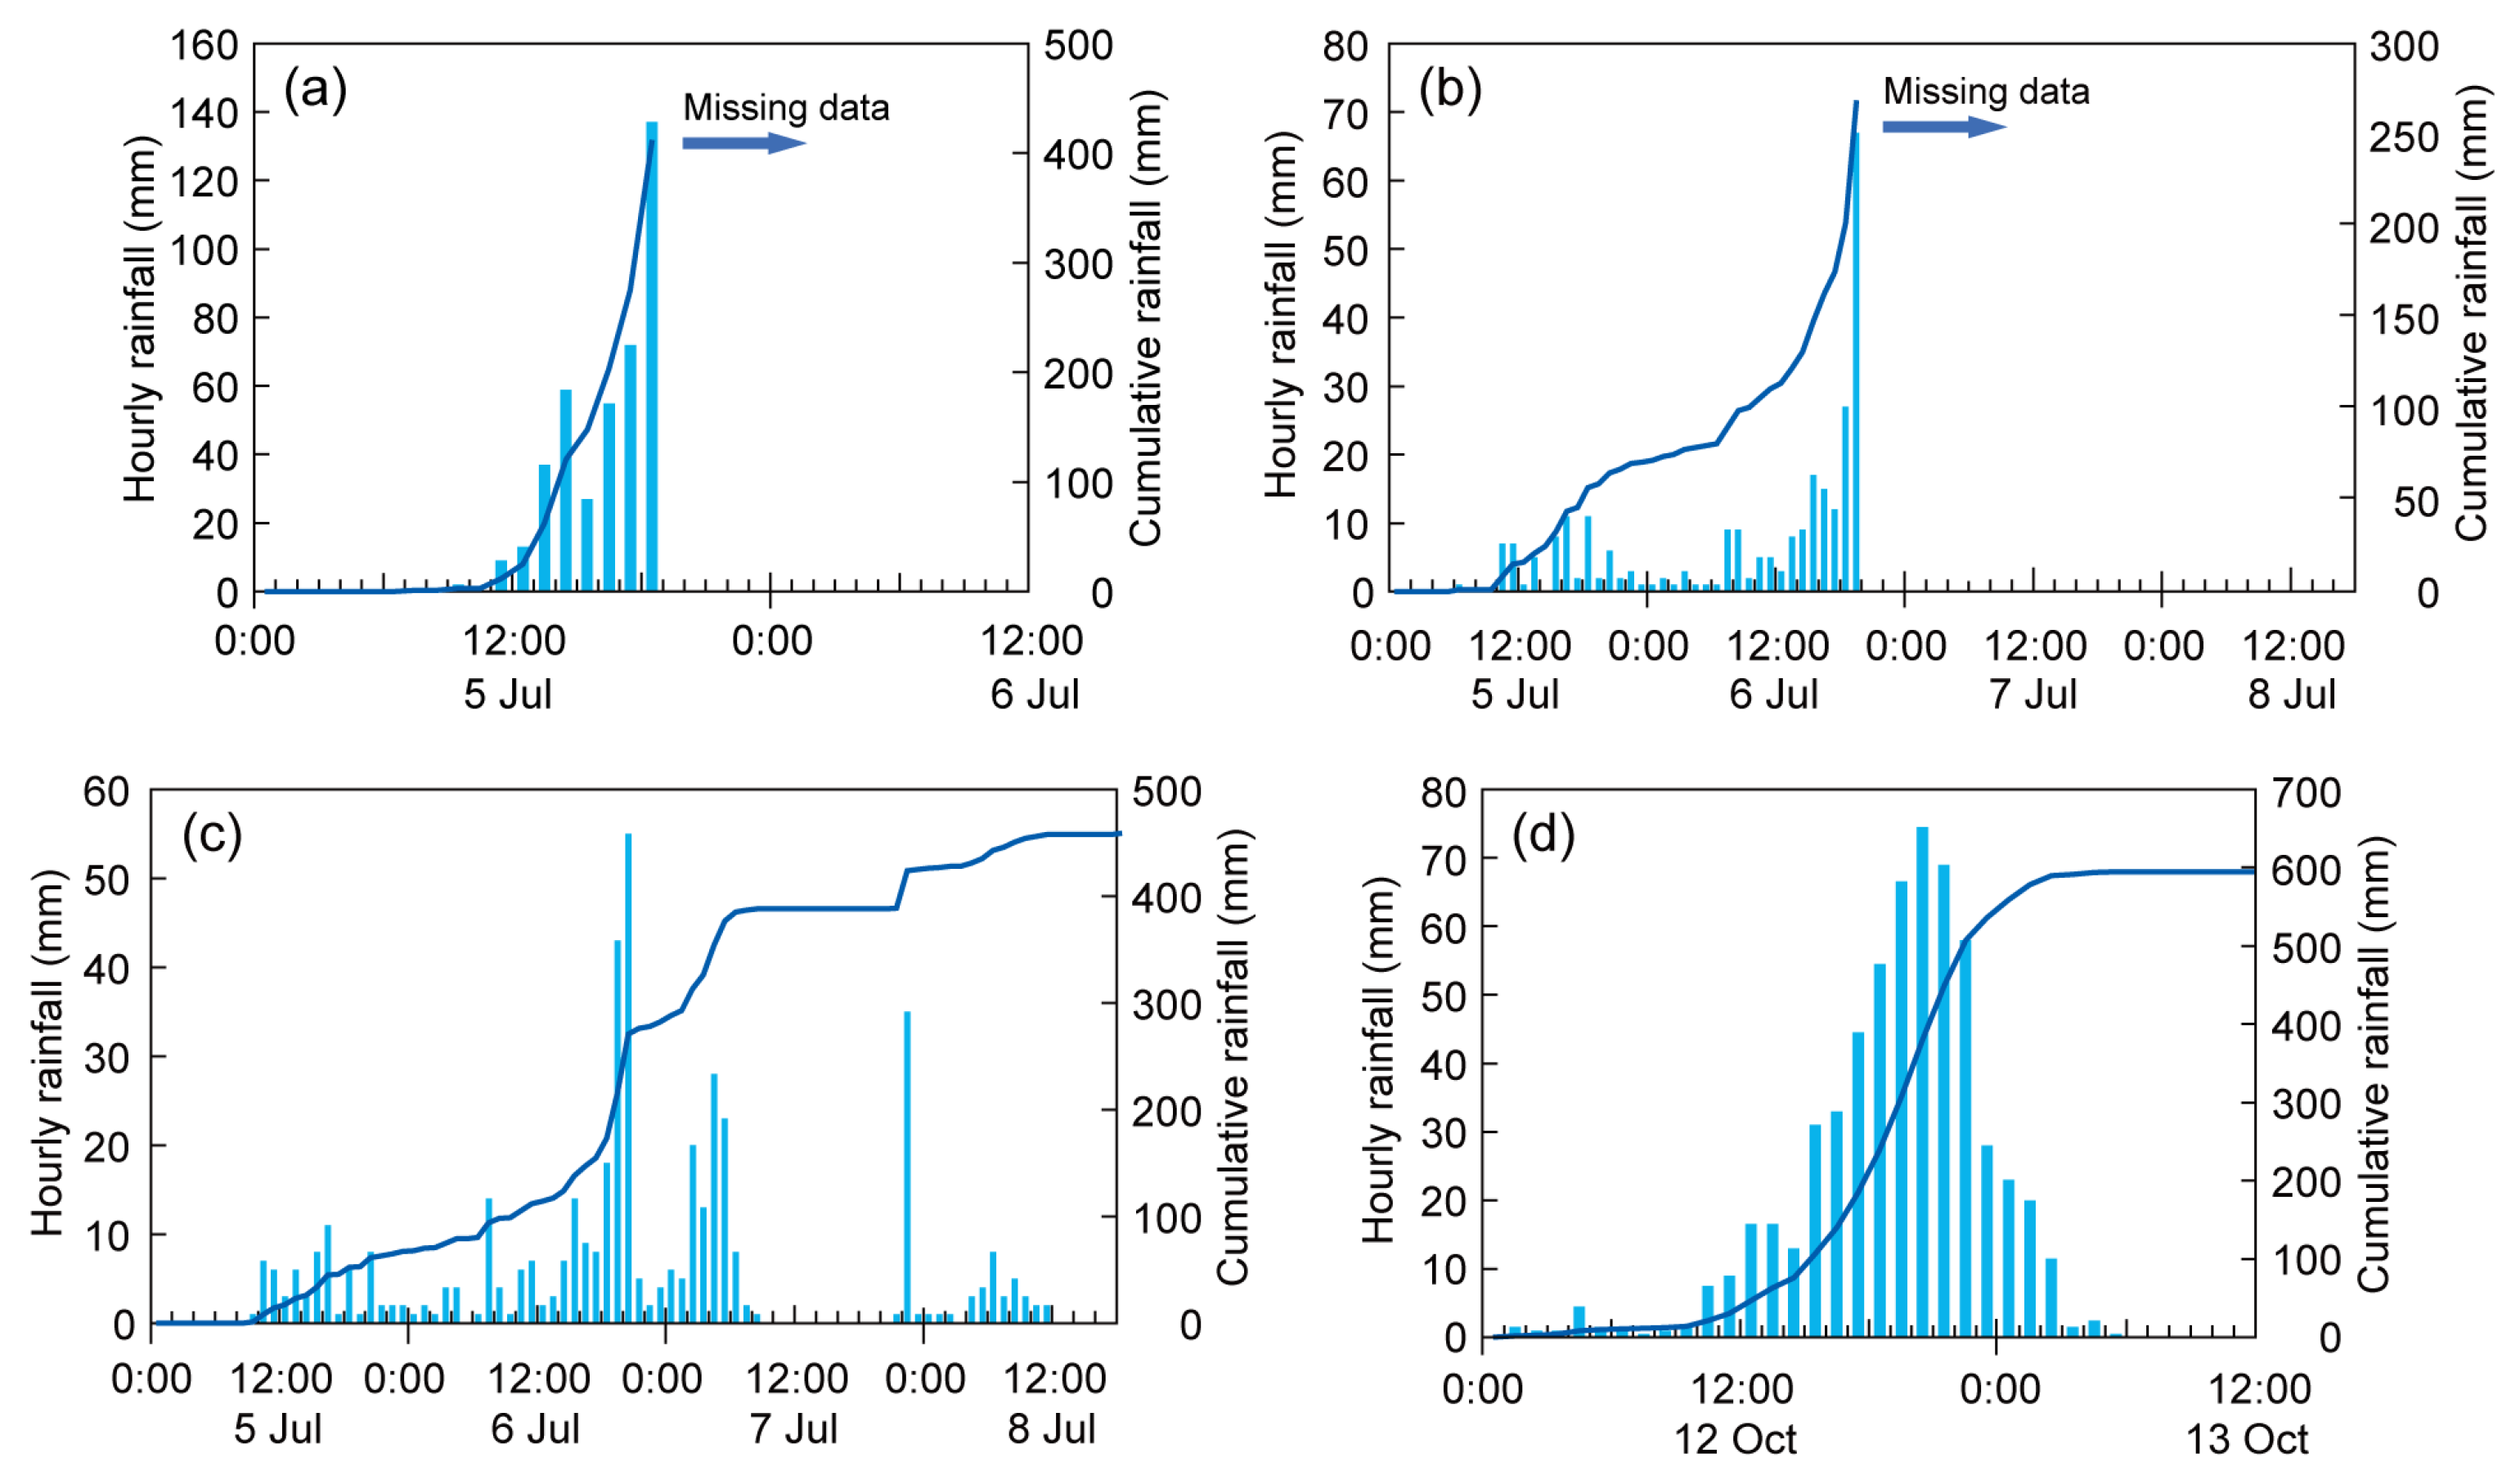
Figure 2 illustrates the study river basins: (a) the Akatani River; (b) the Sozu River, the Tenchi River, and the Oyaokawa River; and (c) the Uchikawa River. All these river basins have experienced flood hazards with sediment and driftwood in recent years. Figure 3 presents the hourly and cumulative rainfall during the recent flood events: (a) the Akatani River basin in the 2017 flood; (b) the Sozu River basin and (c) the Oyaokawa river mouth in the 2018 flood; and (d) the Uchiawa River basin in the 2019 flood. The figure shows how intense the rainfall events were, given that the average annual rainfall in Japan is approximately 1700 mm and that two of the four observation stations have missing data partway through.
The Akatani River drains an area of 20 km2 in northern Kyushu Island, merges with its tributaries such as the Otoishi River and flows into the Chikugo River (Figure 2a). The river basin is composed of mountains, with valley plains and river terraces found predominantly along the main river channel [40]. Northern Kyushu often receives heavy rainfall during the summer rainy season. On 5 July 2017, a heavy hourly rainfall of 137 mm was observed in the middle reach of the basin (Figure 3a), and the total rainfall in the basin exceeded 600 mm [42]. This resulted in landslides, debris flows, and flood flows containing sediment and driftwood. The distribution of landslides and debris flows in mountainous areas suggests that sediment runoff occurs along the valleys, whereas the distribution of flood flows and inundated areas along the major channels indicates that almost all lowland areas are flooded by water and sediment runoff. As a result of extensive cedar afforestation for timber production in this basin, the flooding was accompanied by large amounts of driftwood. According to Egashira et al. [43], traces of landslides, debris flows, and flooding of water, sediment, and driftwood were observed across an area of 2.28 km2. The erosion area accounts for 60–70% of the traces of landslides and debris flows. Given an assumed erosion depth of 1 m, the total apparent volume of sediment production in the entire basin can be estimated to be approximately 1.4–1.6 million m3. The damage caused by these events was extensive, including the washout of buildings, the erosion and sedimentation of farmland, and the destruction of river embankments and revetments over the flooded area [40]. The total number of fatalities, including missing persons, was 35 in Asakura City in Fukuoka Prefecture, where the Akatani River basin is located, and more than half of the deaths occurred in the Akatani River basin [44]. The disaster serves as a reminder of how severe flood hazards with sediment can be in small, mountainous river basins.
Figure 2. The targeted river basins, showing landforms and channel courses. Traces of landslides, debris flows, and flood flows with sediment are shown by blue shading. Distances from the river mouth or confluence points are also shown. (a) Akatani River (20 m contours); (b) Sozu, Tenchi, and Oyaokawa Rivers (40 m contours); and (c) Uchikawa River (50 m contours). The areas of landslides, debris flows, and flooding were identified as follows: in (a) by Nagumo and Egashira [40], in (b) by the Hiroshima University Investigation Team for the July 2018 Heavy Rain Disaster [45], and in (c) by Nagumo and Egashira [41] and the Geospatial Information Authority of Japan [46], respectively. The locations of (a,b,c) are shown on the map of Japan in the upper left. Arrows and squares shown in (ac) correspond to the photo locations shown in Figures 5–7, respectively.
Water 16 03688 g002
The Sozu, Tenchi, and Oyaokawa Rivers have a drainage area of 5 km2, 4 km2, and 6 km2, respectively. All three rivers flow into the eastern Hiroshima Bay (Figure 2b). These river basins are mountainous, with narrow valleys extending deep into the mountains. In addition, alluvial fans have developed in the transitional areas between the mountains and lowlands, and narrow coastal plains and reclaimed lands lie along the coastline [41]. During the July 2018 Western Japan Heavy Rainfall event, an hourly rainfall of 67 mm was observed on 6 July in the Sozu River basin (Figure 3b). An hourly rainfall of 58 mm was recorded on the same day around the river mouth of the Oyaokawa River mouth, and the cumulative rainfall reached 459 mm during this event (Figure 3c). As a result, the Sozu, Tenchi, and Oyaokawa river basins experienced significant sediment runoff along the main valleys; consequently, extensive flooding caused sediment deposition in alluvial fans and coastal plains downstream. Because houses had been densely built in the areas where sediment runoff and flooding occurred, not only structures such as river embankments, bridges, and roads, but also houses received extensive damage [41]. A total of 577 houses were fully or partially destroyed in the Saka area of Saka Town, Hiroshima Prefecture, where the Sozu River basin is located, with one reported casualty. In the Koyaura area of Saka Town, where the Tenchi River basin is located, 645 houses were damaged, with 17 people reported dead or missing [47]. In the Tenno area of Kure City, where the Oyaokawa River basin is located, 311 houses were fully or partially damaged, with 12 reported casualties [48]. Most of these fatalities were caused by sediment-related events, in which people were swept away by sediment while at home or in cars [15].
The Uchikawa River, which has a drainage area of 106 km2, flows through the southern part of the Tohoku region in Japan (Figure 2c). It merges with tributaries, such as the Naramata, Washinohira, Gofukuya, and Shinkawa Rivers, and flows into the Abukuma River. The river basin is mostly mountainous, but an alluvial plain that includes micro-landforms such as natural levees, back marshes, and former river channels developed near the confluence with the Abukuma River. On October 2019, Typhoon Hagibis passed over the Kanto Plain and then across the southern part of the Tohoku region, bringing the maximum hourly rainfall of 74.5 mm and the total rainfall of 594.5 mm to the upper reach of the Uchikawa River basin (Figure 3d). This unusually large amount of rainfall, approximately 2 to 3 times the area’s monthly average for October [49], resulted in numerous landslides, mainly in the middle and lower reaches of the Uchikawa and Gofukuya Rivers, and eroded sediment, which was then transported in these channels. Particularly in the Gofukuya River basin, the proportion of the area affected by landslides relative to the drainage area is similar to that of the Akatani River [50]. As a result, almost all areas of the downstream alluvial plain were inundated by flood flows with sediment, causing the destruction of river embankments and revetments, the erosion and deposition of agricultural land, and the accumulation of driftwood [41]. There were 12 casualties, including dead and missing persons, in Marumori Town in the Uchikawa River basin [51]. According to news reports released immediately after the disaster, among the total casualties in Marumori Town, six were presumed to have lost their lives in the Uchikawa River basin: five in the lowlands and one in the mountains [41].
Figure 3. Hourly and cumulative rainfall during the flood events in the target river basins: (a) Masue primary school station in the Akatani River basin, observed by Fukuoka Prefecture in 2017. The location of the station is shown in Figure 2a; (b) Saka station in the Sozu River basin and (c) Tenno station in the Oyaokawa river mouth, observed by Hiroshima Prefecture in 2018. The locations of the stations are shown in Figure 2b; and (d) Hippo station in the Uchikawa River basin, observed by the Japan Meteorological Agency in 2019. The location of the station is shown in Figure 2c.
Water 16 03688 g003

3. Derivation of an Indicator for Identifying Hazardous Areas

It is assumed that inundation by flood flows with sediment, sometimes accompanied by driftwood, coincides with a rapid decrease in the sediment transport capacity of a river channel during sediment runoff processes. The inundation results in sediment deposition and riverbed aggradation. In general, the sediment transport capacity of a river channel can be described by a sediment transport formula, so the relationship between the sediment transport formula and geomorphic parameters such as the riverbed slope and drainage area can be examined. However, there are two types of sediment transport equations: one for the bed load and the other for suspended sediment. As we discuss in Section 5, the main parameters for these equations are different. Therefore, it is difficult to directly discuss the relationship between the total sediment load formula and geomorphic characteristic values. Thus, this paper uses the bed load formula and examines how the sediment transport capacity can be described in terms of geomorphic characteristic values.
If we evaluate the sediment transport capacity of a river channel with flow width B and bed slope or energy slope i using the bed load formulas, e.g., as in [52,53,54], it can be described in the domain where the bed shear stress is much larger than the critical bed shear stress required to initiate sediment transportation as follows:
Q b ~ τ α B
where ~ shows the proportionality; however, the factors that balance the left-hand side and the right-hand side of the equation are omitted for simplicity. Q b is the sediment transport rate, α is the exponent of non-dimensional bed shear stress for the bed load formulas, and τ is defined as:
τ = h i / ( σ / ρ 1 ) d
where h is the flow depth, σ is the mass density of sediment particles, ρ is the mass density of water, and d is the sediment particle diameter. Applying the Darcy–Weisbach resistance law, the relationship between the flow discharge Q and water depth h can be expressed as follows:
Q = 8 f g h 3 / 2 i 1 / 2 B
where f is the friction factor, and g is the gravitational acceleration. For convenience, Equation (1) can be rewritten as:
Q b ~ τ α B Q Q   .
Substituting Equation (3) into the denominator yields:
Q b ~ Q f 8 g h α 3 / 2 i α 1 / 2 ( σ / ρ 1 ) α d α   .
In bed load formulas such as Equation (1), usually α = 3 / 2   [52,53,54]. Thus, by introducing α = 3 / 2   into Equation (5), the expression is reduced to:
Q b ~ Q i   .
Geomorphic analysis may allow the assumption that the flow discharge Q is proportional to the drainage area A at any cross-section along the river channel. Thus, Equation (6) can be expressed as follows:
Q b ~ A i  
Equation (7) is the same as the equation derived by Nagumo and Egashira [40], using a geomorphic method.
Assuming that the sediment particle size distribution does not change throughout the channel, sediment erosion and deposition can be distinguished by using the following relations:
d ( A i ) / d x     > 0   ( Erosion ) = 0   ( Equilibrium ) < 0   ( Deposition )
where x is the distance from an upstream point to a downstream point along the river channel.
Equation (8) can be discretized as:
A j + 1 i j + 1 A j i j Δ x     > 0 = 0 < 0   .
This relationship can be reformulated as follows:
i j + 1 > i j A j A j + 1   ( Erosion )            
i j + 1 = i j A j A j + 1   ( Equibrium )
i j + 1 < i j A j A j + 1   ( Deposition )
where A j is the drainage area at point j of the channel and i j is the bed slope or energy slope at point j . Equation (10) indicates that the sediment transport capacity is higher downstream than upstream, and erosion takes place between j and j + 1 . It also suggests that erosion occurs even when i j + 1 < i j . Equation (11) means that the sediment transport capacity is the same upstream and downstream. Equation (12) indicates that deposition can occur even when i j + 1 > i j . These relationships imply that sediment transport by flood flows can be appropriately evaluated by using an indicator composed of the product of drainage area A and bed slope i , rather than one based solely on the bed slope. Furthermore, erosion and deposition can be discussed on the basis of the longitudinal distribution of this indicator.

4. Relationship Between Sediment Behavior and the Longitudinal Distribution of A i

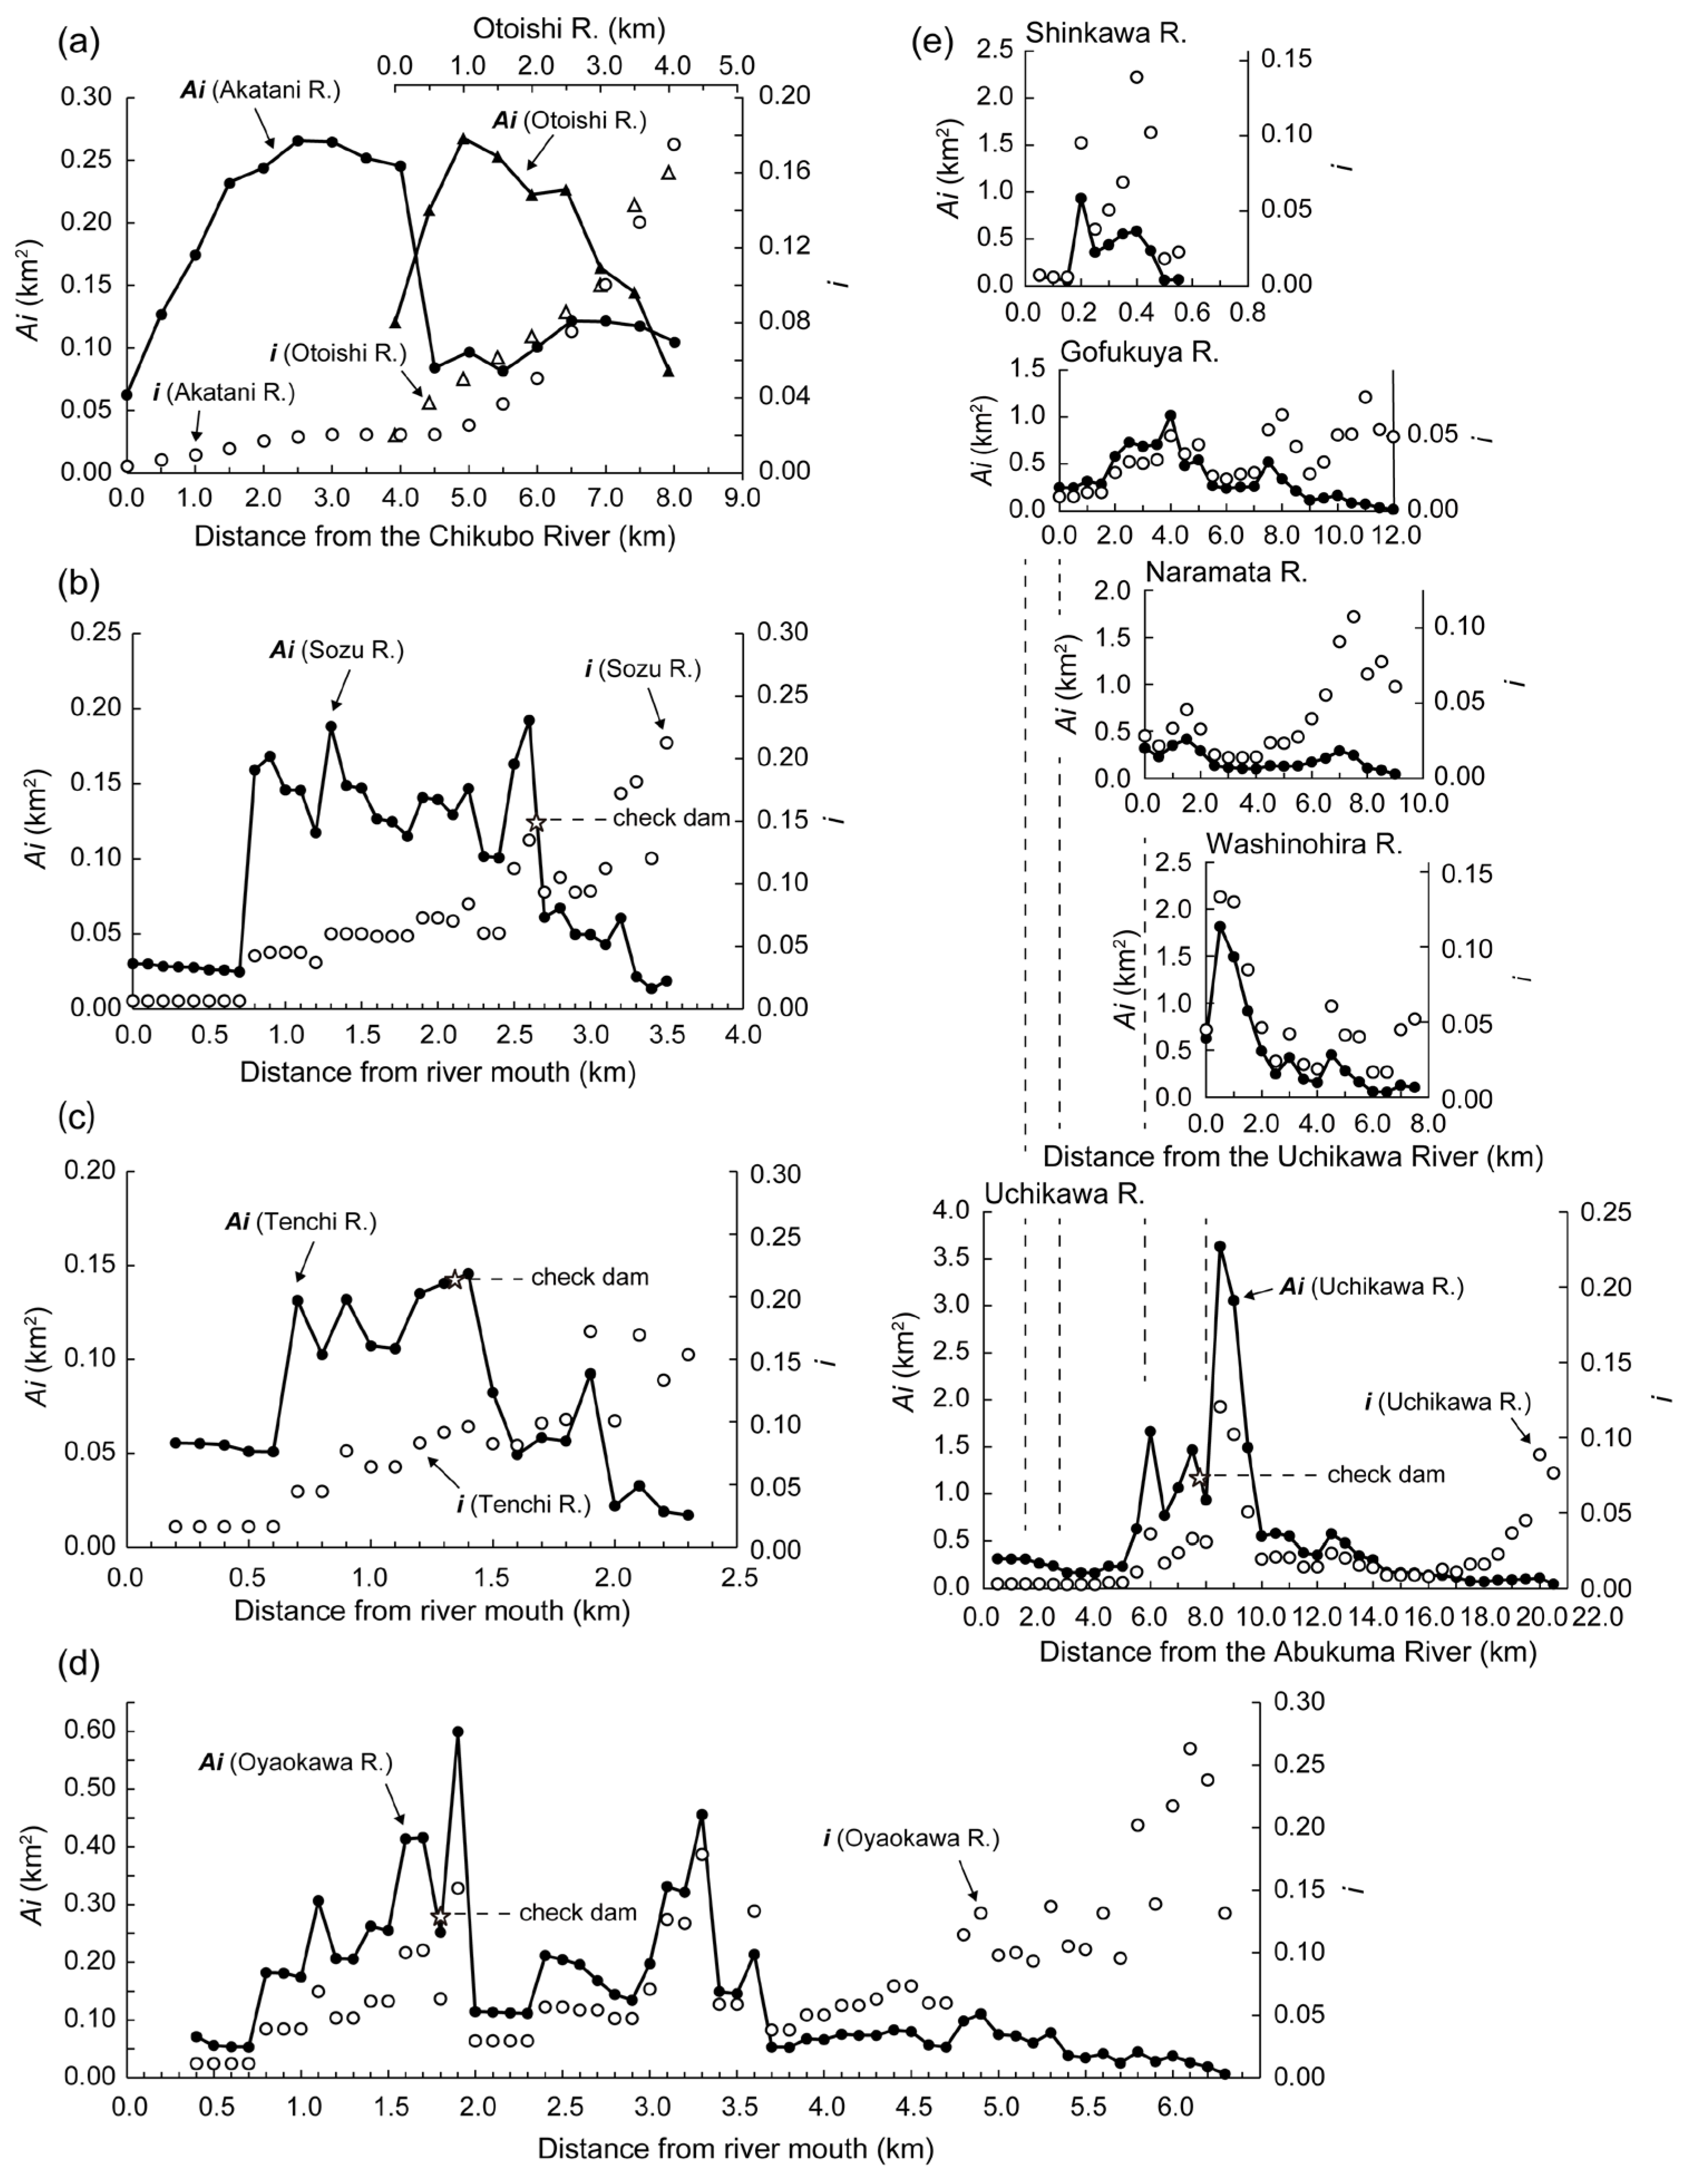
Figure 4 illustrates the longitudinal distributions of geomorphic indicator A i and bed slope i along river channels in the target river basins; (a) is for the Akatani and Otoishi Rivers; (b), (c), and (d) are for the Sozu, Tenchi, and Oyaokawa Rivers, respectively. In addition, (e) is for the Uchikawa River and its major tributaries. Figure 5, Figure 6 and Figure 7 illustrate the damage observed at locations, respectively, along the Akatani and the Otoishi Rivers after the 2017 flood event; along the Sozu, Tenchi, and Oyaokawa Rivers after the 2018 flood event; and along the Uchikawa River and its tributary, the Gofukuya River, after the 2019 flood event.
Along the Otoishi River, the A i increases sharply from the upper reach to the 1.0 km point from the confluence with the Akatani River (Figure 4a), suggesting that the sediment transport rate increases greatly downstream. This means a notably high sediment erodibility in this section. A photo of the Otoishi River at the 2.7 km point after the disaster shows active bed erosion and sediment transport (Figure 5a), as suggested by the changes in A i . In contrast, A i decreases remarkably in the section between the 1.0 km point and the confluence with the Akatani River, implying that deposition became dominant. A large amount of sediment and driftwood deposition can be seen at the 0.3 km point (Figure 5b).
Along the Akatani River, A i changes only slightly from the upper reach to the 4.5 km point, suggesting no significant erosion or deposition. However, A i shows a sharp rise downstream from the confluence with the Otoishi River, indicating an increase in the sediment transport capacity; thus, the sediment supplied from the Otoishi River was actively transported. A i decreases sharply downstream from the 1.5 km point; therefore, sediment deposition should have become dominant in this section. A photo of the area around the 0.2 km point of the Akatani River shows significant sediment flooding and deposition (Figure 5c), which is consistent with the changes in A i .
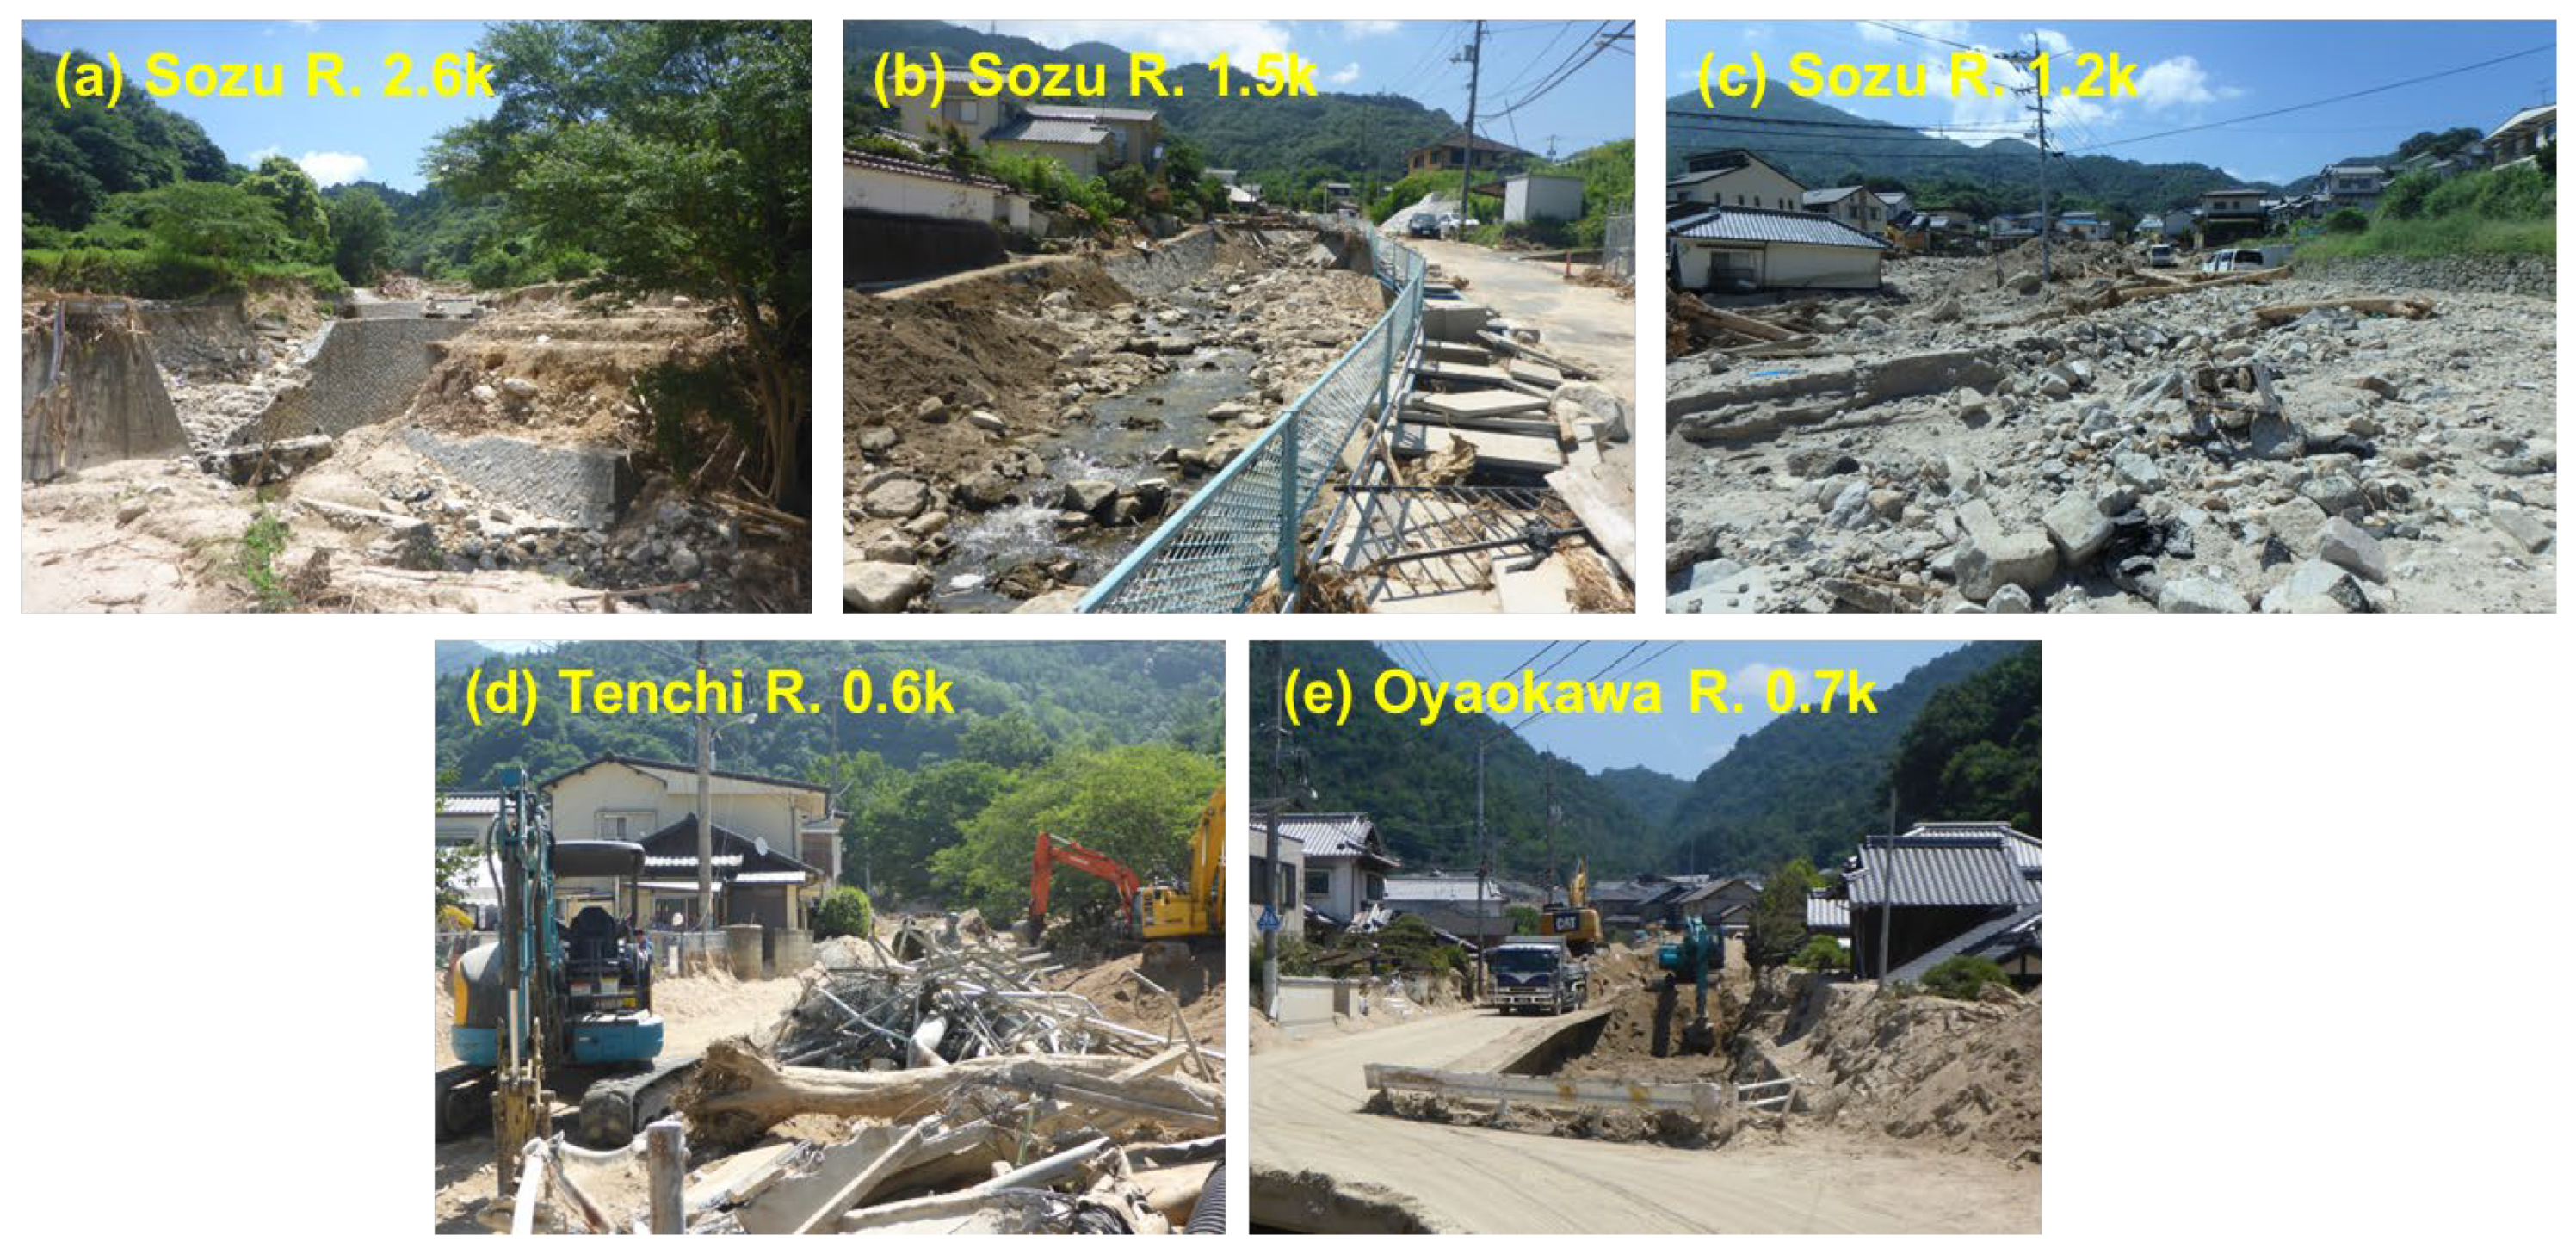
In the case of the Sozu River (Figure 4b), A i gradually increases from the upper reach and peaks at the 2.6 km point. A photo of the Sozu River at the 2.6 km point (Figure 6a) shows a check dam destroyed by powerful bed erosion, as suggested by the rapid increase in A i . A i shows an increasing tendency downstream to the 0.6 km point immediately after a drop between the 2.6 and 2.4 km points; however, there are repeated minor fluctuations, indicating local erosion and deposition at several locations. At the 1.5 km point of the Sozu River, the flood flows caused riverbed erosion (Figure 6b), whereas at the 1.2 km point of the Sozu River (Figure 6c), the channel was filled with a large amount of deposited sediment. These actual flood conditions are consistent with the local changes in A i . The most notable change in A i is evident at the 0.7 km point, with a sharp decrease suggesting large-scale sediment deposition.
The longitudinal distribution of A i along the Tenchi River (Figure 4c) has a similar trend to that along the Sozu River; A i increases in the upper reach and decreases in the lower reach, with a sharp drop at the 0.6 km point. It then shows little change in the most downstream part of the river. Along the Oyaokawa River (Figure 4d), A i shows similar changes, with a gradual decrease downstream from the 1.9 km point and little change downstream from the 0.7 km point. At the 0.6 km point along the Tenchi River (Figure 6d), the river channel is unrecognizable because it is completely filled with sediment, reflecting the severe flooding in the surrounding area. In the area around the 0.7 km point along the Oyaokawa River (Figure 6e), the houses along the river channel were buried in sediment up to the first-floor level after the flooding.
In the Uchikawa River (Figure 4e), A i peaks at the 8.5 km point from the river mouth, but drops sharply at the 8.0 km points. In addition, A i again decreases notably between the 6.0 km and 5.0 km points, where flooding occurred. Figure 7a illustrates this situation: overflow began on the left bank downstream of the 6.0 km point and sediment flowed over the right bank, breaching the embankment at the 5.5 km point. The sediment inundation observed downstream of the 5.0 km point was not due to a dike breach but was caused by sediment transported by the flood flows from upstream. The situation along the lower reach of the Gofukuya River (Figure 7b), a tributary of the Uchikawa River, shows that flooding started at the 2.0 km point, causing significant sediment deposition and channel changes downstream. Figure 7c shows thick sediment deposition occurred in the surrounding area. Consistent with the relationship shown in Figure 4e, A i decreases between the 2.5 km and 1.5 km points of the Gofukuya River.
During the flood disasters along these rivers, erosion occurred in the sections where the A i increased, and sediment deposition occurred in the sections where the A i decreased. These results suggest that erosion, deposition, and other associated sediment phenomena that occur along the rivers can be explained by the increases and decreases in this geomorphic indicator A i . The following section investigates the longitudinal distributions of the geomorphic indicator and the sediment transport capacity of river channels by computing them using the sediment transport formulas for the bed load and suspended load, and discusses the relationship between the sediment transport formulas and the geomorphic indicator.

5. Longitudinal Profiles of Sediment Transport Capacity and the Geomorphic Indicator

5.1. Hydrodynamic Evaluation of Sediment Transport Capacity

The results presented in Section 4 suggest that flooding and sediment inundation occur in areas where the geomorphic indicator A i decreases rapidly in the flow direction, emphasizing that A i reflects the sediment transport capacity in hydraulic terms. In fact, as shown in Section 3, A i was derived by using a power exponent of 3/2 for bed shear stress in the bed load formula employed in this paper. However, several bed load formulas use a power exponent of 5/2 or a similar value, e.g., those employed in [55,56,57,58]. Besides, it is widely recognized that suspended sediment is often dominant in the erosion and transport processes of primary sediment. Thus, it is necessary to consider both the bed load and suspended load, that is, the total load.
The sediment transport capacity of flood flows in a river channel can be computed by using the flow discharge, the longitudinal and cross-sectional profiles of the river channel, and the sediment’s physical characteristics. Although the sediment transport capacity changes temporally and spatially, it is sufficient to compute it under steady-flow conditions. Thus, we selected two of the mountainous rivers discussed previously and conducted one-dimensional flow computations to obtain the profiles of the total sediment load along the river channels.
The basic equations employed to compute the sediment transport capacity are as follows:
d d x ( 1 2 g ( Q B h ) 2 + h + z b ) = n 2 Q 2 B 2 h 10 / 3
d Q / d x = q
Q b = B q b
Q s = c e Q
where Q is the flow discharge, B is the flow width, h is the flow depth, z b is the channel bed elevation, n is the Manning’s roughness, q is the lateral inflow per unit channel length, g is the gravitational acceleration, x is the along-flow coordinate, Q b is the bed load transport rate, q b is the bed load transport rate per unit width, Q s is the suspended load, and c e is the cross-sectional average equilibrium concentration of the suspended sediment.
The different equations for the bed load rate in unit width that have been proposed [52,53,54,55,56,57,58] can be roughly classified into three types by focusing on the key variables τ 3 / 2 , τ m ( 3 / 2 < m < 5 / 2 ) , and τ 5 / 2 , where τ is the non-dimensional bed shear stress defined as τ = h i { ( σ ρ 1 ) d } . We use the following bed load formulas proposed by Ashida and Michiue [54] and Egashira et al. [58], respectively:
q b = 17 { ( σ ρ 1 ) g d 3 } 1 / 2 τ e 3 / 2 ( 1 τ c / τ ) ( 1 u c / u )
q b = 4.4 [ ( σ / ρ 1 ) g d 3 ] 1 / 2 τ 5 / 2
where σ is the mass density of the sediment particles, ρ is the mass density of the water, d is the reference sediment particle diameter, τ is the non-dimensional bed shear stress, u is the shear velocity, τ c is the non-dimensional critical bed shear stress, u c is the critical shear velocity, τ e is the effective bed shear stress defined as τ e = u e 2 / ( σ / ρ 1 ) g d , and u e is the effective bed shear velocity defined by:
v u e = 6.0 + 2.5 l n h ( 1 + 2 τ ) d
where v is the average flow velocity.
There are numerous studies on suspended sediment, e.g., [59,60,61,62,63,64,65], that discuss the reference sediment concentration at the reference level in relation to the associated diffusion equation. However, we employ the equilibrium sediment concentration of suspended sediment predicted by Harada et al. [66], which was derived using the concept of entrainment for density stratified flows, as follows:
c e = K σ / ρ 1   v w 0   v 2 g h
where w 0 is the fall velocity of the sediment particles in the bed load layer [58] and K is a coefficient relating the entrainment coefficient to Richardson’s number ( K = 0.0015 [66]).
We computed the sediment transport capacity for the Akatani and Otoishi Rivers and the Sozu River using Equations (15) and (16). The flow discharges in these channels were specified using the peak flow discharges at their downstream ends during the 2017 flood event and the ratio of the drainage area at any cross-section to the drainage area at the downstream end. The cross-sectional shape of each channel was specified as a prismatic open channel with width B , where the flow widths and bed slopes were determined using aerial photographs and topographic maps. Manning’s roughness was specified as 0.04 ( m 1 / 3 s ) based on field investigations and our experience with flow resistances for mountain rivers. By evaluating water surface profiles and the corresponding bed shear stress in the flow direction, we obtained a longitudinal profile of the sediment transport capacity for each target channel. Because our objective was to compare the longitudinal distribution of the geomorphic indicator A i with the sediment transport capacity computed by a hydrodynamic model, the sediment particle size was assumed to be uniform and specified as 1 mm for simplicity.
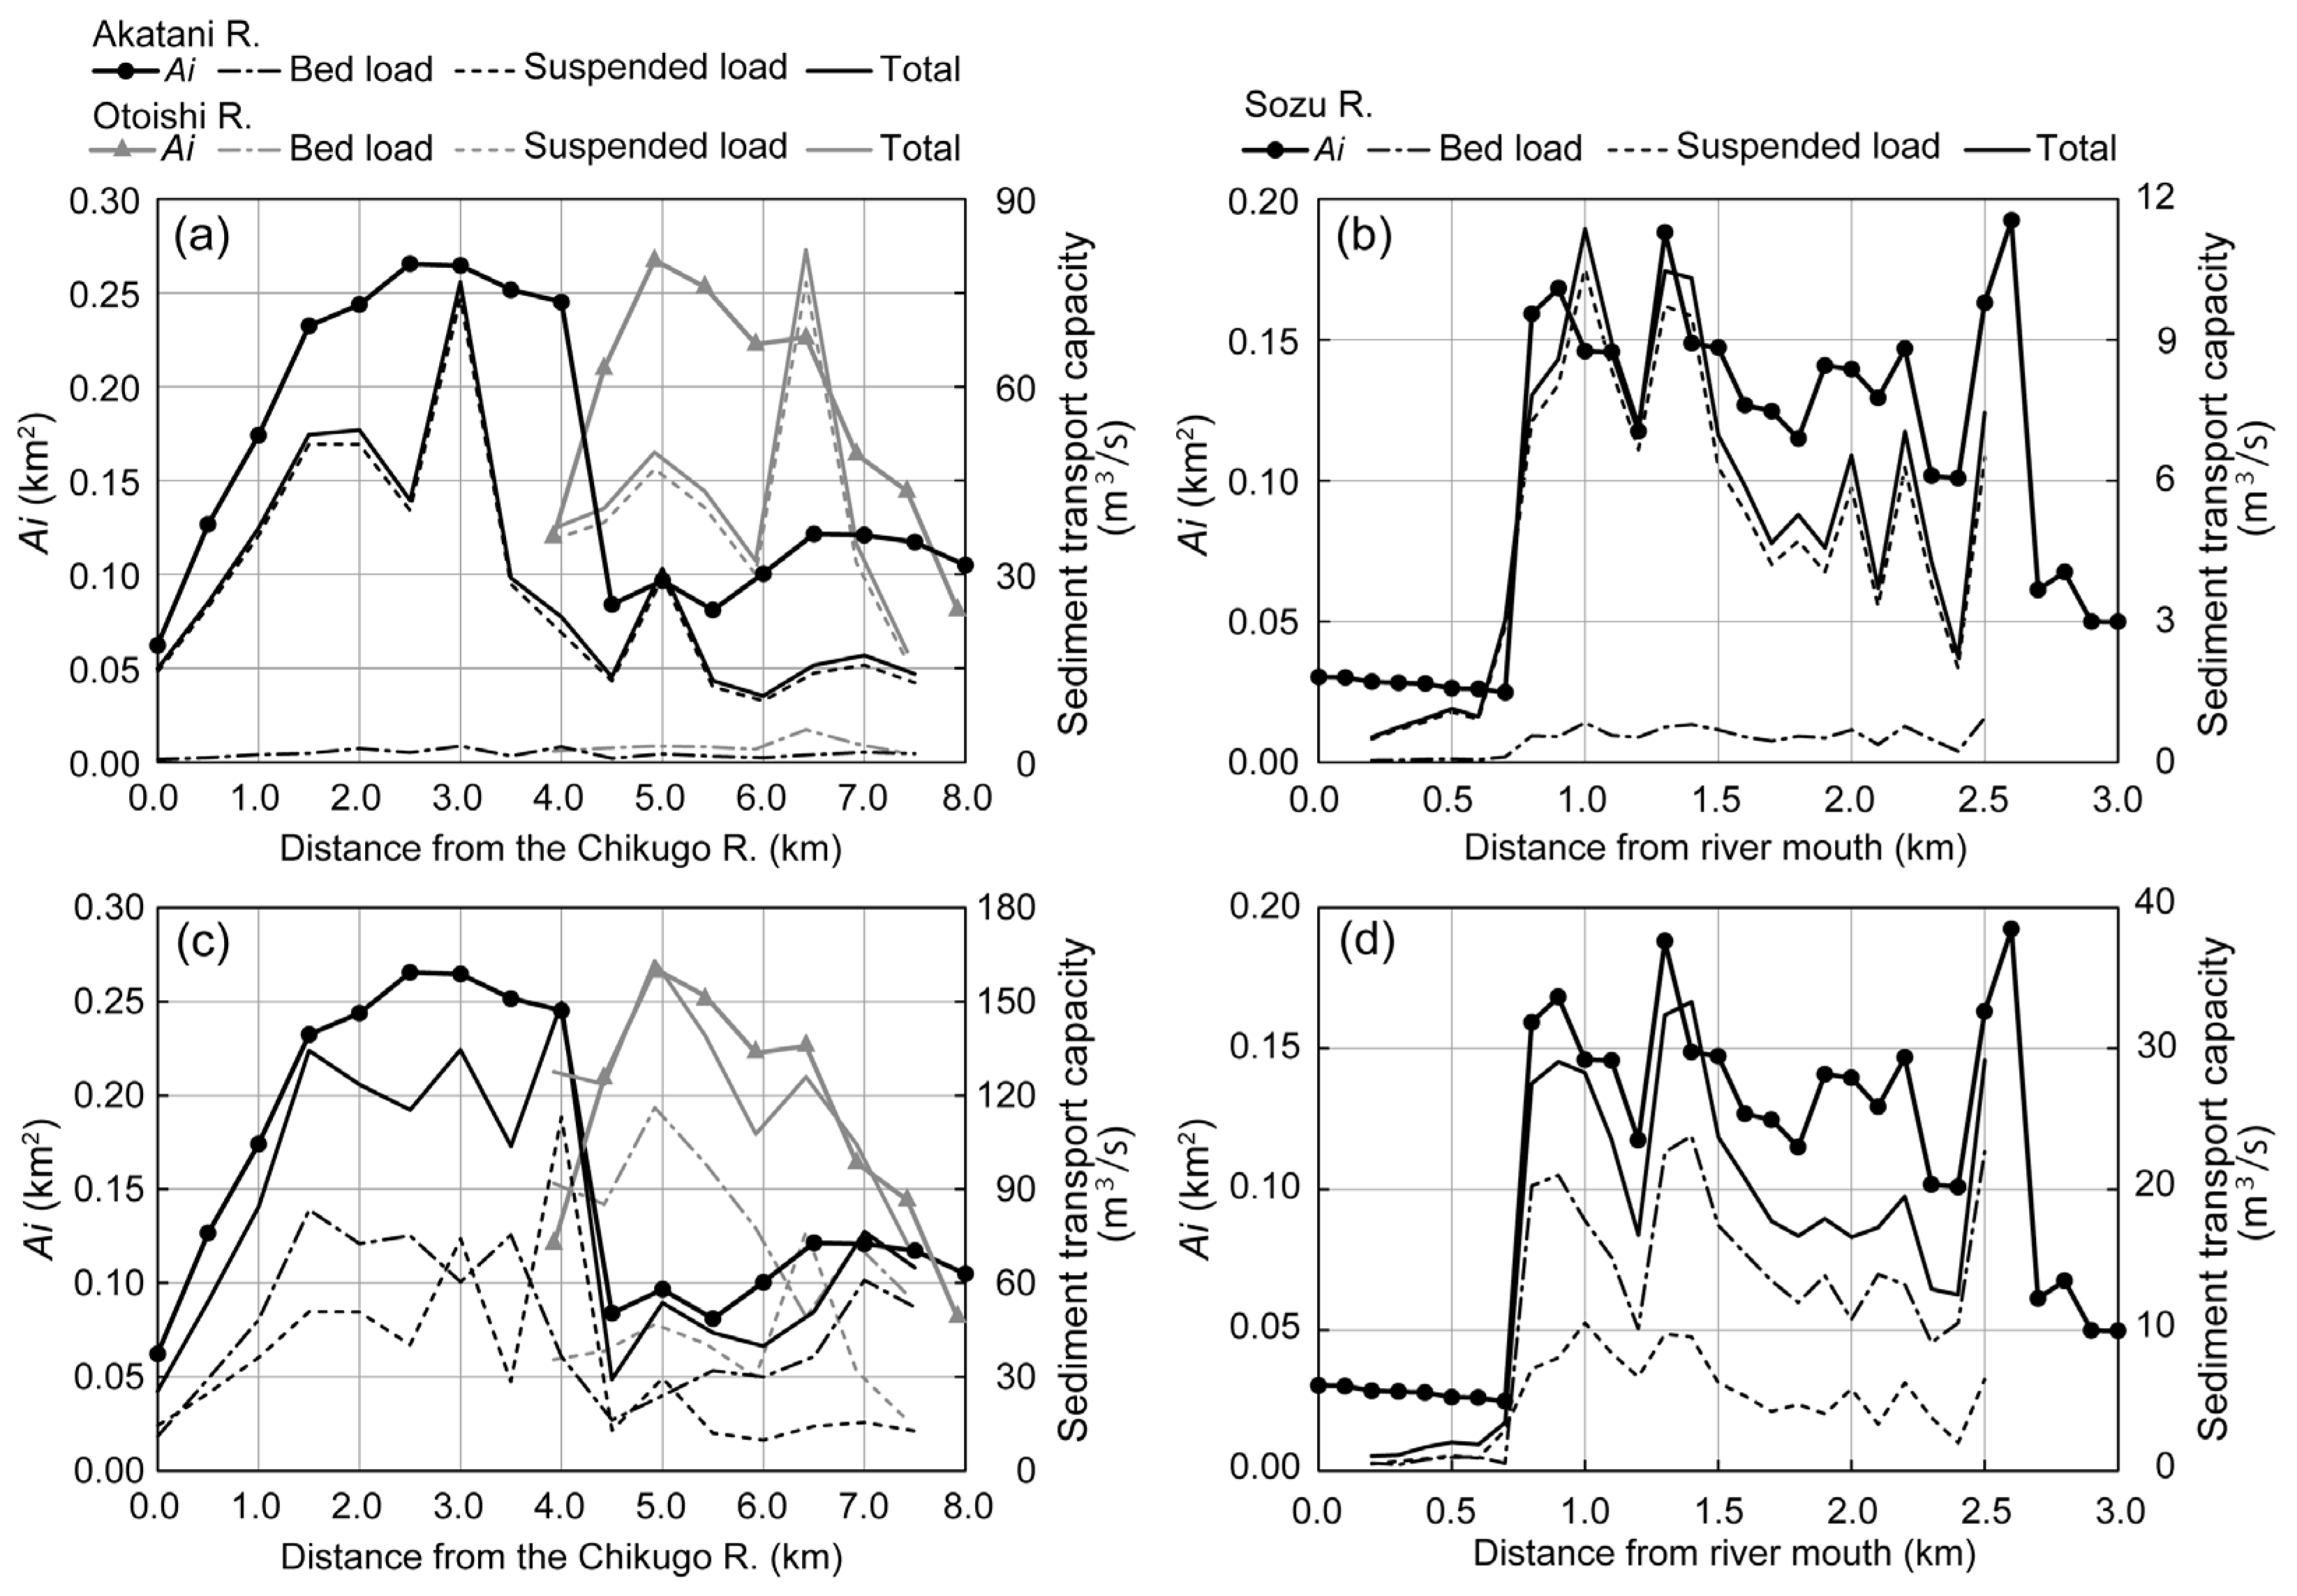
Figure 8 illustrates the longitudinal profiles of the computed sediment transport capacities for the Akatani and Otoishi Rivers and the Sozu River in addition to the longitudinal distributions of A i (Figure 4a,b). The profiles illustrated in Figure 8a,b were computed by using Equations (15) and (17) for the bed load and Equations (16) and (20) for the suspended load, and those in Figure 8c,d by using Equations (15) and (18) for the bed load and Equations (16) and (20) for the suspended load. The sediment transport capacity and the geomorphic indicator differ in physical quantity and units. Thus, we cannot directly compare their absolute values, but can compare their qualitative characteristics such as increases or decreases along the river channel. In addition, although the bed load discharge computed by Equation (17) is much lower than the result computed by Equation (18), this difference is considered a minor problem for the present discussion.
The changes in sediment transport capacity are similar to those in the distribution of A i . In particular, the profiles of the sediment transport capacity illustrated in Figure 8c,d are very similar to those of the geomorphic indicator. This result suggests that the geomorphic indicator A i and its longitudinal distribution can be a suitable indicator for identifying hazardous areas where the sediment transport capacity decreases abruptly along the river channel.

5.2. Relationship Between Sediment Transport Capacity and the Geomorphic Indicator

The results shown in Figure 8c,d suggest that the longitudinal profiles and variations of the total load are similar to the longitudinal distribution of the geomorphic indicator A i , although their absolute values cannot be compared directly due to differences in their physical quantities. Thus, we investigate the sediment transport capacities evaluated by Equations (18) and (20) in relation to A i .
Using the method employed in Section 3, the sediment transport capacity evaluated by Equation (18) with the 5/2 power of non-dimensional bed shear stress can be formulated as follows:
Q b ~ τ 5 / 2 B ~ τ τ 3 / 2 B ~ τ A i .
Equation (21) emphasizes that the sediment transport capacity identified by a different bed load formula from the equation with the power exponent of 3/2 shows a similar change to the geomorphic indicator A i , taking into account the fact that the bed shear stress increases with increases in the geomorphic indicator.
The equilibrium concentration of the suspended load described by Equation (20) can be formulated by using the friction factor defined by the Darcy–Weisbach resistance law as follows:
c e ~ v w 0 i f
where f is the friction factor. The suspended load can thus be described by the product of the flow discharge and equilibrium sediment concentration, as follows:
Q s ~ ( v / w 0 ) Q i ~ ( v / w 0 ) A i .
Equation (23) shows that the transport rate of the suspended sediment also changes similarly to the geomorphic indicator A i . This means that the geomorphic indicator can be employed as an indicator to evaluate the sediment transport capacity. In addition, Equations (21) and (23) emphasize that the sediment transport capacity evaluated by the total load changes similarly to the geomorphologic indicator. This highlights that the geomorphic indicator and its longitudinal distribution are reflective of the sediment transport capacity.

6. Conclusions

The sediment transport characteristics of small, mountainous river basins were examined in this paper. In these rivers, flood flows erode debris flow deposits and transport the sediment to areas where the sediment transport capacity suddenly decreases. These areas coincide with areas often subjected to severe damage due to inundation by flood flows with sediment. Such hazards have recently been observed in Japan and can also occur in numerous river basins across the world. We have thus proposed a geomorphic indicator to identify areas prone to inundation by flood flows with sediment in advance.
Focusing on the sediment transport process and the change in landforms by flood flows, we have explained that the proposed geomorphic indicator, defined as the product of drainage area A and bed slope i at a given cross-section, can be used to appropriately represent the longitudinal distribution of the sediment transport capacity of a river channel. We have also pointed out the characteristics of erosion and deposition that cannot be evaluated when solely considering bed slope. For example, erosion can occur even downstream where the bed slope is smaller than upstream. These characteristics can be understood by monitoring changes in the proposed geomorphic indicator at upstream and downstream cross-sections.
We have verified the indicator’s applicability by applying it to actual rivers and comparing the results with recent flood event outcomes. We have confirmed that the indicator can effectively represent the processes of sediment erosion, transport, and deposition. Moreover, it can explain the occurrence of inundation by flood flows with sediment without any contradictions. In addition, the longitudinal distribution of the sediment transport capacity represented by A i is consistent with the longitudinal profile of the sediment transport capacity calculated using formulas for both the bed load and suspended load. Therefore, we have concluded that A i is an effective indicator for identifying areas prone to inundation by flood flows with sediment.
Many river basins around the world generally have areas that are hazardous due to inundation by flood flows with sediment and the associated landform changes, but it has been challenging to identify these areas in many river basins. However, with the geomorphic indicator A i , it is possible to detect hazardous areas easily and prioritize locations for implementing countermeasures. It is also possible to conduct further analysis using simulation models to compute potential flood flows in detail and design necessary measures.
Our geomorphic indicator is derived from a bed load formula characterized by a dimensionless bed shear stress raised to the 3/2 power. Thus, for verification, we investigated its applicability to calculate the total load based on another bed load formula in which the non-dimensional bed shear stress is raised to the 5/2 power and a formula for an equilibrium concentration of suspended sediment. The results confirmed that the total load shows similar quantitative characteristics to the longitudinal distribution of the geomorphic indicator A i . However, more research is necessary to increase the reliability of the geomorphic indicator A i as a practical tool to identify areas prone to inundation by flood flows with active sediment transport.

Author Contributions

Conceptualization, N.N. and S.E.; Methodology, S.E.; Analysis and figure creation; N.N. and D.H.; writing, N.N. and S.E. All authors have read and agreed to the published version of the manuscript.

Funding

This work was funded by JSPS KAKENHI Grant Number JP21K01025.

Data Availability Statement

Data is contained within the article.

Acknowledgments

This paper is based on research findings at the International Centre for Water Hazard and Risk Management (ICHARM) of the Public Works Research Institute (PWRI). We would like to express our gratitude to the members who supported our research.

Conflicts of Interest

The authors declare no conflicts of interest.

References

  1. Takahashi, Y.; Sakaguchi, Y. Rivers in Japan. Kagaku 1976, 46, 488–499. (In Japanese) [Google Scholar]
  2. Yoshikawa, T. Geomorphology of Tectonically Active and Intensely Denuded Regions. Geog. Rev. Jpn. Ser. A 1984, 57, 691–702. (In Japanese) [Google Scholar] [CrossRef]
  3. Oya, M.; Nakayama, M.; Takagi, I. Studies on the Geomorphological Features of the Fluvial Plains in Japan Focusing the Distribution, Geomorphological Land Classification and Its Application. Geog. Rev. Jpn. Ser. B 1988, 61, 35–49. [Google Scholar] [CrossRef]
  4. Ohmori, H.; Shimazu, H. Distribution of Hazard Types in a Drainage Basin and Its Relation to Geomorphological Setting. Geomorphology 1994, 10, 95–106. [Google Scholar] [CrossRef]
  5. Ohmori, H. Geomorphological Characteristics of Longitudinal Profiles of the Rivers in Japan, Taiwan and New Zealand. Trans. Jpn. Geomorphol. Union 1997, 18, 349–364. [Google Scholar]
  6. Oguchi, T.; Saito, K.; Kadomura, H.; Grossman, M. Fluvial Geomorphology and Paleohydrology in Japan. Geomorphology 2001, 39, 3–19. [Google Scholar] [CrossRef]
  7. Sediment Disaster Prevention Act. Available online: https://laws.e-gov.go.jp/law/412AC0000000057/ (accessed on 4 July 2024). (In Japanese)
  8. Uchida, T.; Nishimoto, H.; Osanai, N.; Shimizu, T. Countermeasures for Sediment-related Disasters in Japan Using Hazard Maps. Int. J. Eros. Control Eng. 2009, 2, 46–53. [Google Scholar] [CrossRef]
  9. Osanai, N.; Shimizu, T.; Kuramoto, K.; Kojima, S.; Noro, T. Japanese Early-warning for Debris Flows and Slope Failures Using Rainfall Indices with Radial Basis Function Network. Landslides 2010, 7, 325–338. [Google Scholar] [CrossRef]
  10. Kanbara, J.; Imamori, N. Outline of Measures for Sediment Disaster by the Sabo Department of MLIT, Japan. Landslides 2020, 17, 2503–2513. [Google Scholar]
  11. Furuichi, T.; Osanai, N.; Hayashi, S.; Izumi, N.; Kyuka, T.; Shiono, Y.; Miyazaki, T.; Hayakawa, T.; Nagano, N.; Matsuoka, N. Disastrous Sediment Discharge due to Typhoon-Induced Heavy Rainfall over Fossil Periglacial Catchments in Western Tokachi, Hokkaido, Northern Japan. Landslides 2018, 15, 1645–1655. [Google Scholar] [CrossRef]
  12. Hashimoto, A.; Oshikawa, H.; Komatsu, T. Characteristics of the 2017 Flood Disaster in Northern Kyushu and Learned Lessons. J. Jpn. Soc. Civ. Eng. B1 2018, 74, I_1087–I_1092. (In Japanese) [Google Scholar] [CrossRef] [PubMed]
  13. Goto, H.; Kumahara, Y.; Uchiyama, S.; Iwasa, Y.; Yamanaka, T.; Motoyoshi, R.; Takeuchi, S.; Murata, S.; Nakata, T. Distribution and Characteristics of Slope Movements in the Southern Part of Hiroshima Prefecture Caused by the Heavy Rain in Western Japan in July 2018. J. Disaster Res. 2019, 14, 894–902. [Google Scholar] [CrossRef]
  14. Mori, S.; Ono, K. Landslide Disasters in Ehime Prefecture Resulting from the July 2018 Heavy Rain Event in Japan. Soils Found. 2019, 59, 2396–2409. [Google Scholar] [CrossRef]
  15. Ohara, M.; Nagumo, N. Mortality by Age Group and Municipality in the July 2018 Torrential Rainfall. J. Disaster Res. 2019, 14, 912–921. [Google Scholar] [CrossRef]
  16. Hashimoto, R.; Tsuchida, T.; Moriwaki, T.; Kano, S. Hiroshima Prefecture Geo-disasters due to Western Japan Torrential Rainfall in July 2018. Soils Found. 2020, 60, 283–299. [Google Scholar] [CrossRef]
  17. Moriguchi, S.; Matsugi, H.; Ochiai, T.; Yoshikawa, S.; Inagaki, H.; Ueno, S.; Suzuki, M.; Tobita, Y.; Chida, T.; Takahashi, K.; et al. Survey Report on Damage Caused by 2019 Typhoon Hagibis in Marumori Town, Miyagi Prefecture, Japan. Soils Found. 2021, 61, 586–599. [Google Scholar] [CrossRef]
  18. Rickenmann, D.; Zimmermann, M. The 1987 Debris Flows in Switzerland: Documentation and Analysis. Geomorphology 1993, 8, 175–189. [Google Scholar] [CrossRef]
  19. van Steijn, H. Debris-flow Magnitude—Frequency Relationships for Mountainous Regions of Central and Northwest Europe. Geomorphology 1996, 15, 259–273. [Google Scholar] [CrossRef]
  20. Rickenmann, D. Empirical Relationships for Debris Flows. Nat. Hazards 1999, 19, 47–77. [Google Scholar] [CrossRef]
  21. Iverson, R.M.; Reid, M.E.; Iverson, N.R.; LaHusen, R.G.; Logan, M.; Mann, J.E.; Brien, D.L. Acute Sensitivity of Landslide Rates to Initial Soil Porosity. Science 2000, 290, 513–516. [Google Scholar] [CrossRef] [PubMed]
  22. Marchi, L.; D’Agostino, V. Estimation of Debris-flow Magnitude in the Eastern Italian Alps. Earth Surf. Process. Landf. 2004, 29, 207–220. [Google Scholar] [CrossRef]
  23. Li, Y.; Zhou, X.; Su, P.; Kong, Y.; Liu, J. A Scaling Distribution for Grain Composition of Debris Flow. Geomorphology 2013, 192, 30–42. [Google Scholar]
  24. Theule, J.I.; Liébault, F.; Laigle, D.; Loye, A.; Jaboyedoff, M. Channel Scour and Fill by Debris Flows and Bedload Transport. Geomorphology 2015, 243, 92–105. [Google Scholar] [CrossRef]
  25. Takebayashi, H.; Fujita, M. Numerical Simulation of a Debris Flow on the Basis of a Two-dimensional Continuum Body Model. Geosciences 2020, 10, 45. [Google Scholar] [CrossRef]
  26. Scorpio, V.; Cavalli, M.; Steger, S.; Crema, S.; Marra, F.; Zaramella, M.; Borga, M.; Marchi, L.; Comiti, F. Storm Characteristics Dictate Sediment Dynamics and Geomorphic Changes in Mountain Channels: A Case Study in the Italian Alps. Geomorphology 2022, 403, 108173. [Google Scholar] [CrossRef]
  27. Pudasaini, S.P.; Krautblatter, M. The Mechanics of Landslide Mobility with Erosion. Nat. Commun. 2021, 12, 6793. [Google Scholar] [CrossRef]
  28. Tal, M.; Paola, C. Dynamic Single-Thread Channels Maintained by the Interaction of Flow and Vegetation. Geology 2007, 35, 347–350. [Google Scholar] [CrossRef]
  29. Egozi, R.; Ashmore, P. Experimental Analysis of Braided Channel Pattern Response to Increased Discharge. J. Geophys. Res. Earth Surf. 2009, 114, F02012. [Google Scholar] [CrossRef]
  30. Kleinhans, M.G.; van den Berg, J.H. River Channel and Bar Patterns Explained and Predicted by an Empirical and a Physics-based Method. Earth Surf. Process. Landf. 2010, 36, 721–738. [Google Scholar] [CrossRef]
  31. Asahi, K.; Shimizu, Y.; Nelson, J.; Parker, G. Numerical Simulation of River Meandering with Self-evolving Banks. J. Geophys. Res. Earth Surf. 2013, 118, 2208–2229. [Google Scholar] [CrossRef]
  32. Wickert, A.D.; Martin, J.M.; Tal, M.; Kim, W.; Sheets, B.; Paola, C. River Channel Lateral Mobility: Metrics, Time Scales, and Controls. J. Geophys. Res. Earth Surf. 2013, 118, 396–412. [Google Scholar] [CrossRef]
  33. Okitsu, T.; Iwasaki, T.; Kyuka, T.; Shimizu, Y. The Role of Large-Scale Bedforms in Driftwood Storage Mechanism in Rivers. Water 2021, 13, 811. [Google Scholar] [CrossRef]
  34. Rachelly, C.; Vetsch, D.F.; Boes, R.M.; Weitbrecht, V. Sediment Supply Control on Morphodynamic Processes in Gravel-Bed River Widenings. Earth Surf. Process. Landf. 2022, 47, 3415–3434. [Google Scholar] [CrossRef]
  35. Yamazaki, Y.; Egashira, S.; Nagumo, N. Method to Predict Sediment Runoff Resulting from Landslides and Debris Flows. In Scour and Erosion IX, Proceedings of the 9th International Conference on Scour and Erosion (ICSE 2018), Taipei, Taiwan, 5–8 November 2018; CRC Press/Balkema: Leiden, The Netherlands, 2019; Volume 9, pp. 683–688. [Google Scholar]
  36. Harada, D.; Egashira, S.; Kakinuma, D.; Nagumo, N.; Ito, H. Characteristics of Flood Flow with a Large Amount of Sediment in the Gofukuya River in the Typhoon No.19, 2019. Adv. River Eng. 2020, 26, 609–614. (In Japanese) [Google Scholar]
  37. Kyuka, T.; Okabe, K.; Shimizu, Y.; Yamaguchi, S.; Hasegawa, K.; Shinjo, K. Dominating Factors Influencing Rapid Meander Shift and Levee Breaches Caused by a Record-Breaking Flood in the Otofuke River, Japan. J. Hydro-Environ. Res. 2020, 31, 76–89. [Google Scholar] [CrossRef]
  38. Shogaki, T.; Tsusue, A.; Yano, S.; Ksama, K. Evaluation of Driftwood Generation in the Northern Kyushu Heavy Rain in 2017 by Logistic Regression. In Proceedings of the 22nd IAHR-APD Congress, Sapporo, Japan, 14–17 September 2020. [Google Scholar]
  39. Harada, D.; Egashira, S. Method to Evaluate Large-Wood Behavior in Terms of the Convection Equation Associated with Sediment Erosion and Deposition. Earth Surf. Dyn. 2023, 11, 1183–1197. [Google Scholar] [CrossRef]
  40. Nagumo, N.; Egashira, S. Flood Hazard Analysis and Locations of Damaged Houses Based on Land Classification in the Akatani River Basin Following Torrential Rainfall in Northern Kyushu. J. Geogr. (Chigaku Zasshi) 2017, 128, 835–854. (In Japanese) [Google Scholar] [CrossRef]
  41. Nagumo, N.; Egashira, S. Research on Sediment Transport Processes in Mountainous Rivers Based on Geomorphic Analysis. Geogr. Rev. Jpn. Ser. A 2021, 94, 64–81. (In Japanese) [Google Scholar]
  42. Fujita, M.; Yamanoi, K. Integrated Simulation of Landslide and Flood on a Heavy Rainfall Event in Akadani River Basin, Asakura City. Investigation Report on the Northern Kyushu Torrential Rainfall Disaster in 2017. Disaster Prev. Res. Inst. Kyoto Univ. 2018, 68–71. Available online: https://repository.kulib.kyoto-u.ac.jp/dspace/handle/2433/232513?locale=en (accessed on 4 July 2024). (In Japanese).
  43. Egashira, S.; Harada, D.; Nagumo, N.; Yamazaki, Y.; Yorozuya, A. A Method to Predict Fine Sediment Runoff Focusing on Debris Cones Resulting from Landslides and Debris Flows–Sediment Hazards Occurred at Akadani Drainage Basin in July, 2017. J. Jpn. Soc. Civ. Eng. B1 2018, 74, I_925–I_930. (In Japanese) [Google Scholar] [CrossRef]
  44. Damage Situation of Northern Kyushu Torrential Rainfall in July 2017. Available online: https://www.bousai.go.jp/fusuigai/kyusyu_hinan/pdf/dai1kai/siryo2.pdf (accessed on 4 July 2024). (In Japanese).
  45. Detailed Distribution Map of Landslides Caused by the July 2018 Heavy Rainfall in Hiroshima Prefecture (Version 2: Final Report). Available online: https://www.ajg.or.jp/disaster/files/201807_report008.pdf (accessed on 4 July 2024). (In Japanese).
  46. Information on Typhoon No. 19 in 2019. Available online: https://www.gsi.go.jp/BOUSAI/R1.taihuu19gou.html (accessed on 4 July 2024). (In Japanese).
  47. Verification of Evacuation Responses in Saka Town During the Heavy Rainfall Disaster in July 2018 and Recommendations for Supporting Appropriate Future Evacuation Actions. Available online: https://www.bousai.go.jp/fusuigai/suigai_dosyaworking/pdf/sakamachiteigen.pdf (accessed on 4 July 2024). (In Japanese).
  48. Kure City Disaster Record on Heavy Rainfall Disaster in July 2018. Available online: https://www.city.kure.lg.jp/uploaded/attachment/52026.pdf (accessed on 4 July 2024). (In Japanese).
  49. Heavy Rain, Strong Winds, and High Waves Caused by Typhoon No. 19 in 2019. Available online: https://www.data.jma.go.jp/sendai/data/saigai/siryou/T1919touhoku.pdf (accessed on 4 July 2024). (In Japanese).
  50. Yano, S.; Shogaki, T.; Yato, S.; Tsusue, A.; Wu, Y.; Kasama, K. Development of Logistic Regression Model for Slope Failure and Estimation of Driftwoods Generation in Marumori Town due to the East Japan Typhoon 2019. J. Jpn. Soc. Civ. Eng. B1 2020, 76, 253–263. (In Japanese) [Google Scholar] [CrossRef] [PubMed]
  51. Marumori Town Record of East Japan Typhoon Disaster. 2019. Available online: https://cccc.backshelf.jp/bookview/?filseq=10099&user=guest (accessed on 4 July 2024). (In Japanese).
  52. Meyer-Peter, E.; Müller, R. Formulas for Bed-Load Transport. In Proceedings of the 2nd IAHR World Congress, Stockholm, Sweden, 7–9 June 1948. [Google Scholar]
  53. Bagnold, R.A. An Approach to the Sediment Transport Problem from General Physics. In Geological Survey Professional Paper; Government Printing Office: Washington, DC, USA, 1966; Volume 422–I, pp. 1–37. [Google Scholar]
  54. Ashida, K.; Michiue, M. Study on Hydraulic Resistance and Bed-load Transport Rate in Alluvial Streams. Proc. Jpn. Soc. Civ. Eng. 1972, 206, 59–69. (In Japanese) [Google Scholar] [CrossRef]
  55. Brown, C.B. Sediment Transportation. In Engineering Hydraulics; Rouse, H., Ed.; John Wiley and Sons: New York, NY, USA, 1950; pp. 769–857. [Google Scholar]
  56. Shinohara, K.; Tsubaki, T. On the Characteristics of Sand Waves Formed upon the Beds of the Open Channels and Rivers. Rep. Res. Inst. Appl. Mech. Kyushu Univ. 1959, 7, 15–45. [Google Scholar] [CrossRef]
  57. van Rijn, L.C. Sediment Transport, Part I: Bed Load Transport. J. Hydraul. Eng. 1984, 110, 1431–1456. [Google Scholar] [CrossRef]
  58. Egashira, S.; Miyamoto, K.; Ito, T. Bed-load Rate in View of Two Phase Flow Dynamics. Proc. Hydr. Eng. 1997, 41, 789–794. (In Japanese) [Google Scholar] [CrossRef]
  59. Rouse, H. Modern Conceptions of the Mechanics of Fluid Turbulence. Trans. ASCE 1937, 102, 463–505. [Google Scholar] [CrossRef]
  60. Lane, E.W.; Kalinske, A.A. Engineering Calculations of Suspended Sediment. Trans. Am. Geophys. Union 1941, 22, 603–607. [Google Scholar]
  61. Ashida, K.; Michiue, M. Study on the Suspended Sediment (1): Concentration of the Suspended Sediment near the Bed Surface. Disaster Prev. Res. Inst. Annu. 1970, 13B, 233–242. (In Japanese) [Google Scholar]
  62. Itakura, T.; Kishi, T. Open Channel Flow with Suspended Sediments. J. Hydraul. Div. 1980, 106, 1325–1343. [Google Scholar] [CrossRef]
  63. Ashida, K.; Fujita, M. Mechanism of Particle Suspension in an Open Channel. Proc. Jpn. Soc. Civ. Eng. 1986, 375, 79–88. (In Japanese) [Google Scholar] [CrossRef] [PubMed]
  64. van Rijn, L.C. Mathematical Modeling of Suspended Sediment in Nonuniform Flows. J. Hydraul. Eng. 1986, 112, 433–455. [Google Scholar] [CrossRef]
  65. Garcia, M.; Parker, G. Entrainment of Bed Sediment into Suspension. J. Hydraul. Eng. 1991, 117, 414–435. [Google Scholar] [CrossRef]
  66. Harada, D.; Egashira, S.; Ahmed, T.S.; Ito, H. Entrainment of Bed Sediment Composed of Very Fine Material. Earth Surf. Process. Landf. 2022, 47, 3051–3061. [Google Scholar] [CrossRef]
Figure 1. Schematic diagram of a sediment transport form in a small, mountainous river basin.
Water 16 03688 g001
Figure 4. Longitudinal distribution of geomorphic indicator A i : (a) Akatani and Otoishi Rivers (0.5 km interval); (b) Sozu River (0.1 km interval); (c) Tenchi River (0.1 km interval); (d) Oyaokawa River (0.1 km interval); and (e) Uchikawa River and its major tributaries (0.5 km interval). Longitudinal changes in bed slope are also illustrated for reference.
Water 16 03688 g004
Figure 5. Photos of the Akatani and Otoishi Rivers after flooding in 2017: (a) the Otoishi River at the 2.7 km point; (b) the Otoishi River at the 0.3 km point; and (c) a flooded area around the Akatani River at the 0.2 km point (distances of the Otoishi River are from the confluence points with the Akatani River, and those of the Akatani River are from the confluence points with the Chikugo River). Photos were taken by the authors.
Water 16 03688 g005
Figure 6. Photos of the Sozu, Tenchi, and Oyaokawa Rivers after flooding in 2018: (a) the Sozu River at the 2.6 km point; (b) the Sozu River at the 1.5 km point; (c) the Sozu River at the 1.2 km point; (d) the Tenchi River at the 0.6 km point; and (e) the Oyaokawa River at the 0.7 km point (all distances are from the river mouth). Photos were taken by the authors.
Water 16 03688 g006
Figure 7. Photos of the Uchikawa and Gofukuya Rivers after flooding in 2019: (a) the Uchikawa River downstream between the 6.0 km and 4.5 km points; (b) the Gofukuya River downstream between the 2.0 km and the 1.0 km points; and (c) the flooded area along the Gofukuya River at the 1.6 km point (distances of the Uchikawa River are from the confluence points with the Abukuma River, and those of the Gofukuya River are from the confluence points with the Uchikawa River). The aerial photos in (a,b) were taken by the Geospatial Information Authority of Japan, and photo (c) was taken by the authors.
Water 16 03688 g007
Figure 8. Longitudinal profiles of sediment transport capacities of (a) the Akatani and Otoishi Rivers and (b) the Sozu River, calculated by the sediment transport formula with the 3/2 power, and (c) the Akatani and Otoishi Rivers and (d) the Sozu River, calculated by the sediment transport formula with the 5/2 power.
Water 16 03688 g008
Disclaimer/Publisher’s Note: The statements, opinions and data contained in all publications are solely those of the individual author(s) and contributor(s) and not of MDPI and/or the editor(s). MDPI and/or the editor(s) disclaim responsibility for any injury to people or property resulting from any ideas, methods, instructions or products referred to in the content.