Article

Challenges of Providing Safe Drinking Water in African Rural Communities: A Case Study on the Oio Region, Guinea-Bissau

by
Pedro Silveira
1,2,
Maria Teresa Rebelo
2,3 and
Daniel Salvador
3,4,*
1
TESE–Associação para o Desenvolvimento pela Tecnologia, Engenharia, Saúde e Educação, Avenida do Brasil, 155 A, 1700-067 Lisboa, Portugal
2
Department of Animal Biology, Faculty of Sciences, University of Lisbon, 1749-016 Lisboa, Portugal
3
CESAM-Centre for Environmental and Marine Studies and Ce3C-CHANGE-Centre for Ecology, Evolution and Environmental Changes and Global Change & Sustainability Institute, Faculty of Sciences, University of Lisbon, 1749-016 Lisboa, Portugal
4
Instituto de Saúde Ambiental (ISAMB), Faculty of Medicine, University of Lisbon, 1649-026 Lisboa, Portugal
*
Author to whom correspondence should be addressed.
Water 2024, 16(24), 3621; https://doi.org/10.3390/w16243621
Submission received: 22 October 2024 / Revised: 11 November 2024 / Accepted: 10 December 2024 / Published: 16 December 2024
(This article belongs to the Section Water Quality and Contamination)

Abstract

:
Access to safe drinking water is a fundamental human right, yet it remains a global challenge affecting nearly 2 billion people, particularly in Africa in regions such as Guinea-Bissau. This study investigated the microbiological and physicochemical quality of drinking water in four rural areas of the Oio region of Guinea-Bissau—Cangha N’Tchugal, Cajaque, Infaidi and Insanha—over a one-year period (October 2022–September 2023) to assess water safety and seasonal variations. During this period, eight water samples were collected and analysed from each site, split evenly between the dry and wet seasons. The results showed widespread faecal coliform contamination, with concentrations escalating during the wet season (2 to 39 CFU/100 mL), posing a health risk. Physicochemical analysis showed consistently acidic pH values (from 4.93 to 6.58) and seasonal variations in phosphate and iron concentrations, with a marked decrease in iron concentrations during the wet season. These results indicated that the water from the four sampling points was unfit for human consumption. In light of these findings, there is an urgent need for the regular monitoring of water sources used for drinking and for improved access to resources and basic sanitation in the future.

1. Introduction

Access to safe drinking water is a critical factor in the economic, social, and health development of a country and its people [1,2].
Regions with high levels of human and economic development, such as Europe and North America, have high levels of access to drinking water and sustainable water management services. In contrast, in sub-Saharan Africa, access to unsafe water unfit for human consumption has increased by more than 40% since 2000. The world’s poorest and most rural areas are the most affected: in 2023, some 2 billion people (26% of the world’s population) lacked access to safe drinking water and 3.6 billion (46%) lacked basic sanitation. Of these, 70% lived in rural areas and 40% were in developing countries. In addition, 494 million people still practiced open defecation in 2020 [3,4].
The challenges of achieving universal access to safe water are directly linked to population growth, rainfall patterns, the frequency of droughts and floods, and other human-induced factors [1,4]. According to the United Nations, Sustainable Development Goal 6 (SDG 6), Drinking Water and Sanitation, aims to ensure the availability and sustainable management of drinking water and sanitation for all by 2030, with eight specific targets [5]. Therefore, integrated approaches such as the One Health concept, which emphasises the interconnectedness of humans, animals, plants, and the environment in general, including ecosystems, need to be considered [6]. In addition, the concept of Planetary Health aims to understand the impact of environmental changes on human health [7].
The waterborne transmission of infectious diseases, through ingestion of or exposure to pathogens such as bacteria, viruses, and parasites, remains a significant public health risk [2]. Despite more than a century of public awareness, diseases related to inadequate water, sanitation, and hygiene are still responsible for the deaths of 74 million people worldwide, most of them children. Of these deaths, more than one million are caused by faecal-contaminated drinking water, largely due to inadequate water and sanitation infrastructure [4]. The faecal–oral route, derived from contaminated water or food, remains one of the main modes of transmission. The prevalence of waterborne diseases varies according to regional sanitary and climatic conditions, with the highest rates in sub-Saharan Africa [8]. Among the infections caused by microorganisms, Escherichia coli (E. coli) infections are prominent [1,9,10,11]. Although typically found in the gastrointestinal tract of animals and humans, E. coli can cause serious diseases such as urinary tract infections, bacteraemia, and meningitis [2,9] when present in other parts of the body. Ensuring the microbiological safety of drinking water is a priority, but the importance of regulating and controlling the physicochemical properties of water is also increasingly recognised [8,9]. Water for human consumption may contain various physical or chemical elements that can cause organoleptic and aesthetic problems or, in extreme cases, serious health risks. Sources of contamination may be natural or related to human activities, including domestic, agricultural, or industrial activities. In contrast to the often acute effects of the microbiological contamination of water, chemical contamination can lead to chronic diseases after prolonged exposure to high concentrations [10]. The monitoring and assessment of the physicochemical quality of drinking water is essential, especially for groundwater, where anthropogenic contaminants can affect aquifers indefinitely [12,13].
Guinea-Bissau, with a population of approximately 1.9 million, is located in sub-Saharan Africa [14,15]. Although relatively small, with an area of approximately 36,125 km2, the country is home to a wide range of ethnic groups, languages, and religions [16]. It is one of the poorest countries in the world, ranked 179th out of 193 countries in 2022, with a Human Development Index (HDI) of 0.483 (on a scale of 0 to 1) [17]. Guinea-Bissau’s key development indicators have not improved in recent years, and limited access to water remains both a cause and a consequence of its high poverty levels and slow economic development. The water and sanitation sector in Guinea-Bissau is publicly managed under the supervision of the Ministério dos Recursos Naturais, which oversees the Direção Geral dos Recursos Hidricos (DGRH). The only available report on water, sanitation, and hygiene indicators is the Multiple Indicator Cluster Survey (MISCS) conducted by the Ministério da Economia e Finanças through the Direção Geral do Plano/Instituto Nacional de Estatística (INE). This survey is part of the MICS Global Programme, with technical and financial support from the United Nations Children’s Fund (UNICEF), the United Nations Development Programme (UNDP), and the United Nations Population Fund (UNFPA) [18]. Guinea-Bissau’s main water law is the Código das Águas, which came into force on 17 September 1992. According to this law, water for human consumption must meet quality standards set by the Ministério da Saúde Pública (MINISAP). In 2008, MINISAP established quality standards for drinking water, but these have yet to be enforced.
There is currently a critical lack of data on the monitoring of drinking-water quality in Guinea-Bissau. There are no technical reports on compliance with water quality standards, nor is there any assessment or tracking of the acceptability of water sources over time.
This study was designed to address these gaps by assessing the microbiological and physicochemical quality of drinking water in four rural localities in Encheia section, within the Bissorã sector of the Oio region of Guinea-Bissau: Cangha N’Tchugal, Cajaque, Infaidi, and Insanha. A secondary objective was to identify seasonal patterns in water quality, as the country has distinct dry (December to May) and wet (June to November) seasons. As there is no routine monitoring or compliance assessment of water quality in Guinea-Bissau, this research ultimately aims to provide a basis for evidence-based policies and interventions and contribute to improved access to safe water and reduced vulnerability in rural communities.

2. Materials and Methods

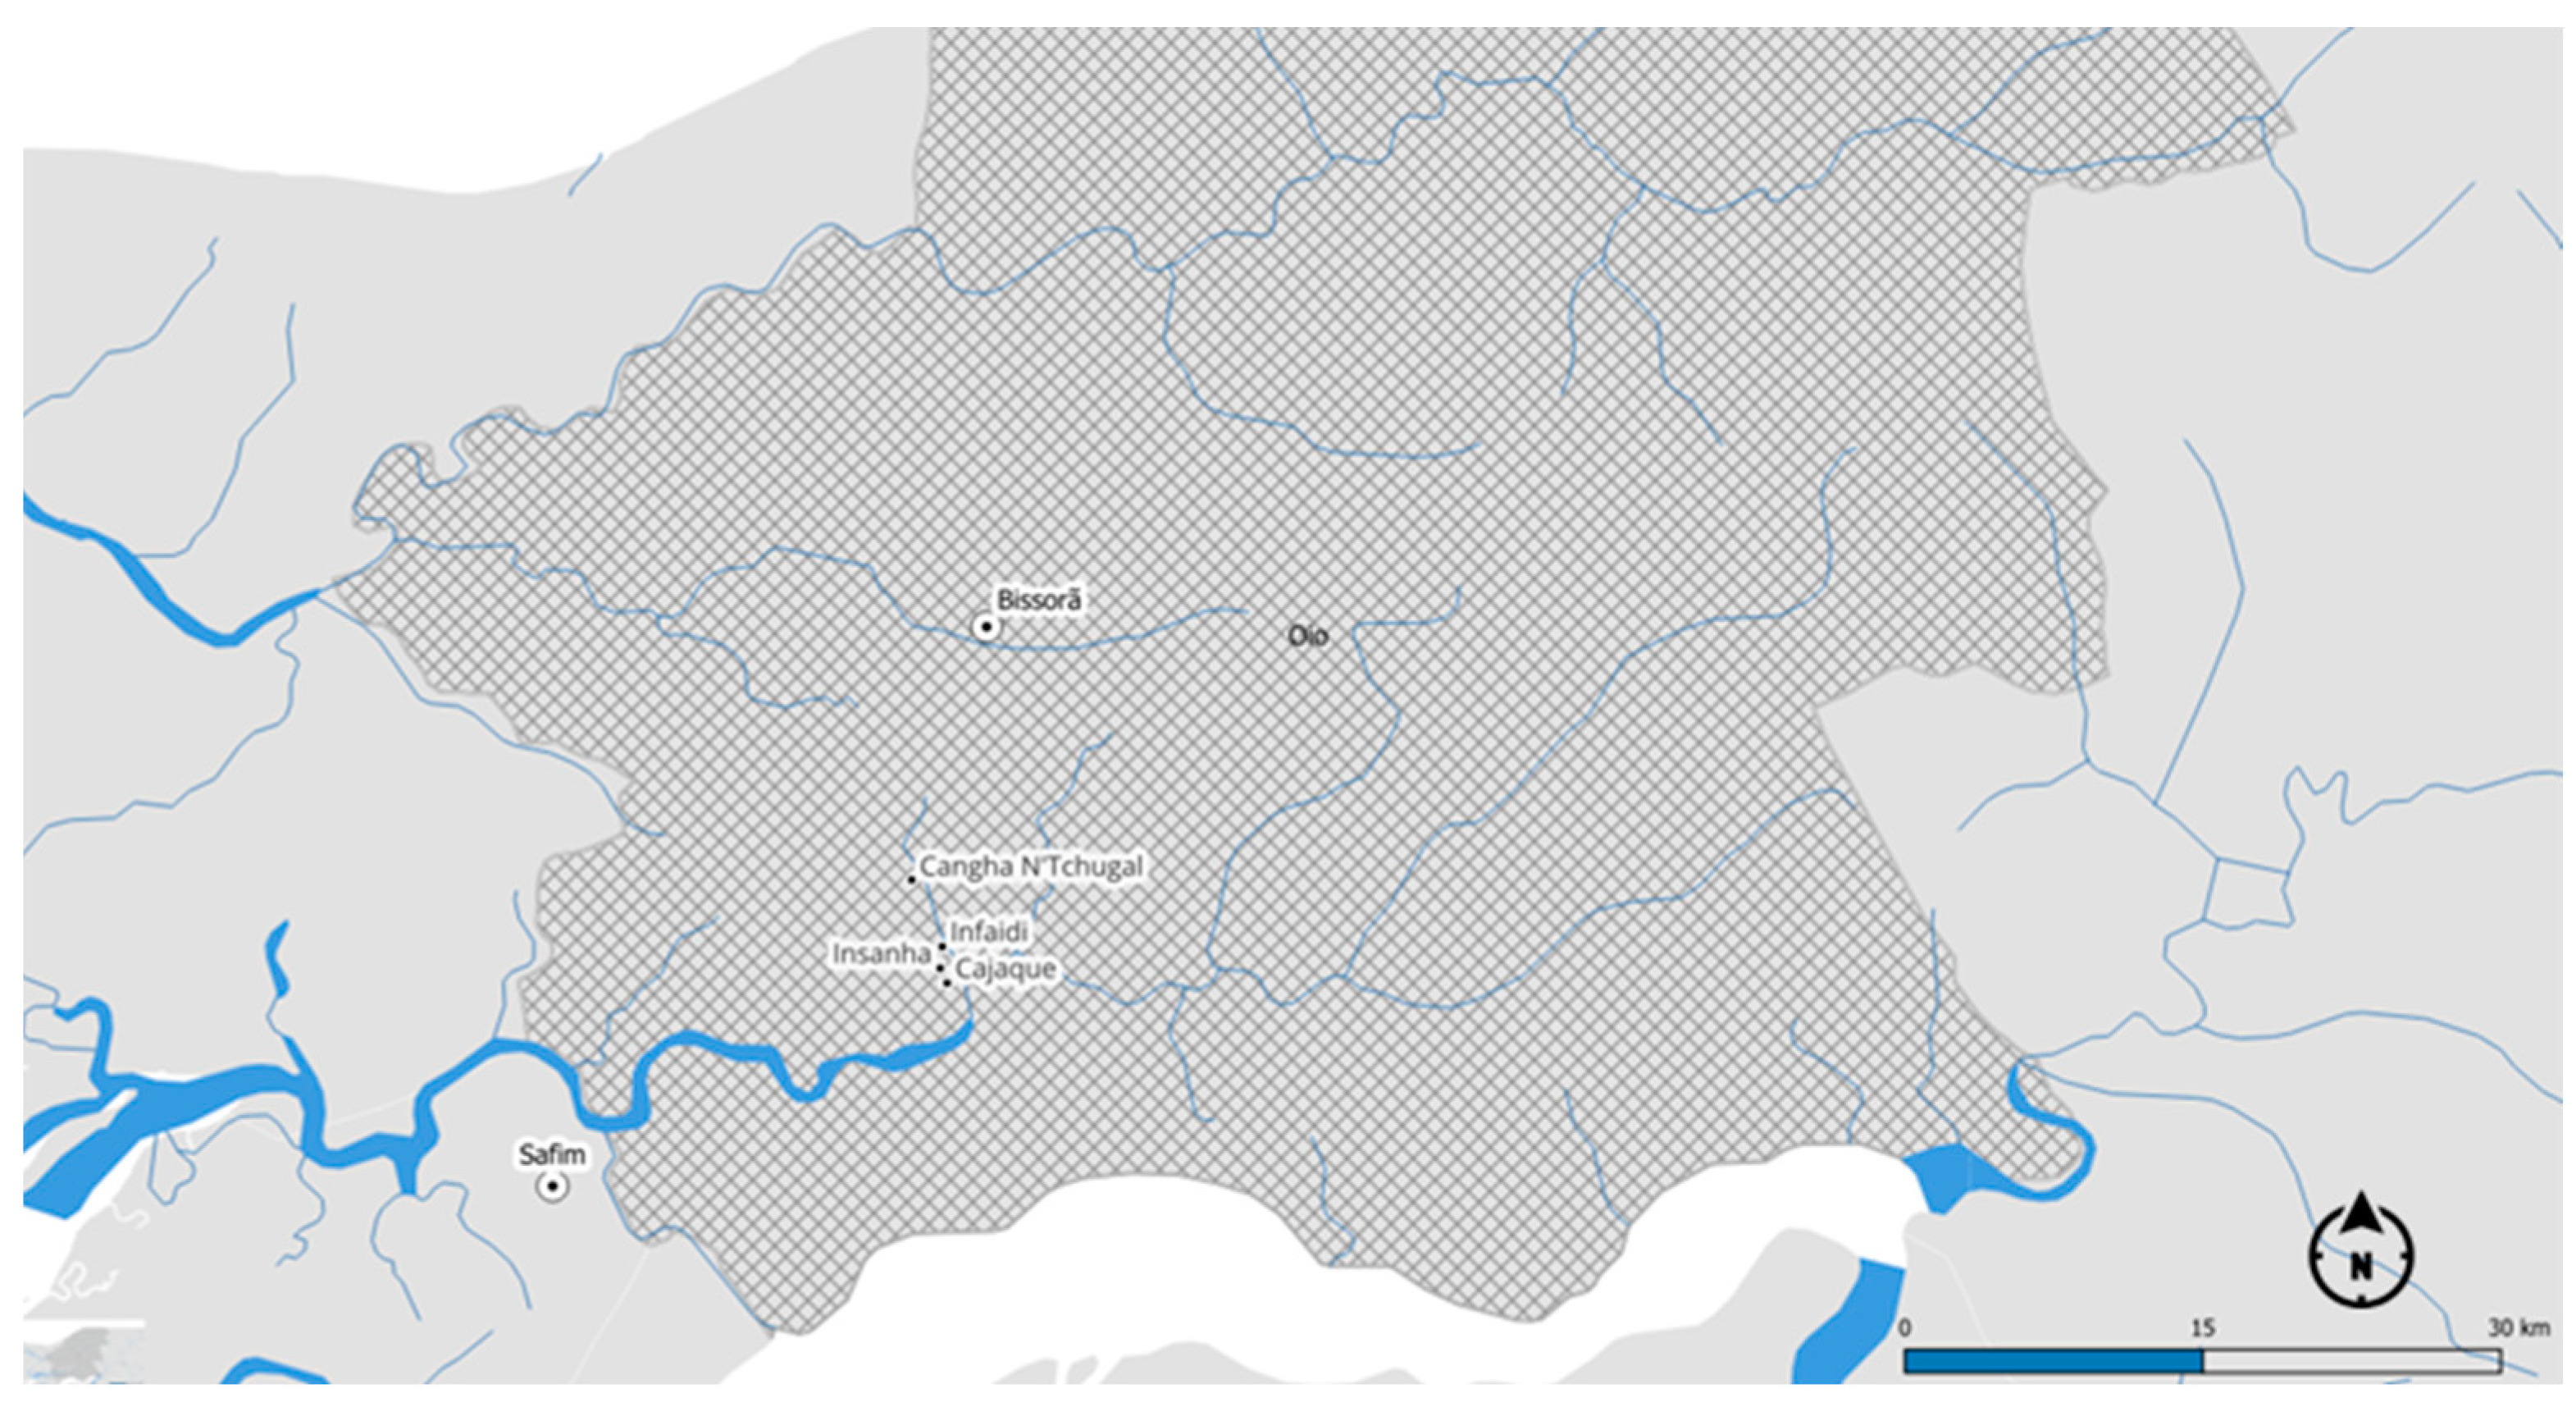
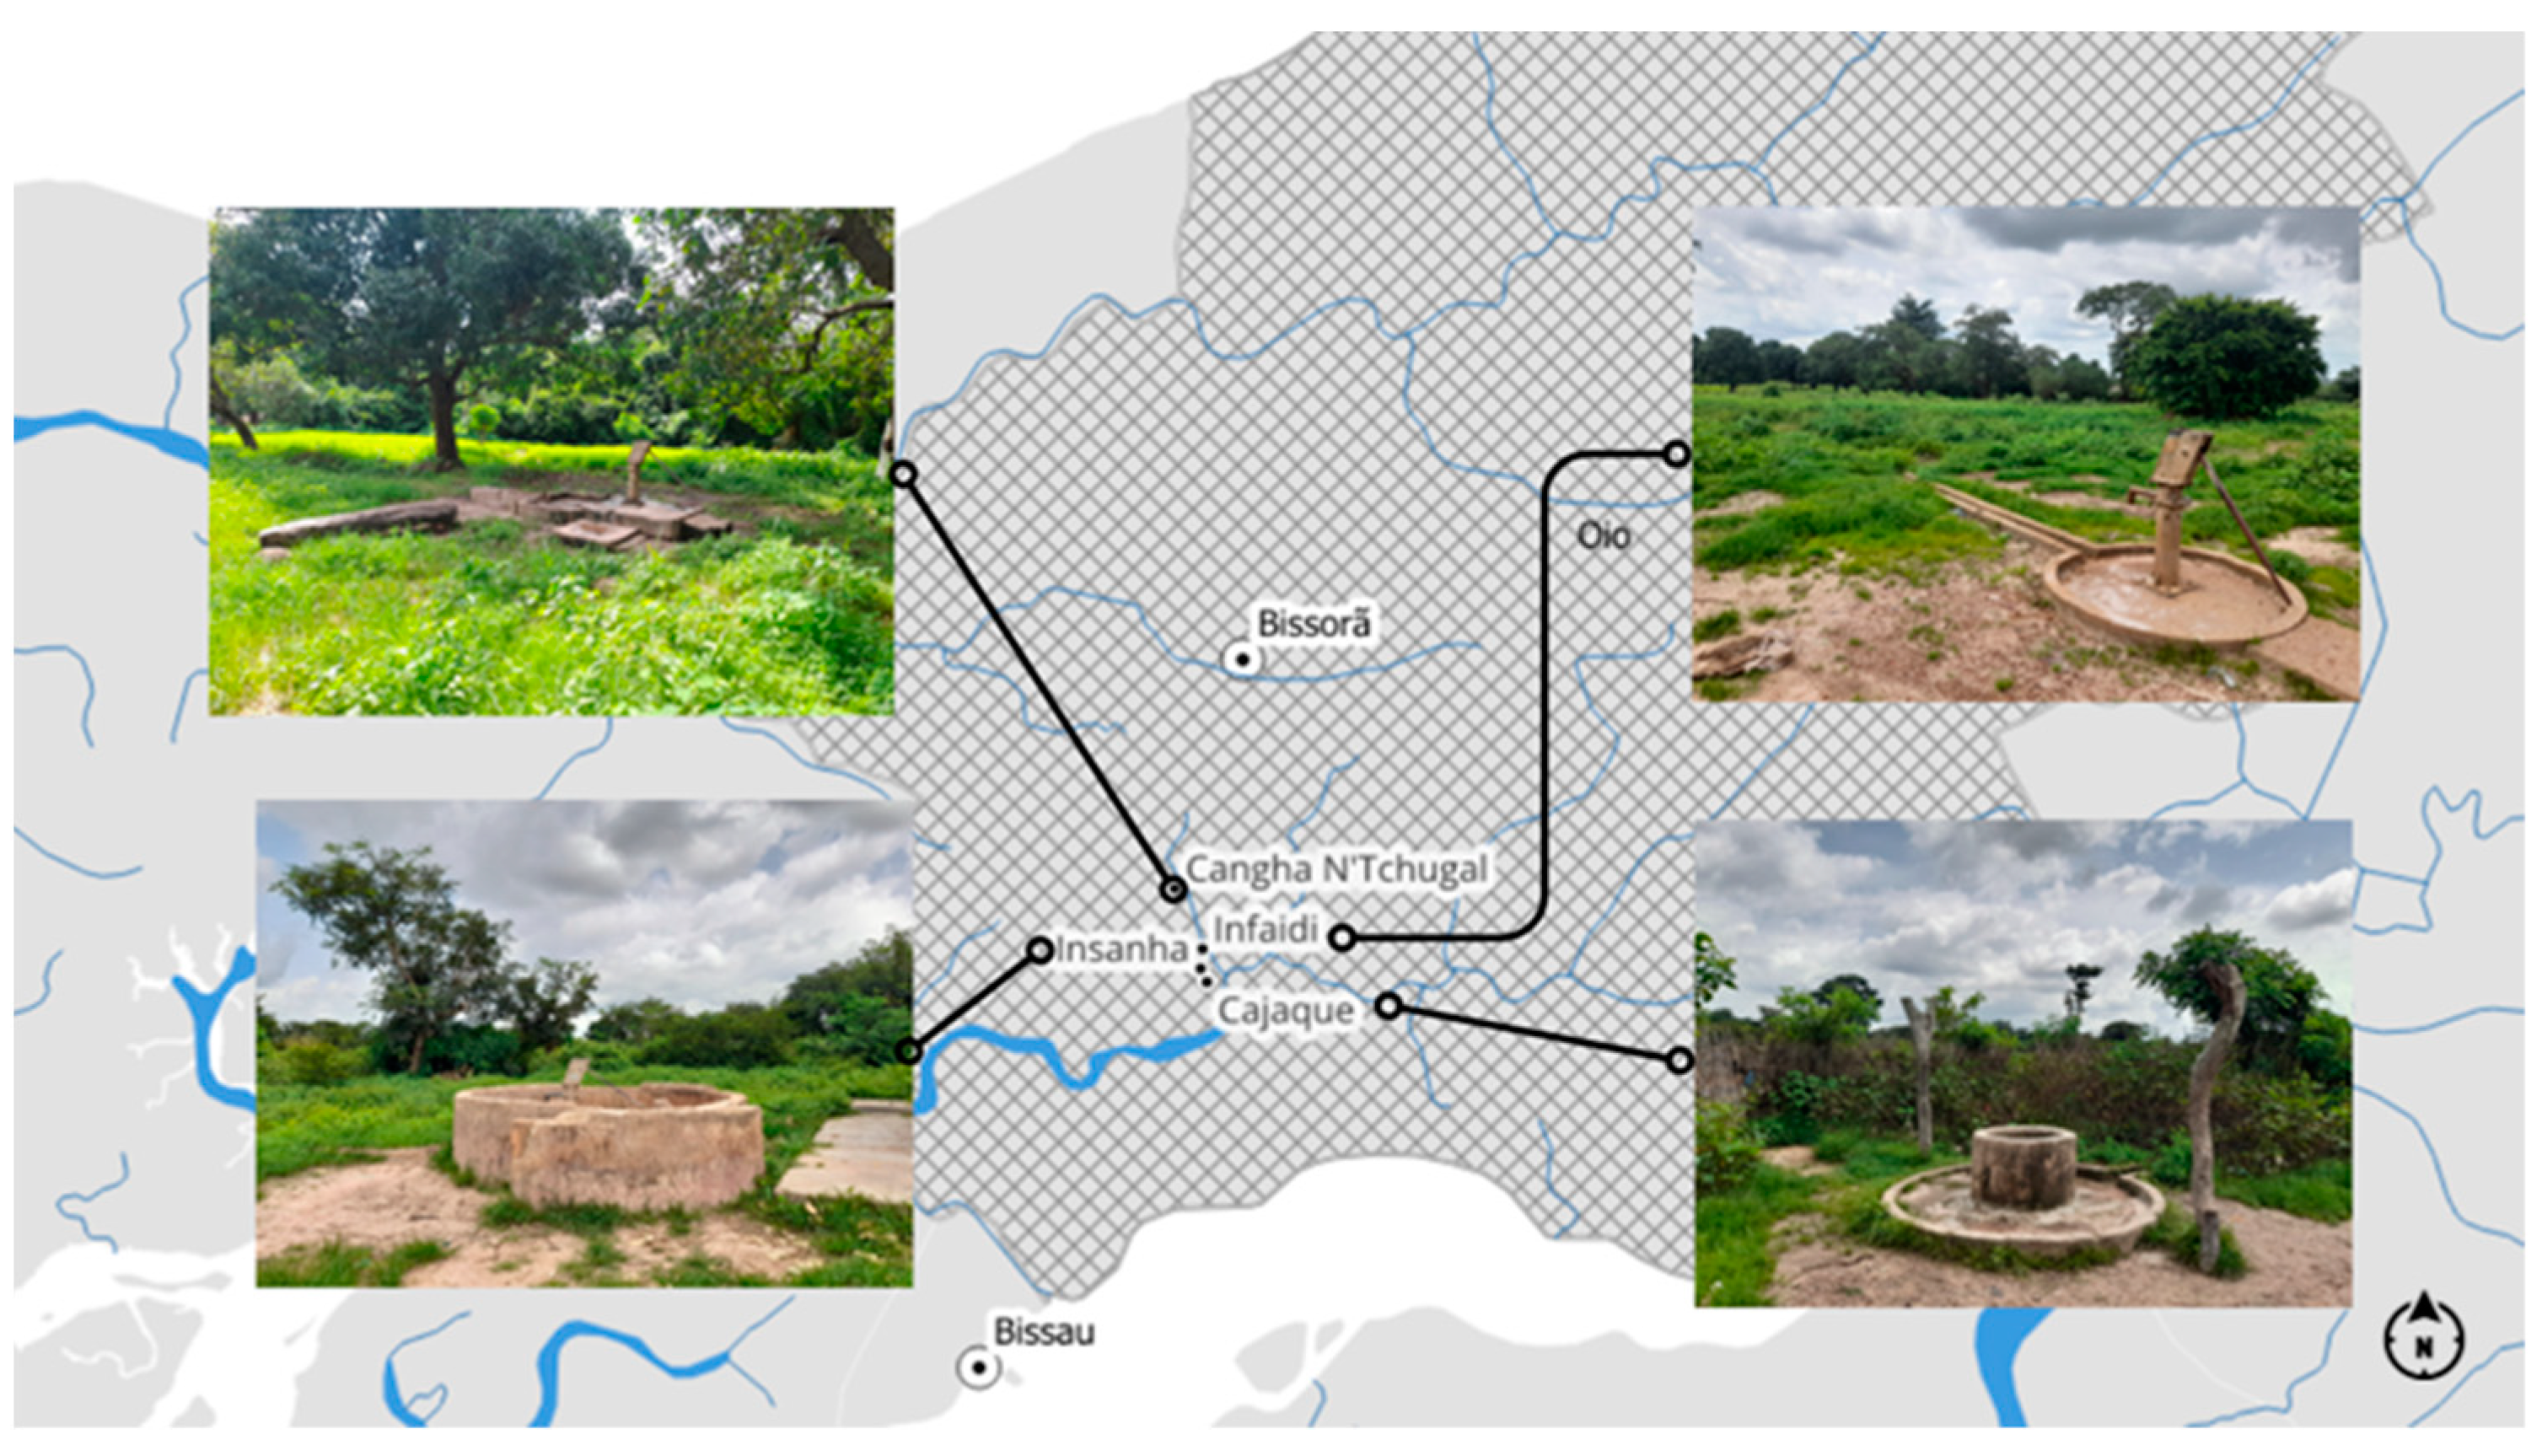
2.1. Study Area and Sampling Sites

The Oio region has an area of approximately 5403 km2, with a population of approximately 215,259 inhabitants, representing 15% of the population of Guinea-Bissau. It is divided administratively into 5 sectors: Farim, Mansabá, Mansoa, Nhacra, and Bissorã [18]. Most of the population lives in rural areas, and only 52.8% of residents have access to an improved water source. According to the MICS, the main sources of drinking water in rural areas are unprotected wells (41.9%) and boreholes equipped with hand pumps (23.9%). The under-five mortality rate in the Oio region in the five years prior to the 2018/2019 survey was 42 per 1000 live births, with almost 4% of children dying before their fifth birthday [18,19]. The Encheia section is located in the Bissorã sector and in the Oio region. The study area is home to about 2% of the population of the Oio region, where the predominant ethnic group is the Balanta. Most residents are engaged in agriculture and horticulture, growing crops such as rice, maize, cassava, cashew nuts, peanuts, beans, and vegetables, as well as livestock and subsistence fishing. The area lacks both public and private water and electricity services. The population relies on traditional wells, boreholes equipped with hand pumps, and photovoltaic systems.
The four localities, as shown in Figure 1, had a population of approximately 1161 in 2023, representing about 166 households. The most populated locality was Cangha N’Tchugal with 457 inhabitants, followed by Infaidi with 318, Cajaque with 260, and Insanha with 126 inhabitants. The data on the resident population of the localities studied were collected during the characterisation of the localities and provided by the representative of each one. The data available from the INE of Guinea-Bissau are from the 2009 Recenseamento Geral da População (RGP).
Given the need for viable and representative sampling points, three hand-pumped boreholes and an improved traditional well were selected. The well was constructed with features designed to protect against external contamination, including an inner lining and protective walls. Each water point was selected by the community representative in collaboration with the women’s group of the area, with the only criterion being that the selected water source was most frequently used for drinking and domestic purposes (Figure 2). In Cangha N’Tchugal, the selected hand pump was installed at a depth of 19 m with a water drainage system and was located far from residential areas. In Cajaque, the chosen water point was an improved traditional well, as there was no other infrastructure available. This well was 10 m deep, situated away from the villas, and surrounded by a small, cultivated area. In Infaidi, the selected water point was located in the school playground and was the only borehole equipped with a hand pump. In Insanha, water was collected from a 20 m deep borehole equipped with a hand pump and a drainage system, also far from any houses or infrastructure. All the water from the sampling points was of natural origin and was collected and consumed without storage, treatment, or distribution.

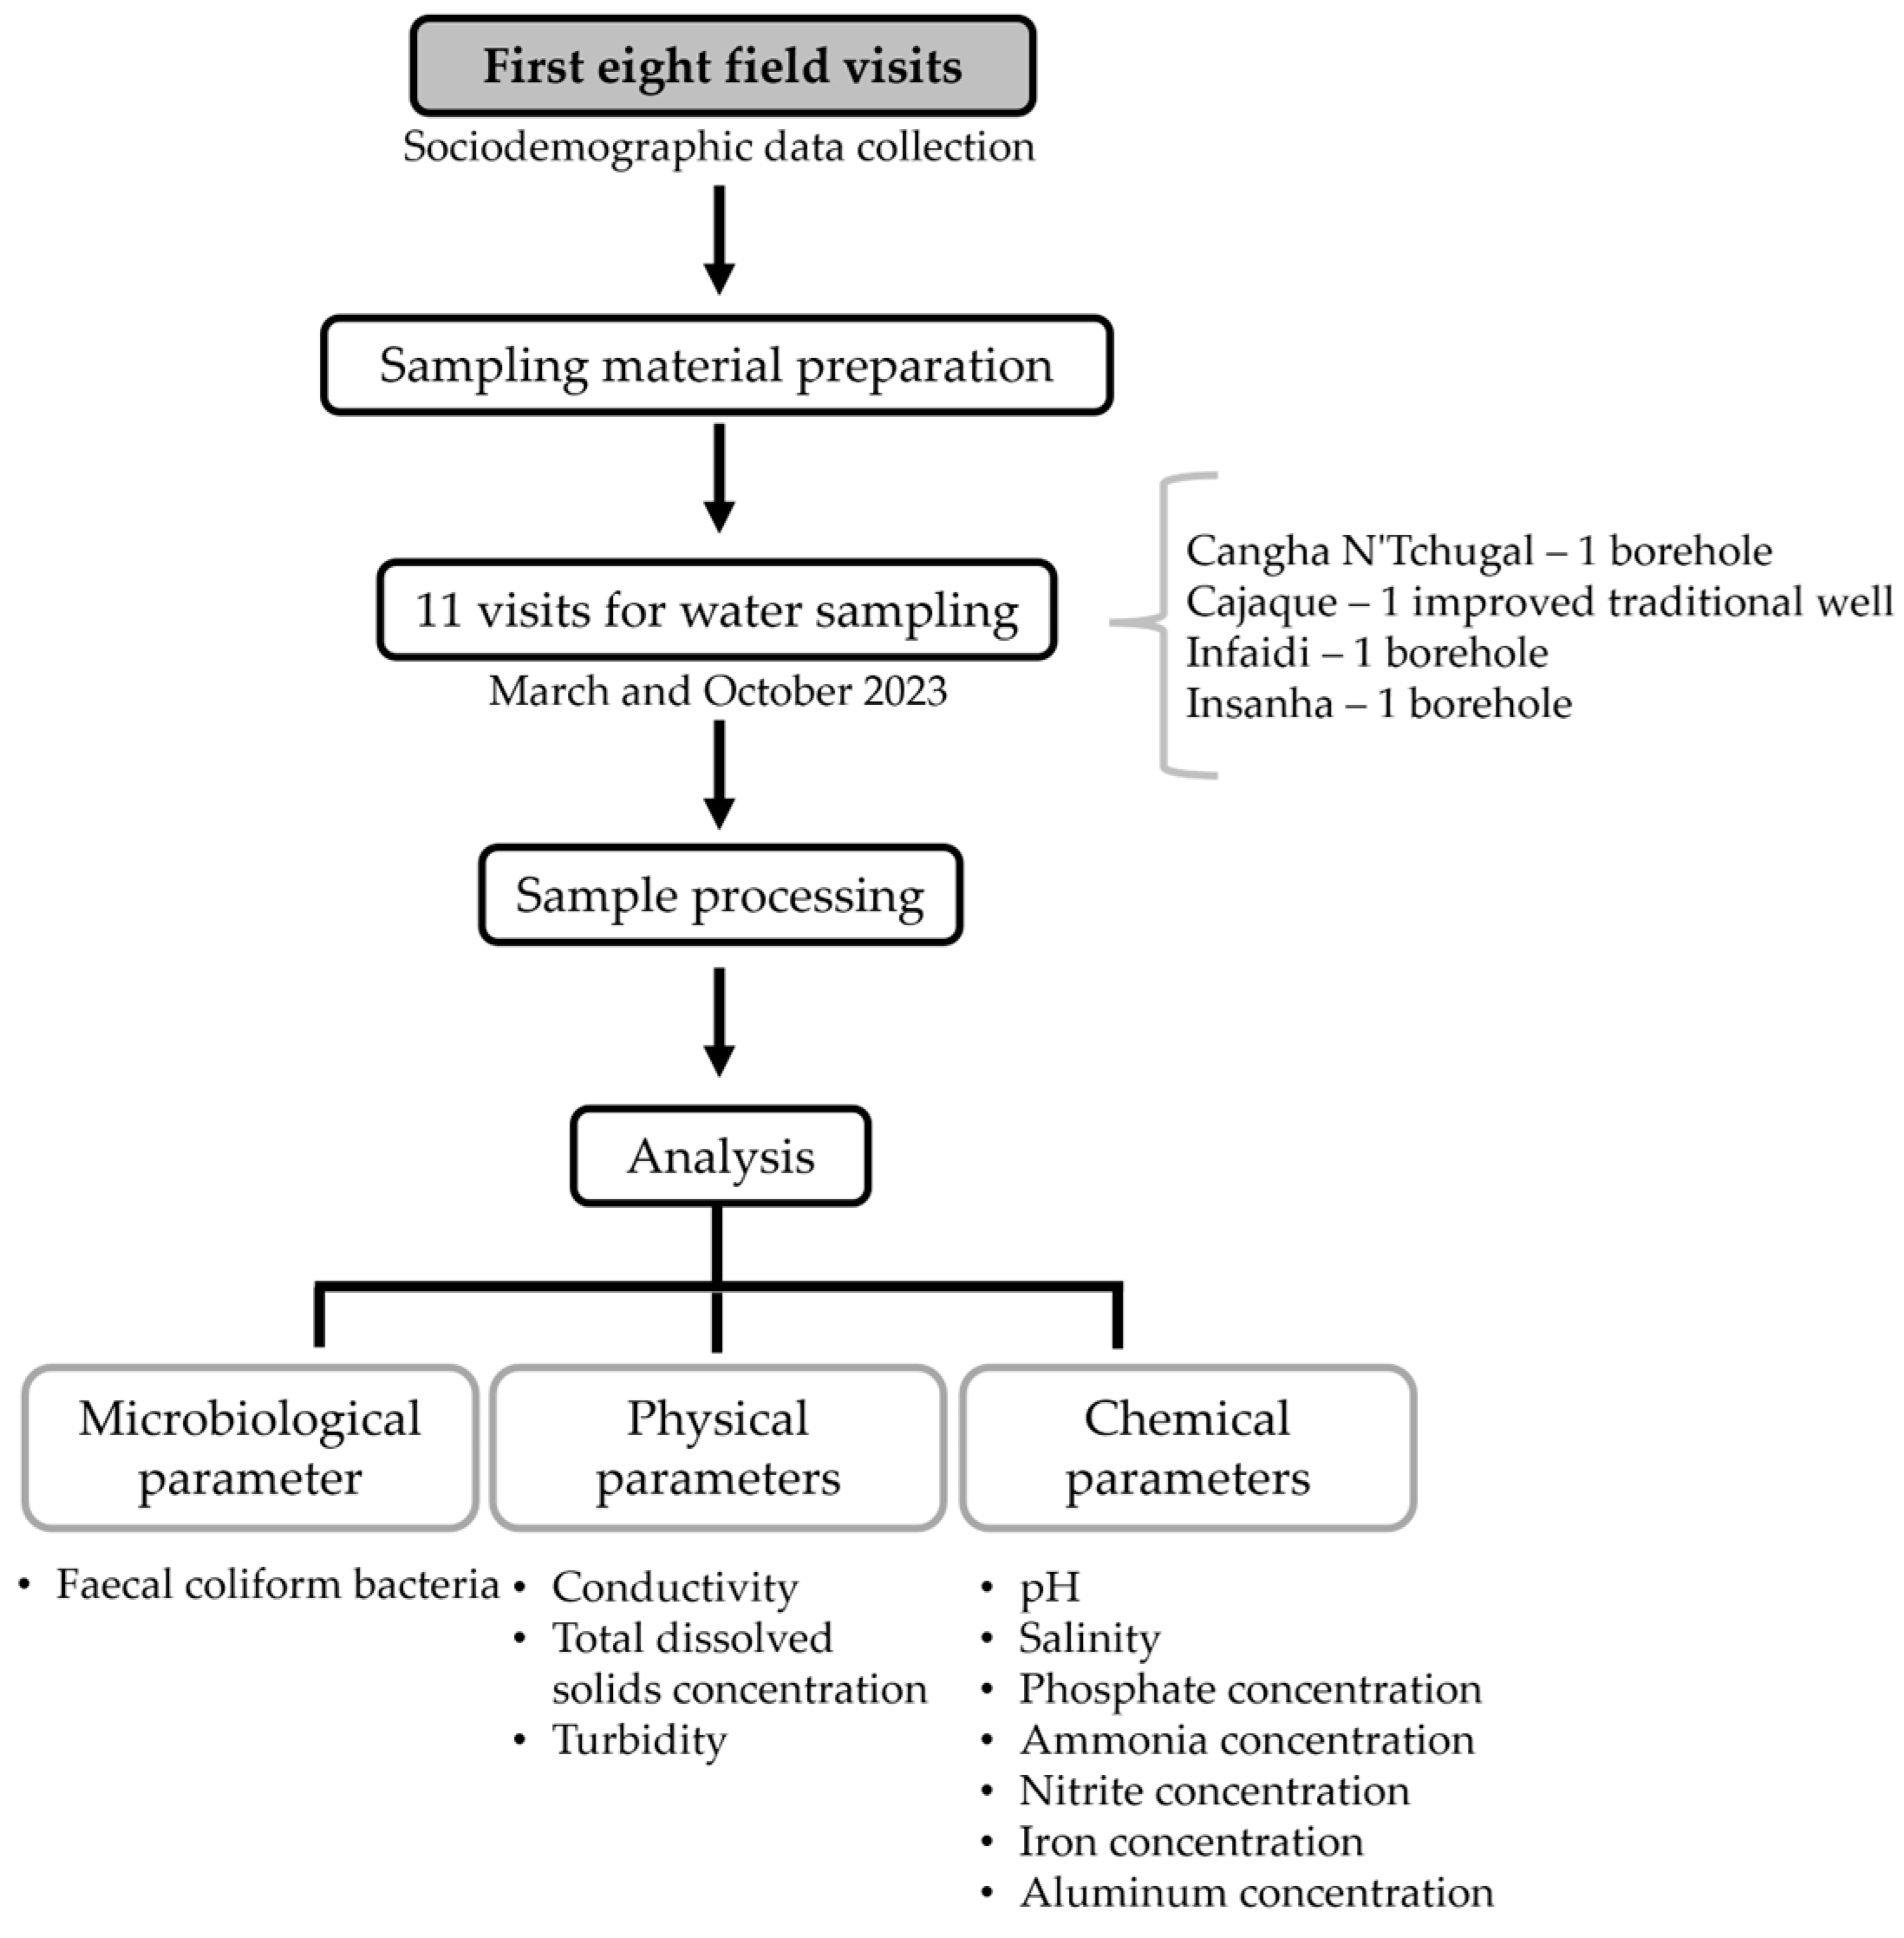
2.2. Sample Collection

Sampling took place between March and October 2023, with visits scheduled every 15 days, usually on Wednesdays, always between 3 p.m. and 4 p.m. (Figure 3). This schedule allowed eight water samples to be collected from each location: four in the dry season and four in the wet season (Table 1).
For the microbiological analysis, precautions were taken to ensure sample viability and to avoid contamination. On arrival at the water points, the hand pump heads were disinfected at each visit, while the metal cup of the traditional well was cleaned with 70% ethyl alcohol. After disinfection, water was pumped for 5 to 10 s at maximum flow to remove residual disinfectant. For the physicochemical analysis, the water was pumped at maximum flow for about 5 to 10 s, without disinfection. In the case of the traditional well, water was collected using a pre-rinsed metal cup. The water flow was kept constant and the collection bottles were not completely filled. One litre of water was collected per sample. After collection, the samples were refrigerated and transported to the laboratory.

2.3. Microbiological Procedures

Conducting microbiological testing in Guinea-Bissau, where laboratory facilities are limited or inadequate, is a complex challenge. To overcome this, the DelAgua Portable Water Testing Kit (Marlborough, UK) was used to test critical water quality parameters. The kit includes a battery-powered incubator, which allows independent operation for over five incubation cycles [20].
The DelAgua Portable Water Testing Kit was used to incubate and identify thermotolerant faecal coliforms according to the manufacturer’s instructions. The filtration equipment, including the filter and suction cup, was thoroughly disinfected and sterilised before use.
The culture medium was prepared using Membrane Lauryl Sulphate Broth (MLSB) solution supplied by DelAgua. After sterilisation, absorbent discs were placed in Petri dishes to ensure the uniformity of the medium, and approximately 2.5 mL of the medium was pipetted using a Pasteur pipette. The filtration device was then assembled, and a checkered filter membrane was carefully placed using sterile tweezers. After sealing with the vacuum cup, 100 mL of the water sample was filtered.
After filtration, the filter was removed from the vacuum cup and the filter membrane was transferred to the Petri dish containing the culture medium using sterile tweezers. The sample was identified and incubated at 44 °C for 18 h, according to the manufacturer’s instructions and a similar study in southern Ethiopia by Aregu et al. in 2021 [20].
After 18 h of incubation, colony counting was performed immediately after or within 15 min to avoid pH-induced colour changes from red (the colour of the culture medium) to yellow in the faecal coliform colonies due to the decrease in pH of the culture medium. Counts were made by direct observation with the naked eye and the results are expressed as colony-forming units (CFU) per 100 mL of water [21].
Several filtration blanks were also utilised as a quality control by filtering 100 mL of sterile water, using the same method described above.

2.4. Physicochemical Procedures

Physicochemical determinations were carried out using portable, easy-to-maintain equipment. Parameters such as pH, total dissolved solids (TDS), conductivity, salinity, and temperature were measured using the HANNA HI 98129-HI 98130 multiparameter probe (Hanna Instruments, Woonsocket, RI, USA), according to the manufacturer’s instructions [22]. Turbidity was measured using a TN-100 Waterproof turbidimeter (Eutech Instruments, Singapore) [23]. Chemical parameters such as phosphates, ammonia, nitrites, iron, and aluminium were determined using an MD600/Maxi Direct photometer (Lovibond, Amesbury, UK), again following the manufacturer’s guidelines [24]. The equipment used was regularly checked with calibration solutions supplied by the manufacturers and cleaned when necessary.

2.5. Analytical Procedures

Data were analysed using Microsoft Office Excel software, and annual and seasonal medians were calculated. The percentage of analyses meeting the recommended parametric values of the safe water indicator was calculated for each location and respective water point, based on the European Union (EU) Directive 2020/2184 of 16 December 2020 and the Guidelines for Drinking-Water Quality, fourth edition, with the first and second addenda of 2022 [9,25]. The formula was adapted from the Relatório Anual dos Serviços de Águas e Resíduos em Portugal de 2023 da Entidade Reguladora dos Serviços de Águas e Resíduos de Portugal (ERSAR) [26], and is presented below:
S a f e   w a t e r   i n d i c a t o r = N u m b e r   o f   a n a l y s e s   w i t h   p a r a m e t r i c   v a l u e   c o m p l i a n c e N u m b e r   o f   a n a l y s e s   p e r f o r m e d × 100
Water quality was classified into three categories: (i) less than 95% of analyses meeting PV—water considered unfit for human consumption; (ii) 95–99%—water considered acceptable for human consumption; and (iii) above 99%—water considered fit for human consumption and of good quality [26].

3. Results

3.1. Sociodemographic Characterisation of the Study Population

During the study, 19 field visits were carried out, the first 8 of which focused on data collection due to a lack of existing information. The local population is mainly engaged in seasonal agriculture and horticulture, which varies between the wet season (June to October) and the dry season (December to April). Most of the inhabitants are animists. Households and localities are organised into moranças (clusters of houses occupied by extended families). The moranças are usually separated by some distance, and the access roads are unpaved and in poor condition. There is no public or private water or electricity supply, and sanitation infrastructure is non-existent, with open defecation being common. There are primary schools in the Encheia section and secondary schools in the sector. For higher education, residents must move to the city of Bissau. The four localities have a total population of approximately 1161 inhabitants, spread over approximately 166 households. Table 2 summarises the sociodemographic characteristics of each locality

3.2. Assessment of Water Availability and Existing Infrastructure

There are nine traditional family/community wells and two boreholes with hand pumps in Cangha N’Tchugal. Both traditional wells and boreholes are used for human consumption. In Cajaque, there are 10 traditional family/community wells that serve as the primary source for drinking and domestic purposes. According to the local representative and the community, water availability decreases in May and June, due to a drop in the water table. The community does not have a borehole. There are three improved traditional family/community wells and five unimproved traditional family/community wells in Infaidi. The unimproved wells are not used for drinking water but for other purposes. The community has only one borehole, located at the school and equipped with a hand pump; it is used for drinking, animal consumption, and domestic purposes. In Insanha, three traditional family/community wells are used for drinking and other purposes. There are also two boreholes with hand pumps, although only one is operational. Throughout the study period and especially during the dry season, none of the water points experienced shortages. However, in Cajaque there was a drop in the water table.

3.3. Assessment of Microbiological and Physicochemical Quality

3.3.1. Monitoring of Microbiological Parameters—Faecal Coliform Bacteria

Eight samples were collected at Cangha N’Chugal: four during the dry season (March to May) and four during the wet season (August and September) (Figure 4, Table 3). The water point was not operational in July and had mechanical problems in September 2023. The concentration of faecal coliforms varied throughout the study. No coliforms were detected during the dry season. However, at the beginning of the wet season, in August, an amount of 9.0 CFU/100 mL was recorded. Of the four wet season samples, faecal coliform colonies were detected in three samples (75%), with concentrations ranging from 2.0 to 9.0 CFU/100 mg/L.
In Cajaque, eight samples were collected: four during the dry season (March to May) and four during the wet season (July and September) (Figure 4, Table 3). During the dry season, the water table dropped from March to May and began to recover during the wet season from July to September. From March to September, faecal coliform concentrations ranged from 26.0 to 50.0 CFU/100 mL. The lowest concentration, 26.0 CFU/100 mL, was recorded in May, when the water table was at its lowest. The highest concentration, 50.0 CFU/100 mL, was recorded in July, after the first rains. By the last month of the study (September—wet season), coliform concentrations had fallen from 50.0 CFU/100 mL to 38.0 CFU/100 mL. The presence of domestic animals near the water source was frequently observed, especially during the dry season.
Eight samples were also collected in Infaidi: four during the dry season (March to May) and four during the wet season (September and October) (Figure 4, Table 3). The hand-pumped water point was out of service from July to September. Sampling resumed after repairs in September. Faecal coliform concentrations varied considerably throughout the study period, ranging from 1.0 to 50.0 CFU/100 mL. There was a sharp increase from 1.0 CFU/100 mL in May to 50.0 CFU/100 mL in September, following repairs to the water point and the seasonal shift. In October (wet season), the concentration decreased to 23.0 CFU/100 mL, similar to the level recorded in March.
In Insanha, eight samples were collected: four during the dry season (March and May) and four during the wet season (July and September) (Figure 4, Table 3). Faecal coliform concentrations varied significantly over the course of the study, ranging from 1.0 to 30.0 CFU/100 mL. During the dry season, coliforms were either absent or present in very low concentrations, with no detection in May (0 CFU/100 mL). However, at the beginning of the wet season in July, the concentration rose sharply to 30.0 CFU/100 mL. Throughout the wet season, faecal coliform levels remained higher than during the dry season, ranging from 30.0 CFU/100 mL in July to 7.0 CFU/100 mL at the end of September.

3.3.2. Monitoring of Physical Parameters

In Cangha N’Tchugal, conductivity ranged from 31.0 μS/cm at the beginning of March (dry season) to 73.0 μS/cm at the end of March (dry season). The concentration of total dissolved solids (TDS) followed a similar trend, varying between 15.0 and 43.0 ppm over the same period. Both parameters showed a general decrease from the dry to the wet season (Table 4). Turbidity was also monitored and ranged from 0.1 NTU at the end of August (wet season) to 0.3 NTU at the end of March (dry season), with lower values in the wet season.
In Cajaque, conductivity varied from 70.0 μS/cm in mid-March (dry season) to 205.0 μS/cm in September (wet season). TDS concentrations ranged from 44.0 ppm in early March (dry season) to 102.0 ppm in September (wet season). Turbidity varied from 1.1 to 9.0 NTU, with a marked increase from 1.8 NTU in May (dry season) to 9.1 NTU in July (early wet season) (Table 4).
In Infadi, both conductivity and TDS showed some seasonal variation, with conductivity ranging from 292.0 μS/cm (early September) to 388.0 μS/cm (late September), and TDS from 150.0 ppm (March) to 208.0 ppm (early September). Turbidity values, however, increased significantly, ranging from 9.0 in March to 66.3 NTU in September. During the dry season, turbidity fluctuated only slightly, from 5.5 to 7.5 NTU (May), but showed a sharp increase from 7.5 NTU in May to 65.0 NTU in September.
In Insana, conductivity during the dry season varied from 314.0 μS/cm at the beginning of March to 418.0 μS/cm at the end of March. During the wet season, values ranged from 94.0 μS/cm in August to 456.0 μS/cm in July (Table 4). A notable drop occurred in August, when conductivity fell from 396.0 μS/cm (first fortnight) to 94.0 μS/cm (second fortnight). TDS mirrored these trends, with concentrations remaining stable between March and early August (161.0 to 194.0 ppm), before dropping sharply in August from 194.0 ppm (first fortnight) to 33.0 ppm (second fortnight). Turbidity levels varied throughout the study period from 0.5 to 4.0 NTU (Table 4), with a slight decrease at the beginning of August and a significant increase at the end of the month, from 0.5 to 4.0 NTU. The highest turbidity was recorded at the end of August (4.0 NTU).

3.3.3. Monitoring of Chemical Parameters

In Cangha N’Chugal, pH values ranged from 4.7 in early March (dry season) to 5.1 in September (wet season) (Table 4). Salinity remained constant at 0 ppt throughout the study. Phosphate concentrations increased from 0 mg/L during the dry season to 0.2 mg/L in September (wet season). Ammonia concentrations increased from 0.05 mg/L in May to 0.09 mg/L in September. Iron concentrations decreased from 0.3 in May (dry season) to 0 mg/L in September (wet season). Aluminium concentrations decreased slightly from 0.05 mg/L in March (dry season) to 0.03 mg/L in August and September (wet season). Iron and aluminium concentrations generally decreased from the dry to wet season. No nitrite was detected from March to September.
In Cajaque, pH ranged from 4.9 in September (wet season) to 5.7 in August (wet season) (Table 4). Salinity remained stable at 0.1 g/L throughout the year. Phosphate concentrations increased from 0.1 mg/L in the dry season to 0.4 mg/L in August (wet season). Ammonia concentrations increased from 0.04 mg/L in March to 1.0 mg/L in August. Nitrite concentrations increased slightly from 0.0 mg/L (March to August) to 0.01 mg/L in September. Iron concentrations decreased significantly from 0.6 mg/L in May (dry season) to 0.07 mg/L in August (wet season). Its concentration ranged from 0.1 to 0.6 mg/L. Aluminium concentration decreased from 0.02 mg/L in August to 0.07 mg/L in September (Table 4).
In Infaidi, pH varied from 6.43 in March (dry season) to 6.7 in September (wet season) (Table 4). Salinity showed a slight decrease from 0.2 g/L to 0.1 g/L after the first water harvest after the repair in September. Phosphate concentrations decreased from 0.9 mg/L in May (dry season) to 0.5 mg/L in September (wet season) (Table 4). Ammonia concentrations remained stable at 0.3 mg/L during the dry season but decreased to 0.2 mg/L in October. Nitrite was only detected in September at a concentration of 0.5 mg/L after the pump repairs. Iron concentrations remained constant at 3.0 mg/L during the dry season. In the wet season, iron concentrations varied between 4.9 mg/L in September and 3.5 mg/L in October. Aluminium concentration remained stable at 0.01 mg/L during the dry season from March to May and increased slightly to 0.03 mg/L in September (wet season and after pump repair). During the wet season, the concentration decreased from 0.03 mg/L in September to 0.02 mg/L in October.
In Insanha, pH varied from 5.0 in August to 6.9 in July. Salinity remained constant at 0.2 g/L from March to August (Table 4), dropped to 0 g/L at the end of August, and remained at this level in September. Phosphate concentrations decreased from 0.4 mg/L in May (dry season) to 0.3 mg/L in August (wet season). Ammonia concentrations decreased from 0.2 mg/L in May to 0.03 mg/L in August (Table 4). Nitrite concentrations remained at 0 mg/L during the dry season (March and May) and early wet season but increased to 0.01 mg/L in September (wet season). Iron concentrations varied from 0.02 mg/L in August (wet season) to 0.09 mg/L in May (dry season). The largest change occurred at the beginning of the wet season: from 0.07 mg/L in July to 0.02 mg/L in August. Aluminium concentrations remained at 0 mg/L during the dry season (March and May) and increased slightly to 0.01 mg/L in September.

3.4. Evaluation of Seasonal Variation in Water Quality Parameters and Compliance with Recommended Standards

When comparing mean concentrations between seasons, there was an increase in colony-forming units (CFU) from the dry season to the wet season (Table 3, Figure 4). In Cangha N’Tchugal, CFU increased from 0 to 3.0 CFU/100 mL, in Cajaque from 40.0 to 50.0 CFU/100 mL, in Infaidi from 5.0 to 35.5 CFU/100 mL, and finally in Insanha from 0.5 to 11.5 CFU/100 mL. Throughout the study, faecal coliforms were detected in all localities, with median values of 3.0 CFU/100 mL in Cangha N’Tchugal, 50.0 CFU/100 mL in Cajaque, 35.5 CFU/100 mL in Infaidi, and 11.5 CFU/100 mL in Insanha. Except for the dry season samples in Cangha N’Tchugal, the values exceeded the parametric limits recommended by Directive (EU) 2020/2184 and the WHO Guidelines for Drinking-Water Quality, which set a limit of 0 CFU/100 mL. The quality control of the method, performed with 32 filtration blanks, always showed no contamination (0 CFU/100 mL).
With regard to physical parameters, the median conductivity values were generally lower in the wet season than in the dry season, except for Cajaque, where conductivity increased from 136.0 to 152.0 μS/cm (Table 4). Throughout the study, all mean conductivity values remained below the parametric limit (<2500 μS/cm) set by Directive (EU) 2020/2184. With regard to total dissolved solids, Cangha N’Tchugal and Insanha recorded lower median values in the wet season (23.5 and 78.5 ppm, respectively) than in the dry season (32.5 and 81.5 ppm). Conversely, Cajaque and Infaidi had higher levels in the dry season (182.5 and 118.0 ppm). All recorded values were below the limit of 1000 ppm for drinking water recommended by the WHO Guidelines for Drinking-Water Quality. Median turbidity values increased from the dry season to the wet season in Cajaque (1.7 to 3.3 NTU), Infaidi (7.5 to 58.2 NTU), and Insanha (2.1 to 2.3 NTU). Only Cangha N’Tchugal showed a decrease from 0.2 NTU in the dry season to 0.1 NTU in the wet season. Throughout the study, Insanha had an overall median turbidity of 30.0 NTU—the only location with values above the WHO Guidelines for Drinking-Water Quality recommended limit of 5 NTU.
In terms of chemical parameters, the median pH values in Cangha N’Tchugal, Cajaque, and Infaidi were consistent across both seasons (4.9–5.0; 5.4–5.4; and 6.6–6.6, respectively) (Table 4). However, Insanha showed a decrease in pH from 6.7 in the dry season to 6.0 in the wet season. Infaidi was the only locality with average pH values within the recommended range (≥6.5 and ≤9.5) set by Directive (EU) 2020/2184. Insanha’s pH was within the recommended range only during the dry season (6.7). Median salinity levels remained constant in both seasons in all localities, with values at or below the recommended maximum limit of 0.2 g/L. Median phosphate concentrations increased from the dry to the wet season in Cangha N’Tchugal (0 to 0.1 mg/L) and Cajaque (0.1 to 0.3 mg/L). In contrast, Infaidi and Insanha showed decreases from 0.9 to 0.6 mg/L and from 0.4 to 0.3 mg/L, respectively. Only Cangha N’Tchugal and Cajaque had values within the parametric limit of 0.2 mg/L recommended by Directive (EU) 2020/2184. Ammonia (NH3) concentrations increased from the dry to the wet season in Cangha N’Tchugal (0.06 to 0.08 mg/L) and Cajaque (0.1 to 0.5 mg/L). In Infaidi and Insana, ammonia concentrations remained similar between seasons. All ammonia concentrations throughout the study were below the 0.5 mg/L limit recommended for human consumption by Directive (EU) 2020/2184. No nitrites were detected in any locality during the dry season, while during the wet season, nitrite concentrations ranged from 0 to 0.01 mg/L in Cajaque. Median nitrite levels throughout the study period were below the recommended limit of 0.5 mg/L. Median iron concentrations decreased from the dry to the wet season in Cangha N’Tchugal (from 0.3 to 0.1 mg/L) and Cajaque (from 0.5 to 0.1 mg/L). However, in Infaidi, the median was higher in the wet season (3.7 mg/L) than in the dry season (3.0 mg/L). In Insanha, iron concentrations remained constant across seasons at 0.7 mg/L. Median iron values were above the recommended parametric limits in all localities, with Infaidi showing the highest concentration (3.7 mg/L). Median aluminium concentrations decreased from the dry to the wet season in Cangha N’Tchugal (0.06 to 0.03 mg/L) and Cajaque (0.1 to 0.05 mg/L). A slight increase in aluminium concentrations was recorded in Infaidi (0.01 to 0.02 mg/L) and Insanha (0.00 to 0.01 mg/L). All aluminium concentrations in all locations throughout the study were below the recommended limit of 0.2 mg/L set by Directive (EU) 2020/2184 and the WHO Guidelines for Drinking-Water Quality.

3.5. Determination of the Safe Water Indicator

For each water point, the percentage of analyses that met the recommended parametric values was calculated based on Directive (EU) 2020/2184, the WHO Guidelines for Drinking-Water Quality, and reports from the ERSAR—the Regulatory Authority for Water and Waste Services in Portugal [9,25,26].Guinea-Bissau does not have updated legislation or regulations for this purpose. According to the results in Table 5, the average compliance rate for the recommended values across all analyses was 85.0% in Cangha N’Tchugal, 71.0% in Cajaque, 53.0% in Infaidi, and 75.0% in Insanha. For the microbiological parameter of faecal coliform concentration, only 22.0% of the analyses met the recommended values for human consumption. In Cangha N’Tchugal, 63.0% of the analyses were compliant, while in Insanha, 25.0% were within the limits. In both Cajaque and Insanha, the compliance with the recommended values was 0%.
With regard to physicochemical parameters, only four parameters—conductivity, total dissolved solids, nitrites, and aluminium—were consistently within the recommended limits. The average compliance rate for pH determinations was 38%. In Cangha N’Tchugal and Cajaque, none of the samples met the recommended values, whereas in Infaidi and Insanha, 75.0% of the samples met the recommended values. The turbidity results showed an average compliance of 72.0%. All turbidity results from Cangha N’Tchugal and Insanha met the recommended values; however, in Cajaque and Infaidi, 88.0% and 0% of the results met the recommended values. For salinity, only 59.0% of the measurements were within the recommended values. In Cangha N’Tchugal and Cajaque, 100% of the samples were in compliance, while only 13.0% in Infaidi and 25.0% in Insanha were within the parametric limits.
Phosphate levels showed the lowest rate of compliance, with only 38.0% of analyses meeting the recommended values. In Cangha N’Tchugal, 100.0% of samples were in compliance; in Cajaque, this value was 50.0%, and in both Infaidi and Insanha it was 0%.
For ammonia concentrations, the overall compliance rate was 94.0%. In Cajaque, 75.0% of samples were compliant, while all results from Cangha N’Tchugal, Infaidi, and Insanha were within the recommended values.
For the iron parameter, 58.0% of the analyses were compliant with the recommended limits. In Cangha N’Tchugal and Cajaque, 67.0% of the analyses were within the parametric values, while in Insanha 100.0% were compliant, and none were compliant in Infaidi.

4. Discussion

This study represents the first monitoring of water quality in the Encheia section, supported by the NGDO TESE within the framework of the IG! LKI initiative under the European Union Programme for Resilience and Socio-Economic Opportunities for Guinea-Bissau, Ianda Guiné. The challenges encountered were both frequent and varied.
Throughout the 19 site visits, it was clear that all communities identified issues related to taste, appearance, and water scarcity during the dry season as their main concerns. These findings are consistent with the IG! LKI Action socio-economic study, where 27% of households reported poor water quality and 86% identified water scarcity during the dry season as a major challenge [27].
The microbiological results from this study are worrying and highlight the vulnerability of rural areas in Guinea-Bissau. Only 22% of the samples tested for faecal coliforms met the standards set by Directive (EU) 2020/2184 and the WHO Guidelines for Drinking-Water Quality [9,25]. The concentration of faecal coliforms was highest at the beginning of the wet season in all locations, a trend also observed in previous studies conducted in Guinea-Bissau, including those by Machado et al. in 2014 and 2022. In a 2014 study in Bolama [28], faecal coliforms were detected in all 11 wells tested, with an average value of 9346 CFU/100 mL. Similarly, in a 2022 study [29] of 252 water points in the Autonomous Sector of Bissau, as well as the east and south of Guinea-Bissau, 80% of the water samples showed faecal contamination. In both studies, the highest concentration of faecal coliforms also occurred during the wet season [29,30]. These findings are consistent with the Multiple Indicator Cluster Survey, which reported that in the Oio region, the risk of faecal contamination in water sources was 53%, the highest in the country. Around 75% of households using improved water sources and 89% using protected traditional wells were found to be consuming water contaminated with E. coli bacteria, confirming the differences found between Cajaque and the other localities [19]. Following the first heavy rains in June 2023, runoff likely transported microbiological contaminants such as bacteria and viruses from the soil and/or associated with faecal matter into the groundwater, increasing the faecal coliform concentrations in samples [31].
Several problems were also identified at the water points and surrounding areas, including a lack of preventive and curative maintenance, poor drainage systems, and limited public awareness of proper water use. This lack of knowledge exacerbates contamination and degrades water quality. It should be noted that the water analysed at all locations was untreated and collected directly from the source, without any treatment, storage, or distribution. There are no water treatment plants in the region. In addition, the water points did not meet the safety distance requirements outlined of the 1992 Water Code, which stipulates that water sources must be located at least five metres away from schools, health centres, or homes, and 30 m away from toilets or septic tanks [32,33]. As a result, the communities remain highly exposed to diarrhoeal diseases. In 2019 alone, 702,974 cases of diarrhoeal diseases were reported in the country, and past outbreaks remain a significant threat. Between 1994 and 2013, 83,635 cases of cholera were recorded, resulting in 1895 deaths, particularly during the wet season [34,35].
The pH values were acidic throughout the study period, ranging from 4.93 to 6.58, with lower values during the dry season, especially in Cajaque, Infaidi, and Insanha. Only 32% of the pH measurements were within the recommended range of ≥6.5 and ≤9.5, according to Directive (EU) 2020/2184 [25]. Similar pH values were observed in previous studies, including Bancessi et al.’s 2020 study [35] on Bissau and the Quinhamel sector. In this work, pH values were found to be low (4.87–5.59) in all water points analysed. The soil composition and acidity of the region, which is common throughout West Africa, probably explain this pH variation [35]. Acidic pH can affect the taste of water and reduce its acceptability, and long-term consumption can contribute to tooth erosion and digestive problems [35].
Total dissolved solids and electrical conductivity were within acceptable limits for human consumption throughout the study. The WHO Guidelines for Drinking-Water Quality recommend a maximum of 1000 ppm for total dissolved solids and Directive (EU) 2020/2184 recommends 2500 µS/cm for electrical conductivity [9]. The results in this study were consistent with those of previous studies by Bordalo and Bordalo [36] in 2007 and by Bancessi and co-workers [35] in 2020.
During this study, water turbidity was below the WHO recommended limits at most points, except in Cajaque and Infaidi [9]. At the beginning of the wet season, turbidity increased significantly in the improved traditional well of Cajaque, indicating immediate water contamination from soil particles. In the Infaidi borehole equipped with a hand pump, turbidity increased from 7.47 NTU to 48.8 UNT, far exceeding the Directive (EU) 2020/2184 and WHO Guidelines for Drinking-Water Quality recommendation of 5 NTU [9,25]. Similar results were reported by Bordalo and Bordalo in 2007 in the city of Bolama, where turbidity increased from 4 NTU to 68 NTU [36].
The results for the salinity concentrations analysed during the study period were equal to or less than 0.2 g/L. Directive (EU) 2020/2184 and the WHO Guidelines for Drinking-Water Quality have not yet defined recommended maximum values for salinity in water intended for human consumption. However, due to the importance of evaluating the results obtained, concentrations lower than 0.2 g/L were considered an acceptable parametric value. This value was based on the Guidelines for Drinking-Water Quality, fourth edition, incorporating the first and second addendum of 2022, which indicates that concentrations higher than 200 mg/L may cause an unacceptable taste [9]. In all the water points analysed, only 59% of the analyses performed were below the parametric value defined in this study. On the other hand, the concentration decreased significantly from the dry season to the wet season. This decrease in concentration may be directly related to the recharge of the catchment aquifer by rainwater infiltration [35]. Similar results were reported by Bancessi and co-workers in their study carried out in Guinea-Bissau in 2020 [35], with the values obtained for boreholes equipped with hand pumps averaging 0.07 ppm. On the island of Bolama, Bordalo and Bordalo [36] excluded the possibility of salinity concentrations in water for human consumption, considering the electrical conductivity values in the area to be low. Although this is an empirical perception, during the study, the communities reported excessive salinity in the water as a quality problem. Despite this perception, the results obtained show that the values of this parameter did not exceed the recommended values. The risk of saline intrusion in Guinea-Bissau and, particularly in the Oio region, is a reality due to the country’s geography [37]. Climate change and the rising average sea level are a reality that is truly exposing the region’s groundwater to a new scenario [38,39].
Phosphate concentrations exceeded the recommended limits [9] in Infaidi and Insanha, which is consistent with the findings of Kulinkina et al. in Ghana in 2017, where phosphates increased during the wet season [40]. The increase in phosphate concentration may be directly related to the infiltration of particles and pollutants into the soil as a result of human activities, e.g., via agricultural runoff and poor sanitation [41].
Ammonia concentrations analysed from March to October were only below the value recommended by Directive (EU) 2020/2184 [25] after the first rains in Cajaque. In the specific case of Cajaque, being a traditional well, there was a peak in the maximum concentration immediately after the wet season and a rapid return to values within the parametric values. This event may be related to the carry-over of organic matter due to decomposition or agricultural activities in the vicinity [41].
During the study, 58% of the iron parameter measurements were within the parametric values recommended by Directive (EU) 2020/2184, which sets a limit of 0.2 mg/L [25]. However, the Infaidi locality consistently recorded iron concentrations well above the values recommended by the Directive for human consumption throughout the study period. In all other localities, a significant decrease in dissolved iron concentrations was observed from the dry to the wet season, which contrasts with the results of previous studies by Bordalo et al. in 2007 [36] and by Bancessi and co-workers in 2020 [35]. In the 2007 study carried out in Bolama, iron levels were higher in the wet season compared to the dry season, with concentrations increasing from 0.017 mg/L in the dry season to 0.489 mg/L in the wet season. Similarly, the 2020 study on the Autonomous Sector of Bissau and the Quinhamel Sector found a significant increase in iron concentrations, from 0.01 mg/L in the dry season to 1.8 mg/L in the wet season across six hand pump samples [35,36]. Iron, a common heavy metal, in its inorganic form Fe2+ is typically associated with groundwater that is low in dissolved oxygen [9], as observed at the hand-pumped water points in Cangha N’Tchugal, Infaidi, and Insanha. The unique geological and hydrogeological characteristics of the study area are likely to contribute to the variation in iron concentrations between sampling points and between seasons. According to the geological map of Guinea-Bissau (accessible via the GEOPORTAL of the National Laboratory of Energy and Geology), the area is located in a transition zone, with soils composed mainly of sand, clay and laterite down to a depth of 50 m [42]. The seasonal decrease in iron concentrations during the wet season may be related to aquifer recharge, which could dilute the presence of this element in the water. The presence of iron in drinking water can cause an unpleasant taste and lead to ferruginous deposits [40,43]. Although iron is essential for human health, prolonged consumption and exposure to concentrations above the recommended levels can cause liver, kidney, and heart problems, especially in genetically predisposed individuals [2,44].During the study period, the concentrations of aluminium and nitrites were within the recommended limits set by Directive (EU) 2020/2184 and the WHO Guidelines for Drinking-Water Quality [9,25]. However, in Cajaque, Infaidi, and Insanha, nitrite concentrations increased from the dry to the wet season. Similar results were reported by Machado et al. in 2013 on the island of Bolama, where nitrite concentrations rose from 0 mg/L in the dry season to 0.38 mg/L in the wet season [30].
Overall, the drinking-water quality is poor, according to the assessment of the eleven water quality parameters in the study areas. Only water sources that meet 99% of the parametric values meet the European Commission standards [25]. The poor quality of access to water for human consumption in all locations is worrying. Of all the sampling points analysed, Infaidi had the lowest water quality, which poses a significant health risk, especially given its proximity to a school with 532 students, according to information collected from the Director of the Flora Gomes School in 2022/2023.
The lack of regular monitoring and infrastructure investment in rural areas contributes to the deregulation of the water sector and a lack of accountability for maintaining improved water points. This problem is evident in Impasse, where the community’s hand pump remained out of service for several months. Improved water is defined as water intended for human consumption that is protected from external contamination [45]. Boreholes with hand pumps and traditionally protected wells are considered improved water sources, but in practice, these sources lack treatment, storage, and distribution systems. According to the WHO/UNICEF monitoring programme, water points are considered potable if they are from an improved source and can provide safe water. In practice, however, the water points analysed do not meet these criteria [45].
Climate change and seasonal variations in Guinea-Bissau could have a profound impact on access to drinking water and its quality. According to the General Directorate of Meteorology of Guinea-Bissau, the country faces worrying scenarios. Temperatures are projected to rise by 1.77 and 1.95 °C by 2050 [3,46]. In addition, sea level rise, coastal erosion, and reduced annual rainfall could impede aquifer recharge and increase the risk of saline intrusion. This scenario is exacerbated by the over-exploitation of soil and groundwater, deforestation, inadequate water supply infrastructure, and the country’s fragile governance system, making rural communities particularly vulnerable.
During the study period, it was planned to not only monitor water quality, but also to assess the number of cases of illness in the population, especially cases of gastrointestinal problems. However, this was not possible due to the lack of patient records and diagnostic documentation within the limited existing health infrastructure.
In order to obtain a wider range of results, it was also planned to assess the water quality in more locations, such as Impasse, but this was not possible due to the breakdown of water supply equipment or for reasons related to the logistics of the sampling.
The methodology used was possible due to the existing infrastructure in the country and the resources available. In future studies, new Most Probable Number (MNP) methods, such as Colilert, Pseudalert, or Enterolert, could be tested and applied, which would allow the detection of more pathogens [47].
It is considered that despite some adjustments to the original plan, the project was carried out without major unforeseen events, and has provided very relevant data for a poor rural region, where no studies have been carried out.
In view of the scenario described, it is extremely important in the near future to improve the existing reduced structures and to build small Water Treatment Plants (WTPs) at water points, especially the most used ones. The use of an appropriate treatment system with chlorine or other disinfectants would eliminate pathogens, such as the faecal coliform bacteria found [9,48]. In addition to improving microbiological quality, controlling/reducing physicochemical parameters such as pH, turbidity, and the concentration of nutrients such as phosphates and metals such as iron can be achieved [9,48]. In parallel to this, it is necessary to strengthen the education and participation of the population in improving their practices, such as the reduction/elimination of open defecation, especially near water [48]. A regulatory framework for the water sector should also be established. This document should include the parameters to be monitored in drinking water, the maximum values, and the regularity of the analyses.

5. Conclusions

The results of this study highlight the lack of access to good quality drinking water in the four locations studied. The microbiological and physicochemical quality of the water varied significantly between seasons, with faecal coliform bacteria detected in all water points. Measurements of several physicochemical parameters, including pH, turbidity, salinity, phosphates, ammonia, and iron, showed that recommended parametric values were not consistently met.
Although water availability varied between sampling points, it was always present, with the lowest levels recorded during the dry season due to the lowering of the water table. However, the lack of preventive and corrective maintenance at all points, coupled with the absence of drainage and treatment systems, is an urgent problem that needs to be addressed.
The lack of national regulatory frameworks, and quality standards for the effective management of water resources and infrastructure is a major challenge, especially in the context of climate change. Failure to address these issues may jeopardize progress towards achieving the Sustainable Development Goals related to drinking water and sanitation.
This study provides important initial data on water access and quality in the Encheia section, which can help fill information gaps for rural communities. It is hoped that these results will raise awareness among the local population of the importance of good water management practices and the need for ongoing monitoring, particularly in rural areas of developing countries.
In future studies, it will be important to increase the number of sampling sites, the frequency of sampling, and the number of microbiological parameters investigated.

Author Contributions

Conceptualization, P.S., M.T.R. and D.S.; methodology, P.S., M.T.R. and D.S.; software, P.S. and D.S.; validation, M.T.R. and D.S.; formal analysis, M.T.R. and D.S.; investigation, P.S.; resources, P.S., M.T.R. and D.S.; data curation, P.S.; writing—original draft preparation, P.S. and D.S.; writing—review and editing, M.T.R. and D.S.; visualization, P.S.; supervision, M.T.R. and D.S.; project administration, P.S., M.T.R. and D.S.; funding acquisition, M.T.R. and D.S. All authors have read and agreed to the published version of the manuscript.

Funding

Data Availability Statement

Dataset available on request from the authors.

Acknowledgments

The authors are grateful to the Non-Governmental Organization for Development (NGDO) TESE—Associação para o Desenvolvimento—for operational and logistical support in Guinea-Bissau.

Conflicts of Interest

The authors declare no conflicts of interest.

References

  1. Vieira, J.M.P. Água e Saúde Pública, 1st ed.; Sílabo Publishing: Lisbon, Portugal, 2018. [Google Scholar]
  2. Ogoamaka, E.M. Review of the Effects of Water Characteristics and Quality on Human Health. Int. J. Curr. Res. 2022, 5, 673–685. [Google Scholar] [CrossRef]
  3. UN-Water. Summary Progress Update 2021—SDG 6—Water and Sanitation for All. Geneva, Switzerland. 2021. Available online: https://www.unwater.org/publications/summary-progress-update-2021-sdg-6-water-and-sanitation-all (accessed on 11 April 2024).
  4. UN, United Nations. The United Nations World Water Development Report 2023: Partnerships and Cooperation for Water. UNESCO, Paris. 2023. Available online: https://www.unwater.org/publications/un-world-water-development-report-2023 (accessed on 3 April 2024).
  5. The Global Goals, Goal 6: Ensure Access to Water and Sanitation for All. Available online: https://www.globalgoals.org/goals/6-clean-water-and-sanitation/ (accessed on 16 April 2024).
  6. Naddeo, V. One Planet, One Health, One Future: The Environmental Perspective. Water Environ. Res. 2021, 93, 1472–1475. [Google Scholar] [CrossRef] [PubMed]
  7. Planetary Health Alliance Planetary Health. Available online: https://www.planetaryhealthalliance.org/planetary-health (accessed on 16 April 2024).
  8. UNICEF, United Nations Children’s Fund; WHO, World Health Organization. Progress on Household Drinking Water, Sanitation and Hygiene 2000–2022: Special Focus on Gender. New York, USA. 2023. Available online: https://washdata.org/reports/jmp-2023-wash-households (accessed on 10 February 2024).
  9. WHO, World Health Organization. Guidelines for Drinking-Water Quality: Fourth Edition Incorporating the First and Second Addenda. Geneva, Switzerland. 2023. Available online: https://www.who.int/publications/i/item/9789241549950 (accessed on 6 November 2023).
  10. Shah, A.; Arjunan, A.; Baroutaji, A.; Zakharova, J. A Review of Physicochemical and Biological Contaminants in Drinking Water and Their Impacts on Human Health. Water Sci. 2023, 16, 333–344. [Google Scholar] [CrossRef]
  11. Matthew, M.; Tainter, C.R. Escherichia Coli Infection; StatPearls Publishing: Treasure Island, FL, USA, 2024. [Google Scholar]
  12. Gray, N.F. Water Technology: An Introduction for Environmental Scientists and Engineers, 3rd ed.; IWA Publishing: London, UK, 2010. [Google Scholar]
  13. Saccò, M.; Mammola, S.; Altermatt, F.; Alther, R.; Bolpagni, R.; Brancelj, A.; Brankovits, D.; Fišer, C.; Gerovasileiou, V.; Griebler, C.; et al. Groundwater Is a Hidden Global Keystone Ecosystem. Glob. Chang. Biol. 2024, 30, e17066. [Google Scholar] [CrossRef]
  14. TESE—Associação para o Desenvolvimento (NGDO, Avenida do Brasil, 155 A, 1700–067 Lisbon, Portugal). Benchmark—Gestão e Concessão de Sistemas de Fornecimento de Água e Energia na Guiné-Bissau. Unpublished work. 2021. [Google Scholar]
  15. World Bank Guiné-Bissau—Aspectos Gerais. Bissau, Guinea-Bissau. 2023. Available online: https://www.worldbank.org/pt/country/guineabissau/overview (accessed on 25 November 2023).
  16. WHO, World Health Organization—Guinea-Bissau. Bissau, Guinea-Bissau. 2024. Available online: https://www.afro.who.int/pt/countries/guinea-bissau (accessed on 13 April 2024).
  17. UNDP, United Nations Development Programme. Human Development Report 2021/2022. New York, USA. 2022. Available online: https://hdr.undp.org/system/files/documents/global-report-document/hdr2021-22reportenglish_0.pdf (accessed on 3 November 2023).
  18. INE, National Institute of Statistics of Guinea-Bissau, Recenseamento Geral da População e Habitação de 2009. Bissau, Guinea-Bissau. Available online: https://www.stat-guinebissau.com/ (accessed on 9 January 2024).
  19. Ministry of Economy and Finance, General Directorate of Planning; INE, National Institute of Statistics of Guinea-Bissau. Inquérito aos Indicadores Múltiplos (MICS6) 2018–2019, Relatório Final; Bissau, Guinea-Bissau. 2020. Available online: https://www.unicef.org/guineabissau/pt/relatorios/inqu%C3%A9rito-aos-indicadores-m%C3%BAltiplos-2018-2019 (accessed on 24 April 2024).
  20. Aregu, M.B.; Kanno, G.G.; Ashuro, Z.; Alembo, A.; Alemayehu, A. Safe Water Supply Challenges for Hand Hygiene in the Prevention of COVID-19 in Southern Nations, Nationalities, and People’s Region (SNNPR), Ethiopia. Heliyon 2021, 7, e08430. [Google Scholar] [CrossRef] [PubMed]
  21. DelAgua Water Testing Ltd., DelAgua Portable Water Testing Kit User Manual. Marlborough, Wiltshire, UK. 2020. Available online: https://www.delagua.org/wp-content/uploads/2021/04/DelAgua-Manual-Revised-2020-V1.pdf (accessed on 12 December 2022).
  22. Hanna Instruments, HI 98129–HI 98130 Medidores de pH, EC/TDS & Temperature. Woonsocket, USA. 2019. Available online: https://www.hanna.pt/fichs/ficheiros/HI98129_HI98130.pdf (accessed on 12 December 2022).
  23. Thermo Fisher Scientific, TN-100 Waterproof Turbidimeter. Massachusetts, USA. 2015. Available online: https://www.thermofisher.com/order/catalog/product/ECTN100NOSTDS?SID=srch-srp-ECTN100NOSTDS (accessed on 15 December 2022).
  24. Lovibonad, Fotómetro MD600/MaxiDirect. Dortmund, Germany. 2017. Available online: https://lovibond.eu/downloads/instructions/md600,md610/ins_md600_gb_lovi.pdf (accessed on 12 December 2022).
  25. EU, European Union. Directive (EU) 2020/2184 of the European Parliament and of the Council of 16 December 2020 on the Quality of Water Intended for Human Consumption. Brussels, Belgium. 2020. Available online: https://eur-lex.europa.eu/legal-content/PT/TXT/PDF/?uri=CELEX:32020L2184 (accessed on 14 December 2023).
  26. ERSAR, Regulatory Entity for Water and Waste Services. RASARP 2023—Volume 2—Controlo da Qualidade da Água para Consumo Humano. Lisbon, Portugal. 2023. Available online: https://www.ersar.pt/pt/site-comunicacao/site-notas-a-imprensa/Paginas/rasarp-volume2-edicao2023.aspx (accessed on 24 April 2024).
  27. TESE—Associação para o Desenvolvimento (NGDO, Avenida do Brasil, 155 A, 1700–067 Lisbon, Portugal). Estudo Socioeconómico para Implementação de Serviços de Água e Energia. Unpublished work. 2021. [Google Scholar]
  28. Machado, A.; Bordalo, A.A. Diversity and Dynamics of the Vibrio Community in Well Water Used for Drinking in Guinea-Bissau (West Africa). Environ. Monit. Assess. 2014, 186, 5697–5709. [Google Scholar] [CrossRef]
  29. Machado, A.; Amorim, E.; Bordalo, A.A. Spatial and Seasonal Drinking Water Quality Assessment in a Sub-Saharan Country (Guinea-Bissau). Water 2022, 14, 1987. [Google Scholar] [CrossRef]
  30. Machado, A.; Bordalo, A.A. Analysis of the Bacterial Community Composition in Acidic Well Water Used for Drinking in Guinea-Bissau, West Africa. J. Environ. Sci. 2014, 26, 1605–1614. [Google Scholar] [CrossRef] [PubMed]
  31. Abu-Ashour, J.; Joy, D.M.; Lee, H.; Whiteley, H.R.; Zelin, S. Transport of microorganisms through soil. Water Air Soil Poll. 1994, 75, 141–158. [Google Scholar] [CrossRef]
  32. Boletim Oficial da República da Guiné-Bissau. Código das águas; Bissau, Guinea-Bissau. 1992. Available online: https://faolex.fao.org/docs/pdf/gbs39315.pdf (accessed on 26 April 2024).
  33. Ashuro, Z.; Aregu, M.B.; Kanno, G.G.; Negassa, B.; Soboksa, N.E.; Alembo, A.; Ararsa, E.; Badecha, F.; Tassew, S. Bacteriological Quality of Drinking Water and Associated Factors at the Internally Displaced People Sites, Gedeo Zone, Southern Ethiopia: A Cross-Sectional Study. Environ. Health Insights 2021, 15, 11786302211026469. [Google Scholar] [CrossRef] [PubMed]
  34. Mølbak, K.; Aaby, P.; Ingholt, L.; Højlyng, N.; Gottschau, A.; Andersen, H.; Brink, L.; Gansted, U.; Permin, A.; Vollmer, A.; et al. Persistent and acute diarrhea as the leading causes of child mortality in urban Guinea Bissau. Trans. R. Soc. Trop. Med. Hyg. 1992, 86, 216–220. [Google Scholar] [CrossRef]
  35. Bancessi, A.; Catarino, L.; Silva, M.J.; Ferreira, A.; Duarte, E.; Nazareth, T. Quality Assessment of Three Types of Drinking Water Sources in Guinea-Bissau. Int. J. Environ. Res. Public Health 2020, 17, 7254. [Google Scholar] [CrossRef] [PubMed]
  36. Bordalo, A.A.; Savva-Bordalo, J. The Quest for Safe Drinking Water: An Example from Guinea-Bissau (West Africa). Water Res. 2007, 41, 2978–2986. [Google Scholar] [CrossRef]
  37. Biai, I. Efeitos das Alterações Climáticas na Zona Costeira Noroeste da Guiné-Bissau. Master’s Thesis, Instituto Superior Técnico da Universidade de Lisboa, Lisbon, Portugal, 2009. [Google Scholar]
  38. IOM, Institute of Medicine. Global Issues in Water, Sanitation, and Health; The National Academies Press: Washington, DC, USA, 2009. [Google Scholar]
  39. Secretary of State for Environment and Sustainable Development. Second National Communication on Climate Changes in Guinea-Bissau. Bissau, Guinea-Bissau. 2011. Available online: https://unfccc.int/sites/default/files/resource/Complete_NC2.pdf (accessed on 20 November 2023).
  40. Kulinkina, A.V.; Plummer, J.D.; Chui, K.K.H.; Kosinski, K.C.; Adomako-Adjei, T.; Egorov, A.I.; Naumova, E.N. Physicochemical Parameters Affecting the Perception of Borehole Water Quality in Ghana. Int. J. Hyg. Environ. Health 2017, 220, 990–997. [Google Scholar] [CrossRef] [PubMed]
  41. Lamrani Alaoui, H.; Oufdou, K.; Mezrioui, N. Environmental Pollutions Impacts on the Bacteriological and Physicochemical Quality of Suburban and Rural Groundwater Supplies in Marrakesh Area (Morocco). Environ. Monit. Assess. 2008, 145, 195–207. [Google Scholar] [CrossRef]
  42. LNEG, Laboratório Nacional de Energia e Geologia, Carta Geológica da República da Guiné-Bissau. Lisbon, Portugal. 2015. Available online: https://geoportal.lneg.pt/pt/dados_abertos/cartografia_geologica/cartografiageologicainternacional/cartaguinebissau/ (accessed on 11 March 2024).
  43. Madilonga, R.T.; Edokpayi, J.N.; Volenzo, E.T.; Durowoju, O.S.; Odiyo, J.O. Water Quality Assessment and Evaluation of Human Health Risk in Mutangwi River, Limpopo Province, South Africa. Int. J. Environ. Res. Public Health 2021, 18, 6765. [Google Scholar] [CrossRef] [PubMed]
  44. Gebresilasie, K.G.; Berhe, G.G.; Tesfay, A.H.; Gebre, S.E. Assessment of Some Physicochemical Parameters and Heavy Metals in Hand-Dug Well Water Samples of Kafta Humera Woreda, Tigray, Ethiopia. Int. J. Anal. Chem. 2021, 2021, 8867507. [Google Scholar] [CrossRef]
  45. WHO, World Health Organization, Improved Sanitation Facilities and Drinking Water Sources. Available online: https://www.who.int/data/nutrition/nlis/info/improved-sanitation-facilities-and-drinking-water-sources (accessed on 12 April 2024).
  46. Papa, F.; Crétaux, J.F.; Grippa, M.; Robert, E.; Trigg, M.; Tshimanga, R.M.; Kitambo, B.; Paris, A.; Carr, A.; Fleischmann, A.S.; et al. Water Resources in Africa under Global Change: Monitoring Surface Waters from Space. Surv. Geophys. 2023, 44, 43–93. [Google Scholar] [CrossRef]
  47. Tambi, A.; Brighu, U.; Gupta, A.B. Methods for detection and enumeration of coliforms in drinking water: A review. Water Supply 2023, 23, 4047–4058. [Google Scholar] [CrossRef]
  48. Wang, H.; Wang, T.; Zhang, B.; Li, F.; Toure, B.; Omosa, I.B.; Chiramba, T.; Abdel-Monem, M.; Pradhan, M. Water and Wastewater Treatment in Africa—Current Practices and Challenges. CLEAN Soil Air Water 2014, 42, 1029–1035. [Google Scholar] [CrossRef]
Figure 1. Location of the study areas in Encheia, Bissorã sector. Author’s map.
Water 16 03621 g001
Figure 2. Representation of the study area and the sampling points in the localities of Cangha N’Tchugal, Cajaque, Infaidi, and Insanha. Map and photographs by the authors.
Water 16 03621 g002
Figure 3. Study flowchart.
Water 16 03621 g003
Figure 4. Concentration of faecal coliforms (CFU/100 mL) in water samples from the study localities: Cangha N’Tchugal (n = 8) 0 to 9.0 CFU/100 mL; Cajaque (n = 8) 26.0 to 50.0 CFU/100 mL; Infaidi (n = 8) 1.0 to 50 CFU/100 mL; and Insanha (n = 8) 1.0 to 30.0 CFU/100 mL.
Water 16 03621 g004
Table 1. Date of water sampling at the study locations.
DateLocations
Cangha Tchugal *Cajaque *Infaidi *Insanha *
Dry season
(December to May)
01/MarchSCSCSCSC
15/MarchSCSCSCSC
29/MarchSCSCSCSC
10/MaySCSCSCSC
Wet season (June to November)05/July-SC-SC
09/AugustSCSC-SC
23/AugustSCSC-SC
01/SeptemberSCSCSCSC
06/September--SC-
13/SeptemberSC-SC-
04/October--SC-
Note(s): * Baseline information was collected for all visits between October 2022 and October 2023. SC—Sample collection. (-)—No sample.
Table 2. Sociodemographic characterisation of the population of the four localities: Cangha N’Tchugal, Cajaque, Infaidi, and Insanha.
LocalityParameterCharacterisation
Cangha N’TchugalResident population457 inhabitants
65 households
Number of houses60 houses
AccessibilityDirty access roads, bad condition
Commercial and religious infrastructures7 grocery stores
1 evangelical church
Civil society2 community structures (youth and women’s groups) involved in agriculture/horticulture area
School infrastructures1 school (first to seventh grade)
Hygiene and sanitary practicesNo toilets
Open defecation is a common practice
CajaqueResident population260 inhabitants
37 households
Number of houses50 houses
AccessibilityDirty access roads, bad condition
Commercial and religious infrastructures1 grocery store
Civil societyWomen Farmers Group and NGO intervention in the agriculture sector, mainly in rice production
School infrastructuresNo schools
Hygiene and sanitary practices3 traditional household toilets
Open defecation is a common practice
InfaidiResident population318 inhabitants
45 households
Number of houses53 houses
AccessibilityDirty access roads, bad condition
Commercial and religious infrastructuresWithout infrastructures
Civil society2 community structures (youth and women’s groups) involved in agriculture/horticulture area
School infrastructures1 school—Flora Gomes (teaching up to the ninth grade)
Hygiene and sanitary practices13 traditional household toilets
Open defecation is a common practice
InsanhaResident population126 inhabitants
18 households
Number of houses17 houses
AccessibilityDirty access roads, bad condition
Commercial and religious infrastructuresWithout infrastructures
Civil society2 community structures (youth and women’s groups) involved in agriculture/horticulture area
School infrastructuresNo school
Hygiene and sanitary practices1 traditional household toilet
Open defecation is a common practice
Table 3. Median, minimum, and maximum values of the microbiological parameter of faecal coliforms, seasonally measured for the Cangha N’Tchugal (n = 8), Cajaque (n = 8), Infaidi (n = 8), and Insanha (n = 8) localities. Parametric values recommended by the European Union Directive (EU) 2020/2184 and the WHO Guidelines for Drinking-Water Quality.
ParameterLocalitySeasonMedian Period of StudyRecommended Parametric Value
(EU/WHO)
DryWet
MinimumMaximumMedianMinimumMaximumMedian
Faecal Coliforms (CFU/100 mL)Cangha N’Tchugal0002.09.03.000
Cajaque26.040.029.038.050.050.039.0
Infaidi1.022.05.010.050.035.516.0
Insanha1.06.00.57.030.011.56.5
Table 4. Median, minimum, and maximum values of the physicochemical parameters of water quality, seasonally measured for the Cangha N’Tchugal, Cajaque, Infaidi, and Insanha localities. Parametric values recommended by the European Union Directive (EU) 2020/2184 and the WHO Guidelines for Drinking-Water Quality.
ParameterLocalitySeasonMedian Period of StudyRecommended Parametric Value
(EU/WHO)
DryWet
MinimumMaximumMedianMinimumMaximumMedian
Physical parametersConductivity (μS/cm)Cangha N’Tchugal (n = 8)31.073.056.035.060.036.038.52500.0
Cajaque (n = 8)70.0196.0136.097.0205.0152.0152.0
Infaidi (n = 8)300.0380.0370.5292.0388.0352.0368.5
Insanha (n = 8)314.0418.0346.594.0456.0252.5346.5
Total Dissolved Solids (ppm)Cangha N’Tchugal (n = 8)15.043.032.517.031.023.527.51000.0
Cajaque (n = 8)44.096.081.563.0102.078.578.5
Infaidi (n = 8)150.0185.0181.0169.0208.0182.5181.5
Insanha (n = 8)161.0209.0183.033.0218.0118.0178.5
Turbidity (NTU)Cangha N’Tchugal (n = 8)0.10.30.20.10.20.10.15.0
Cajaque (n = 8)1.12.01.70.89.03.31.7
Infaidi (n = 8)5.515.87.544.866.358.230.3
Insanha (n = 8)1.12.32.10.54.02.32.1
Chemical parameterspHCangha N’Tchugal (n = 8)4.75.04.94.95.15.05.0≥6.5 and ≤9.5
Cajaque (n = 8)5.15.65.44.95.75.45.4
Infaidi (n = 8)6.46.66.66.56.76.66.6
Insanha (n = 8)6.66.76.75.06.96.06.7
Salinity (g/L)Cangha N’Tchugal (n = 8)00000000.2
Cajaque (n = 8)0.10.10.10.10.10.10.1
Infaidi (n = 8)0.20.20.20.10.20.20.2
Insanha (n = 8)0.20.20.200.20.10.2
Phosphates (mg/L)Cangha N’Tchugal (n = 4)0000.090.20.10.050.2
Cajaque (n = 4)0.10.10.10.30.40.30.2
Infaidi (n = 6)0.810.90.50.80.60.8
Insanha (n = 4)0.30.40.40.30.30.30.3
Ammonia (mg/L)Cangha N’Tchugal (n = 4)0.050.060.060.060.090.080.060.5
Cajaque (n = 4)0.040.060.10.051.00.50.1
Infaidi (n = 6)0.30.30.30.20.40.30.3
Insanha (n = 4)0.20.20.20.030.10.10.1
Nitrites (mg/L)Cangha N’Tchugal (n = 4)00000000.5
Cajaque (n = 4)00000.010.010
Infaidi (n = 6)00000.5-0
Insanha (n = 4)00000.0100
Iron (mg/L)Cangha N’Tchugal (n = 5)0.20.30.300.20.10.10.02
Cajaque (n = 6)0.40.60.50.10.20.10.1
Infaidi (n = 7)3.03.03.03.54.93.73.5
Insanha (n = 5)0.050.090.070.020.070.070.07
Aluminium (mg/L)Cangha N’Tchugal (n = 4)0.050.060.060.030.030.030.040.2
Cajaque (n = 4)0.050.060.10.020.070.050.1
Infaidi (n = 6)0.010.010.010.020.030.020.02
Insanha (n = 4)00000.010.010
Table 5. Safe water indicator calculated based on the European Union Directive (EU) 2020/2184, the WHO Guidelines for Drinking-Water Quality, and reports from the ERSAR—the Regulatory Authority for Water and Waste Services in Portugal.
ParameterPercentage of Analyses Meeting the Recommended Parametric ValuesAverage Value per Parameter over the Study Period
Cangha N’TchugalCajaqueInfaidiInsanha
Faecal coliforms (CFU/100 mL)63.0%0%0%25.0%22.0%
Conductivity (μS/cm)100.0%100.0%100.0%100.0%100.0%
pH0%0%75.0%75.0%38.0%
Total dissolved solids (ppm)100.0%100.0%100.0%100.0%100.0%
Turbidity (NTU)100.0%88.0%0%100.0%72.0%
pH0%0%75.0%75.0%38.0%
Salinity (g/L)100.0%100.0%13.0%25.0%59.0%
Phosphates (mg/L)100.0%50.0%0%0%38.0%
Ammonia (mg/L)100.0%75.0%100.0%100.0%94.0%
Nitrites (mg/L)100.0%100.0%100.0%100.0%100.0%
Iron (mg/L)67.0%67.0%0%100.0%58.0%
Aluminium (mg/L)100.0%100.0%100.0%100.0%100.0%
Average value per locality over the study period85.0%71.0%53.0%75.0%-
Disclaimer/Publisher’s Note: The statements, opinions and data contained in all publications are solely those of the individual author(s) and contributor(s) and not of MDPI and/or the editor(s). MDPI and/or the editor(s) disclaim responsibility for any injury to people or property resulting from any ideas, methods, instructions or products referred to in the content.

