Article

Impact of Water-Induced Corrosion on the Structural Security of Transmission Line Steel Pile Poles

1
State Grid Wuxi Power Supply Company, Wuxi 214000, China
2
College of Materials Science and Engineering, Hohai University, Changzhou 213000, China
*
Author to whom correspondence should be addressed.
Water 2024, 16(24), 3581; https://doi.org/10.3390/w16243581 (registering DOI)
Submission received: 29 October 2024 / Revised: 26 November 2024 / Accepted: 5 December 2024 / Published: 12 December 2024

Abstract

:
In addressing the impact of corrosion on the structural integrity of steel transmission line poles, this study explores the variation in load-bearing capacity under water-related corrosion conditions using the finite element method. The analysis focuses on how corrosion at the base and cross-arm components of steel poles affects their mechanical performance and modal response. The investigation extends to evaluating the structural safety of steel poles under varying levels of water-induced corrosion, specifically considering combined wind load and broken-line load impacts through static equivalent analysis. The corrosion extent is quantified by the material mass loss rate, with material property degradation applied to simulate corrosion effects. Findings reveal that increased corrosion depth and length result in the concentration of stress and strain at affected areas, alongside decreased vibration frequencies, heightening resonance risk under wind loads. Furthermore, as the mass loss rate increases, maximum equivalent stress and elastic strain values rise significantly. This research provides a scientific basis for understanding water-related corrosion effects on steel transmission line poles, offering essential theoretical insights to enhance structural safety.

1. Introduction

With the continuous development and expansion of power systems, steel pipe poles have become essential support components for transmission lines, playing a crucial role in ensuring the stability of power transmission and distribution networks. However, these structures are often exposed to harsh environmental conditions, particularly those related to water, such as rainwater infiltration and high humidity. These conditions significantly contribute to both external and internal corrosion, which threaten the durability and safety of steel pipe poles. While external corrosion can be addressed through preventive measures such as anti-corrosion coatings and surface treatments, internal corrosion remains a more challenging issue. Internal corrosion, primarily caused by water accumulation inside the pole, occurs due to factors such as rainwater infiltration through zinc leakage holes and flange joints. This leads to hidden corrosion, which gradually weakens the structure over time and poses a serious threat to its long-term integrity.
Internal corrosion is a critical issue because water can collect at the base of steel tubular poles, causing prolonged exposure and significant wall thinning. This hidden degradation can result in stress concentration, ultimately leading to structural fractures or even collapse. The accumulation of water inside the pole, often reaching significant levels, accelerates internal corrosion in ways that are not immediately visible. Such corrosion-induced weakening becomes particularly dangerous under load conditions, such as wind or line breakage, which can cause catastrophic failure.
Although substantial research has been conducted on the effects of corrosion on the mechanical properties of steel, such as strength and ductility reductions due to cross-sectional area loss [1,2,3,4,5,6,7,8,9,10], the impact of corrosion caused by water ingress on the overall structural integrity of steel poles remains insufficiently explored. Shi [11] conducted tensile tests on corroded low-carbon steel beams, revealing a degradation pattern with increasing corrosion. Qin [12] examined the relationship between the surface morphology of corroded steel and the reduction in mechanical properties, while Xu [13] studied the impact of corrosion on steel, identifying degradation patterns in different structural components. However, most existing research focuses on material-level corrosion, with limited investigations into the structural-level implications of water-induced corrosion on steel pipe poles [14].
Q355 steel is widely used in the construction of transmission line poles due to its high strength, toughness, and resistance to wear. However, its mechanical response under the influence of water-induced internal corrosion has not been comprehensively studied. During the service life of these poles, water accumulation can exacerbate the effects of extreme load conditions, such as those caused by broken conductor lines or high wind speeds. These loads, when combined with internal corrosion, can severely compromise the load-bearing capacity and stability of the poles, leading to potential structural collapse and jeopardizing the safe and reliable operation of the power grid.
The study of the mechanical properties of steel pipe poles under corrosion is an important topic in structural engineering [15,16]. Finite element numerical simulation, as an effective analytical tool, can accurately model the effects of corrosion on steel pipe poles and reveal the changes in mechanical behavior during the corrosion process [17,18]. Compared to traditional experimental methods, numerical simulation offers advantages such as cost and time savings and the ability to handle complex environments. By simulating different corrosion forms, the effects of corrosion on the mechanical properties of steel pipe poles can be tracked, and multi-scale analysis can be conducted. This provides scientific support for the optimization of steel pipe poles and anti-corrosion measures.
This study systematically analyzes the mechanical behavior and modal response of corroded steel pipe poles through numerical simulation. A finite element model is developed, considering the structural characteristics of the poles and incorporating water-related corrosion scenarios. This study examines the effects of varying corrosion levels on the load-bearing capacity and vibration characteristics of poles under extreme conditions, such as broken-line loads and wind loads. Through static equivalent analysis, this research evaluates the safety of steel pipe poles subjected to combined water-induced corrosion and environmental loads, providing critical insights for improving structural stability and enhancing the service life of transmission line infrastructure.

2. Finite Element Modeling

The finite element analysis software Ansys Workbench 2021 R1 was used for numerical simulation, and wall thickness reduction was used to simulate corrosion.

2.1. Model Dimension

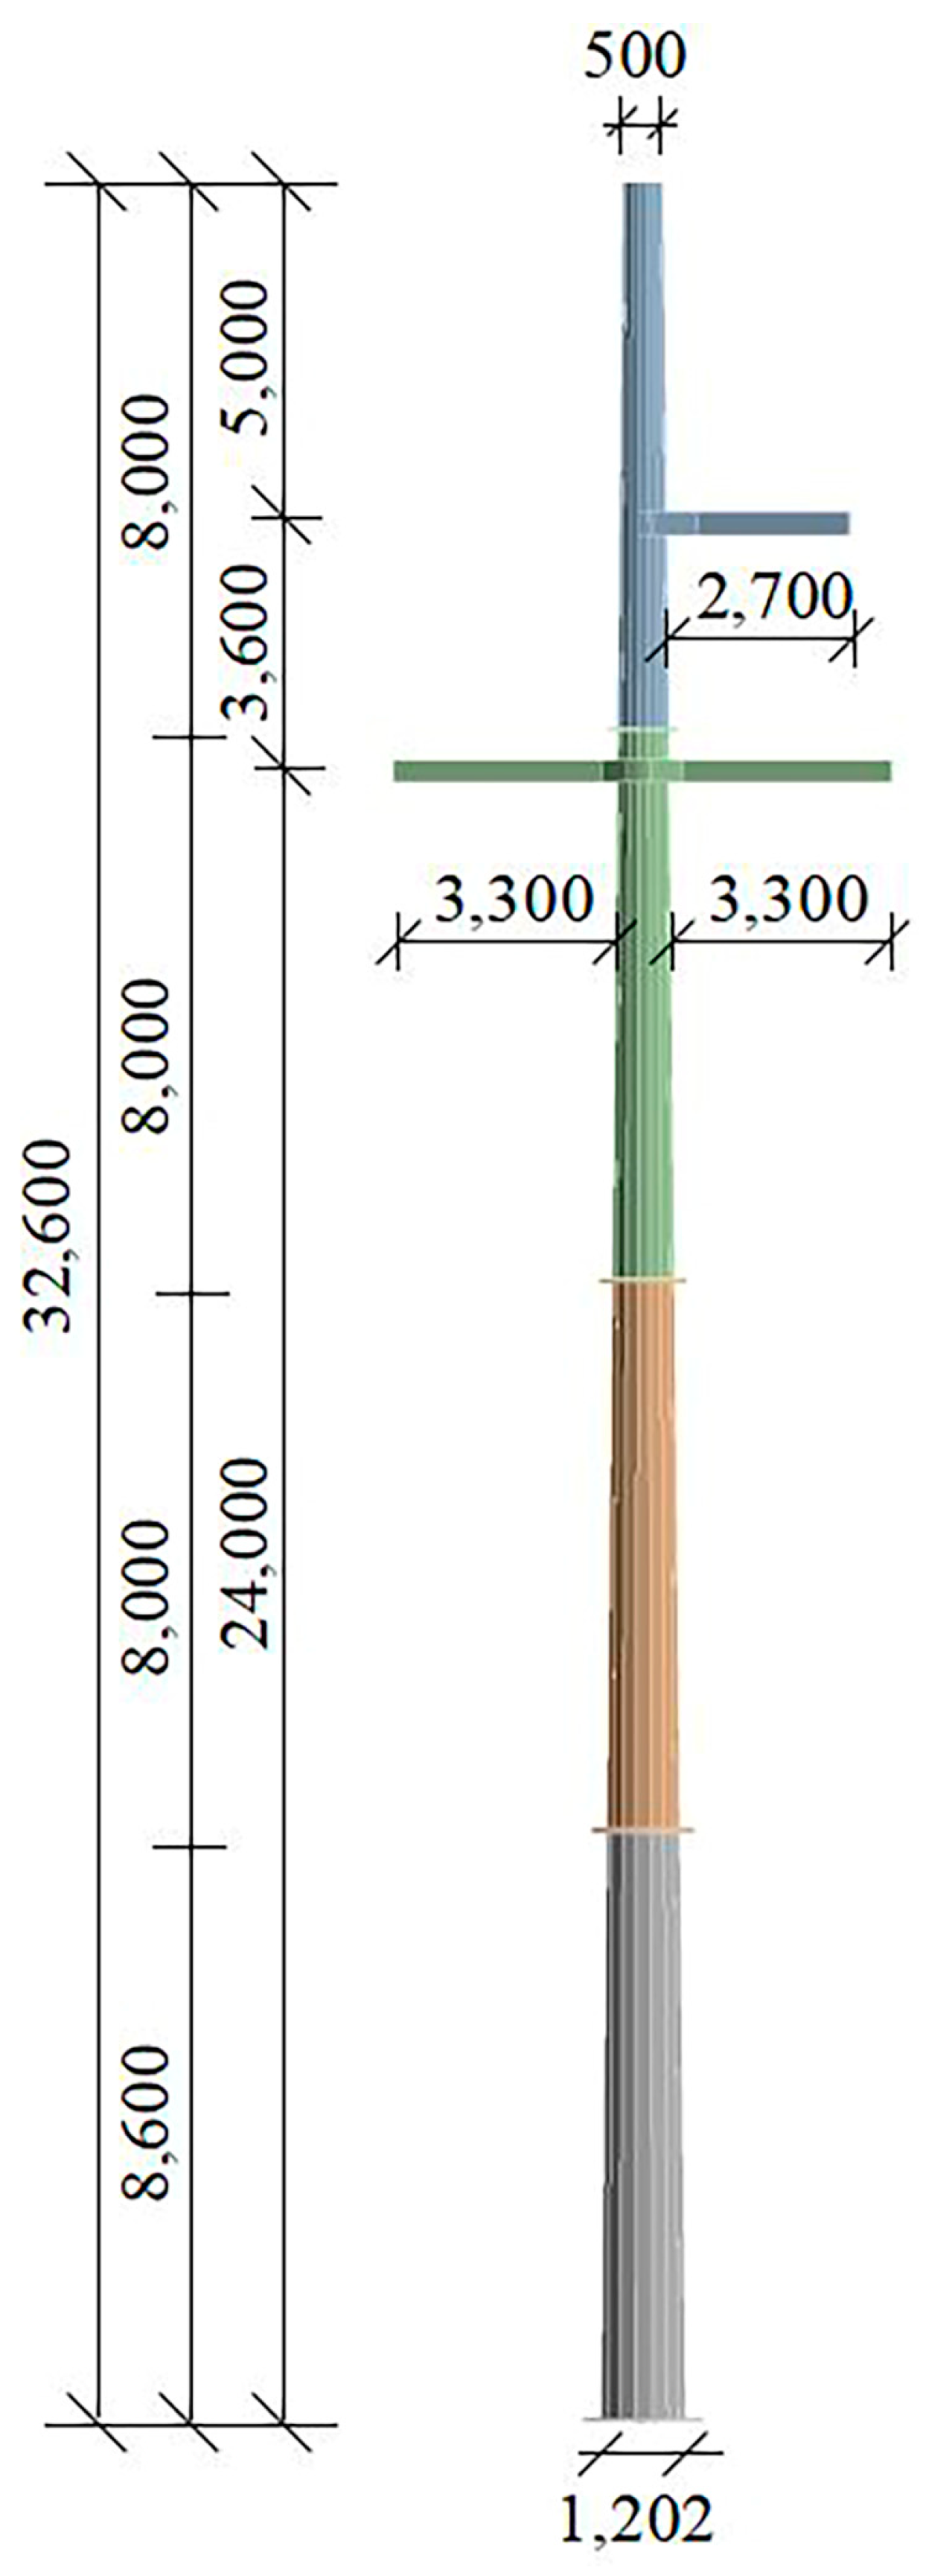
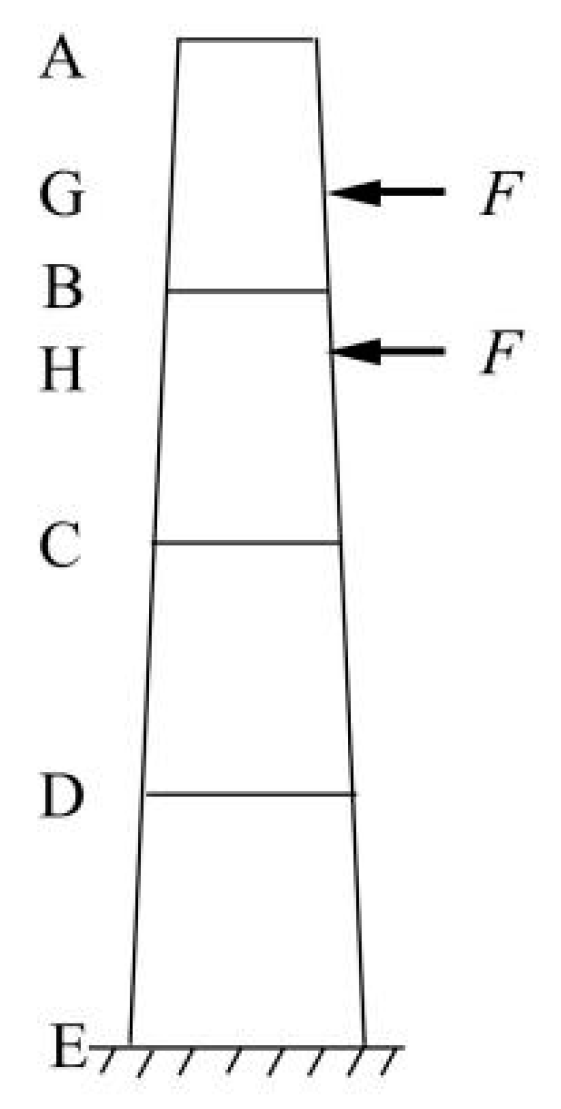
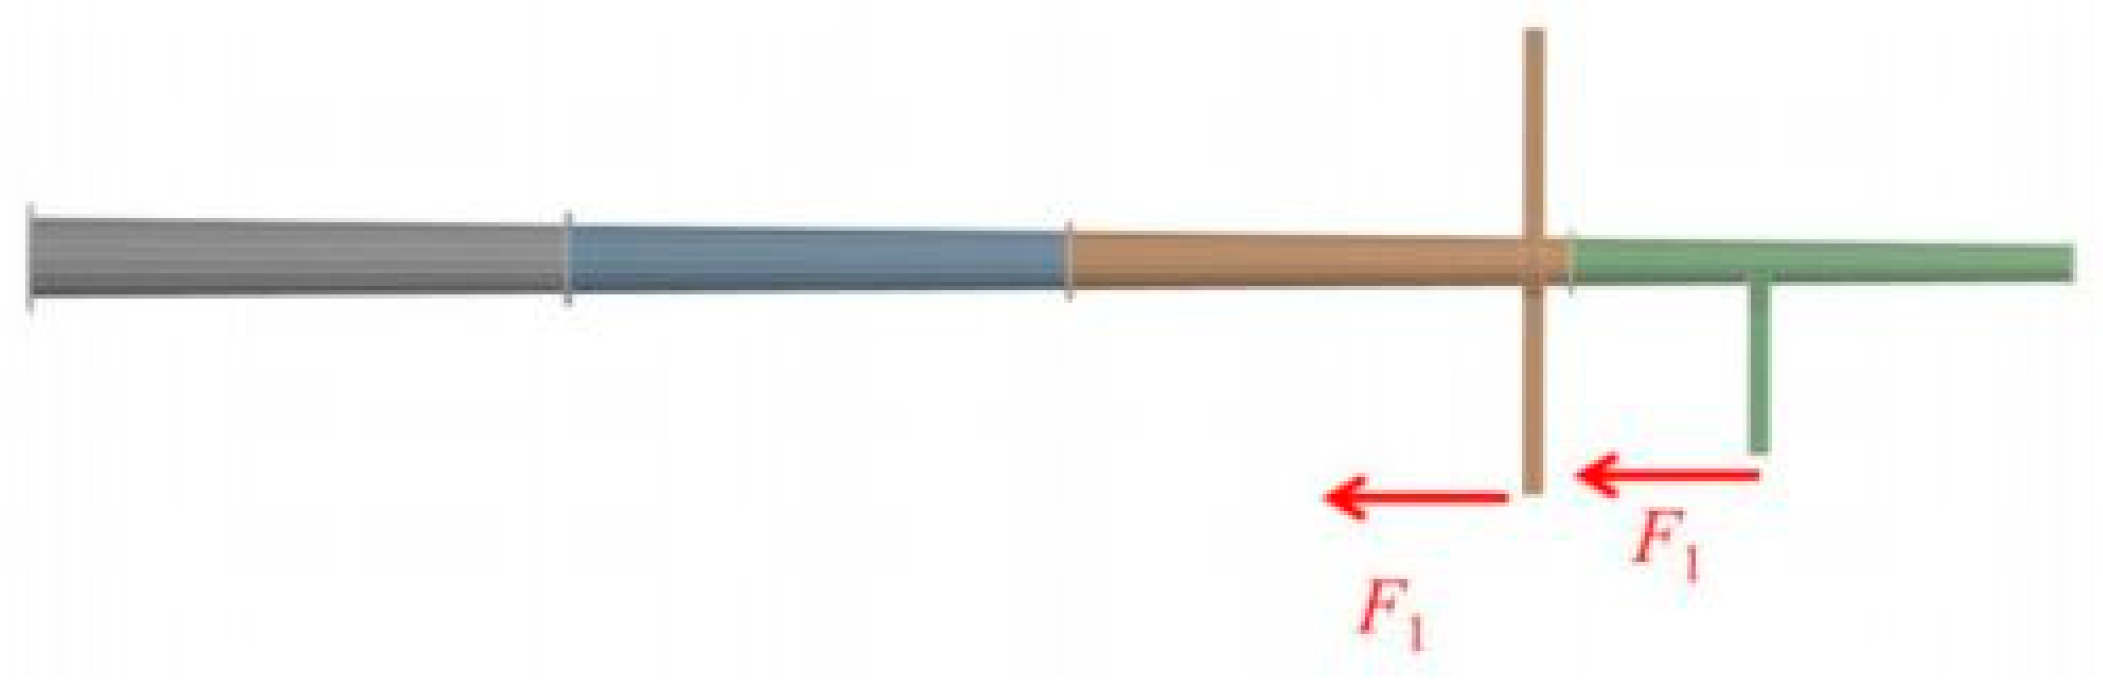
The tensile steel pipe rod is composed of four sections with hexadecagonal sections, and the wall thickness from top to bottom is 12 mm, 14 mm, 16 mm, and 18 mm, respectively. The length of the first three segments is 8 m, and the length of the fourth section is 8.6 m, as shown in Figure 1. The material is Q355 steel, and the material parameters are shown in Table 1 below.
In order to study the influence of different corrosion thickness changes on the structural response, the corrosion length is fixed at 3 cm, with corrosion thicknesses of 0 mm, 5 mm, 10 mm, 15 mm, and 20 mm across five groups. The maximum corrosion thickness is extended to 20 mm, which exceeds the wall thickness of the lowest steel pipe section. This is because there is a base at the bottom, with a diameter of 1730 mm and a thickness of 50 mm. The extended corrosion thickness is selected to better study the impact of extreme corrosion conditions on the structure. In order to study the influence of different corrosion length changes on the structural response, the corrosion thickness is fixed at 4 mm, with corrosion lengths of 0 cm, 2 cm, 4 cm, 6 cm, and 8 cm across five groups. The maximum corrosion length is set to 8 cm because research shows that water accumulation at the bottom of the steel pipe under actual conditions can reach around 8 cm. To minimize randomness in the simulation results, each group is simulated at least three times using meshes with identical element sizes, and the average value is taken as the final simulation result.

2.2. Unit Division

In order to improve the grid quality and ensure the accuracy and reliability of the simulation results, the transition for controlling the growth ratio of adjacent elements is set to slow. Set the span angle center to fine, the relevance center to medium, and the initial size seed to part. The element used is a tetrahedral element with 10 nodes. In the simulation of a non-corrosive tensile steel pipe bar, the number of nodes after meshing is 95,506 and the number of elements is 47,299.

2.3. Boundary Conditions and Broken-Line Load Application

For the tensile steel pipe pole, in order to better simulate the influence of the broken-line loads on the steel pipe rod in extreme cases, the calculated breaking force F is applied at both ends, which increases by 15,124 N per second from 15,124 N to 75,620 N after 5 s. The position and direction of F are shown in Figure 2, and a fixed constraint is imposed on the bottom of the steel pipe rod.

2.4. Equivalent Static Wind Load Calculation

In practice, wind loads are composed of mean wind loads and fluctuating wind loads. The fluctuating component has significant uncertainty. Therefore, during the engineering design phase, a static equivalent approach is often adopted, using empirical formulas to calculate the magnitude of the wind load [19,
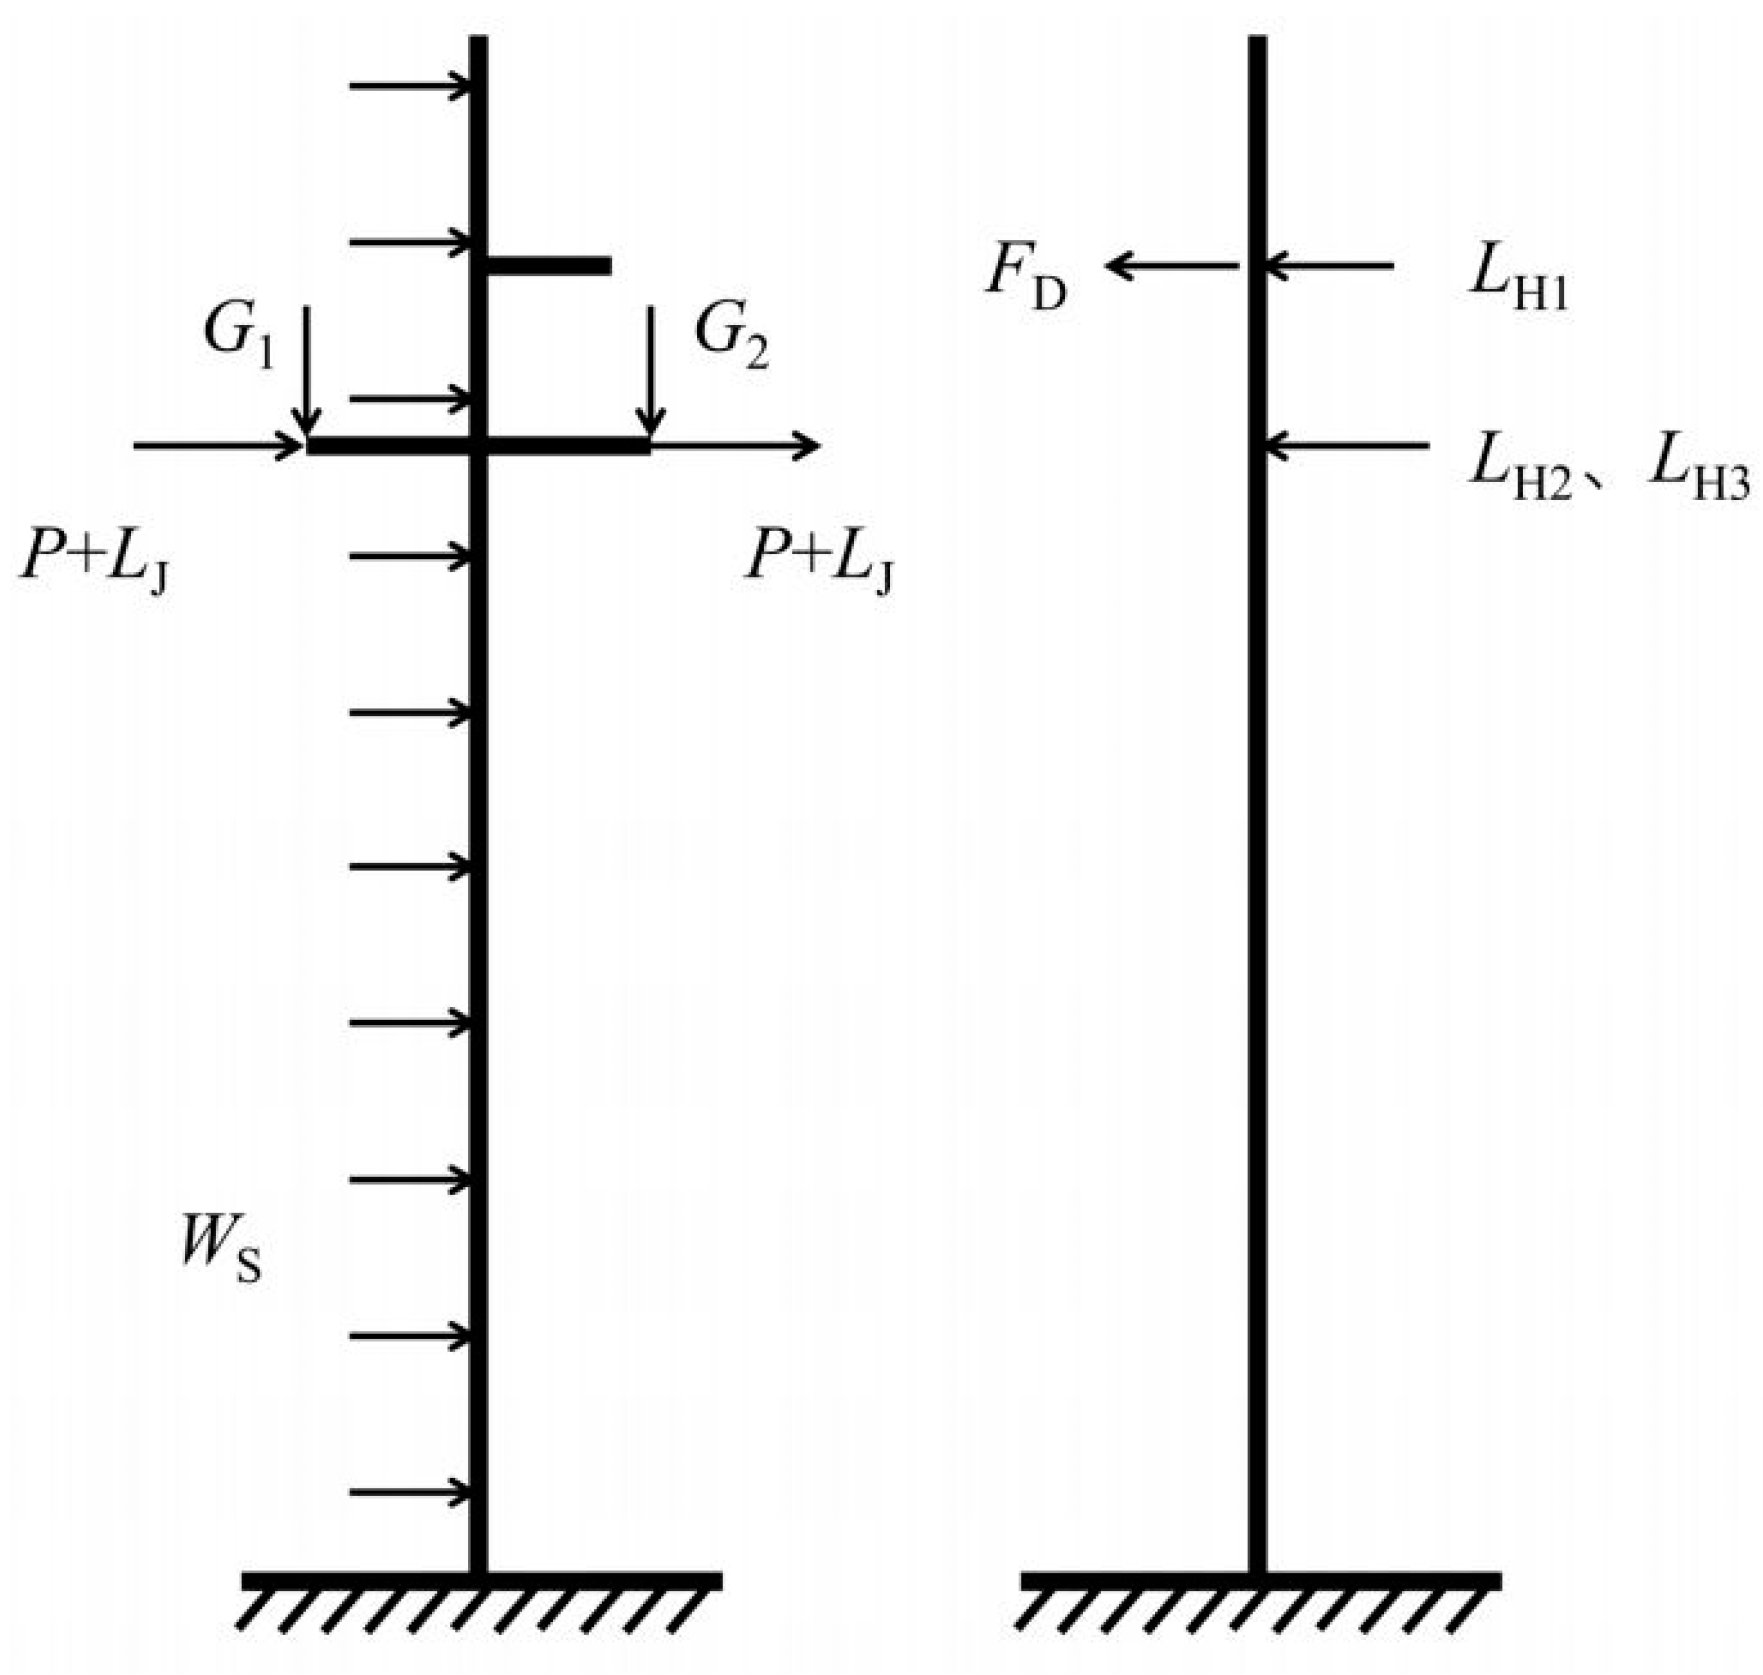
20]. By utilizing the theoretical relationship between wind speed and wind pressure, wind loads with kinetic energy are converted into static pressure and applied to the structure, completing the application of wind loads in numerical simulations. The diagram of wind loads applied to different parts of the structure is shown in Figure 3. In the figure, G1 and G2 represent the weight of the conductors on the corresponding insulators, WS denotes the wind load on the pole, LJ indicates the wind load on the insulator string, LH refers to the wind load on the crossarm, and FD represents the broken-line load caused by the breakage of the conductor on the upper crossarm.
The value of the basic wind pressure can be obtained from the Bernoulli equation of fluid mechanics.
W v = 1 2 ρ v 2
In Equation (1), v represents the wind speed, its unit is m·s−1, and ρ represents air density, its unit is kg·m−3, typically taken as the value for standard air density, which is 1.25 kg·m−3.
When the wind direction is perpendicular to the surface of the steel tubular pole of the transmission line, the wind load on the pole body is given by Equation (2).
W s = μ z μ s β z A f W v
In the equation, μ z represents the wind pressure height variation coefficient; μ s denotes the shape coefficient of the component; β z is the wind load adjustment coefficient for the tower pole; and A f refers to the projected area of the component subjected to wind pressure, its unit is m.
When the wind direction is perpendicular to the orientation of the conductors and ground wires of the transmission line’s steel tubular pole, the wind load acting on the conductors and ground wires is calculated using the formula shown in Equation (3).
P = γ 4 A L P
In the equation, γ4 represents the wind pressure per unit length without ice, its unit is N·m−1·mm−2; A denotes the cross-sectional area of the conductor, its unit is mm2; and Lp refers to the span length of the conductor, its unit is m.
The load-bearing model of the insulator string is simplified by approximating its surface as a rectangular cross-section. Therefore, the wind load acting on the insulator string is given by Equation (4).
L J = d h 1 W v
In the equation, d represents the maximum nominal diameter of the insulator string, its unit is m, and h1 denotes the total height of the insulator string, its unit is m.
The wind load on the crossarm is calculated using the formula shown in Equation (5).
L H = c h 2 W v
In the formula, c is the length of the crossarm, its unit is m, and h2 is the nominal height of the crossarm, its unit is m.

3. Simulation Analysis

3.1. The Impact of Uniform Bottom Corrosion Inside a Steel Pipe on Its Load-Bearing Capacity Under Broken-Line Loads

3.1.1. Mechanical Analysis

The finite element simulation results, as shown in Figure 4a,b, clearly demonstrate that in the absence of corrosion, the maximum equivalent stress and equivalent elastic strain under loading conditions occur at the bottom of the second steel pipe from the bottom of the structure. This is because the lowest steel pipe has a thicker wall and greater length compared to the other three pipes, resulting in higher bending stiffness and making it less susceptible to bending deformation. However, as the corrosion at the bottom deepens, the wall thickness of the corroded area on the lowest steel pipe decreases, reducing its bending stiffness and making it more prone to bending deformation. As a result, the maximum equivalent stress and equivalent elastic strain for the entire structure shift to the corroded area of the lowest steel pipe. Figure 4 shows the stress distribution at the bottom of the steel pipe when the corrosion length at the base is 6 cm. Observing Figure 4c reveals that, with a corrosion length of 6 cm, the stress distribution at the bottom of the steel pipe is uneven, leading to stress concentration, which is detrimental to the stability of the overall structure.
The stress change of the tensile steel pipe rod with the degree of corrosion under the load condition described in Section 2.3 is shown in Figure 5. It can be seen from the diagram that the maximum normal stress and maximum shear stress increase with the increase in corrosion thickness and corrosion length. Corrosion significantly affects the mechanical properties of Q355 steel through cross-sectional reduction, stress concentration, and material degradation. As corrosion thickness and length increase, the maximum normal stress and shear stress are elevated, while the structural load-bearing capacity and elastic performance are reduced. Corrosion pits cause local stress concentration, making microcracks more likely to propagate, which further accelerates the overall strength degradation. Under the corrosion conditions studied at present, the maximum normal stress is kept above 200 MPa and the maximum shear stress is kept below 200 MPa. The maximum normal stress is greater than the maximum shear stress [21,22,23,24,25,26,27,28,29]. From Figure 5a,c, it can be seen that the value of the maximum principal stress in the y direction is close to that of the normal stress in the overall structure. Therefore, in the daily operation of steel pipe rods, more attention should be paid to the value of normal stress in the y direction. If its value reaches yield strength, special attention should be paid to it and some reinforcement measures should be taken [30].
In addition to the analysis of stress variation and distribution, the maximum values of equivalent elastic strain and strain energy are also analyzed. It can be seen from Figure 6 that the maximum equivalent elastic strain will increase with the increase in corrosion thickness and corrosion length, and the rate of increase will also increase. This is caused by stress concentration due to corrosion, which makes the strain distribution in the loaded area uneven and leads to a higher likelihood of local plastic deformation. Strain energy is the energy absorbed and stored by a body in the process of deformation. The greater the strain energy, the better the elastic performance of the body, and the better it can resist the influence of external forces [31,32,33,34,35,36,37,38,39]. However, the data in Figure 6 show that the strain energy decreases with the increase in corrosion thickness and corrosion length, indicating that the material’s ability to store elastic deformation energy gradually declines, showing a transition from elastic to plastic behavior. Environmental factors such as humidity, chloride ions, and temperature further accelerate the corrosion process, enhance pitting and crack propagation, and weaken the material’s overall elastic performance and resistance to deformation. These combined effects make Q355 steel more prone to failure under external forces.

3.1.2. Verification of Analytical Results

In order to verify the accuracy of the simulation, the analytical calculation method is adopted to calculate the deflection of the steel pipe bar under the same load, and the simulation results are compared to enhance the persuasion of the results. The bottom section of the steel pipe rod is hexadecagonal, as shown in Figure 7.
According to the design code, the moment of inertia of the steel pipe bar section can be calculated according to Equation (6) [34]:
I y = ω D 3 t
In the equation: ω is the coefficient of the moment of inertia, the value of the inertia moment of the hexadecagon is 0.403; D is the middle diameter of the opposite side of the steel pipe rod, and t is the wall thickness of the steel pipe rod.
As can be seen from Equation (6) and Figure 8, the moment of inertia equation of the section of the steel pipe rod is the following:
{ k = ( D X D S ) / L L S = D S / k L Z = L S + L I ( x ) = ω D 3 t = ω ( k x ) 3 t
In the equation, DX is the middle diameter of the opposite side of the bottom side of the steel pipe rod; DS is the middle diameter of the opposite side of the top side of the steel pipe rod; L is the height of the steel pipe rod; LZ is the distance from the bottom of the steel pipe rod to point O; LS is the distance from the top of the steel pipe pole to point O; x is the distance from the top section of the steel pipe to the intersection of point O of the extension lines on both sides of the steel pipe.
The differential equation, rotation angle, and deflection equation of the steel pipe rod end An under the action of concentrated force P are as follows [40]:
{ B = P E ω t k 3 d 2 y d x 2 = B ( x L S ) x 3
θ P ( x ) = B [ L S 2 ( 1 x 2 1 L Z 2 ) + 1 L Z 1 x ]
{ A 1 = x L Z 1 + ln L Z ln x A 2 = L S 2 ( 2 L Z 1 x x L Z 2 ) y p ( x ) = B ( A 1 + A 2 )
The differential equation, rotation angle, and deflection equation of the steel pipe rod end An under the action of concentrated couple M are as follows:
{ B = M E ω t k 3 d 2 y d x 2 = B x 3
θ M ( x ) = B 2 ( 1 L Z 2 1 x 2 )
y M ( x ) = B ( x L Z ) 2 2 x L Z 2
In the calculation process, because of the different wall thicknesses of the four-section steel pipe rod, the steel pipe rod needs to be segmented from the flange joint, and the load is converted to the calculated section by static equivalence. The calculation results are shown in Table 2, and the numbers of different sections are shown in Figure 8.
The deflection of point A is calculated according to Equation (14), and yA = 735.83 mm is obtained. The finite element simulation results are shown in Figure 8, yA = 664.76 mm, and the difference ratio between the finite element simulation results and the analytical solution results is 9.7%, which can prove that the simulation results are reliable [41].
y A = y B + y C + y D + θ B × L A B + θ C × L A C + θ D × L A D

3.2. The Impact of Uniform Bottom Corrosion Inside a Steel Pipe on Its Vibration Characteristics Under Broken-Line Loads

The first six modes of the tension steel pipe rod are arranged from left to right. As shown in Figure 9, the first-order vibration mode is the horizontal swing of the top of the steel pipe rod along the X and Y directions, and the second mode is the back-and-forth swing of the top of the steel pipe rod along the Y and Z directions. The third-order vibration mode is the reverse swing of the top and the middle and upper parts of the steel pipe rod along the X and Y directions. The fourth- and fifth-order vibration modes are the reverse swing of the top and middle and upper parts of the steel pipe rod along the Y and Z directions and the torsion around the Y axis as a whole, and the sixth-order vibration mode is the reverse swing of the upper part and the middle and lower parts of the steel pipe rod along the Y and Z directions.
The calculation results of the first six vibration frequencies and periods of the steel pipe rod are shown in Table 3. According to the analysis of the data table, the period of the first and second orders of the tension steel pipe rod is about 1.01 s, which is shorter than that of the general transmission steel pipe rod, indicating that the flexibility of the tension steel pipe rod is larger. The periodic results of orders 1 and 2 are similar, which shows that the bending stiffness of the tension steel pipe rod is the same in the X and Z directions. The whole steel pipe bar structure is dominated by horizontal vibration, and the fourth-order vibration mode appears to be torsional action. The ratio of the fourth-order period dominated by torsional action to the first-order period dominated by horizontal vibration Tt/T4 = 0.1794 < 0.5 shows that the torsional effect of the structure is small.
Through modal analysis, the first-order and second-order vibration frequencies of steel pipe rods under different corrosion degrees are also obtained. As shown in Figure 10, corrosion has a significant impact on the vibration characteristics of steel pipe columns. As the corrosion thickness and length increase, the first two natural frequencies of the column decrease. This indicates that corrosion reduces the structural stiffness, increasing the risk of low-frequency resonance, which could negatively affect the stability and long-term safety of the structure. Low-frequency resonance may lead to excessive deformation, fatigue damage, or local failure, shortening the service life of the structure. Therefore, to address the vibration changes caused by corrosion, regular vibration monitoring and corrosion inspections should be implemented to assess the extent of corrosion, with the timely repair or replacement of corroded components. Additionally, the fatigue life of the structure should be considered, optimization design should be performed, and vibration damping measures should be installed when necessary to reduce resonance risk.
In addition, with the help of the data obtained from modal analysis, the structural damping coefficient is calculated. The calculation equation of the damping coefficient is as follows [42]:
α = 2 ω i ω j ζ / ( ω i + ω j )
β = 2 ζ / ( ω i + ω j )
In the equation, ωi and ωj are the intrinsic frequencies of the structure, respectively, and the first two orders with the greatest influence are taken in the calculation, that is, ω1 and ω2; ζ is the structural damping ratio, and when the structure is in the elastic stage, the damping ratio of the steel structure is generally 1~2% [43,44,45,46,47,48,49,50,51,52], and 2% is selected here. The calculated results of the structural damping coefficient are shown in Table 4.
The natural frequency and damping calculated from the mode can be used as a reference for the resonance of the structure [53,54]. If the wind load frequency is the same as these frequencies, it may cause resonance in the structure and seriously threaten the normal operation of the steel pipe pole structure of the transmission line.

3.3. The Impact of Crossarm Contact Surface Corrosion on Steel Pipe Pole Load-Bearing Capacity Under Broken-Line Loads

The mass loss rate is an effective quantitative measure of material corrosion and has become a standard indicator for evaluating corrosion severity. In the corrosion simulation of the steel pipe crossarm, the mass loss rate is used to quantify the corrosion level. The performance reduction method is applied to simulate the degradation of material properties by reducing the elastic modulus and yield stress of the corroded steel. The relationship between the mass loss rate and the elastic modulus and yield stress is shown in Equations (17) and (18). Based on these formulas, the elastic modulus and yield stress values corresponding to different mass loss rates are calculated, as shown in Table 5.
E n o r m = E E 0 = 1 0.0096 η m
f y n o r m = f f y 0 = 1 0.0099 η m
To better investigate the impact of crossarm corrosion on the stress and strain distribution of the overall structure, a vertically downward force F1 is applied at the crossarm to simulate the effect of conductor sag on the steel pipe crossarm. F1 starts at 100 N, increasing by 100 N per second until it reaches 500 N after 5 s. The application position of F1 is shown in Figure 11.
The data table of the maximum equivalent stress and equivalent elastic strain of the steel pipe pole under different crossarm corrosion degrees is shown in Table 6. The data in the table show that as the corrosion rate of the crossarm increases, the maximum equivalent stress of the structure rises. This is because, with the corrosion of the crossarm steel, the yield stress decreases, reducing the resistance to deformation and increasing the stress. Additionally, corrosion also leads to a decrease in the elastic modulus. According to Hooke’s Law, with the increase in stress, the strain also increases. Figure 12 clearly shows that under the given load conditions, the maximum equivalent stress and equivalent elastic strain occur at the connection between the crossarm and the main steel pipe. Therefore, in practical engineering applications, it is important to monitor the stress levels at this location closely.

3.4. Effect of Wind Load and Broken-Line Load Coupling on the Safety of Steel Pipe Poles with Different Internal Corrosion Degrees

Wind load calculations are performed based on the wind speeds corresponding to different wind force levels as outlined in the wind speed classification table. The selected wind levels are as follows: Level 7 (moderate gale) with a wind speed of 15 m/s, Level 8 (fresh gale) with a wind speed of 20 m/s, Level 10 (storm) with a wind speed of 25 m/s, and Level 11 (violent storm) with a wind speed of 30 m/s. The wind load calculation results of steel pipe poles of transmission lines under different wind speeds and pressures are shown in Table 7. According to the wind load magnitude in Table 7 and the wind load distribution in Figure 3, simulation analysis is conducted on steel pipe poles under different corrosion levels.
The variation in the maximum equivalent stress of the steel tubular poles of transmission lines under different corrosion levels with wind speed is shown in Figure 13. The data indicate that under different wind speeds, the trend of the maximum equivalent stress with varying corrosion levels is similar. As the corrosion thickness increases, the maximum equivalent stress exhibits an upward trend. With the increase in corrosion length, the maximum equivalent stress initially decreases and then rises. This suggests that the initial increase in corrosion length enhances the stability of the steel tubular pole base. However, when the corrosion length exceeds 4 cm, both the maximum equivalent elastic strain and the maximum equivalent stress begin to rise rapidly, indicating that 4 cm is a critical point. In practical engineering, special attention should be given if internal corrosion longer than 4 cm is detected at the base. Additionally, the greater the corrosion thickness and length, the higher the rate of change in the maximum equivalent stress with wind speed. When the corrosion thickness at the base reaches 15 mm or the corrosion length reaches 8 cm, the rate of change in the maximum equivalent stress with wind speed approaches 1. This indicates that the wind resistance of the structure decreases as wind speed increases, necessitating timely structural reinforcement measures.

4. Conclusions

In this paper, the influence of corrosion on steel pipe poles of transmission lines is studied by finite element simulation, and the bearing capacity of each member under corrosion is analyzed by mechanical behavior and modal response, which provide a theoretical reference for ensuring the safety and reliability of steel pipe rod structures. The main conclusions of this paper are as follows:
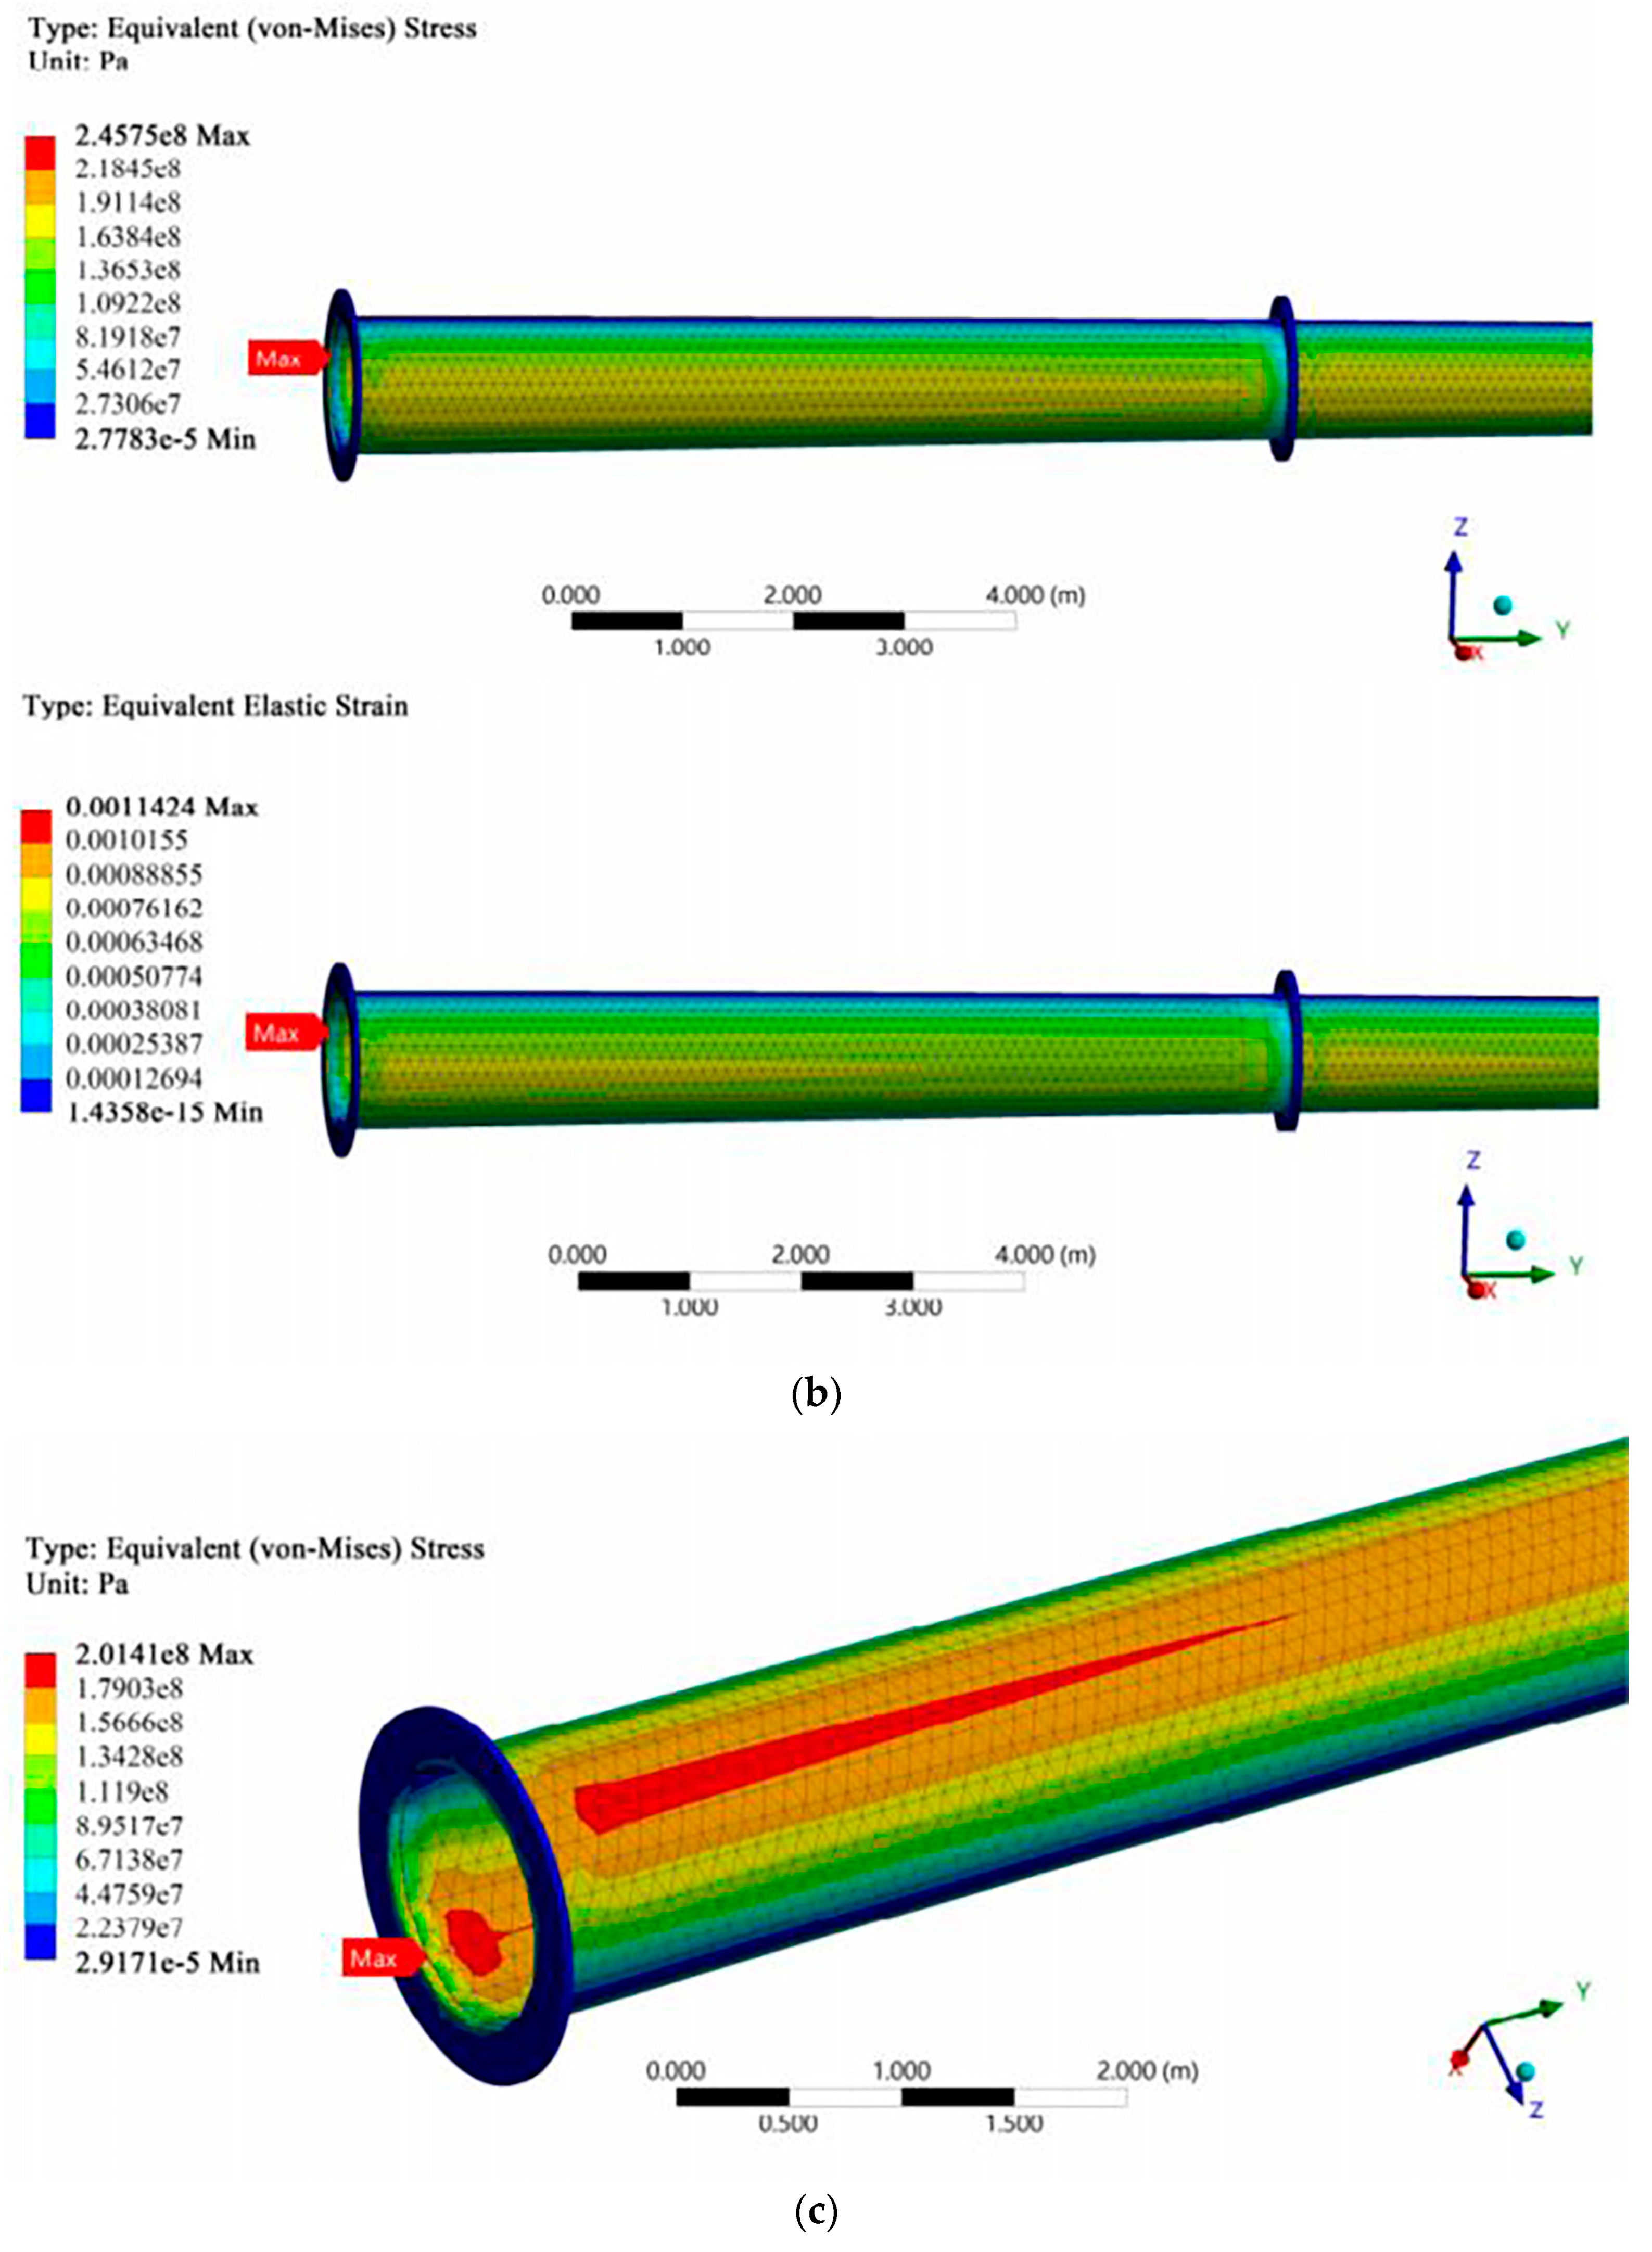
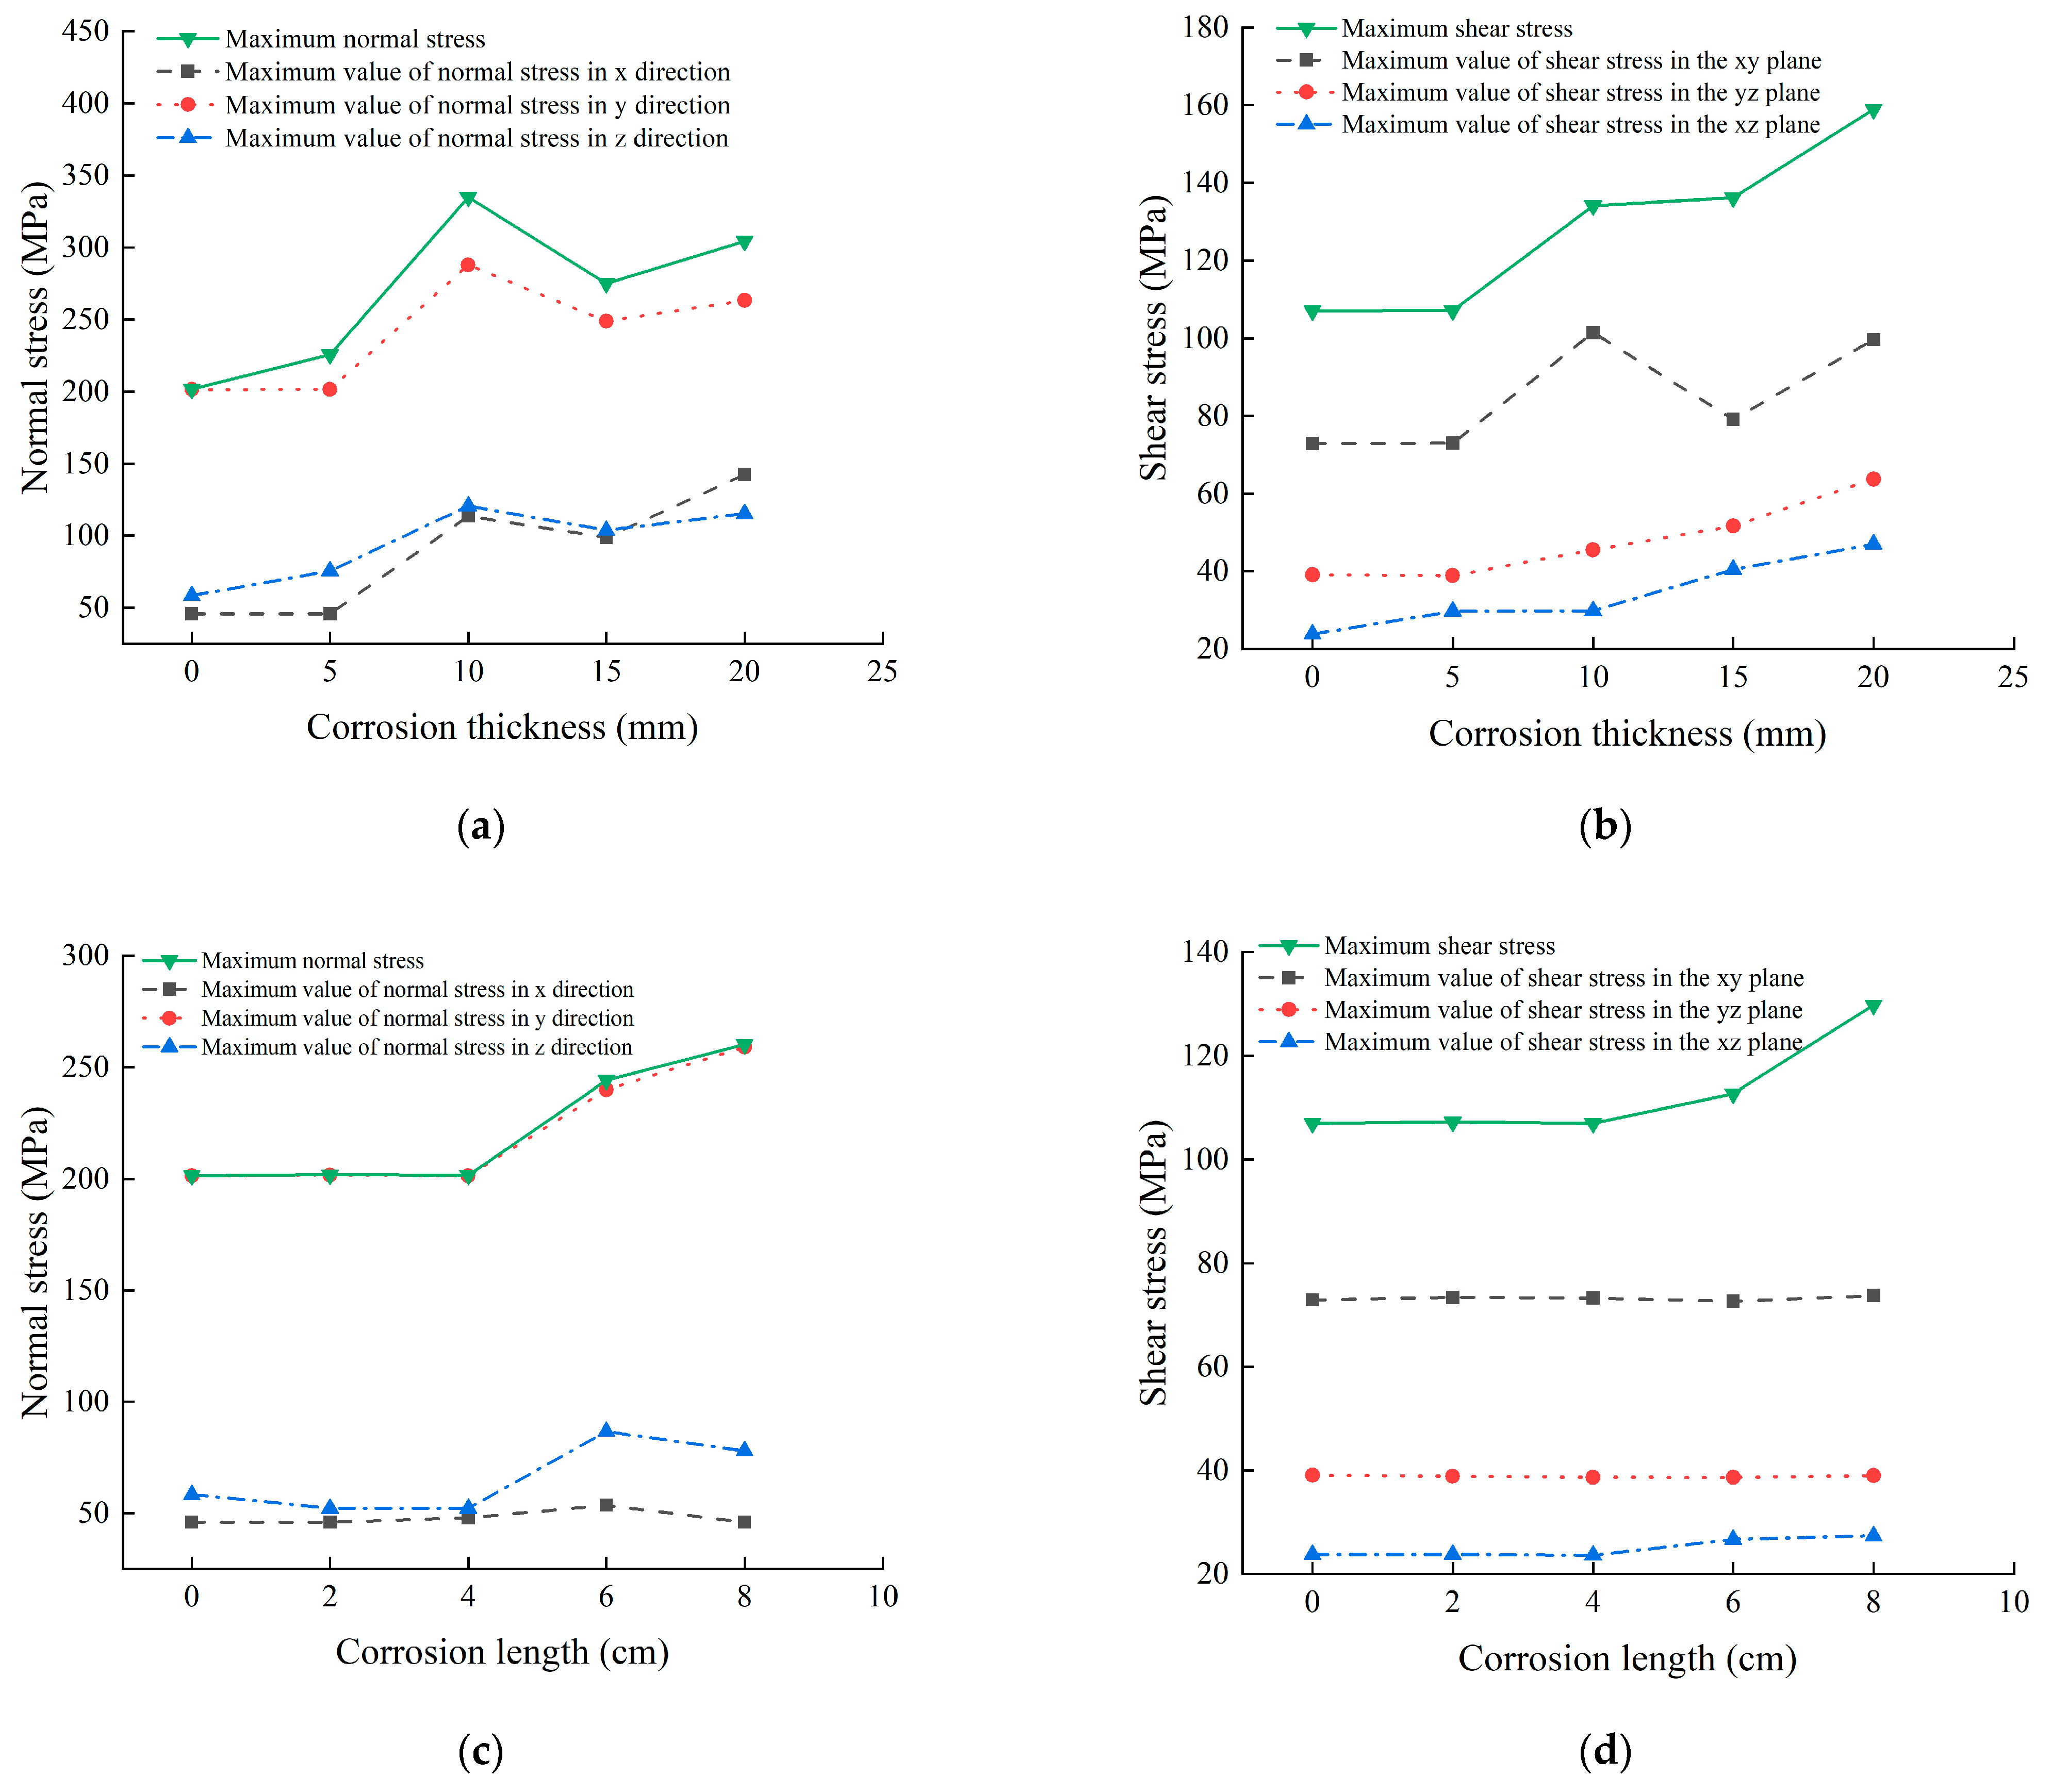
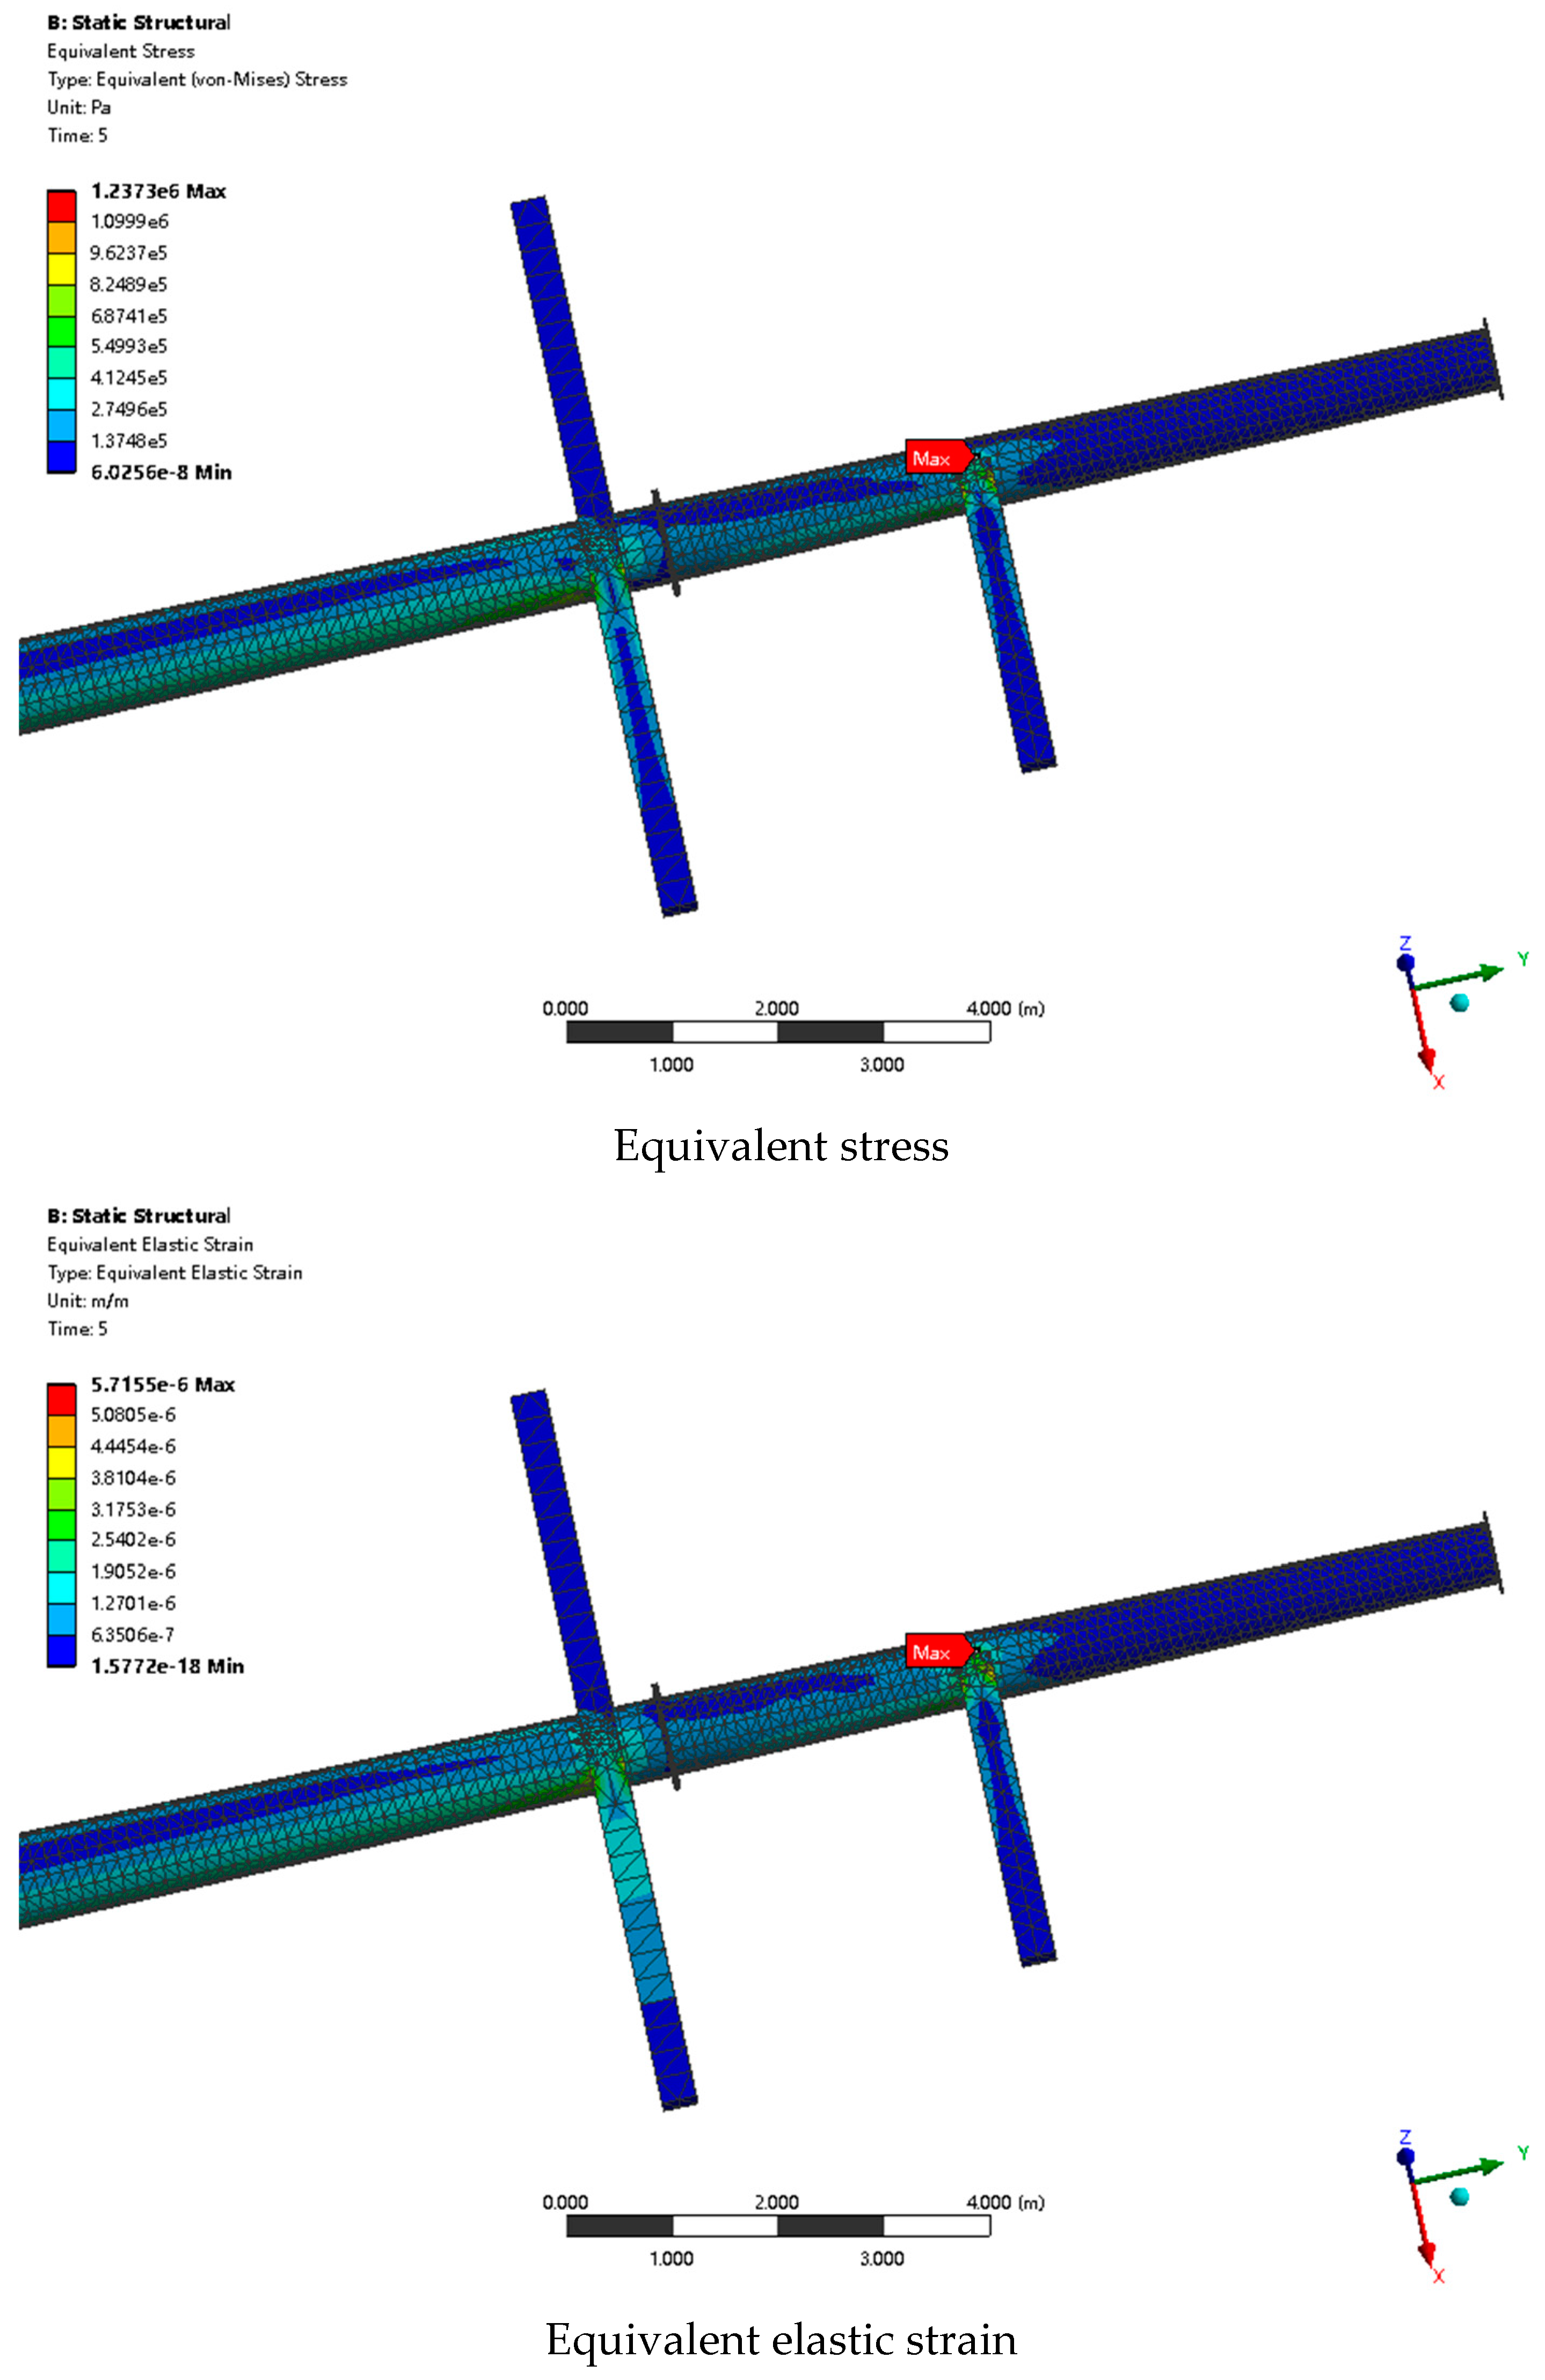
  • Bottom corrosion and cross-wall corrosion cause the concentration of stress and strain, which increases the risk of structural instability. With the increase in corrosion thickness and length, the maximum stress and strain of the steel pipe rod increase obviously at the corrosion site.
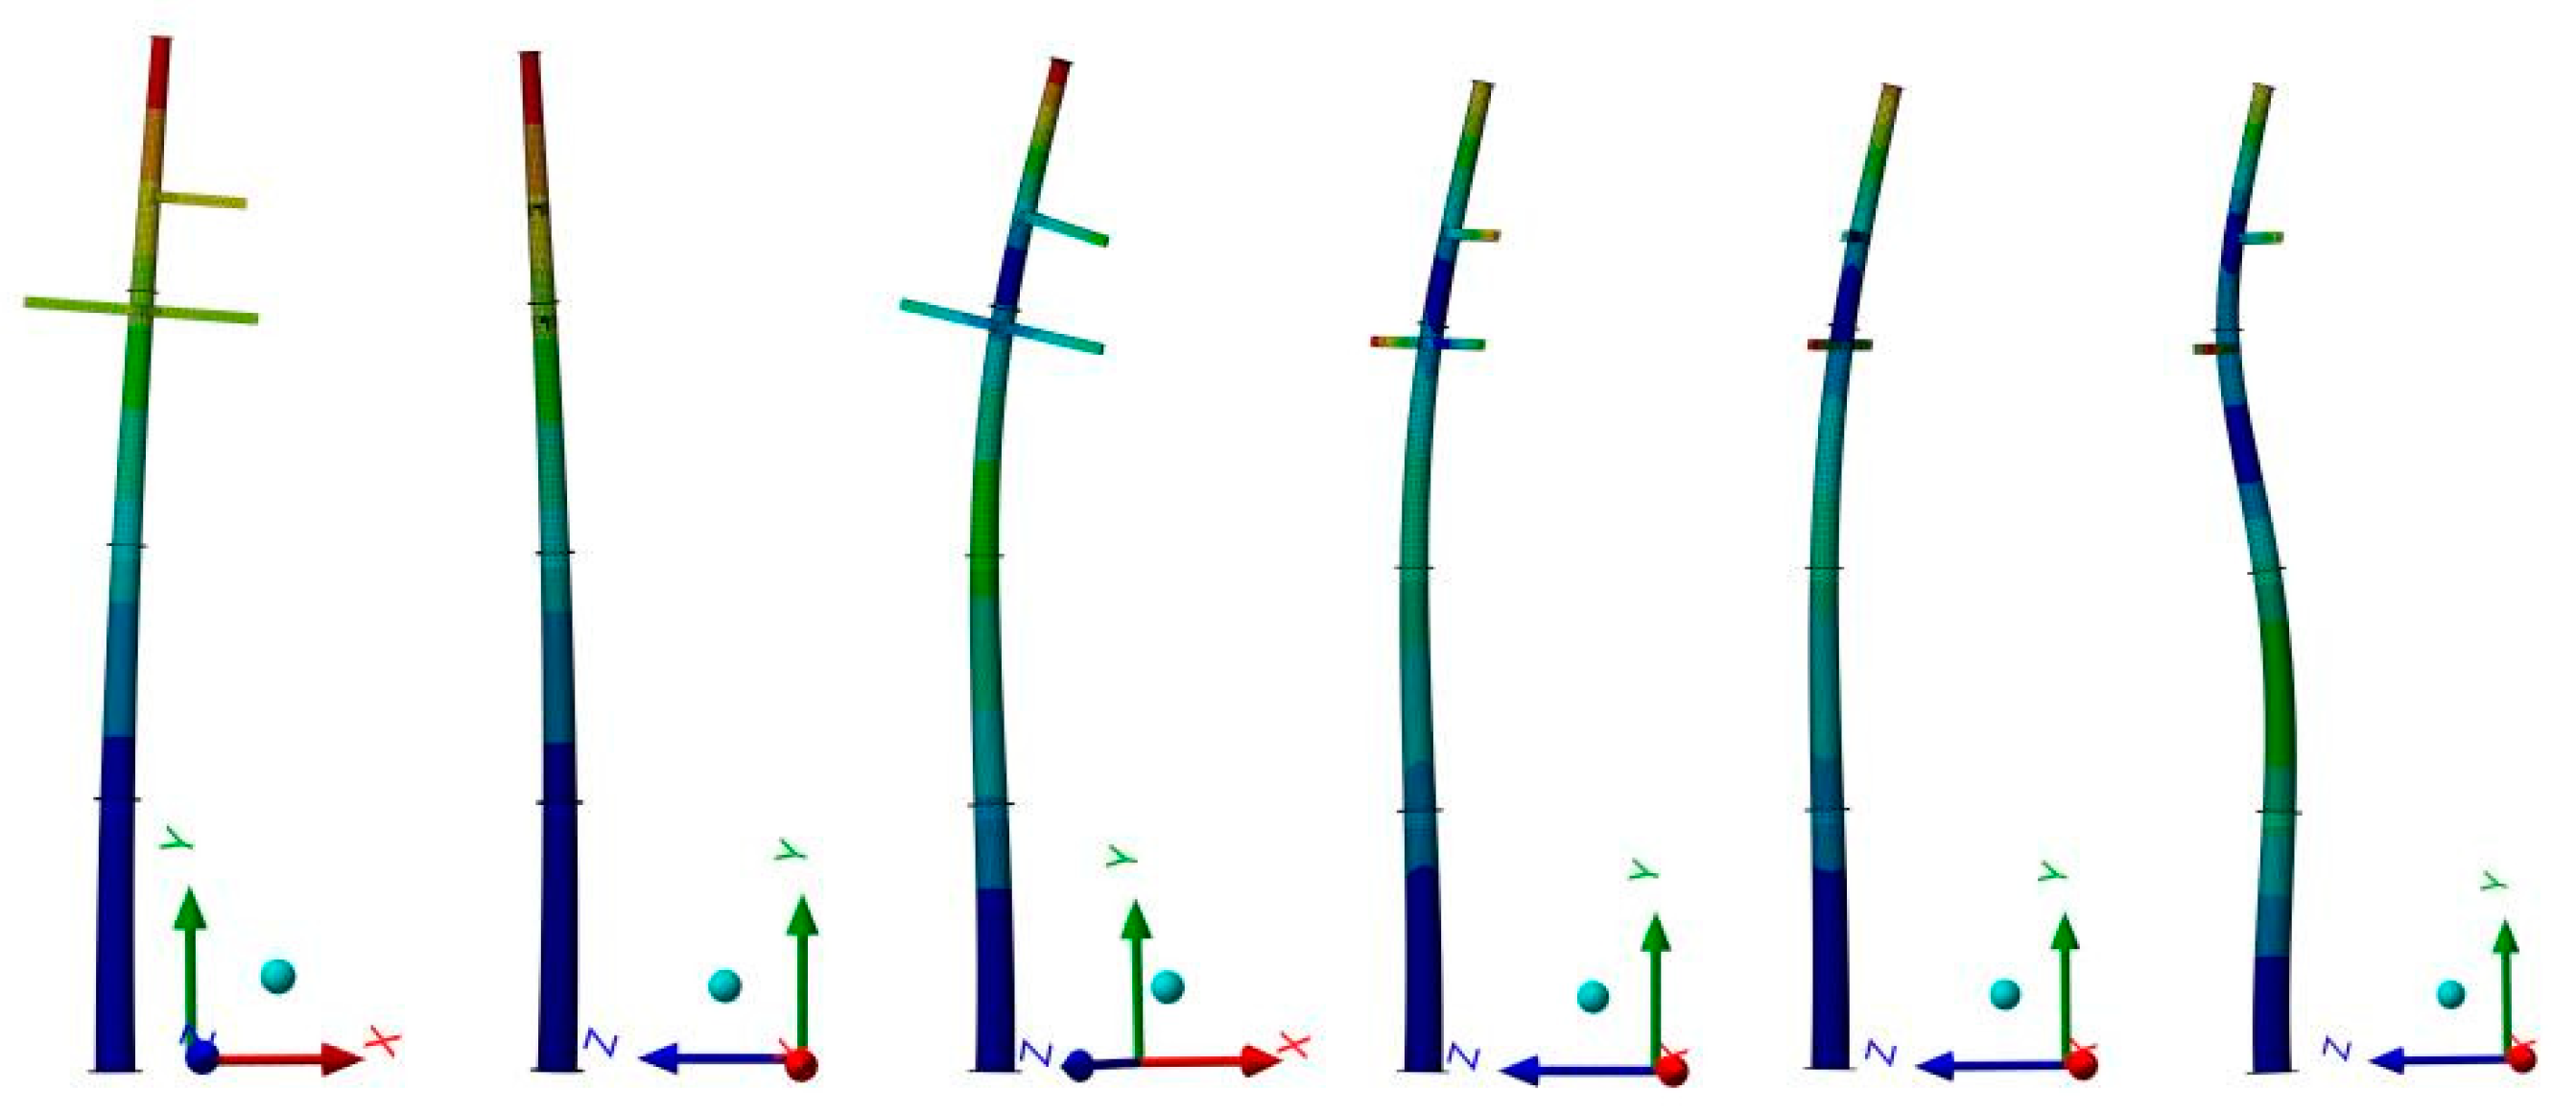
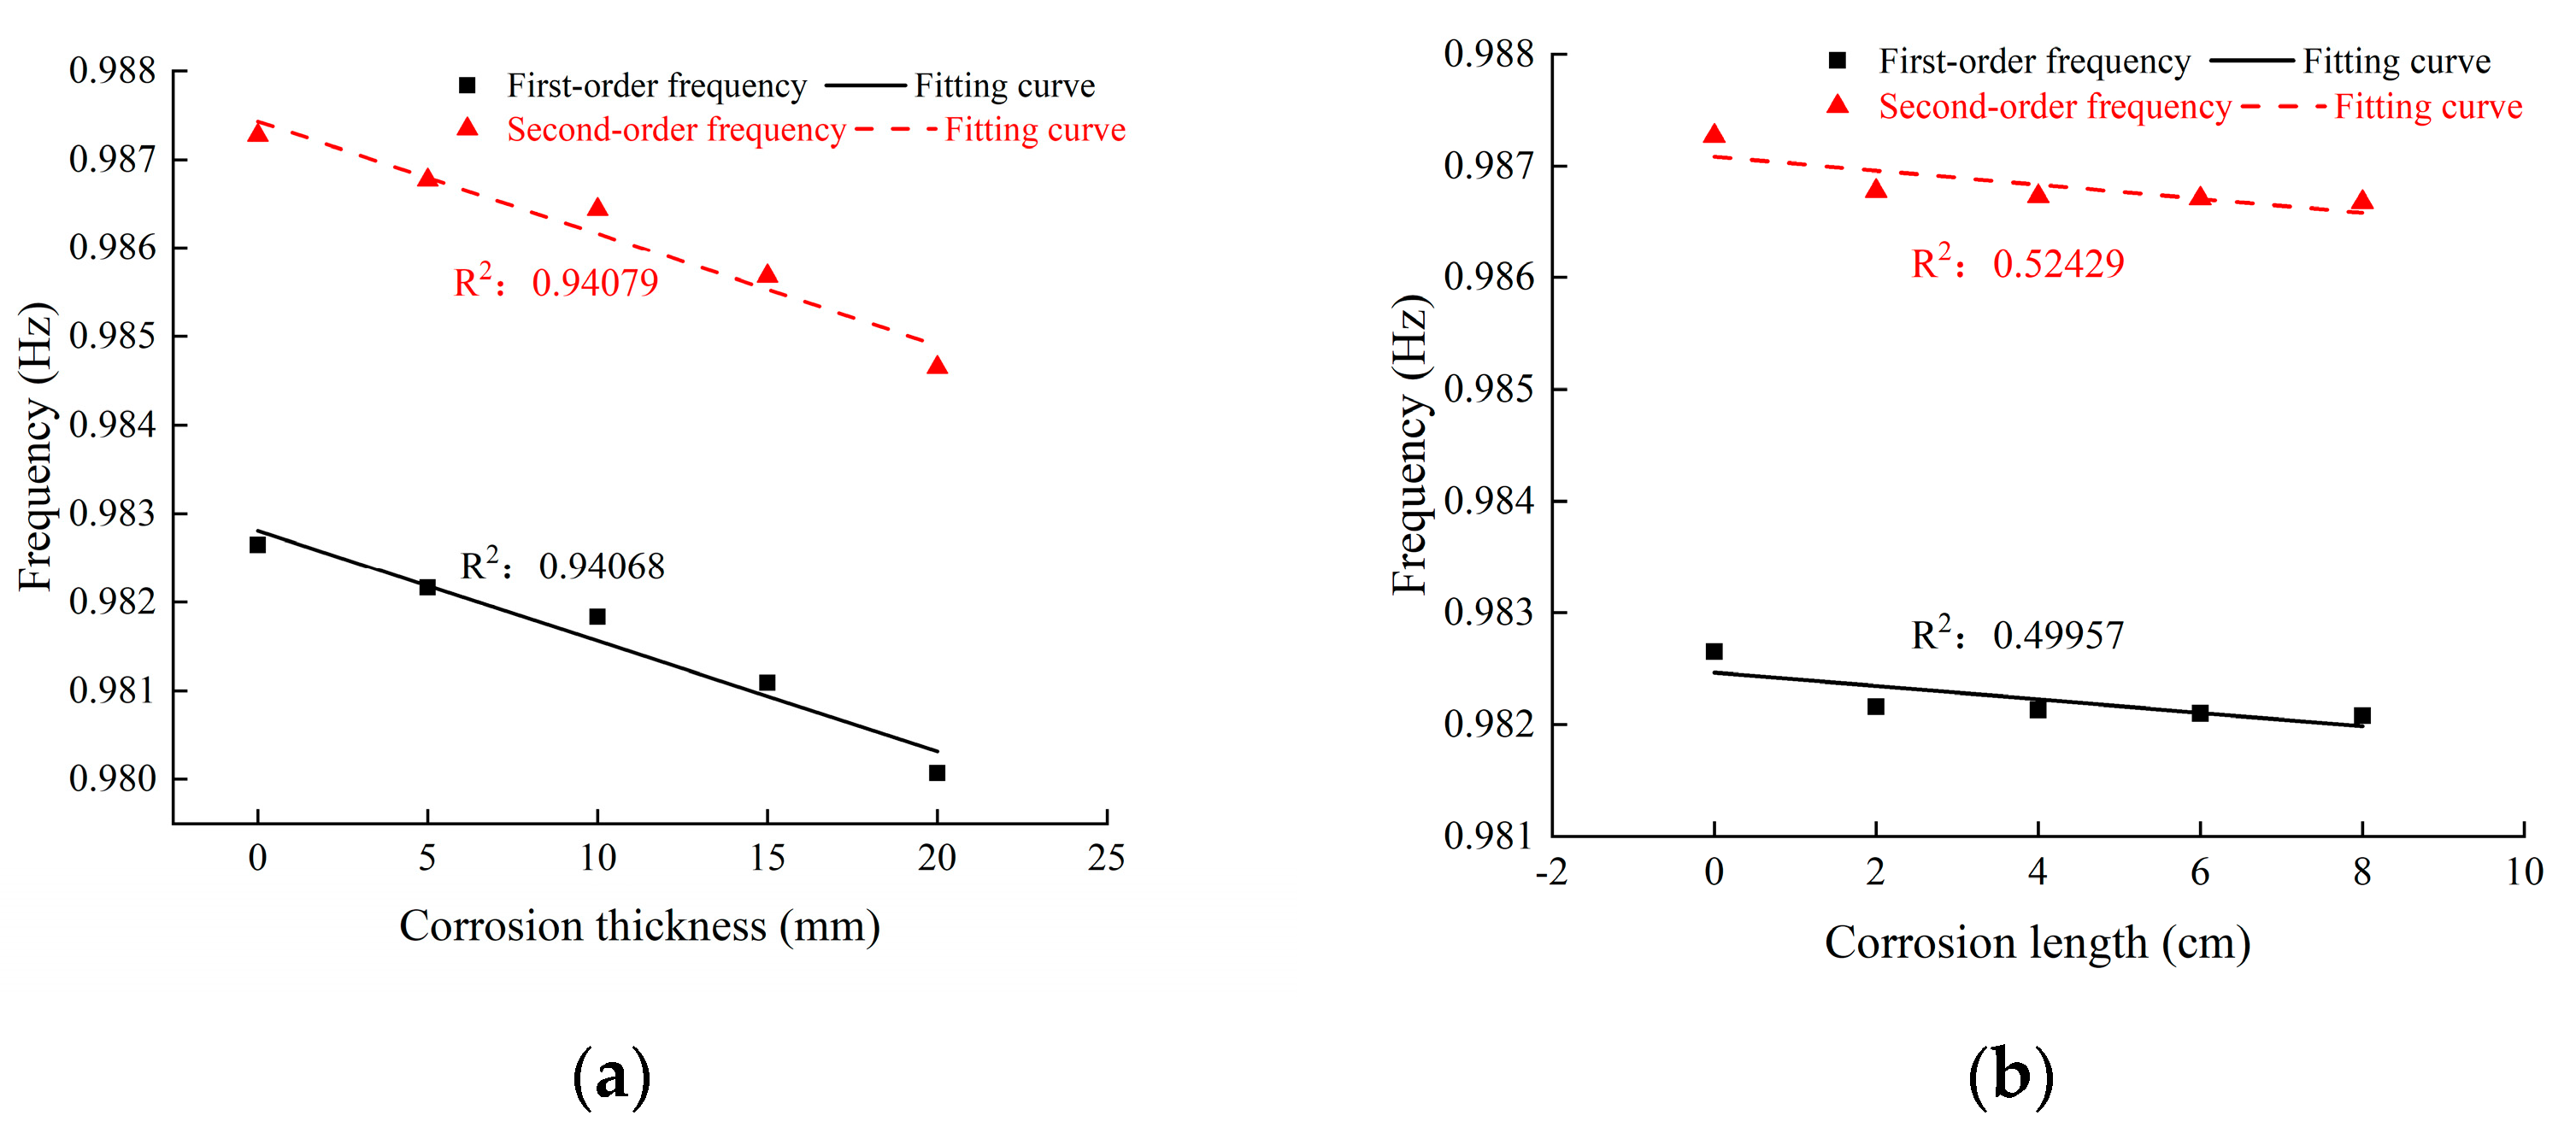
  • Bottom corrosion and cross-wall corrosion lead to a decrease in vibration frequency and increase the risk of resonance with wind load. When the degree of corrosion increases, the first- and second-order vibration frequencies decrease, which increase the probability of resonance between the structure and the external excitation.
  • When the mass loss rate of the cross-pole corrosion changes from 0% to 0.5%, the stress at the connection between the cross-pole and the steel pipe rod increases rapidly, which may affect the normal bearing characteristics of the cross-pole. Therefore, it is necessary to monitor the stress at the connection between the cross-pole and the steel pipe rod.
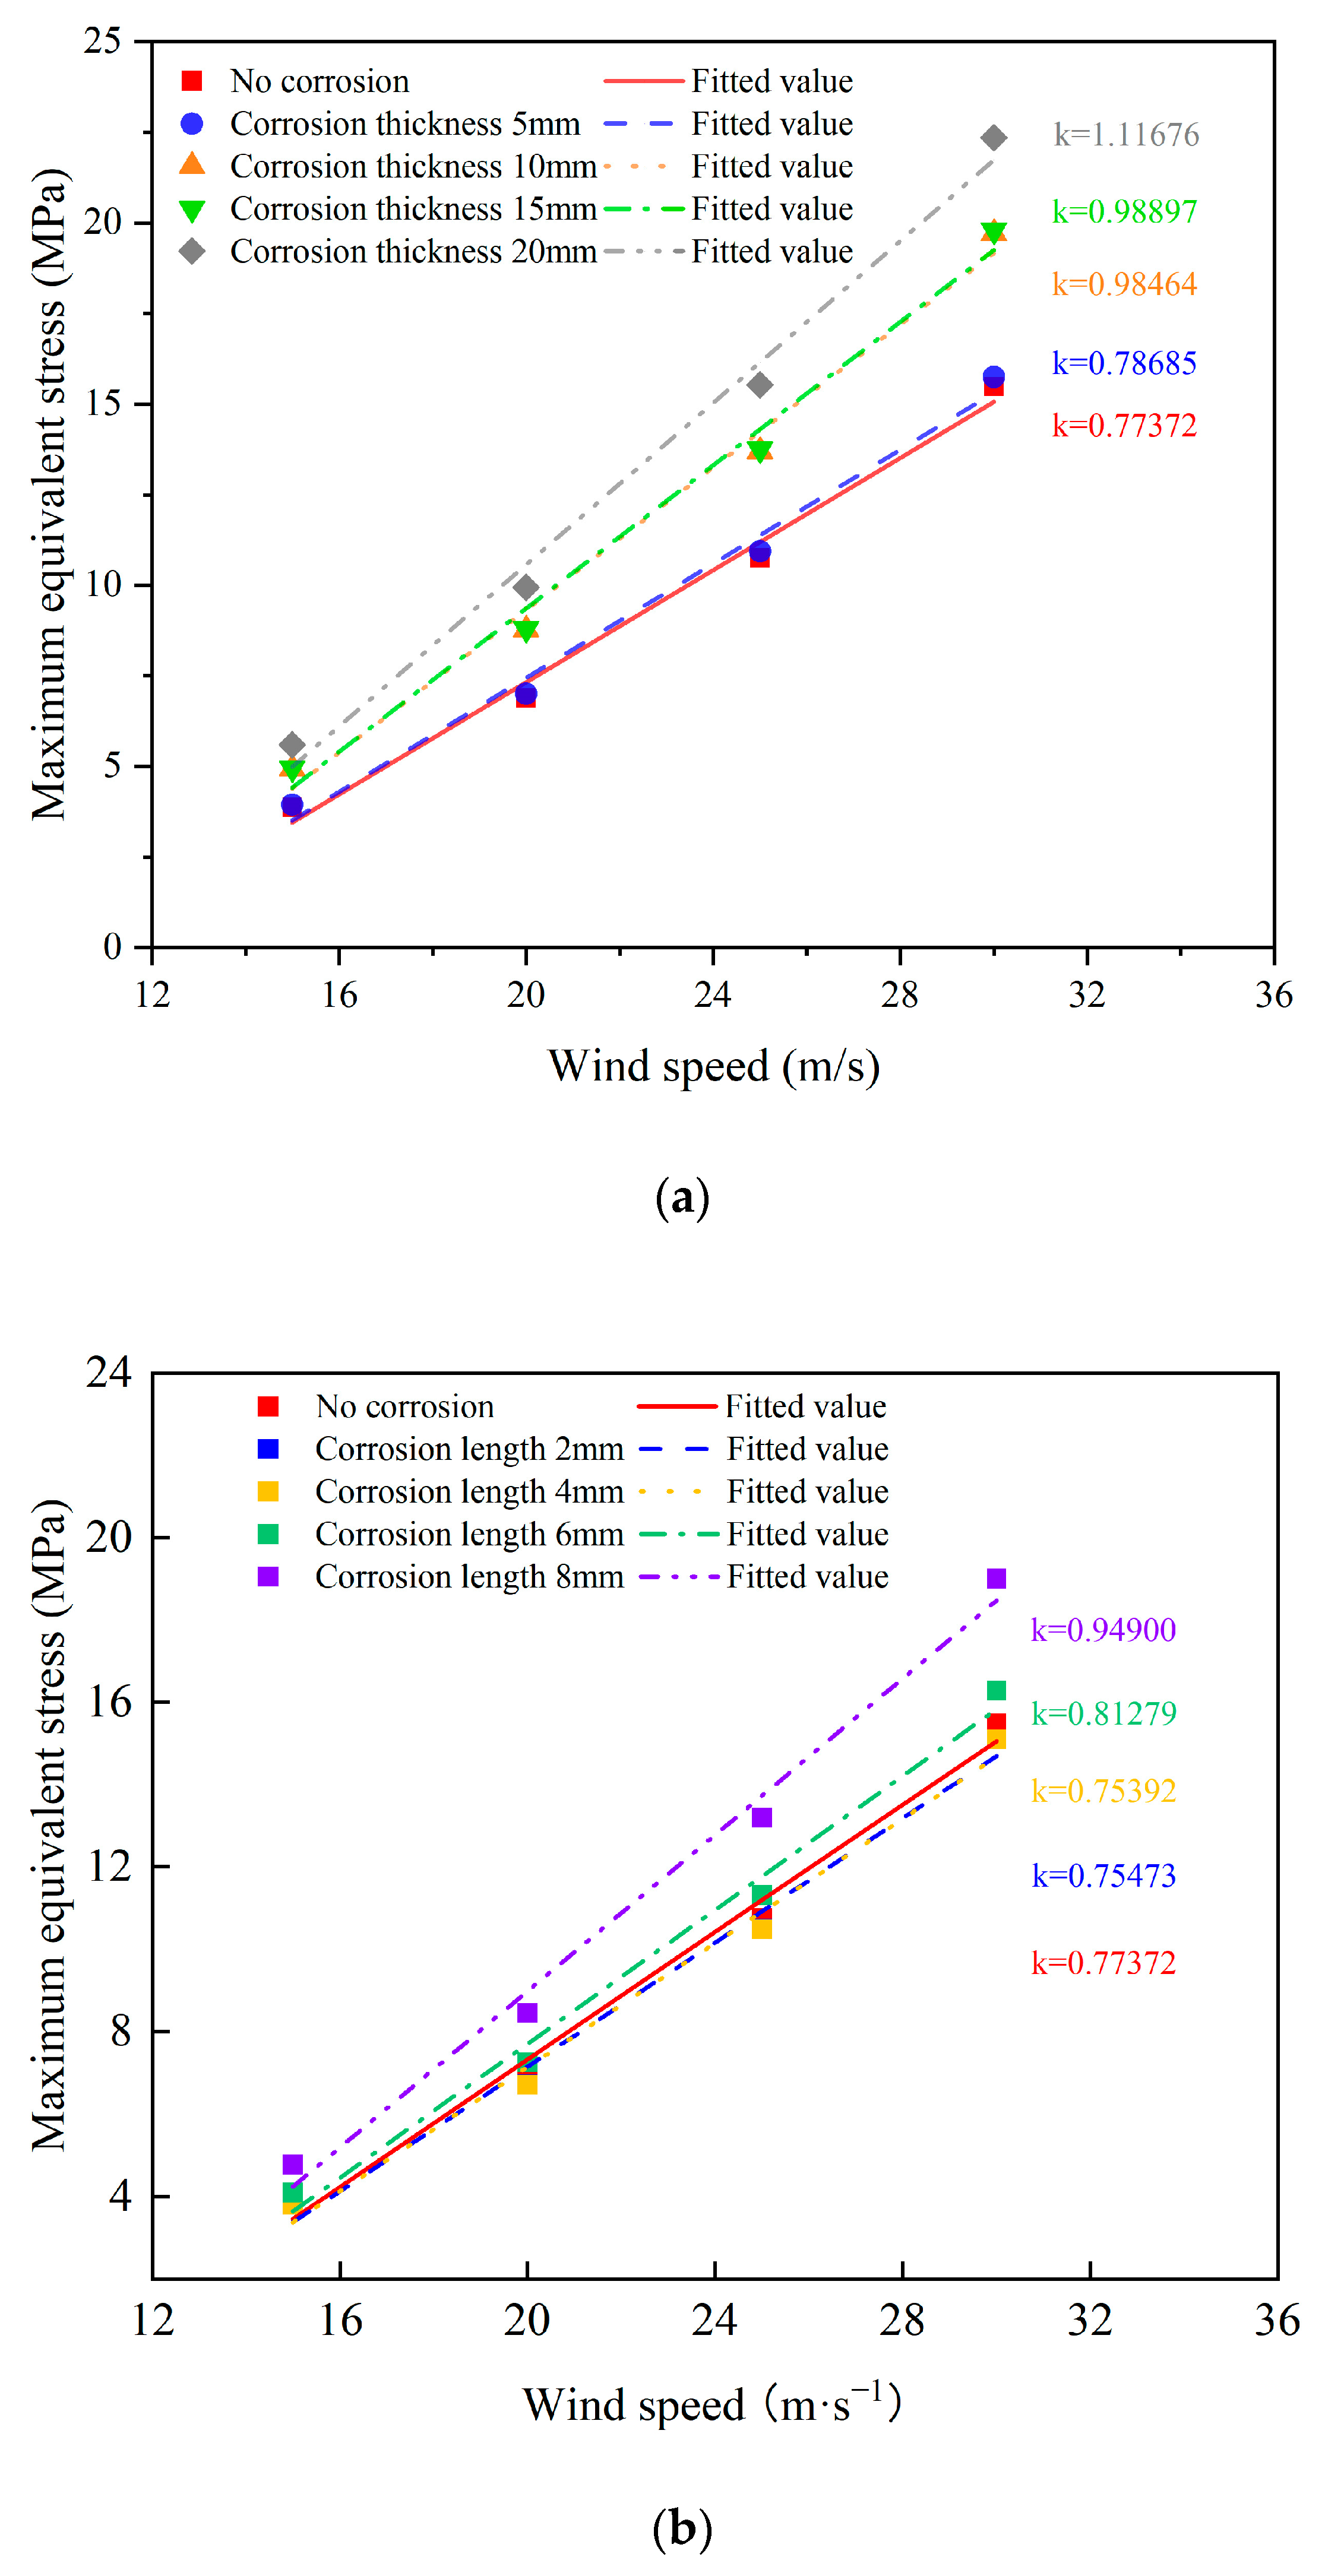
  • As the corrosion thickness and length increase, the rate of change in the maximum equivalent stress of the steel pipe pole with varying wind speeds becomes higher. When the corrosion thickness reaches 15 mm or the corrosion length reaches 8 cm, the rate of change approaches 1, indicating low wind resistance.
To improve the safety and durability of steel pipe pole structures, regular inspections and dynamic monitoring are recommended, especially for corrosion at the bottom and cross-areas. Monitoring of key connection points should be strengthened to ensure their load-bearing capacity. For poles with severe corrosion, wind load analysis should be conducted promptly, and reinforcement or replacement measures should be implemented. These corrosion control and maintenance strategies can effectively extend the service life of the structure, ensuring the stability and safety of the power transmission system.

Author Contributions

Conceptualization, W.B. and D.S.; methodology, L.L. and C.Y.; investigation, L.L. and C.Y.; writing—original draft preparation, W.B. and F.L.; writing—review and editing, W.B., Y.Z. and D.S.; project administration, D.S.; funding acquisition, D.S. All authors have read and agreed to the published version of the manuscript.

Funding

This research was funded by the State Grid Jiangsu Electric Power Co., Ltd. Technology Project, grant number J2023009, the Hunan Provincial Transportation Technology Project, grant number 202316.

Data Availability Statement

Data used are available on request from the corresponding author. The data are not publicly available due to privacy.

Conflicts of Interest

Authors Wansong Bai, Lang Li, Chun Yang, Yahui Zhang and Feng Lv were employed by the company State Grid Wuxi Power Supply Company. The remaining authors declare that the research was conducted in the absence of any commercial or financial relationships that could be construed as a potential conflict of interest.

References

  1. Cruz, V.; Chao, Q.; Birbilis, N.; Fabijanic, D.; Hodgson, P.D.; Thomas, S. Electrochemical studies on the effect of residual stress on the corrosion of 316L manufactured by selective laser melting. Corros. Sci. 2020, 164, 108314. [Google Scholar] [CrossRef]
  2. Tanaka, Y.; Yano, T.; Tamura, S. Surface guided waves in two-dimensional phononic crystals. Wave Motion 2007, 44, 501–512. [Google Scholar] [CrossRef]
  3. Hosemann, P.; Bai, S.; Bickel, J.; Qiu, J. Corrosion Testing of Additively Manufactured FeCrAl Alloy in LBE. JOM 2021, 73, 4009–4015. [Google Scholar] [CrossRef]
  4. Hastuty, S.; Prasetyo, H.A.; Kirana, N.N.; Nugroho, A.; Oktaviano, H.S.; Awwaluddin, M. The Effectivity of Oil Palm Inhibitor Processed by Aminolysis to Control Corrosion on Steel in Sodium Chloride Environment. J. Phys. Conf. Ser. 2021, 2080, 012027. [Google Scholar] [CrossRef]
  5. Pratapa, Y.R.; Narayana, K.L.; Mallik, M.K. Ex Situ Tribological and Electro-chemical analysis of Aluminium. J. Phys. Conf. Ser. 2021, 2070, 012205. [Google Scholar] [CrossRef]
  6. Kim, K.; Kang, H.; Kim, T.; Iseley, D.T.; Choi, J.; Koo, J. Influencing factors analysis for drinking water steel pipe pitting corrosion using artificial neural network. Urban Water J. 2023, 20, 550–563. [Google Scholar] [CrossRef]
  7. Livadiotis, S.; Sitaropoulos, K.; Ebrahimkhanlou, A.; Salamone, S. Acoustic emission monitoring of corrosion in steel pipes using Lamb-type helical waves. Struct. Health Monit. 2023, 22, 1225–1236. [Google Scholar] [CrossRef]
  8. Wang, H.J.; Wang, X.L.; Wu, A.; Kang, G. Corrosion Law of Q345 Steel Pipe when Transporting Tailings Paste Slurry. J. Mater. Eng. Perform. 2022, 31, 6395–6403. [Google Scholar] [CrossRef]
  9. Dmitriev, S.F.; Malikov, V.; Ishkov, A.; Voinash, S.; Kalimullin, M.; Salimzyanov, M.; Novikova, L. Ultra-Compact Eddy Current Transducer for Corrosion Defect Search in Steel Pipes. Mater. Sci. Forum 2022, 1049, 282–288. [Google Scholar] [CrossRef]
  10. Zhang, S.L.; Zhou, W.X. Assessment of the interaction of corrosion defects on steel pipelines under combined internal pressure and longitudinal compression using finite element analysis. Thin-Walled Struct. 2022, 171, 108771. [Google Scholar] [CrossRef]
  11. Cheshideh, H.; Nasirpouri, F.; Mardangahi, B.; Jabbarpour, A. Failure analysis and preventive recommendations against corrosion of steel tubes of gas risers in natural gas urban distribution lines. Eng. Fail. Anal. 2021, 122, 105240. [Google Scholar] [CrossRef]
  12. Qin, G.C.; Xu, S.H.; Yao, D.Q.; Zhang, Z.X. Study on the degradation of mechanical properties of corroded steel plates based on surface topography. J. Constr. Steel Res. 2016, 125, 205–217. [Google Scholar] [CrossRef]
  13. Xu, S.; Wang, H.; Li, A.; Wang, Y.; Su, L. Effects of corrosion on surface characterization and echanical properties of butt-welded joints. J. Constr. Steel Res. 2016, 126, 50–62. [Google Scholar] [CrossRef]
  14. Lee, H.; Rasheed, U.; Kong, M. A study on the comparison of corrosion in water supply pipes due to tap water and reclaimed water. Water 2018, 10, 496. [Google Scholar] [CrossRef]
  15. Melchers, R.E. The effect of corrosion on the structural reliability of steel offshore structures. Corros. Sci. 2005, 47, 2391–2410. [Google Scholar] [CrossRef]
  16. Cao, H.; Wang, K.; Song, S.; Zhang, X.; Gao, Q.; Liu, Y. Corrosion behavior research and corrosion prediction of structural steel in marine engineering. Anti-Corros. Methods Mater. 2022, 69, 636–650. [Google Scholar] [CrossRef]
  17. Xu, L.Y.; Cheng, Y.F. Development of a finite element model for simulation and prediction of mechanoelectrochemical effect of pipeline corrosion. Corros. Sci. 2013, 73, 150–160. [Google Scholar] [CrossRef]
  18. Attarchi, M.; Brenna, A.; Ormellese, M. FEM simulation of corrosion under macro-cell mechanism. Corros. Sci. 2021, 179, 109116. [Google Scholar] [CrossRef]
  19. Patruno, L.; Ricci, M.; de Miranda, S.; Ubertini, F. An efficient approach to the determination of equivalent static wind loads. J. Fluids Struct. 2017, 68, 1–14. [Google Scholar] [CrossRef]
  20. Salehinejad, M.M.; Flay, R.G.J. A review of approaches to generate equivalent static and synthetic wind loads on tall buildings for the preliminary stage of design. J. Wind Eng. Ind. Aerodyn. 2021, 219, 104823. [Google Scholar] [CrossRef]
  21. Abreu, R.S.D.A.; Oliveira, R.T.D.; Guimarães, R.F.; Parente, M.M.V.; Freitas, F.N.C. Corrosion in carbon steel pipes belonging to the STU-85 system of the Operational Base Geologist Pedro de Moura (BOGPM)-PETROBRAS/URUCU-AM: Case study. Matéria 2019, 24, e-12292. [Google Scholar]
  22. Jacques, R.C.; de Oliveira, H.H.; dos Santos, R.W.; Clarke, T.G. Design and In Situ Validation of a Guided Wave System for Corrosion Monitoring in Coated Buried Steel Pipes. J. Nondestruct. Eval. 2019, 38, 65. [Google Scholar] [CrossRef]
  23. Wang, T.; Tong, C.; Yao, S. An improved prediction algorithm of seamless tubing corrosion based on an extension neural network. Concurr. Comput. Pract. Exp. 2019, 31, e4801. [Google Scholar] [CrossRef]
  24. Chukhin, V.; Andrianov, A.; Spitsov, D. The mechanism and identification of corrosion of steel pipes in hot water supply systems. IOP Conf. Ser. Mater. Sci. Eng. 2018, 365, 022025. [Google Scholar] [CrossRef]
  25. Barros, S.; Budhe, S.; Banea, M.D.; Rohen, N.R.; Sampaio, E.M.; Perrut, V.A.; Lana, L.D. An assessment of composite repair system in offshore platform for corroded circumferential welds in super duplex steel pipe. Fract. Struct. Integr. 2018, 12, 151–160. [Google Scholar] [CrossRef]
  26. Chi, X.; Xu, A.; Liu, Y.; Lun, P. Engineering vulnerability evaluation of building structures in coastal areas considering the effects of corrosion. Front. Mater. 2022, 9, 1107378. [Google Scholar] [CrossRef]
  27. Dutra, J.; Gomes, R.; García, G.J.Y.; Romero-Cale, D.X.; Cardoso, M.S.; Waldow, V.; Góes-Neto, A. Corrosion-influencing microorganisms in petroliferous regions on a global scale: Systematic review, analysis, and scientific synthesis of 16S amplicon metagenomic studies. PeerJ 2023, 11, e14642. [Google Scholar] [CrossRef] [PubMed]
  28. Oliveira, R.L.; Bragança, M.O.; Medeiros-Junior, R.A. Effect of coarse aggregate size on corrosion of reinforced concrete exposed to carbonation and chloride ingress by electrochemical measurements. Constr. Build. Mater. 2022, 361, 129665. [Google Scholar] [CrossRef]
  29. Qi, H.; Wang, Y.; Feng, J.; Peng, R.; Shi, Q.; Xie, X. Microbiologically Influenced Corrosion of Q235 Carbon Steel by Ectothiorhodospira sp. Int. J. Environ. Res. Public Health 2022, 19, 15416. [Google Scholar] [CrossRef]
  30. Messinese, E.; Casanova, L.; Paterlini, L.; Capelli, F.; Bolzoni, F.; Ormellese, M.; Brenna, A. A Comprehensive Investigation on the Effects of Surface Finishing on the Resistance of Stainless Steel to Localized Corrosion. Metals 2022, 12, 1751. [Google Scholar] [CrossRef]
  31. Xue, X.; Hua, J.; Wang, F.; Wang, N.; Li, S. Mechanical Property Model of Q620 High-Strength Steel with Corrosion Effects. Buildings 2022, 12, 1651. [Google Scholar] [CrossRef]
  32. Han, X.; Frangopol, D.M. Fatigue reliability analysis considering corrosion effects and integrating SHM information. Eng. Struct. 2022, 272, 114967. [Google Scholar] [CrossRef]
  33. Zhao, X.; Jiang, D.; Ma, L.; Zeng, X.; Li, Z.; Huang, G. Special Issue: Corrosion Effects and Smart Coatings of Corrosion Protection. Coatings 2022, 12, 1378. [Google Scholar] [CrossRef]
  34. Prochaska, S.; Hildreth, O. Microstructural and corrosion effects of HIP and chemically accelerated surface finishing on laser powder bed fusion Alloy 625. Int. J. Adv. Manuf. Technol. 2022, 121, 3759–3769. [Google Scholar] [CrossRef]
  35. Avadh, K.; Jiradilok, P.; Bolander, J.E.; Nagai, K. 3D mesoscale simulation of the influence of corrosion on loss of tension stiffening in reinforced concrete. Constr. Build. Mater. 2022, 339, 127684. [Google Scholar] [CrossRef]
  36. Li, Q.; Jia, H.; Qiu, Q.; Lu, Y.; Zhang, J.; Mao, J.; Huang, M. Typhoon-Induced Fragility Analysis of Transmission Tower in Ningbo Area Considering the Effect of Long-Term Corrosion. Appl. Sci. 2022, 12, 4774. [Google Scholar] [CrossRef]
  37. Lejouad, C.; Richard, B.; Mongabure, P.; Capdevielle, S.; Ragueneau, F. Assessment of the seismic behavior of reinforced concrete elements affected by corrosion: An objective comparison between quasi-static and dynamic tests. Structures 2022, 39, 653–666. [Google Scholar] [CrossRef]
  38. Deyab, M.A.; Mohsen, Q.; Guo, L. Theoretical, chemical, and electrochemical studies of Equisetum arvense extract as an impactful inhibitor of steel corrosion in 2 M HCl electrolyte. Sci. Rep. 2022, 12, 2255. [Google Scholar] [CrossRef]
  39. Bentria, E.T.; Akande, S.O.; Ramesh, A.; Laycock, N.; Hamer, W.; Normand, M.; El-Mellouhi, F. Insights on the effect of water content in carburizing gas mixtures on the metal dusting corrosion of iron. Appl. Surf. Sci. 2022, 579, 152138. [Google Scholar] [CrossRef]
  40. Aryai, V.; Baji, H.; Mahmoodian, M. Failure assessment of corrosion affected pipeline networks with limited failure data availability. Process Saf. Environ. Prot. 2022, 157, 306–319. [Google Scholar] [CrossRef]
  41. King, F.; Behazin, M. A Review of the Effect of Irradiation on the Corrosion of Copper-Coated Used Fuel Containers. Corros. Mater. Degrad. 2021, 2, 678–707. [Google Scholar] [CrossRef]
  42. Tripathi, A.K.; Thakur, P.; Saxena, P.; Rauniyar, S.; Gopalakrishnan, V.; Singh, R.N.; Sani, R.K. Gene Sets and Mechanisms of Sulfate-Reducing Bacteria Biofilm Formation and Quorum Sensing with Impact on Corrosion. Front. Microbiol. 2021, 12, 754140. [Google Scholar] [CrossRef] [PubMed]
  43. Liu, N.; King, F.; Noël, J.J.; Shoesmith, D.W. An electrochemical and radiolytic study of the effects of H2 on the corrosion of UO2-based materials. Corros. Sci. 2021, 192, 109776. [Google Scholar] [CrossRef]
  44. Cai, Y.; Xu, Y.; Zhao, Y.; Zhang, W.; Yao, J.; Wei, M.; Ma, X. Quantitative Understanding of the Environmental Effect on B10 Copper Alloy Corrosion in Seawater. Metals 2021, 11, 1080. [Google Scholar] [CrossRef]
  45. Aroo, H.; Azadi, M.; Azadi, M. Corrosion Effects on High-cycle Fatigue Lifetime and Fracture Behavior for Heat-treated Aluminum-matrix Nano-clay-composite Compared to Piston Aluminum Alloy. Silicon 2021, 14, 3749–3763. [Google Scholar] [CrossRef]
  46. Ghoddousi, P.; Haghtalab, M.; Shirzadi Javid, A.A. Experimental and Numerical Investigation of Repair Dimensions Effect on Macro-cell Corrosion Induced by Concrete Slabs Patch Repair. Int. J. Civ. Eng. 2021, 19, 1091–1110. [Google Scholar] [CrossRef]
  47. Madhu Karthik, M.; Mander, J.B.; Hurlebaus, S. Simulating Behaviour of Large Reinforced Concrete Beam-column Joints Subject to Asr/def Deterioration and Influence of Corrosion. J. Eng. 2020, 222, 111064. [Google Scholar] [CrossRef]
  48. Byron, F. Corrosion Impact of Offshore Platforms, Structures, and Vessels. Mater. Perform. 2020, 59, 50–53. [Google Scholar]
  49. Li, L.; Mahmoodian, M.; Li, C.Q. Prediction of fatigue failure of corrosion affected riveted connections in steel structures. Struct. Infrastruct. Eng. 2020, 16, 1524–1538. [Google Scholar] [CrossRef]
  50. Zhang, Y.; Cheng, Y.; Tan, G.; Lyu, X.; Sun, X.; Bai, Y.; Yang, S. Natural Frequency Response Evaluation for RC Beams Affected by Steel Corrosion Using Acceleration Sensors. Sensors 2020, 20, 5335. [Google Scholar] [CrossRef]
  51. Talukdar, A.; Rajaraman, P.V. Investigation of Acetic Acid Effect on Carbon Steel Corrosion in CO2–H2S Medium: Mechanistic Reaction Pathway and Kinetics. ACS Omega 2020, 5, 11378–11388. [Google Scholar] [CrossRef] [PubMed]
  52. Balgynova, A.M.; Ardak, M.K.; Egorov, A.L.; Arstanaliev, E.U.; Medetov, S.M.; Imangalieva, G.E.; Kalieva, A.D. Wastewater cleanup method reducing corrosion impact on pipelines and equipment of oil stabilization production. IOP Conf. Ser. Mater. Sci. Eng. 2020, 775, 012095. [Google Scholar] [CrossRef]
  53. Chen, Q.; Wang, C.; Sun, X.; Cao, Y.; Guo, T.; Chen, J. Evaluation and prediction for effect of conductive gussasphalt mixture on corrosion of steel bridge deck. Constr. Build. Mater. 2019, 228, 116837. [Google Scholar] [CrossRef]
  54. Gateman, S.M.; Georgescu, N.S.; Kim, M.K.; Jung, I.H.; Mauzeroll, J. Efficient Measurement of the Influence of Chemical Composition on Corrosion: Analysis of an Mg. J. Electrochem. Soc. 2019, 166, C624–C630. [Google Scholar] [CrossRef]
Figure 1. Size diagram of a steel pipe pole.
Water 16 03581 g001
Figure 2. Position and direction of the load applied.
Water 16 03581 g002
Figure 3. Application of wind loads.
Water 16 03581 g003
Figure 4. (a) Equivalent stress and equivalent elastic strain without corrosion. (b) Equivalent stress and equivalent elastic strain with a corrosion thickness of 10 mm. (c) Stress distribution diagram with a corrosion length of 6 cm.
Water 16 03581 g004aWater 16 03581 g004b
Figure 5. Stress situation varying with corrosion degree: (a) Normal stress varies with corrosion thickness; (b) Shear stress varies with corrosion thickness; (c) Normal stress varies with corrosion length; (d) Shear stress varies with corrosion length.
Water 16 03581 g005
Figure 6. The variation of the maximum of equivalent elastic strain and strain energy with the degree of corrosion: (a) Variation of maximum equivalent elastic strain and strain energy with corrosion thickness; (b) Variation of maximum equivalent elastic strain and strain energy with corrosion length.
Water 16 03581 g006
Figure 7. Steel pipe rod section.
Water 16 03581 g007
Figure 8. Section number of the steel pipe pole.
Water 16 03581 g008
Figure 9. The first six modes of the steel pipe pole.
Water 16 03581 g009
Figure 10. Variation of vibration frequencies of steel pipe rods under the influence of different corrosion degrees: (a) Frequency of the steel pipe rod varies with corrosion thickness; (b) Frequency of the steel pipe rod varies with corrosion length.
Water 16 03581 g010
Figure 11. The position and direction of force application.
Water 16 03581 g011
Figure 12. Nephogram of equivalent stress and equivalent elastic strain without corrosion.
Water 16 03581 g012
Figure 13. The variation of maximum equivalent stress with wind speed under different degrees of corrosion: (a) Corrosion thickness; (b) Corrosion length.
Water 16 03581 g013
Table 1. Material parameter table.
Steel TypeElastic Modulus/PaTangent Modulus/PaDensity/kg·m−3Yield Strength/MPaPoisson’s Ratio
Q3552.3 × 10112.3 × 10978503550.3
Table 2. Calculation results of deflection and rotation angles of the steel pipe rod.
Steel Pipe Pole PositionCaused by Concentrated ForceCaused by Concentrated Couple
Deflection/mmCornerDeflection/mmCorner
Point B17.5490.00347010.4100.002896
Point C18.0480.00353632.5150.008876
Point D12.4090.00225348.4310.012203
Table 3. Data table of vibration frequency of steel pipe rods.
Order NumberFrequencyCycle/s
10.982651.0177
20.987271.0129
35.35540.1867
45.47650.1826
56.09610.1640
611.6250.0860
Table 4. Calculation results of the damping coefficient.
Corrosion Thickness/mmAβCorrosion Length/cmαβ
00.0196990.02030500.0196990.020305
50.0196890.02031620.0196890.020315
100.0196830.02032240.0196820.020323
150.0196680.02033860.0196880.020317
200.0196470.02035980.0196870.020317
Table 5. Elastic modulus and yield stress.
Quality Loss Rate (ηm)Elastic Modulus (E/1011)Yield Stress (fy/MPa)
0.5%2.2999354.982
1%2.2998354.965
1.5%2.2997354.947
2%2.2996354.930
Table 6. Maximum value of equivalent stress and equivalent elastic strain.
Quality Loss Rate (ηm)Maximum Equivalent Stress (MPa)Maximum Equivalent Elastic Strain (10–6)
01.23735.7155
0.5%1.23895.7473
1%1.24265.7923
1.5%1.24785.8182
2%1.25015.8554
Table 7. Calculation results of wind load at the different wind speeds.
Loads at Different LocationsEquivalent Wind Load Under Different Wind Speeds (m·s−1) and Wind Pressures (kg·m−1 s−2)
15 m·s−120 m·s−125 m·s−130 m·s−1
140.625 kg·m−1 s−2250 kg·m−1 s−2390.625 kg·m−1 s−2562.5 kg·m−1 s−2
Rod body wind load (WS/N)First section992.2517642756.253969
Second section1120.531992.063112.594482.135
Third section1150.262048.453200.714609.02
Fourth section958.381703.782662.153833.5
Crossarm wind load (LH/N)Upper 125.3222.75348.05501.19
Central153.14272.25425.39612.56
Conductor wind load (P/N)304.05540.54844.591216.215
Conductor weight (G/N)410.54410.54410.54410.54
Insulator string wind load (LJ/N)68.875110171.875247.5
Broken-line load (FD/N)75,62075,62075,62075,620
Disclaimer/Publisher’s Note: The statements, opinions and data contained in all publications are solely those of the individual author(s) and contributor(s) and not of MDPI and/or the editor(s). MDPI and/or the editor(s) disclaim responsibility for any injury to people or property resulting from any ideas, methods, instructions or products referred to in the content.

