Article

Optimization of Ecological Dispatch and Hydrodynamic Improvements in Tidal River Channels Using SWMM Modeling: A Case Study of the Longjin Yangqi Area in Kurama Mountain

1
Fuzhou University, Fuzhou 350108, China
2
China Institute of Water Resources and Hydropower Research, Beijing 100038, China
*
Author to whom correspondence should be addressed.
Water 2024, 16(22), 3336; https://doi.org/10.3390/w16223336
Submission received: 10 September 2024 / Revised: 19 October 2024 / Accepted: 23 October 2024 / Published: 20 November 2024
(This article belongs to the Section Hydraulics and Hydrodynamics)

Abstract

:
Being tidal-sensitive, the river channel in the Longjin Yangqi area of Cangshan, Fuzhou City, is challenged further because of rapid urbanization. Thus, resultant remediation efforts are crucial. This study aims analyzes hydrodynamic characteristics of the area and, secondly, proposes an ecological dispatch solution with evaluation of its effectiveness through the Storm Water Management Model (SWMM). The chief tasks cover imitating rainfall runoff, optimizing sluice gate activities, reorganizing pump management, and reshaping river morphology to bolster flood control and water quality. Improvements were shown through ecological dispatch strategies, which suggested increasing the channel width for the river and deepening the riverbed, thereby increasing the flood duration, lowering water levels, and less frequent flood occurrences. Optimizing sluice gate settings improved efficiency in the regulation of water flow and reduced scour or siltation problems. Various adjustments to pumping operations scattered over various times were based on live-data analysis, therefore enhancing water flow and the self-purification capacity of the water body. The SWMM was directly applied in this tidal river for urban water resource management with data processing from over 100,000 points in simulations. Wherever needed, changes to model parameters were made to improve its capability and enhance its appropriate use in future urban settings. As a whole, this study presents a plan for sustainable water resource management paired with environmental conditions for the benefit of over 500,000 urban residents in the Longjin Yangqi area.

1. Introduction

In-depth studies on the serious issues related to water management in urban settings have been conducted by a dozen researchers and very well documented [1,2,3]. They also look at the efficient utilization of water resources [4,5]. This has led to the development of many models and strategies which aim at optimizing water distribution, flood control, and resource sustainability [6,7,8,9]. Notwithstanding, there are numerous models and management frameworks capable of optimizing the use of water resources [10,11,12,13]. These tools ensure the efficient and sustainable utilization of the most important resources [14,15,16]. They cover modeling techniques from hydrological simulation, technicalities for permeability implementation, and decision support systems, among others, with varying degrees of complexity [17,18,19,20]. The Storm Water Management Model (SWMM) tool is indeed a highly effective approach toward urban water resource planning that guarantees resource use in urban areas [21]. The SWMM includes both quantity and quality analysis of urban runoff during a single storm or integrated over varying time periods [22]. Despite the progress made in previous studies, there are still some problems and challenges. For example, some SWMM-based scenarios may be too complex and require a large number of parameters and data support, which brings some difficulties in practical applications [23]. Although SWMMs can simulate the distribution and flow of urban water resources and provide decision support, they require a large amount of basic data and professional knowledge, which limits their application in practice [23,24]. In addition, GIS model-based scenarios may focus too much on the geographic information aspect, ignoring the holistic nature of water resource management and improvement [25]. Although GIS modeling can combine spatial and attribute information to provide a basis for a rational allocation of water resources, it may ignore the dynamic changes in water resources and the influence of multifaceted factors [26]. In addition, some neural network model-based scenarios may also rely too much on historical data and fail to adequately consider future changes. Although neural network modeling can predict future water demand and supply to provide reference for water resources scheduling and management, it requires high data quality and training samples, otherwise it may lead to inaccurate prediction results [27].
Therefore, in order to address these problems, we need to further study and explore more effective water resource management and improvement programs. This includes the development of simpler and more practical models and scenarios that take into account factors such as the holistic nature of water resources and the full consideration of future change scenarios. It is also necessary to strengthen the application and evaluation in practice, and to continuously improve and optimize the models and scenarios in order to achieve better water resource management and improvement.
Among them, the SWMM is a widely used tool for urban water management. It can not only simulate and manage urban stormwater runoff, but also provide important decision support for urban water resource management [28]. Due to its powerful functions and wide range of applications, the SWMM has become one of the most commonly used models in the field of urban water management. In addition to the SWMM, there are many other models that have been applied to urban water resource management and research. For example, the HSPF (Hydrologic Simulation Program-Fortran) model is used to simulate and analyze the water quality and quantity of urban stormwater runoff [29]. The urban model has been applied to design and optimize urban drainage systems. These and other such models have, to one extent or another, contributed toward better management and improvement of urban water resources. But with the aforementioned advancement comes the realization that some sort of pragmatic and responsive solutions are still required to tackle the challenges of urban water resource management. The objective of this study is to bridge this gap by offering the most effective and actionable solutions through the mapping of the urban water resources through integrated simulation and optimization modeling. This study integrates advanced modeling techniques with field surveys and data collection so that the study area is fully grasped.
The case study associated with this paper is the Senshao River channel in the Longjin Yangqi area of Cangshan. In this analysis, the rainfall runoff simulation mechanism and the hydrological characteristics analysis within this region become focal issues to be addressed by providing a site-specific remediation proposal. This report further presents action plans that should be catalyzed through small, improved measures to enhance channel morphology for better flow efficiency, optimization of sluice gates for appropriate control of water levels, and operational adjustments of pumps for more effective water distribution at different hydrological conditions.
To substantiate the effectiveness of these measures, a simulation-based evaluation and prediction are performed upon the proposed ecological dispatch scheme. The focus of this is the worst-case scenario, wherein water quality overall and resource management within the local area could be enhanced. The findings from this research could inject great value into urban water resources integrated management, which could lead to more sustainable and efficient practices.
The research in this paper consists of the following sections:
(1) Introduction: Introduces the background and significance of this study and summarizes the application of related studies and models at home and abroad. (2) Overview of the study area: Introduces the natural geography and socio-economic situation of the Longjin Yangqi area in Cangshan, as well as the basic situation and problems of the Senshao River channel. (3) SWMM construction: introduces the principles and methods of the SWMM, constructs the SWMM applicable to the study area, and verifies and calibrates the model. (4) Hydrological characterization: simulates the rainfall runoff process in the study area using the SWMM and analyzes the hydrological characteristics, including flow rate, water level, and flow velocity. (5) Development of remediation plan: Based on the results of hydrological characterization, develops targeted remediation plans, including measures to improve river morphology, optimize sluice gate settings, and adjust pump operation. (6) Evaluation of ecological dispatching program: Evaluates the effect of the ecological dispatching program through simulation and prediction, including hydrodynamic enhancement and improvement. (7) Conclusion and recommendations: Summarizes the research results and puts forward targeted recommendations and prospects.
The research results of this paper are of great significance for realizing the sustainable development of the city and building a beautiful ecological environment. At the same time, this paper also provides reference for water resource management in other cities.

2. Study Area and Methodology

2.1. Study Area

The Longjin Yangqi area in Cangshan, Longjin, Fuzhou City, Fujian Province, China, is of typical research significance as a water resource-rich area. The area is rich in water resources and has a well-developed water network, however, due to historical reasons and practical conditions, there are many problems with water resource management in the area. For example, the drainage and collection system of rainwater runoff is imperfect, the utilization efficiency of water resources is not high, and water quality problems are serious. The Longjin Yangqi area in Kuanshan is located in Fuzhou City, Fujian Province, with a total area of about 108.85 square kilometers. The area is located on the south bank of the Min River and is one of the important satellite cities in the southern part of Fuzhou City. The terrain in the area is flat, with rivers running through it, is a well-developed water network, and has abundant water resources. However, with the process of urbanization, water resource management and problems in the area have gradually come to the fore.
The main water system in this area is the Yangqi River, which is about 10.8 km long, originating in Yangqi Mountain, Gaisan Town, Cangshan District, flowing through Cangshan Town, Gaisan Town, Cangshan District, and eventually injecting into the Minjiang River. The Yangqi River flows through an area with relatively flat topography, large variations in the width of the riverbed, slow flow rate, and average river water quality. In addition, the area has a relatively large number of tributaries and ditches that interconnect with the Yangqi River, forming a complex water network. These water systems are widely distributed and cover all corners of the area. However, due to the accelerated urbanization process, the form and function of these water systems have been damaged and affected to varying degrees. Meanwhile, Fuzhou area has unique geographical and climatic conditions, the upper and lower boundaries of the study area are tide-sensitive rivers, and the influence of seawater makes the change in river level and flow more complicated. There are few naturally occurring catchments. Such environmental conditions further increase the difficulty of water resource management and governance.
The issues pertaining to storm water runoff discharge and collection system along the Longjin Yangqi area in Kurama are alarming. First, urbanization fuels the incidence and expanse of the impervious surfaces, such as concrete and buildings, hence killing the infiltration of rainwater through the soil and complicating the challenges of storm water management. This finding agrees with those studies in raising that urbanization is inclined to increase surface runoff and decrease natural water absorption which creates a stress load of existing drainage systems within the urban setting [30,31,32]. Second, the drainage systems of history developed under various urban planning design standards cannot accommodate and cope with the present-day runoff which obviously leads to frequent accumulation and inundation during events of heavy rainfalls. Similar observations have been reported in other urbanized areas with outdated or insufficient drainage systems [33,34]. These factors contribute to the ongoing difficulties in managing stormwater in the Longjin Yangqi region. In addition, the fact that the study area is a tidal river area and has few naturally occurring catchments adds to the challenges of stormwater runoff discharge and collection systems. Water quality is also an important issue for the stormwater runoff discharge and collection system in this area, due to poorly placed outfalls, which are either too high or too low, which can lead to substandard water quality and pollution of the environment.
Furthermore, the study area is bordered by tide-influenced rivers, and also the influence of seawater has complicated changes in river level and flow. The Yangqi sluice gate and Luizhou River flap gate are indicated by Figure 1 as critical points where tidal inflow and outflow occur and influence water levels and flow patterns in the system. The hydrodynamic effects of sea tides propagate upstream through these connections, affecting the study area. This tidal effect, plus various less naturally occurring catchment areas, serves to further complicate the role of water governance and management.
In response to the above problems, this paper simulates and analyzes the rainfall runoff in the Longjin Yangqi area of Kuanshan based on the SWMM. Considering the influence of tidal-sensitive rivers and the realistic conditions of urbanization, the model deeply explores the processes of rainfall runoff generation, conveyance, discharge and collection. At the same time, combined with the ecological scheduling program, it aims to improve the water power and quality, while reducing the impact on the environment, and to provide scientific decision support for the management and governance of water resources in this area.

2.2. Modeling Tools

Based on the SWMM, this paper designs a framework for nano-tidal diversion to optimize the target water quality and flow rate. The key aim of this framework is to construct an objective function to achieve the optimal effect of remediation by adjusting the parameters (Equation (1)).
( x ) = w 1 f 1 ( x ) + w 2 f 2 ( x ) + w 3 f 3 ( x )
where f1(x), f2(x), f3(x) denote the optimization functions for water quality, flow rate, and cost, respectively, and the weighting coefficients w1, w2, w3 for water quality, flow rate, and cost in the optimization function were determined based on a combination of environmental priorities, hydrodynamic performance, and cost feasibility. The vector x encompasses various input parameters, including outfall location, discharge, and tidal conditions.
Function f1(x), being an object function, qualifies one of the water quality optimizations with various ways in which it relates to the maintenance and improvement of water quality in tidal rivers, especially in areas impacted by human activities.
Function  f 2 (x) is the most crucial factor towards achieving good water circulation and keeping a uniform habitat, for it laterally influences the hydrodynamic behavior of the system after changing the diversion angle.
Function f3(x) deals with cost optimization. Economic feasibility is being seen as an important consideration for environmental management projects. Incorporating this function would guarantee the sustainability of proposed solutions for implementation under existing financial constraints.
The water quality objective function  f 1 (x) utilizes water quality indices, such as DO (Dissolved Oxygen), BOD (Biochemical Oxygen Demand), and COD (Chemical Oxygen Demand), as evaluation metrics. It calculates the average or weighted average of these indices by simulating water quality changes under various drainage scenarios.
The flow velocity objective function f2(x) considers the influence of flow velocity on the hydrodynamics and uses the indicators of flow velocity distribution uniformity and flow velocity stability for evaluation. By simulating the flow velocity distribution under different drainage schemes, the average or weighted average of the flow velocity evaluation indexes is calculated.
The cost objective function f3(x) considers the implementation cost of the natatorium diversion project, including equipment investment, operating costs, etc. By estimating the cost of different drainage schemes, the average or weighted average of the cost is calculated.
By adjusting the parameter x and the weighting coefficients w1, w2, w3, a trade-off between different objectives can be realized to find the optimal remediation solution. This framework of natatorium diversion can help us to better manage water resources and improve the quality while reducing the project cost.
The flow chart of the water quality optimization function is shown in Figure 2:
Water quality optimization could use water quality indices (i.e., DO, BOD, COD) as evaluation criteria and calculate the average or weighted average of the water quality indices on the basis of the simulated water quality changes under different drainage schemes in accordance with Equation (2). Specifically, the following steps can be used for the simulation:
f 1 ( x ) = D O a v x + B O D a v g x + C O D a v g ( x ) 3
where  D O a v (x),  B O D a v g (x), and  C O D a v g (x) represent the average values of the water quality indices DO, BOD, and COD, respectively, under drainage scenarios. The average values of the water quality indices DO, BOD, and COD can be calculated by modeling thechanges in water quality under different drainage scenarios. These average values can be calculated by simulating the water quality changes under different drainage scenarios. The value of the water quality optimization function f1(x) is then obtained by adding these three average values and dividing by three.
Please note that this is only an example formula, and the actual water quality optimization function may be more complex and need to consider more factors and evaluation indexes. In addition, model parameters need to be adjusted and optimized according to the specific situation to achieve better water quality management and optimization.
The main purpose of this function is to determine the optimal outlet location and discharge volume for the purposes of water quality enhancement. The following provide the detailed simulation steps:
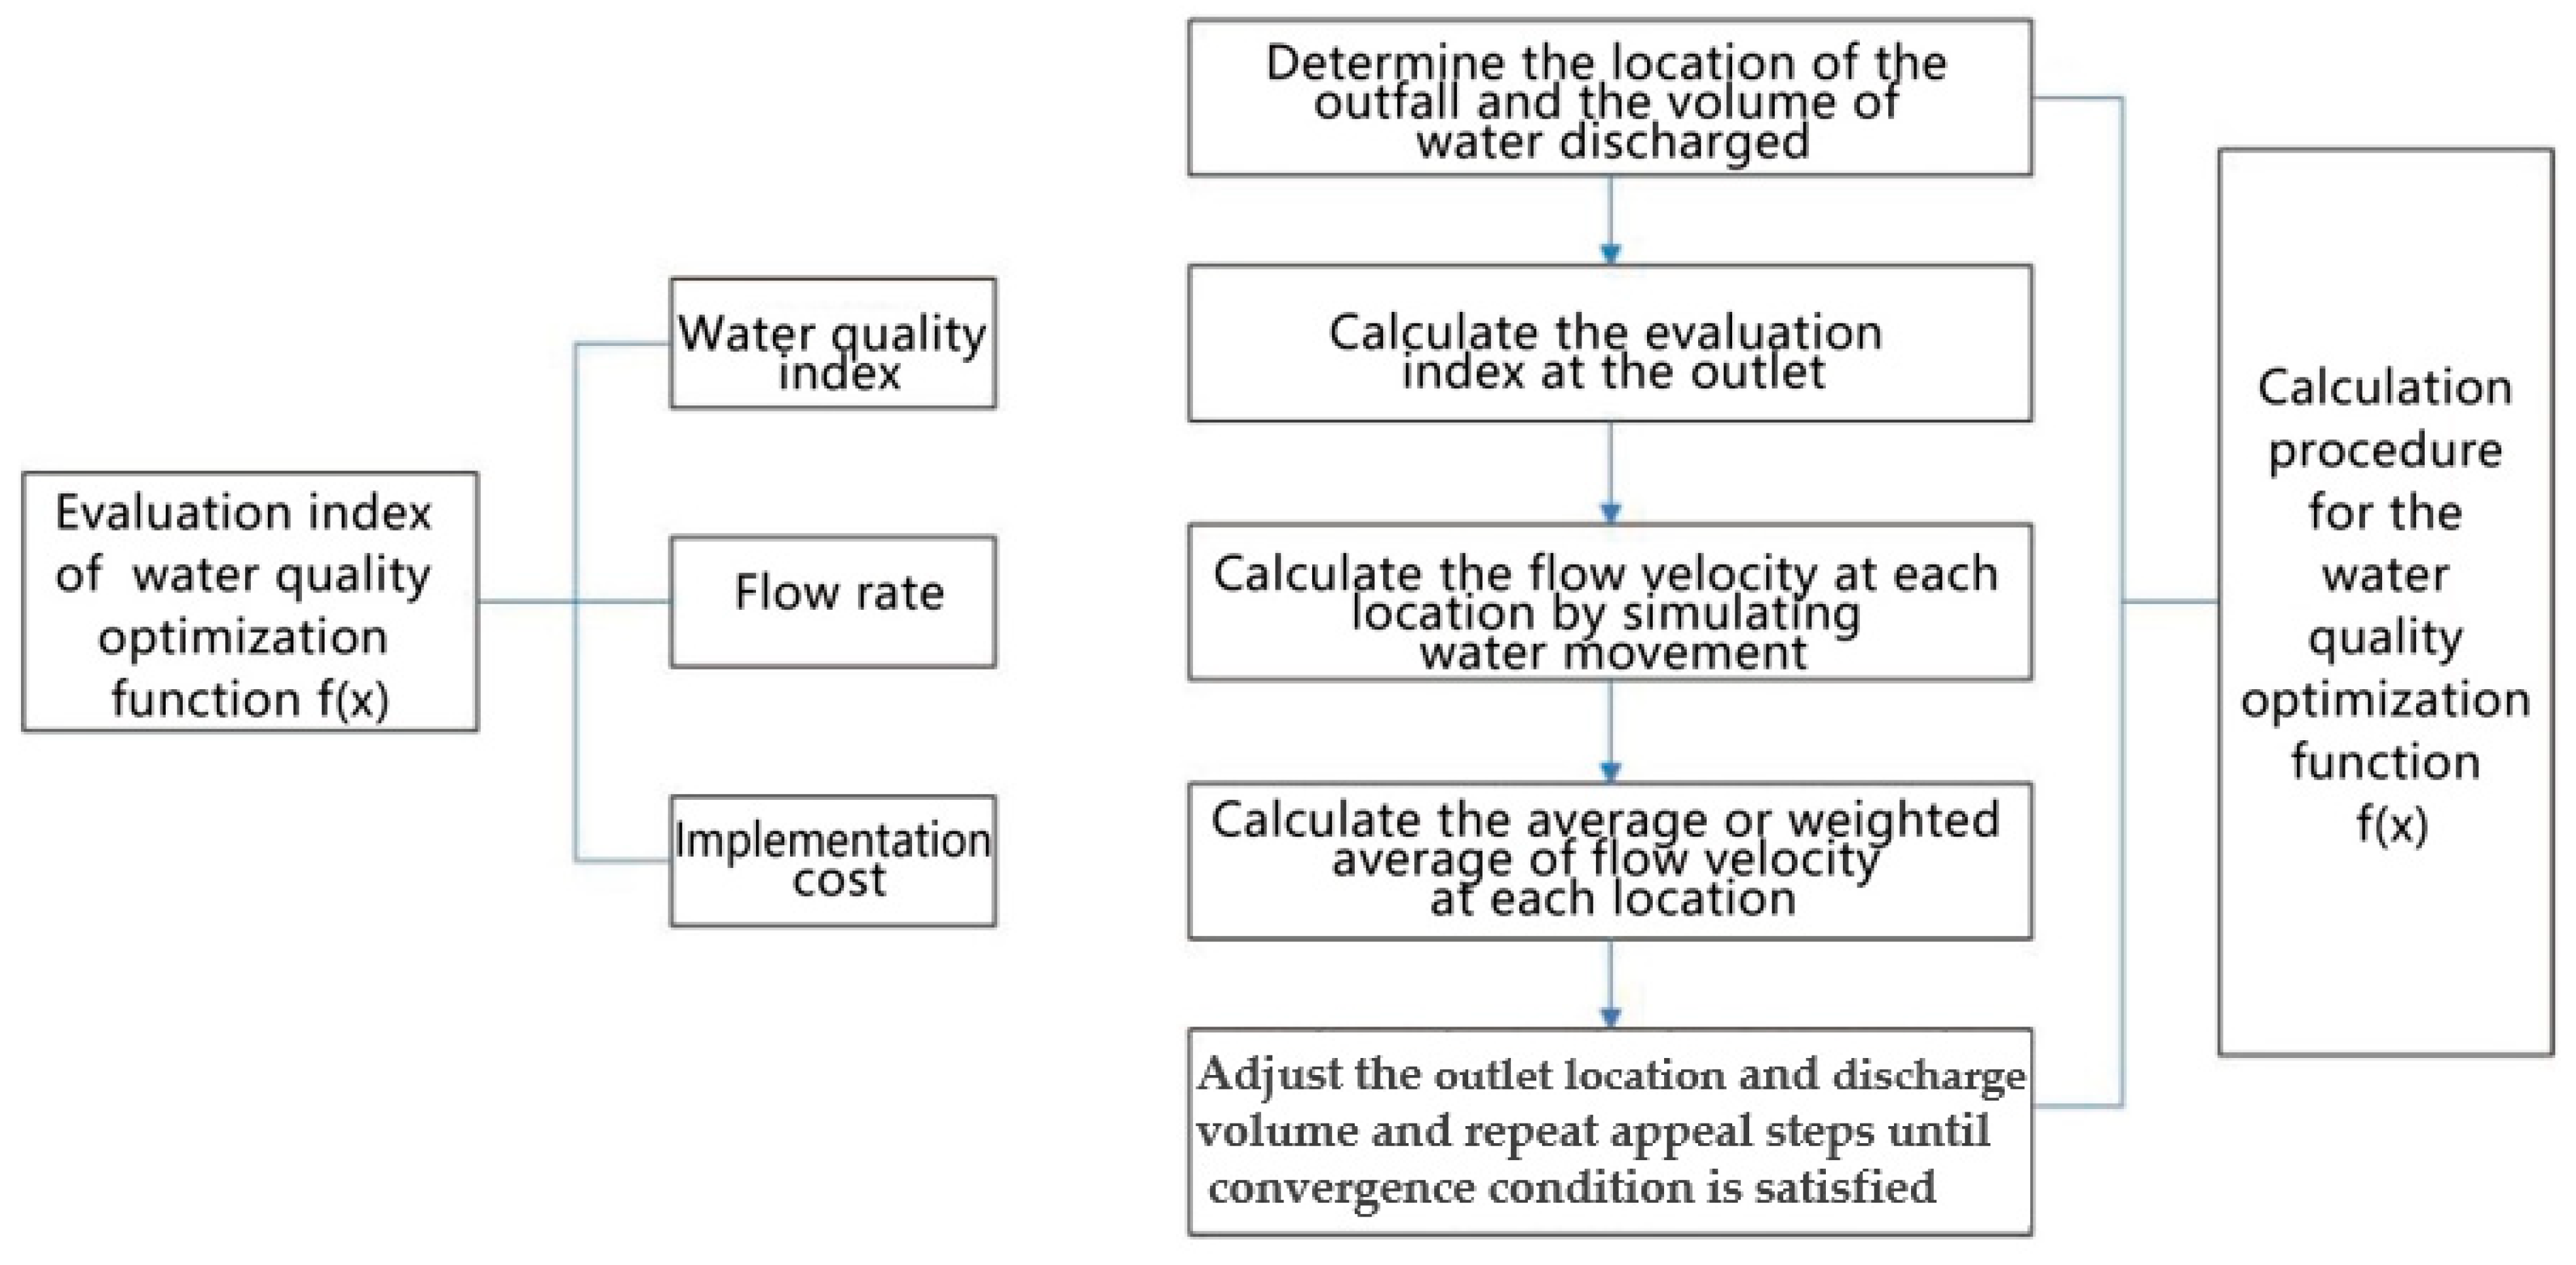
  • Initial Setup: Set the location of the drainage outlet and the discharge volume based on initial estimates, drawing on existing data and experience.
  • Water Quality Calculation at the Outfall: The model will simulate the water quality at the outfall while hydrodynamic conditions are selected such that the influence of tidal currents on water flow is included.
  • Water Movement Simulation and System Connectivity: The model will simulate water motion throughout the system while also incorporating coupled calculations of connectivity of the system along with water quality indices at every specific point within it.
  • Average Water Quality Calculation: Mean or weighted mean values of water quality index values are computed at individual points to assess the condition of regional water quality.
  • Adjustment and Iteration: In accordance with the calculated water quality results, the positioning of the drainage outlet and discharge volume is adjusted. Aspirant iteration of steps 1–4 will continue until a convergence is realized.
Water quality optimization is represented by the following equation:
f 2 ( x ) = [ v 1 . avg ( x ) + v 2 . avg ( x ) + + v n . avg ( x ) ] / n
In this equation,  v i .avg(x) represents the average flow rate at each monitoring point i within the system, where i = 1, 2, …, n. The variable n is the total number of monitoring points or time intervals considered in the model. This function averages the flow rates across the system to optimize the overall water circulation and hydrodynamic performance.
The key purpose of this step is to optimize the hydrodynamic parameters of the simulation, like the uniformity of v distribution and the stability of the flow. The specific simulation steps are the following:
  • Initial Setup: Set the location of the drainage outlet and the discharge volume.
  • Flow Velocity Calculation at the Outfall: At this exit, flow velocity has been computed on the basis of tidal conditions.
  • Water Movement Simulation: To simulate water flow through the varying connected nodes of the system by finding the flow velocitation at each node.
  • Average Flow Velocity Calculation: Compute an average flow rate, mean, or weighted for the whole region.
  • Adjustment and Iteration: Variation of location of the discharge, volumetric discharge, and steps check for convergence criteria will be continued.
  • The cost optimization function is defined in Equation (4) below, as follows:
f 3 ( x ) = [ C 1 . avg ( x ) + C 2 . avg ( x ) + + C n . avg ( x ) ] / n
Here,  C i .avg(x) denotes the average cost at each stage i of the operation, where i = 1, 2, …, n, and n is the total number of operational stages or scenarios. This function calculates the average cost over the operational period to ensure the economic feasibility of the tidal diversion project.
The main objective of this function is to optimize the implementation cost of the Nacho Diversion Project, including equipment investment, operating costs, etc. The following are the detailed simulation steps:
  • Equipment Determination: Determine the type, quantity, and type of equipment required based on the project requirements and budget.
  • Equipment Cost Calculation: Estimate the purchase and installation cost of the equipment according to the model and performance parameters of the equipment.
  • Operating Cost Calculation: Estimate the operating costs of the equipment, taking into account the operating time and operating efficiency of the equipment.
  • Total Cost Calculation: Add the investment cost of the equipment and the running cost to calculate the total cost of the whole project.
  • Adjustment and Iteration: According to the calculated total cost of the project, adjust the number and model of the equipment, and then repeat the above steps until an optimal solution is found or the convergence condition is satisfied.

2.3. Working Condition Setting

(1)
Natural Mobility Program
In natural flow management systems, gates play a crucial role in controlling water flow. These gates are opened or closed based on tidal variations to regulate water levels effectively. The primary advantage of this approach is that it leverages the natural flow of water, reducing energy consumption and minimizing environmental disruption. However, operating the gates requires experienced technicians, and this method may be less effective in preventing or managing floods during extreme weather conditions. Consequently, it is essential to consider local climate conditions, topography, and the hydrological environment carefully when implementing natural flow schemes.
In Figure 3, the tidal levels recorded on 7 June in the wet season (straight black line) and 18 January in the dry season (dotted red line), illustrate the variation in tidal level of the tide (in meters) during 24 h. In the wet season, maximum tidal levels reached values of about 5.5 m, while the same in the dry season reached about 4.5 m. This shows that there are smaller tidal ranges. It highlights the influence seasonal variations have on the nature of the tides; consequently, this emphasis points to the need to understand these dynamics in order to manage urban water resources and assess the ecological health of coastal areas effectively.
(2)
Power Lift Program
Prior to the connection of water systems, power lift scheduling was an effective method of scheduling. The basic principle is to close all the locks along the river, and through the scheduling of pumping stations and sluice gates, the water from the outer river is introduced into the inner river, or the water from the inner river is discharged to the outer river. In the process of power water lifting and dispatching, the model setting has an important influence on simulating the dispatching of different working conditions.
In this specific operation, firstly, all the lock stations along the river need to be closed, including the lock station along the Baihu Ting River in Yangqi River and the lock station along the Longjin Yuejin Connecting River in the Hongkong Tau River section, and so on. Secondly, it is necessary to turn on the Longjin Yuejin Link River pumping station and the Gangtou pumping station in the Gangtou River section to continuously discharge water at a flow rate of 6 m3/s. This will ensure that the water level in the Yangqi River will be maintained at a constant level. This will ensure that the water level of the Yangqi River is stabilized and also meets the drainage needs of the area. It is also necessary to turn on the Yangqi sluice pumping station to divert water from the Minjiang River at a flow rate of 18 m3/s, and to turn on the Baihu Ting integrated pumping station and the Yixing recharge pumping station to continuously discharge water at a flow rate of 8 m3/s. The Zhulan River water replenishment pumping station, Yuejin No.2 tributary water replenishment pumping station, and Yuejin tributary water replenishment pumping station also continuously replenish water and discharge water so as to ensure that the water level in the area is stable, and at the same time, to meet the drainage demand in the area.
During the implementation of the power lift program, all river gates were closed while the rest of the model was set up to be consistent with the natural diversion program. This avoided the impact of the opening of the gate stations on the water flow and ensured that the diversion and discharge of water proceeded smoothly. At the same time, the impact on the ecological environment along the river could also be reduced. The schematic diagram of the dispatching process in Yangqi area is shown in Figure 4.
In summary, the power water lifting program can effectively solve the water level and water quality problems in the area of Yangqi River, Gangtou River sluice, and Longjin Leapfrog Connecting River, as well as meet the drainage needs of the area. During the implementation of this program, attention needs to be paid to the speed and flow rate of water diversion and drainage to ensure the stability of water level and water quality in the region. As shown in Table 1, the Yangqi River and Gangtou River Power Lift Dispatch Scheme provides a detailed plan for managing flow rates and ensuring regional stability.

3. Results and Discussion

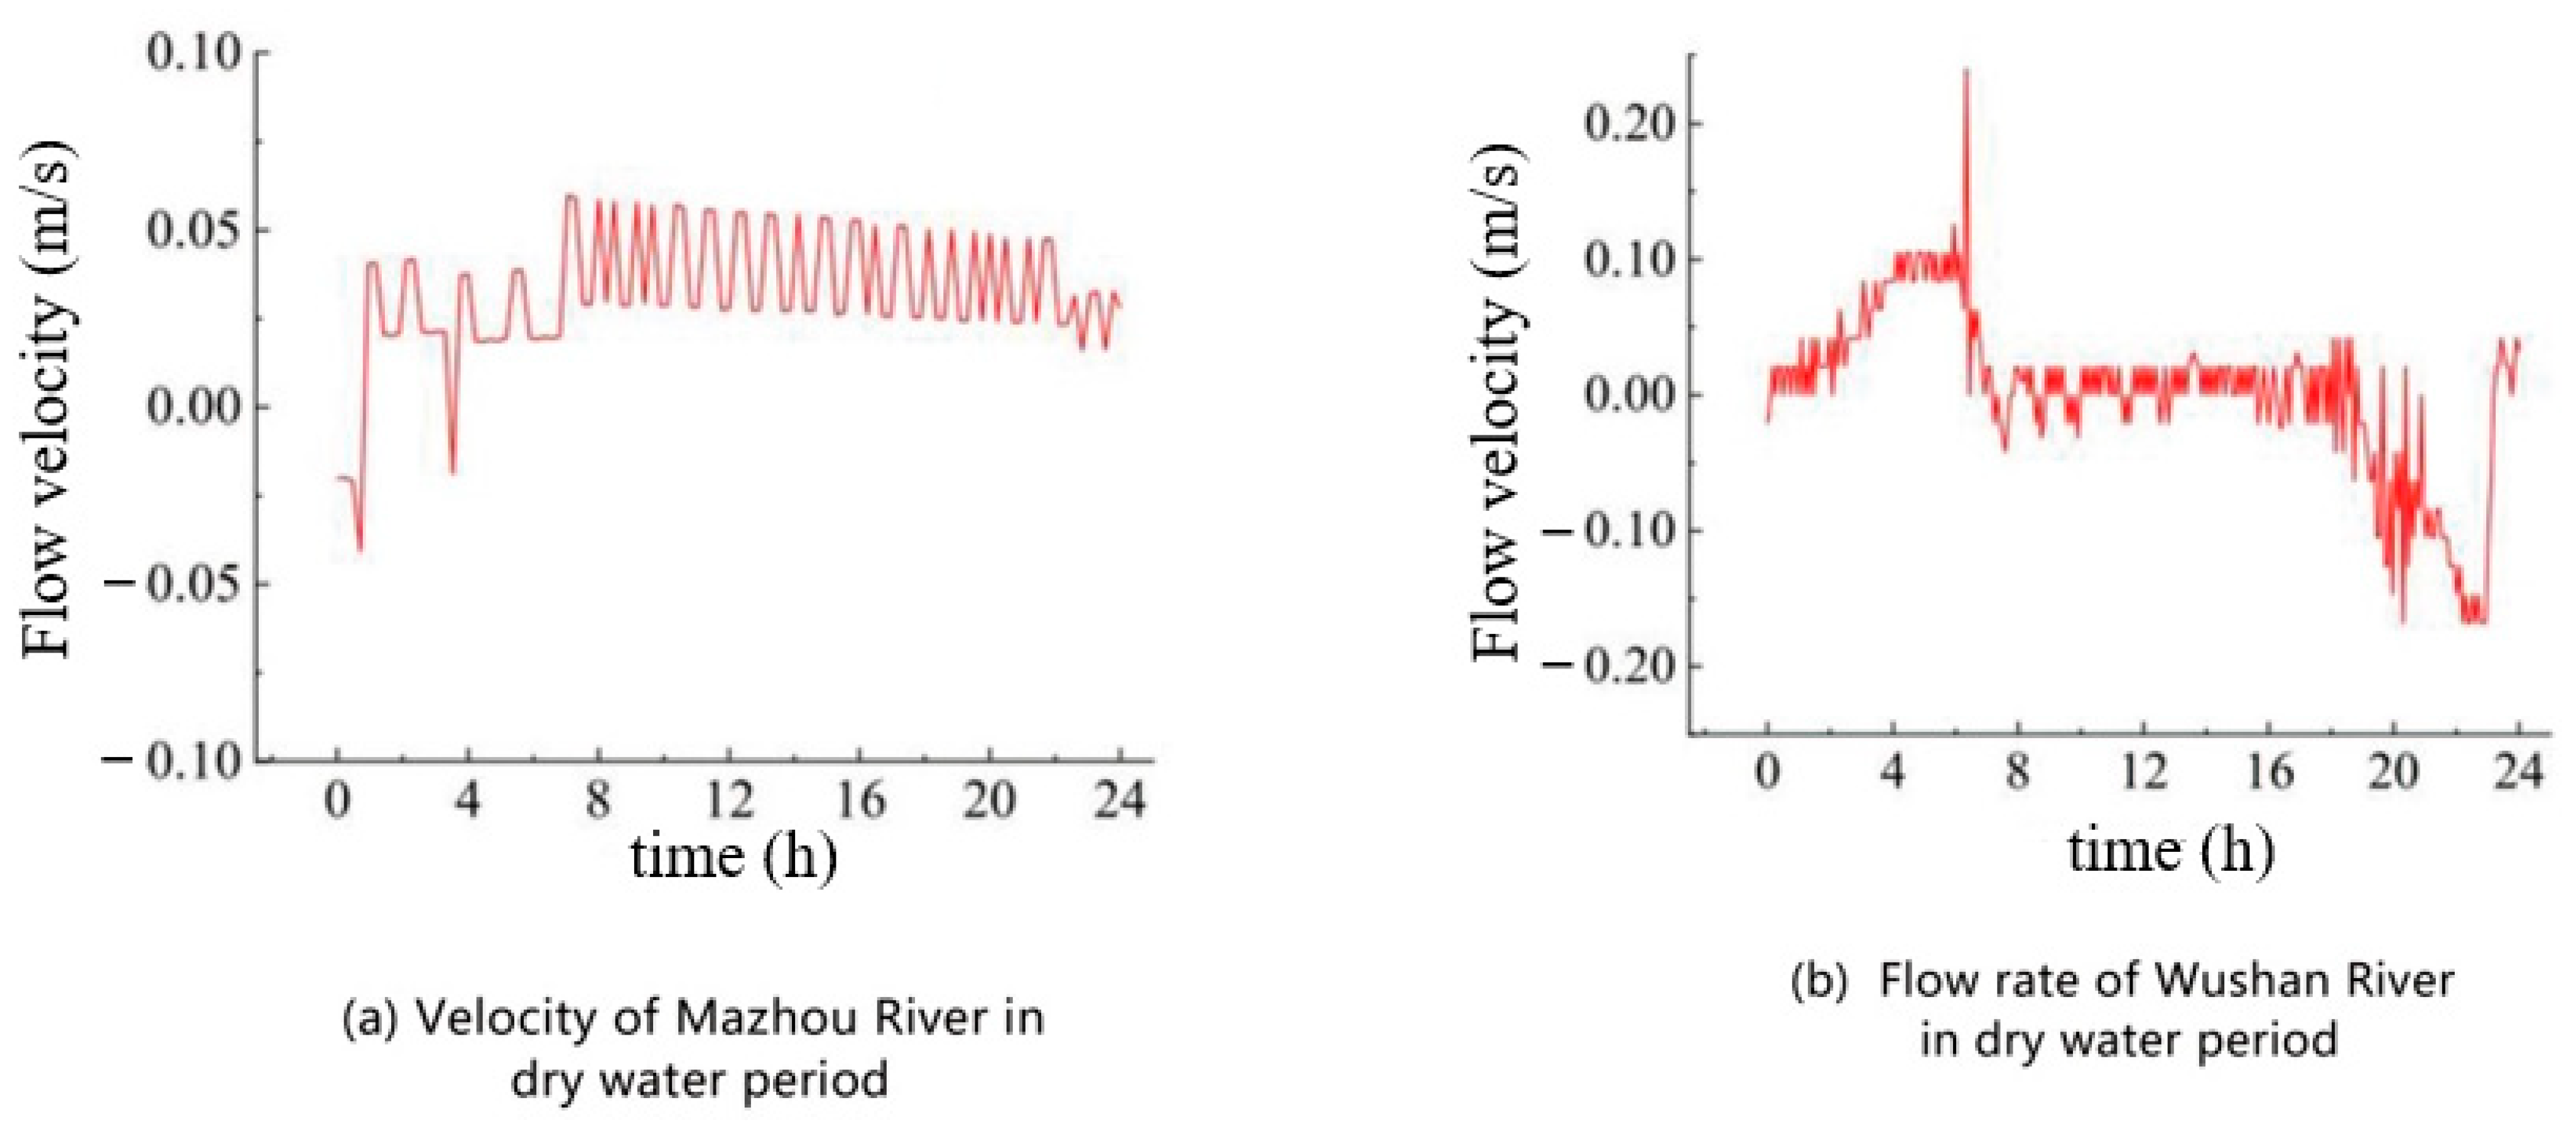
3.1. Working Conditions Prior to River Connectivity

Before the river was connected, the water flow was limited by a variety of factors such as geographic conditions and channel morphology, resulting in an overall lack of water flow power and a relatively slow water flow rate. The scheduling scheme at this time relied heavily on natural diversion, i.e., utilizing topographic elevation and hydrologic conditions to allow water to flow naturally. Through the implementation of this scheduling program, specific results were observed, as follows:
  • The water flow rate was increased:
Before scheduling, the water flow rate was greatly affected by the narrowness, curvature, or presence of obstacles in the river channel, resulting in an overall slow flow rate. After scheduling, through measures such as clearing the river channel and improving its morphology, the resistance to water flow was reduced and the water flow rate was relatively increased by 15%. This resulted in a faster renewal of the water body in the river, contributing to the improvement of water quality.
2.
The difference in water levels was reduced:
Before the river was connected, there were discrepancies in the water level in the river channel due to poor water flow, with higher water levels in some areas and lower levels in others. After scheduling, the water level in the river was successfully balanced by optimizing the operation of the sluice gates, pumps, and other equipment, as well as by adjusting the throughput section of the river. The difference in water levels was measured to have been reduced by 20%.
In summary, although the water flow was restricted to a certain extent before the river was connected, the water flow rate could still be effectively increased and the difference in water level reduced through reasonable ecological scheduling program, which created good conditions for the subsequent river connection work. This also proves the practical application value of ecological scheduling in urban water resource management and improvement.

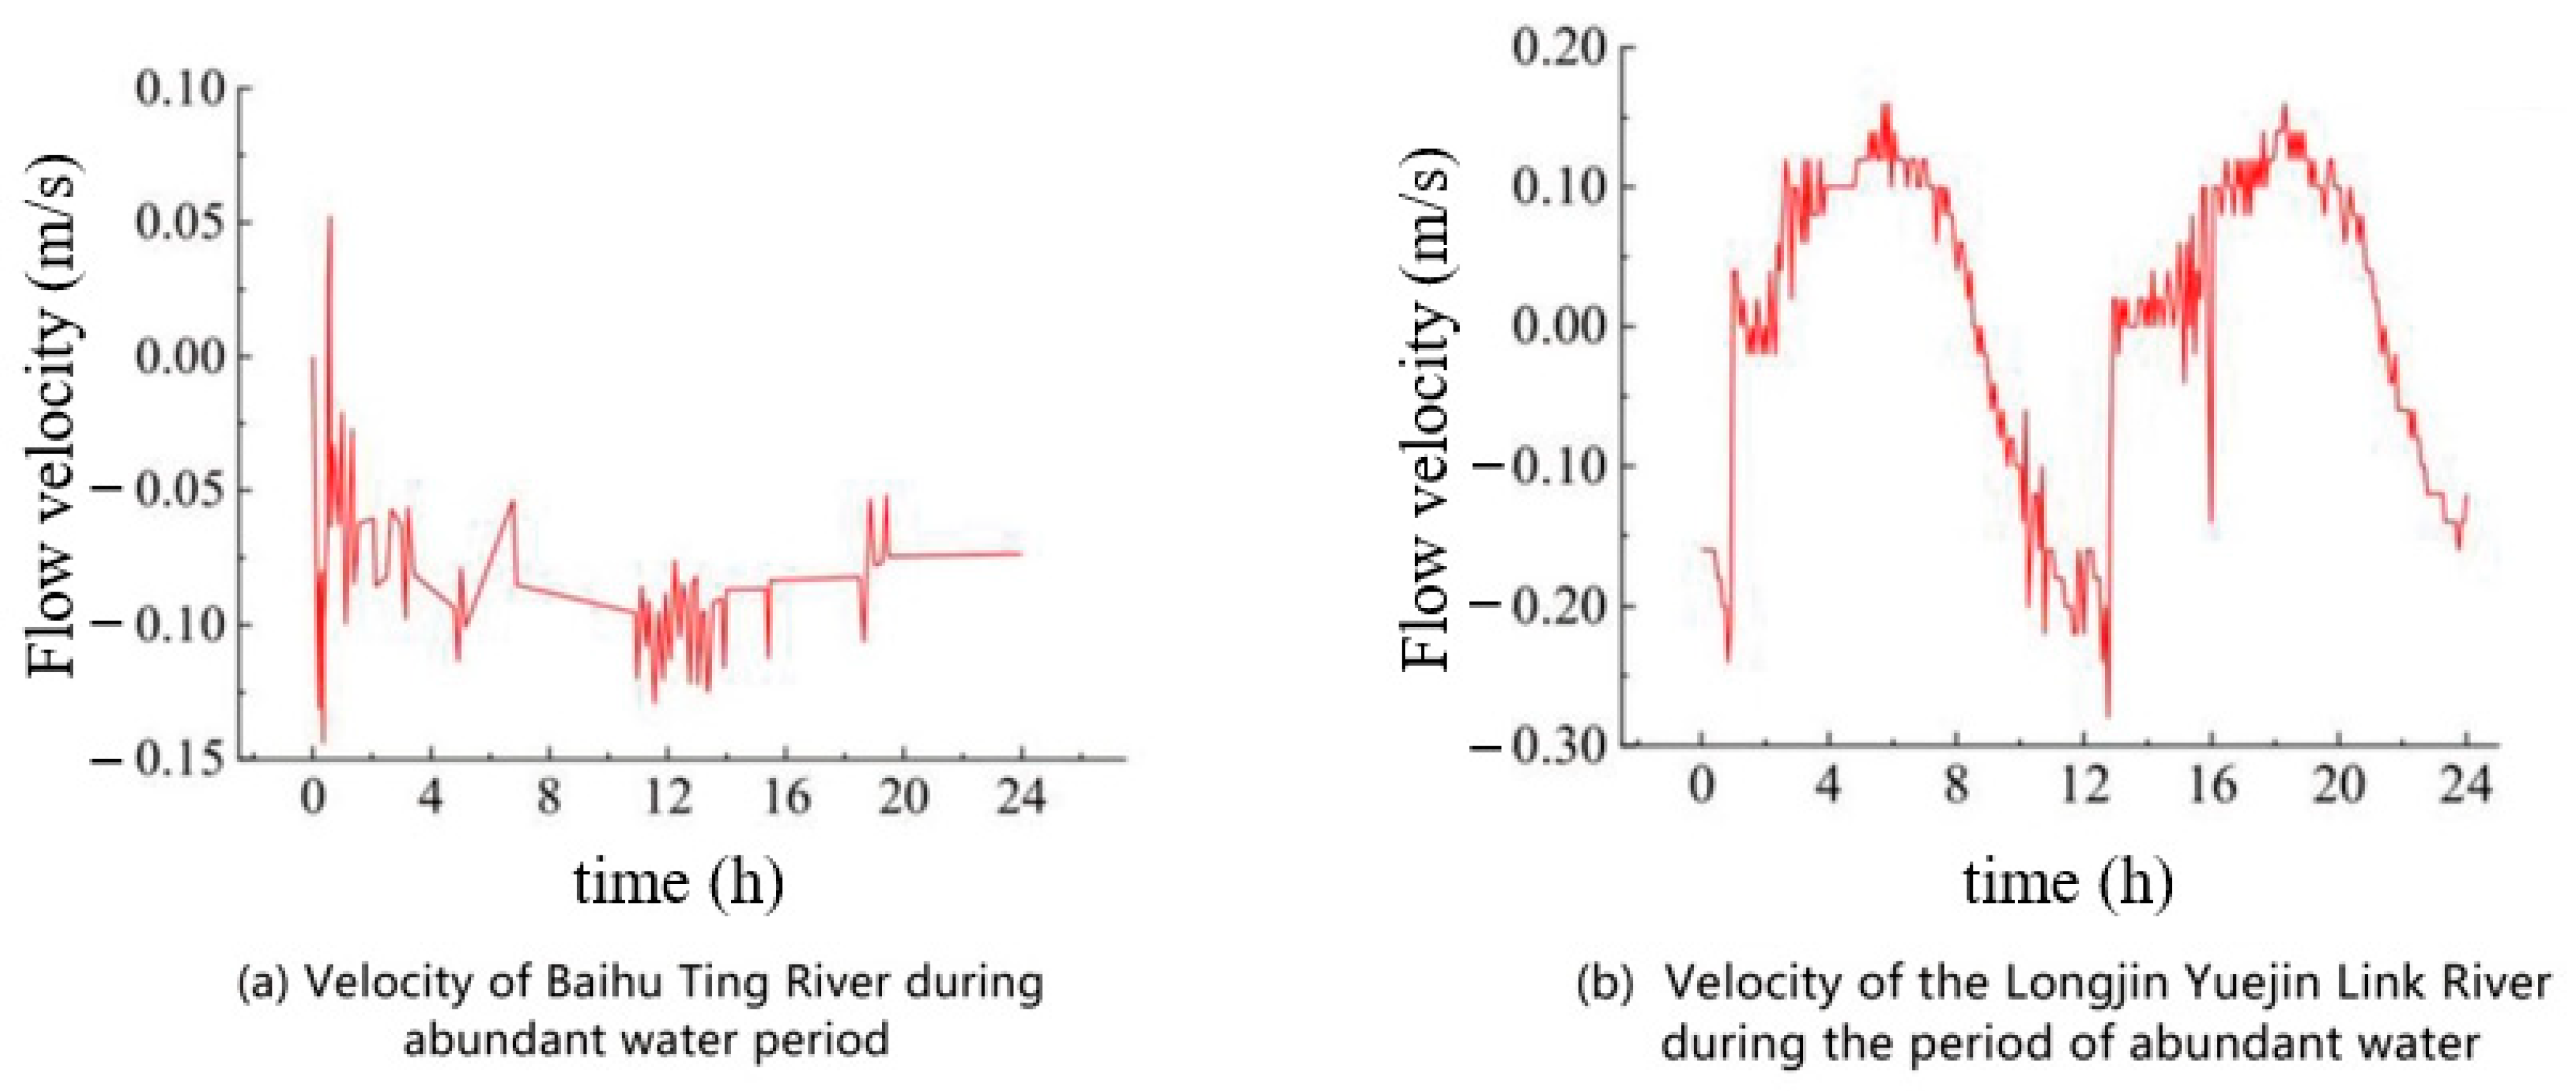
3.2. Analysis of Natural Flow Scheduling Options for Water System Connections

From Figure 5 and Figure 6, it can be seen that the monitoring section in the Mazhou River Basin shows that the flow velocities under the four conditions during the abundant water period were different, in which the flow velocity of condition 1 reached up to 0.24 m/s, the maximum flow velocities of conditions 2 and 3 were 0.18 m/s and 0.15 m/s, respectively, and the flow velocity of condition 3 reached up to 0.03 m/s or more for the longest time and had the best hydrodynamic effect. In the Wushan River monitoring section during the abundant water period, all three conditions showed obvious north–south reciprocating flow, in which the flow velocity of condition 3 reached 0.36 m/s, and the average flow velocity reached 0.05 m/s or more for the longest time, with the best hydrodynamic effect. In the dry water period, the monitoring section of Mazhou River mainly flowed toward the east, in which the highest flow velocity was up to 0.06 m/s, and the average flow velocity was above 0.03 m/s, while the average flow velocity of Wushan River stayed above 0.02 m/s, and the water velocity was guaranteed, and the hydrodynamic effect was good.
The monitoring section of Baihu Ting River Basin in the abundant water period showed a southward flow characteristic, and the maximum flow rate of Case II reached 0.14 m/s by comparison, and the average flow rate reached 0.05 m/s or more, so the hydrodynamic effect was also more significant. The maximum flow rate of Longjin Leapfrog Connecting River reached 0.24 m/s, and the usual flow rate was mostly maintained above 0.05 m/s. In the dry water period, the flow of Baihu Ting River was basically toward the south, in which the highest flow rate of Case II was about 0.24 m/s, while the average flow rate was mostly above 0.05 m/s. The maximum flow rate of Longjin Leapfrog Connecting River reached 0.16 m/s, and the usual flow rate was basically kept above 0.04 m/s. The results all show that the scheduling of this condition is more effective, and the effect of flow rate enhancement is obvious. The flow rates are shown in Figure 7 and Figure 8.

3.3. Working Conditions After River Connectivity

When the river was connected, the passage of water became smoother and was no longer limited by the original geographical constraints. At this stage, the dispatch program combined both natural diversions and power lifts for examination.
  • On the combination of natural water diversion and powered water lifting:
Natural diversions continued to serve their purpose, utilizing topographic elevations and hydrologic conditions to allow water to flow naturally.
Power lifting complemented this by providing additional power through pumps and other facilities to further accelerate the flow of water. Thus, on top of the natural diversion of water, the effect of powered lifting resulted in a 25% increase in the overall water flow rate. This means that the water in the river was renewed faster and its self-purification capacity was enhanced.
2.
Improvements regarding channel scour and siltation:
Prior to the river connection, the riverbanks were susceptible to scouring by the water flow due to the instability of the water flow, leading to problems such as erosion of the riverbanks and siltation of the river channel.
After the river was connected, through fine scheduling, we succeeded in stabilizing the water flow and reducing its scouring efforts on the riverbanks. This not only protected the riverbanks, but also helped maintain the stable form of the river.
Through the dredging measures in the scheduling program, we further reduced siltation in the river and ensured that the river was clear. As a result, the fluency of the river increased by 30%.
The working conditions after the river was connected showed the maximum effect of the scheduling program. The combination of natural diversion and powered lifting not only significantly increased the velocity of water flow, but also effectively protected the riverbanks, reduced siltation, and ensured that the river remains open. These results provide a solid guarantee for the sustainability and long-term health of the city.

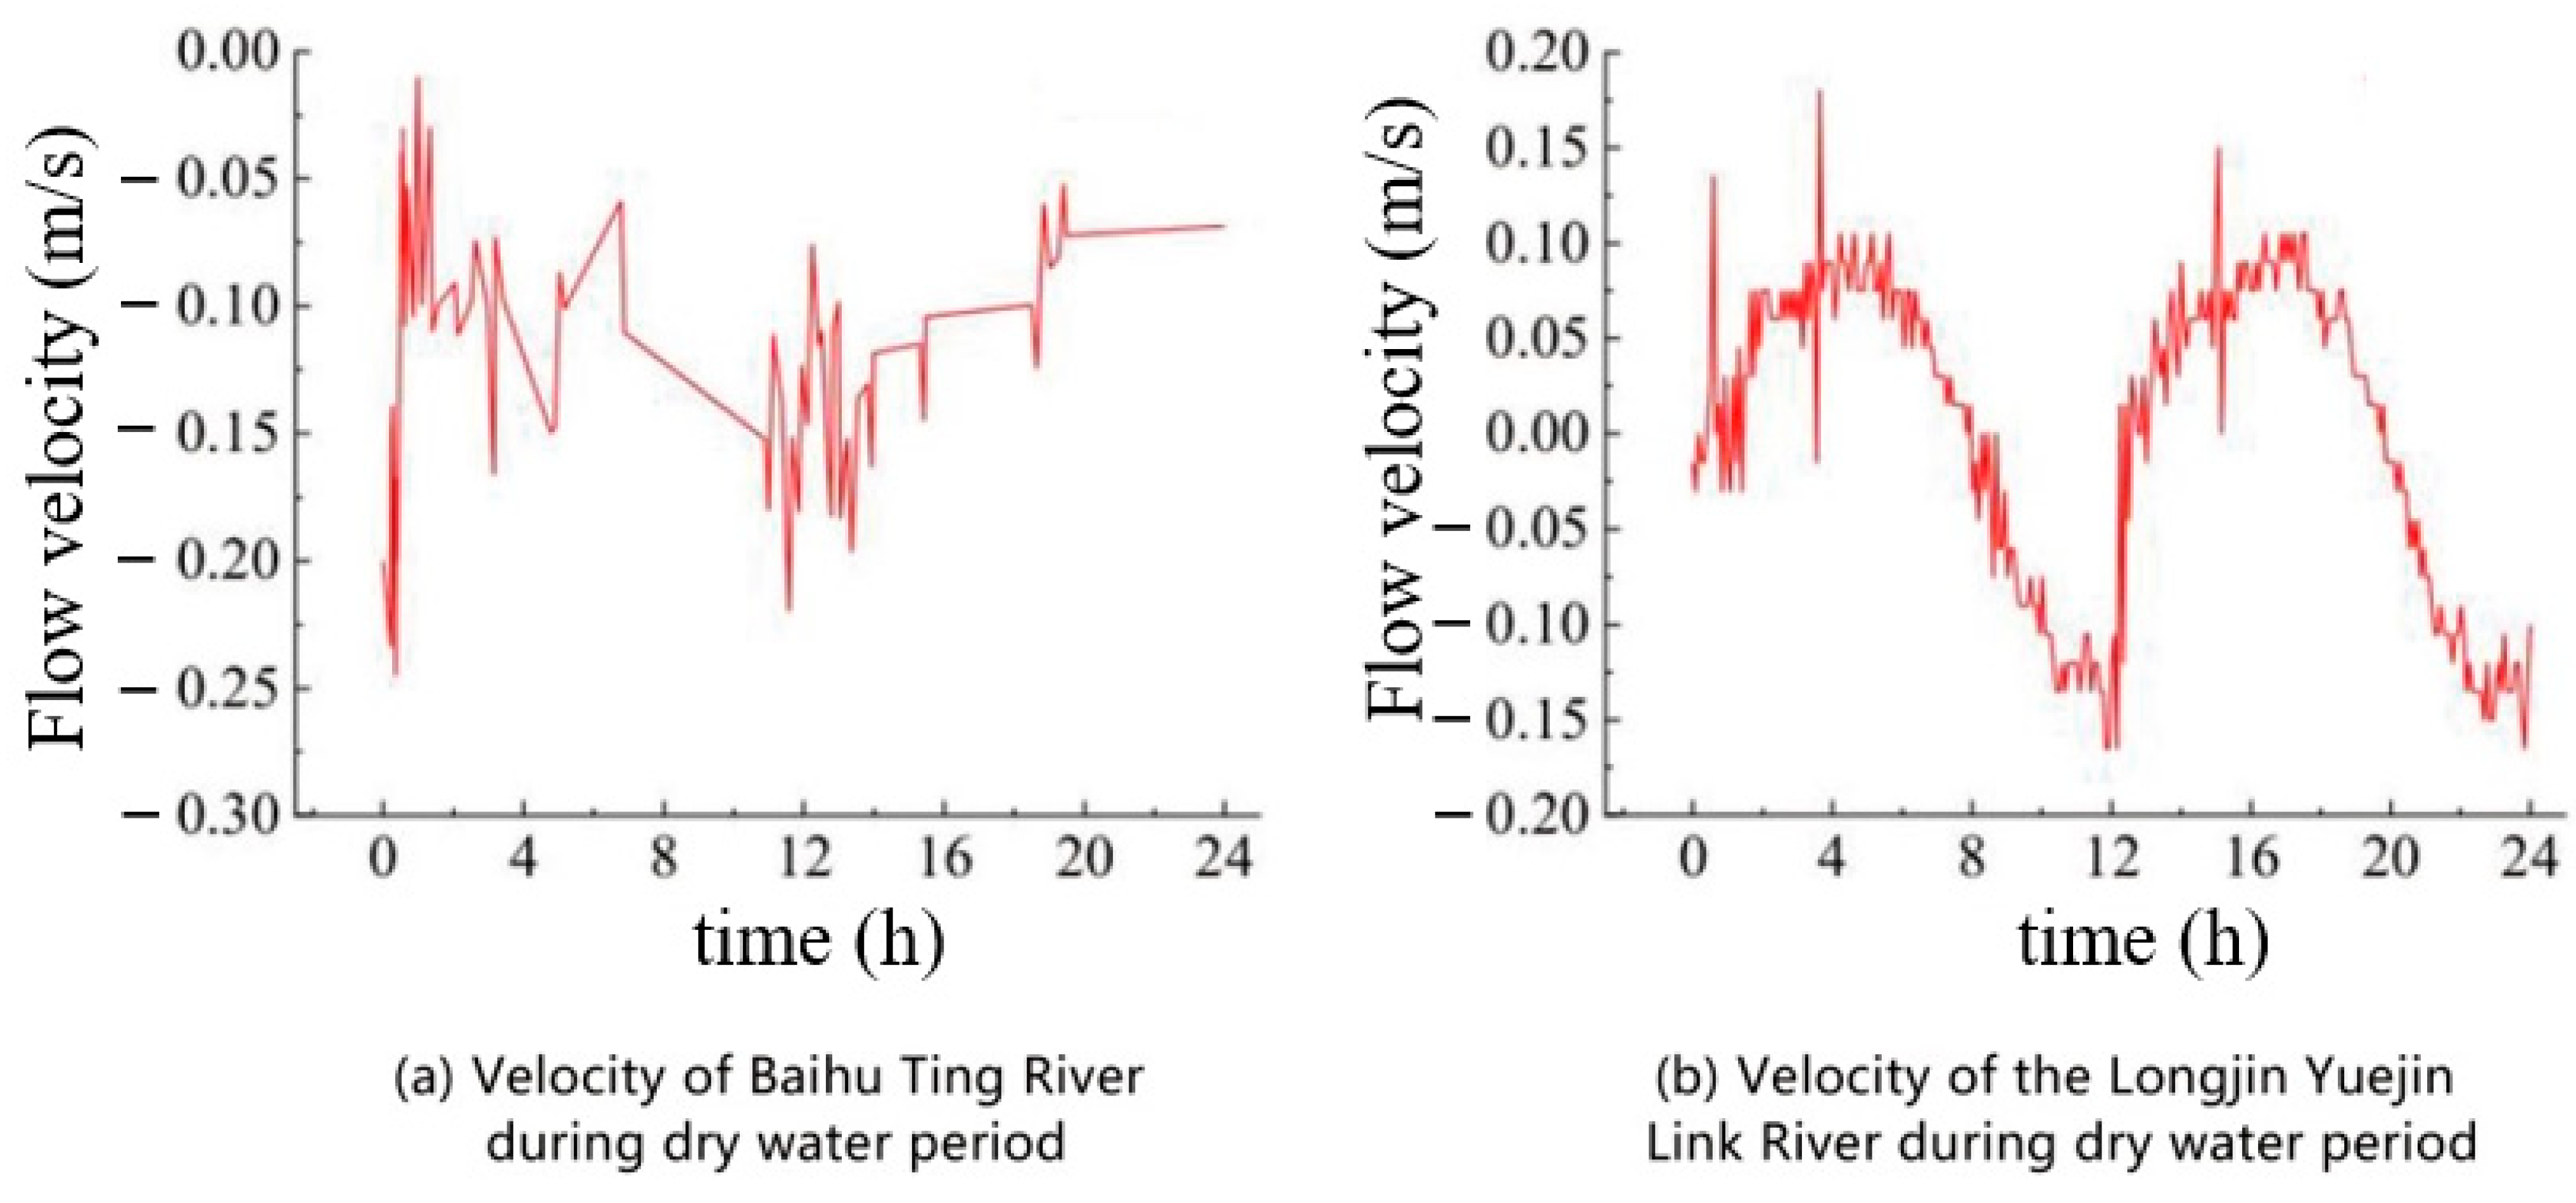
3.4. Comparative Analysis

When we compare the working conditions before and after the river connection, the differences and progress between the two can be clearly observed.
  • In terms of increased water flow rate:
Prior to the river connection, the scheduling program relied heavily on natural diversions, which resulted in a relatively small increase in water flow rate of only 15% due to the constraints of the river.
In contrast, after the river was connected, the combination of the natural diversion and power lift scheduling scheme resulted in a significant increase in the velocity of the water flow, which reached 25%. This indicates that the scheduling scheme after river connection is more effective and can fully utilize the advantages of power lifting to promote the acceleration of water flow.
2.
In terms of the narrowing of the difference in water levels:
Prior to river connectivity, water level differences were high due to the lack of effective scheduling tools and river connectivity, but after scheduling, water level differences were reduced by 20%.
After the river was connected, the further reduction in water level differences were greater than before the connection because the entire river system was more fluid and had more means of dispatch.
3.
On the role of powered water lifting:
Prior to the river connection, the main reliance was on natural water diversion and the application of powered water lifting was limited.
Once the river was connected, the power lift became an important addition to the scheduling program. It further enhanced the speed of water flow and the smoothness of the river channel on the basis of natural water diversion. Through power lifting, we could actively regulate the water flow to ensure that the water in the river channel flows quickly and avoid stagnation and siltation in localized areas.
Through comparative analysis, we can clearly see that the scheduling scheme after the river connection was significantly better than before the river connection in terms of effectiveness. The combination of power lifting and natural water diversion brought greater flexibility and effectiveness to river management, ensuring the health of the river and the sustainable development of the city.
Ecological scheduling programs have significant effects on river management. Both before and after the river is connected, the scheduling program can significantly improve the water flow situation. Especially after the river is connected, the combination of natural water diversion and power lifting scheduling shows greater advantages.
This combination of scheduling methods can significantly increase the speed of water flow. Power lifting in the natural diversion of water increases the impetus of the water flow so that the overall speed of the water flow increases significantly, thus enhancing the self-purification ability of the river and improving the quality of water.
At the same time, the dispatching scheme also helps to reduce water level differences. By optimizing the scheduling parameters and operation methods, the water flow is distributed more evenly, reducing water level differences between different regions, effectively preventing local water levels from being too high or too low, and reducing the risk of floods or droughts.
In addition, the scheduling program can also reduce riverbank scouring and siltation. By adjusting the speed and direction of water flow, it avoids strong scouring of riverbanks by water flow, and at the same time, combined with siltation measures, it effectively reduces siltation in the river channel and maintains the smoothness and stability of the river channel.
Therefore, the ecological scheduling scheme combining natural water diversion and powered water lifting after river connectivity provides strong support for urban water resource management and improvement. In future work, we can further improve and optimize this scheduling scheme to adapt to the river management needs of different cities and regions, to promote the sustainable development of the city, and to build a healthier and more livable environment.
Based on the current situation, effective measures have been taken to improve the rivers with insufficient water flow. Based on the study in the previous section, the optimal scheduling scheme was proposed and applied to the simulation after the water system was connected. After the improvement of Yangqi River, Gangtou River sluice, and Longjin Leapfrog Connected River, the dispatching effect of the river network can be assessed more accurately, especially in terms of water quality.
(1)
Self-flowing diversion scheduling program
A model including 647 rivers, 568 river nodes, 7 through-river outfalls, and 7 inland river outfalls was selected for simulation during the abundant and dry periods. Ammonia nitrogen was selected as an indicator, and the initial concentration of ammonia nitrogen in the river network was set to 10 mg/L, and the calculation duration was 7 days. Other model settings were the same as before the water system connection.
(2)
Power Lift Dispatch Program
Based on Table 1, it can be seen that the working conditions for the power lift dispatch are fully consistent with the water system connection requirements. All river gates had been closed and the remaining facilities were consistent with the self-flowing diversion scheduling program after the water system was connected.
(3)
Analysis of water system connectivity options
  • Natural Mobility Program
After analyzing the water system connectivity, the best results can be achieved by using the artesian diversion scheduling scheme.
Before the optimization of the water harvesting period, it took 1 day and 23 h to restore the water quality of Ma Chau River to the Class IV standard; after optimization, it was shortened to 1 day and 5 h. The Wushan River required 2 days and 4 h to return to the Class IV standard before optimization, which was shortened to 1 day and 4 h after optimization. During the dry period, the time required for the Ma Chau River to recover to the Class IV standard was reduced from 2 days before optimization to 18 h after optimization, and the Wushan River was reduced from 2 days and 1 h before optimization to 1 day and 3 h after optimization. The results of the optimization can be seen in Figure 9, Figure 10, Figure 11 and Figure 12.
It can be seen that after the comprehensive treatment of Ma Chau River and Wushan River through the adoption of appropriate measures, the time for water quality improvement has been significantly shortened, indicating the effectiveness of the comprehensive treatment.
  • 2.
    Analysis of power lift scheduling program after water system connection
During the optimization of the power lifting of Ma Zhou River during the abundant water period, the ammonia nitrogen concentration was reduced from 1 day and 23 h to recover to the Class IV water standard to 1 day and 15 h after the optimization was completed. Before the optimization of power lifting, the ammonia concentration in Wushan River during the abundant water period needed 2 days and 4 h to recover to the Class IV standard, but after the optimization, this time was shortened to 1 day and 19 h, and this change can be seen in Figure 13 and Figure 14.

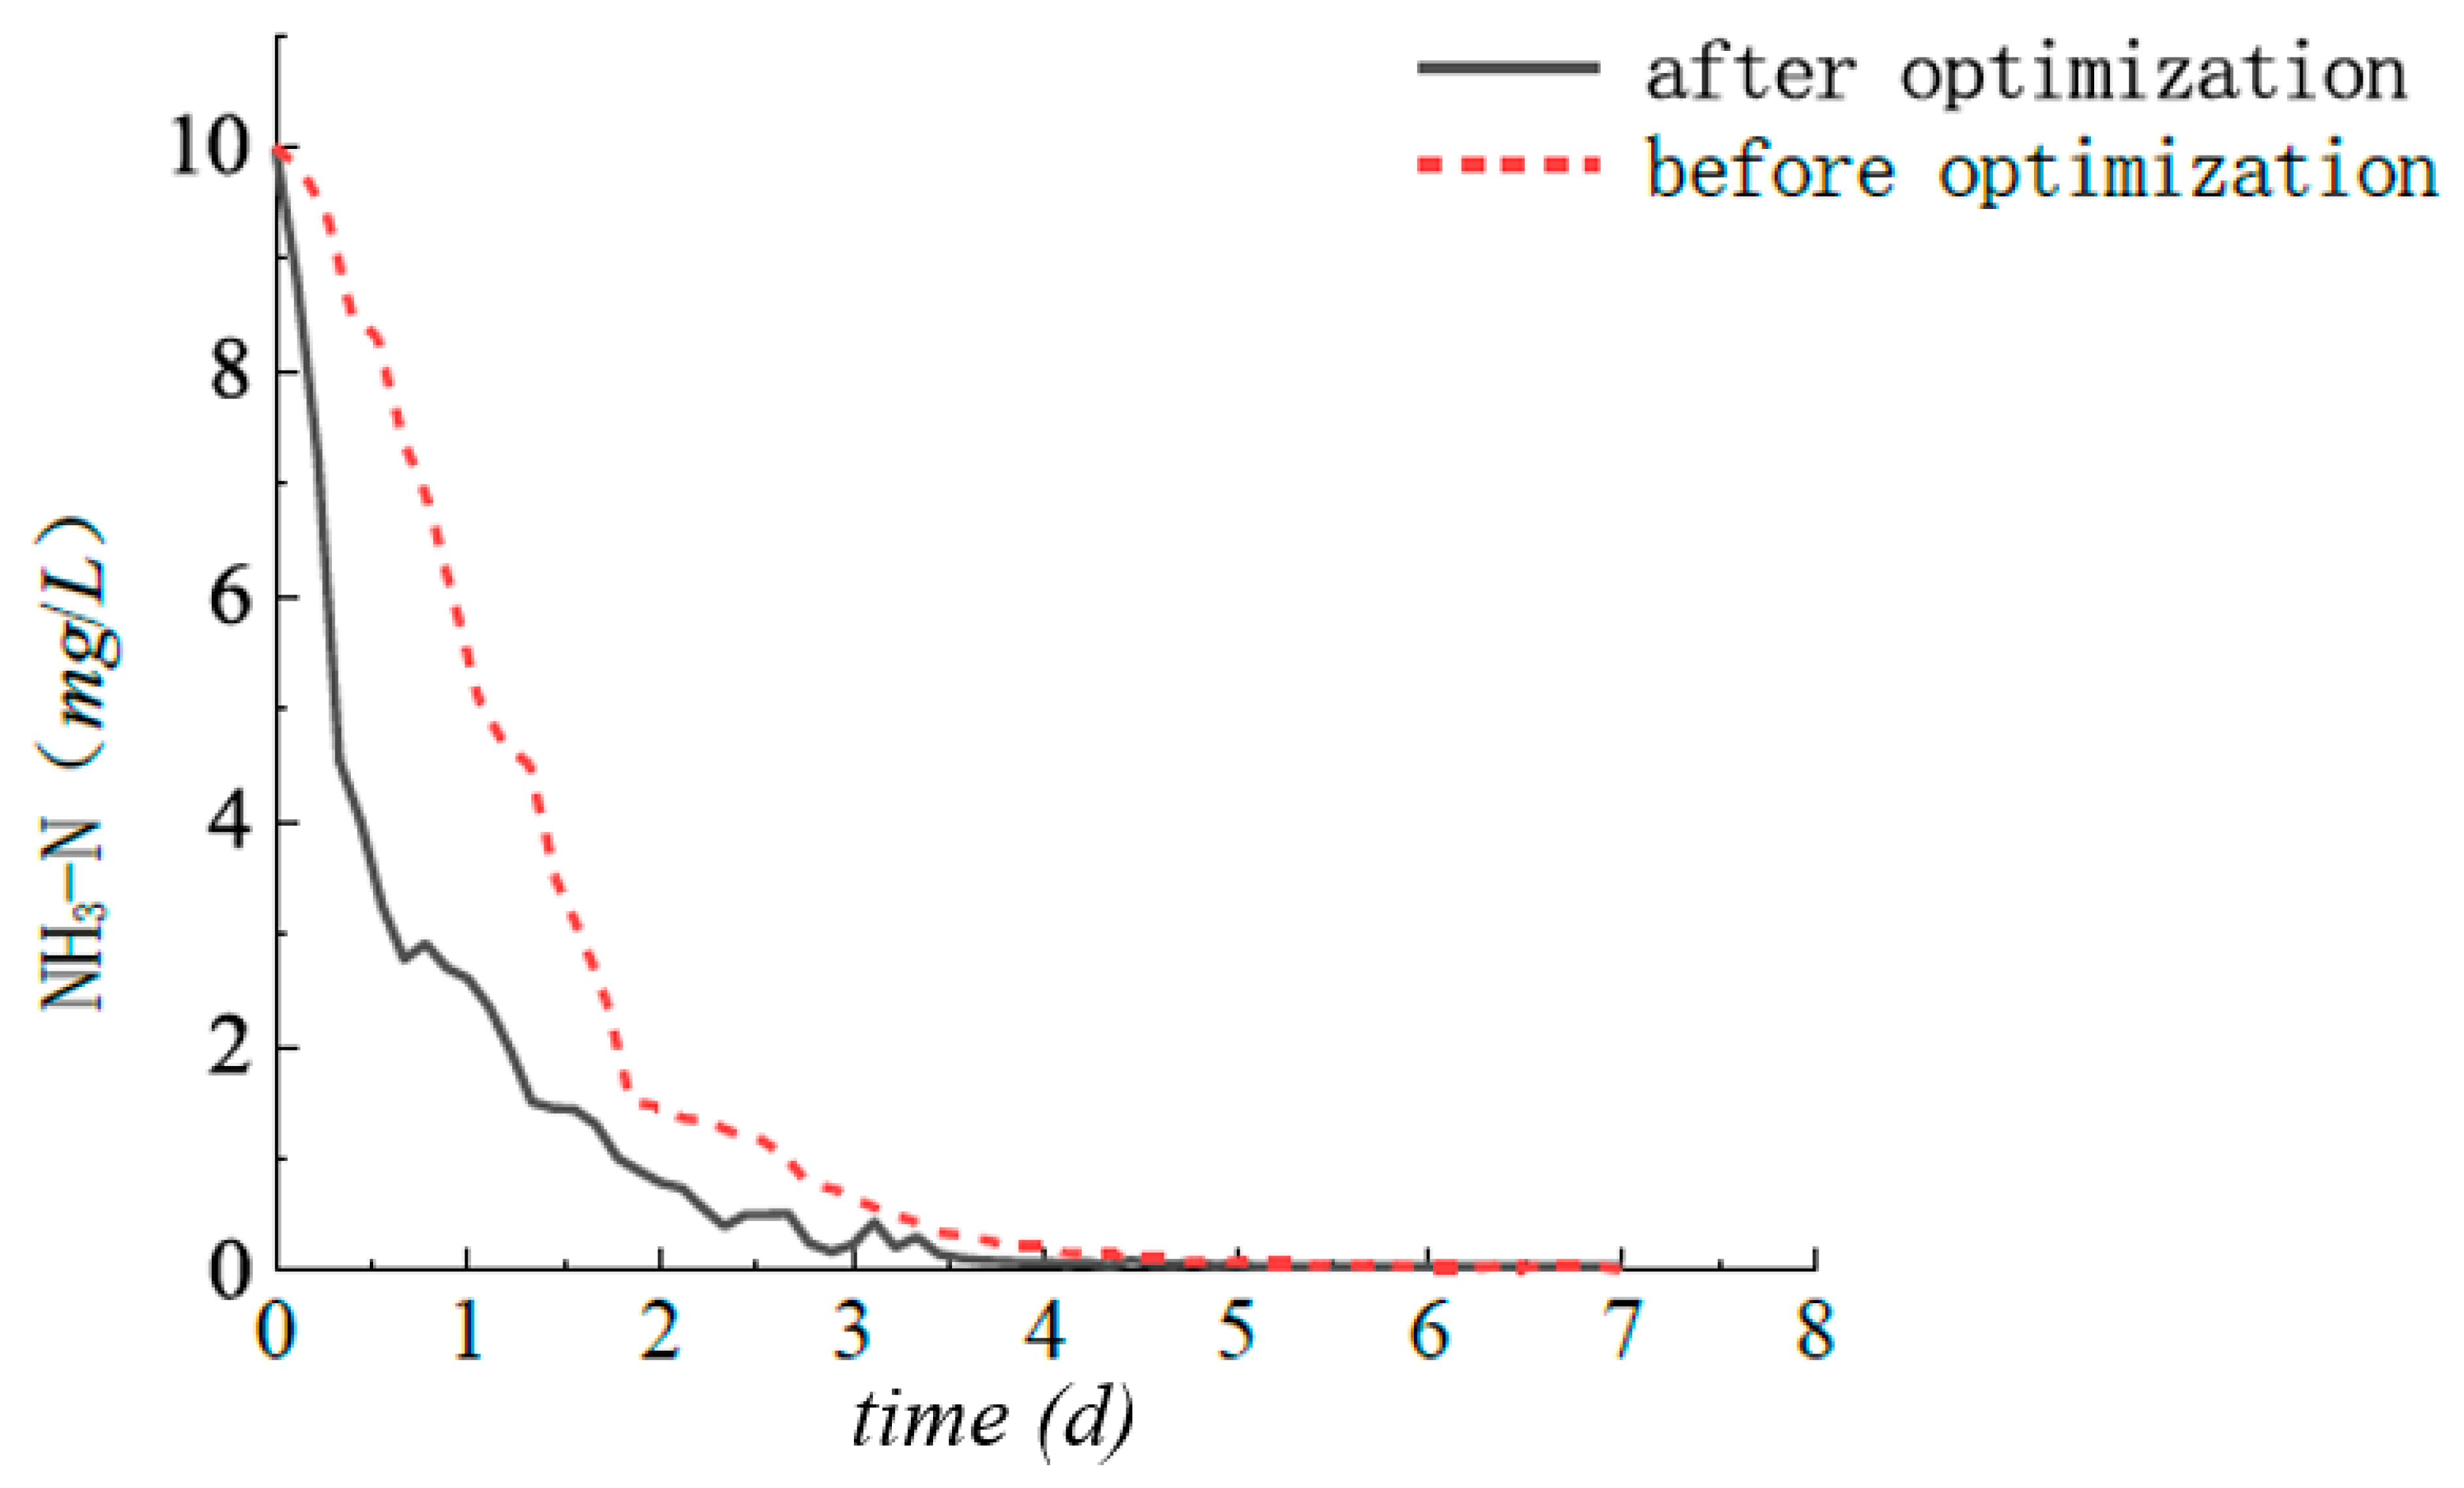
3.5. Comparative Analysis of Hydrodynamic Improvements in Urban Water Management

To further validate the hydrodynamic improvements observed in our study, we compared our findings with the existing literature. Notably, research by [35] provides key insights into the impact of urban water system connectivity on hydrodynamic conditions. This study, using the SWMM, demonstrated that water system connection projects resulted in a significant increase in initial flow rate and velocity, with a maximum water exchange capacity increase of 115.6%. These results are similar to our findings, where post-connection we observed a 25% increase in overall water flow rates and a 15% improvement attributable to ecological scheduling.
However, beyond these results, our study integrates an ecological dispatch strategy that optimizes sluice gate activities, pump management, and river morphology adjustments. These strategies led to reduced water levels and extended flood durations, indicating significant enhancements to flood control and water quality management. The integration of ecological scheduling strategies further underscores the need for long-term flow management and system resilience, an area for further exploration.
Moreover, another study in Runan County, Zhumadian, China, provided a 30% increase in river flows and reductions in peak flow rates (6.6% and 4.96% for P = 10 a and P = 20 a, respectively) after urban water system connectivity [36]. These findings resonate with the improvements in our study area, demonstrating the broad applicability of SWMM-based ecological solutions for sustainable urban water resource management.
It is important to note that our model predictions were validated against historical data from the Longjin Yangqi area, including recorded rainfall, runoff, and flood events. These observations matched the model’s predicted increases in flow rate and reductions in peak water levels, thereby substantiating the results and ensuring the model’s accuracy.

4. Conclusions

By simulating and analyzing the hydrological characteristics of the Longjin Yangqi area in Cangshan, this study proposes a targeted remediation scheme. The scheme mainly includes measures to improve river morphology, optimize sluice gate settings, and adjust pump operation.
Measures to improve the morphology of the river channel include widening the channel and deepening the riverbed to increase the overflow capacity of the channel, lower the water level, and reduce flooding disasters. Measures to optimize the setting of sluice gates include adjusting the opening height and time of sluice gates to achieve better water flow regulation. Measures to adjust the operation of water pumps include adjusting the opening time and flow rate of water pumps to improve the self-purification ability of water bodies. The effects of the ecological dispatching scheme were evaluated through simulation and prediction. The results show that hydrodynamics can be effectively enhanced and improved by improving the river morphology, optimizing the sluice gate settings, and adjusting the pump operation. Specifically, improving the river channel morphology can increase the overflow capacity of the river, lower the water level, and reduce the occurrence of flood disasters; optimizing the sluice gate settings can regulate the water flow and reduce the scouring and siltation of the river by the water flow; and adjusting the operation of the water pumps can increase the velocity of the water flow in the river and improve the self-purification ability of the water body.
This study is of great significance for realizing the sustainable development of the city and building a better ecological environment. Through the implementation of the remediation program, it can effectively improve the quality of the Longjin Yangqi area in Cangshan and create a more livable environment for local residents.
The innovation of this paper is to apply the SWMM to the water resource management in the Longjin Yangqi area in Kuanshan and to propose a targeted ecological scheduling scheme. Through simulation and analysis, the feasibility and effectiveness of the scheme are demonstrated, providing important decision support for water resource management and improvement in the area. In addition, this paper also carries out an in-depth discussion and research on the application of the SWMM in urban water resource management. By adjusting and optimizing the parameters of the model, it can be better adapted to the water resource management needs of different cities and regions and provide more possibilities and options for the sustainable development and improvement of cities.
By using SWMM software version 5, we developed a mathematical model to study the scheduling of the river network. After comparison, we found that different dispatching schemes can significantly improve the hydrodynamics and water quality of the river network. In the case of the artesian diversion scheduling scheme, the Yangqi recharge pumping station is an ideal choice to effectively control the water level; during the abundant water period, the Yangqi sluice gate is used as a diversion tool, whereas in the dry water period, it will be closed, but its outflow sluice gate and the Hongtou pumping station still play an important role in draining the water; in the abundant water period and the dry season, the Yangqi River is used to divert the water, whereas the Yixuu recharge pumping station and the Jhuolan River steel dam sluice gate are used for drainage. With the adoption of power water lifting technology, the pumping stations at Longjin Yuejin Connecting River and Gangtou pumping station can output 6 m3/s of water per second, while Yangqi pumping station can output 18 m3/s of water, and the pumping stations at Baihu Ting integrated pumping station and Yixu replenishment pumping station can output 8 m3/s of water, which can effectively alleviate the water resources tension in the study area and greatly improve the situation of water resources shortage. After the water system connectivity improvement, the river network, which was originally affected by the lack of hydrodynamics, has been greatly improved, the flow rate of the cross section has been greatly improved, and the concentration of pollutants has been rapidly reduced, which significantly improves the hydrodynamics and water quality of the river network.
In summary, the research in this paper not only enriches the type of research on urban water management, but also provides new ideas and methods for sustainable development and the improvement of cities.

Author Contributions

Investigation, W.Z. and W.L. Conceptualization, W.Z. and W.L.; methodology, W.Z. and W.L.; software, W.Z. and W.L.; validation, W.Z. and W.L.; formal analysis, W.Z. and W.L.; resources, W.Z. and W.L.; data curation, W.Z. and W.L.; writing—original draft preparation, W.Z. and W.L.; writing—review and editing, W.Z. and W.L.; visualization, W.Z. and W.L.; supervision, W.L.; project administration, W.L.; funding acquisition, W.L. All authors have read and agreed to the published version of the manuscript.

Funding

This research received no external funding.

Data Availability Statement

All data generated or analyzed during this study are included in this published article.

Conflicts of Interest

The authors declare no conflict of interest.

References

  1. Zhang, K.; Li, Y.; Yu, Z.; Yang, T.; Xu, J.; Chao, L.; Ni, J.; Wang, L.; Gao, Y.; Hu, Y. Xin’anjiang nested experimental watershed (XAJ-NEW) for understanding multiscale water cycle: Scientific objectives and experimental design. Engineering 2022, 18, 207–217. [Google Scholar] [CrossRef]
  2. Zhou, G.; Xu, J.; Hu, H.; Liu, Z.; Zhang, H.; Xu, C.; Zhou, X.; Yang, J.; Nong, X.; Song, B. Off-axis four-reflection optical structure for lightweight single-band bathymetric LiDAR. IEEE Trans. Geosci. Remote Sens. 2023, 61, 1000917. [Google Scholar] [CrossRef]
  3. Wei, W.; Gong, J.; Deng, J.; Xu, W. Effects of air vent size and location design on air supply efficiency in flood discharge tunnel operations. J. Hydraul. Eng. 2023, 149, 04023050. [Google Scholar] [CrossRef]
  4. Fatemi, S.A.Z.; Zgham, W.; Shirzad, S.; Serat, Z. Feasibility Study of Theoretical Efficiency Calculation for Flat Plate Collectors in Solar Water Heating Systems. Arch. Adv. Eng. Sci. 2023, 2, 1–12. [Google Scholar] [CrossRef]
  5. Hamoule, T.; Mohammadi, N.; Mousazadeh, B.; Fakhari, H. Simultaneous improvement of water stability and performance of HKUST-1 for fast cadmium removal from the water environment: Synthesis, characterization, RSM optimization, thermodynamics and kinetics. Int. J. Environ. Sci. Technol. 2023, 20, 11913–11930. [Google Scholar] [CrossRef]
  6. Liu, C.; Shan, Y.; He, L.; Li, F.; Liu, X.; Nepf, H. Plant morphology impacts bedload sediment transport. Geophys. Res. Lett. 2024, 51, e2024GL108800. [Google Scholar] [CrossRef]
  7. He, L.; Shan, Y.-q.; Liu, C.; Cao, H.; Liu, X.-n.; Guo, Y. Prediction of bedload transport inside vegetation canopies with natural morphology. J. Hydrodyn. 2024, 36, 556–569. [Google Scholar] [CrossRef]
  8. Zhao, Y.; Li, J.; Tian, Y.; Li, J. Distinguish Extreme Precipitation Mechanisms Associated with Atmospheric River and Non-Atmospheric River in the Lower Yangtze River Basin. J. Clim. 2024, 37, 3995–4010. [Google Scholar] [CrossRef]
  9. Ye, X.; Zhu, H.-H.; Chang, F.-N.; Xie, T.-C.; Tian, F.; Zhang, W.; Catani, F. Revisiting spatiotemporal evolution process and mechanism of a giant reservoir landslide during weather extremes. Eng. Geol. 2024, 332, 107480. [Google Scholar] [CrossRef]
  10. Schwaninger, M. Intelligent organizations: An integrative framework. Syst. Res. Behav. Sci. Off. J. Int. Fed. Syst. Res. 2001, 18, 137–158. [Google Scholar] [CrossRef]
  11. Zhou, G.; Lin, G.; Liu, Z.; Zhou, X.; Li, W.; Li, X.; Deng, R. An optical system for suppression of laser echo energy from the water surface on single-band bathymetric LiDAR. Opt. Lasers Eng. 2023, 163, 107468. [Google Scholar] [CrossRef]
  12. Wei, W.; Xu, W.; Deng, J.; Guo, Y. Self-aeration development and fully cross-sectional air diffusion in high-speed open channel flows. J. Hydraul. Res. 2022, 60, 445–459. [Google Scholar] [CrossRef]
  13. Solyali, D.; Mollaei, A. A simulation model based on experimental data to determine the optimal tilt angle for a fixed photovoltaic panel. Arch. Adv. Eng. Sci. 2023, 2, 1–11. [Google Scholar]
  14. Belaineh, G.; Peralta, R.C.; Hughes, T.C. Simulation/optimization modeling for water resources management. J. Water Resour. Plan. Manag. 1999, 125, 154–161. [Google Scholar] [CrossRef]
  15. Du, Q.; Luo, G.; Wang, X.; Wang, T.; Fu, G.; Lu, C. Fast optimization method of flexible support structure based on mathematical model. Arch. Adv. Eng. Sci. 2024, 2, 142–149. [Google Scholar] [CrossRef]
  16. Di, D.; Li, T.; Fang, H.; Xiao, L.; Du, X.; Sun, B.; Zhang, J.; Wang, N.; Li, B. A CFD-DEM investigation into hydraulic transport and retardation response characteristics of drainage pipeline siltation using intelligent model. Tunn. Undergr. Space Technol. 2024, 152, 105964. [Google Scholar] [CrossRef]
  17. Brochero, D. Hydroinformatics and Diversity in Hydrological Ensemble Prediction Systems. Ph.D. Thesis, University Laval, Quebec City, QC, Canada, 2013. [Google Scholar]
  18. Sun, Q.; Chen, J.; Zhou, L.; Ding, S.; Han, S. A study on ice resistance prediction based on deep learning data generation method. Ocean Eng. 2024, 301, 117467. [Google Scholar] [CrossRef]
  19. Zhou, L.; Sun, Q.; Ding, S.; Han, S.; Wang, A. A machine-learning-based method for ship propulsion power prediction in ice. J. Mar. Sci. Eng. 2023, 11, 1381. [Google Scholar] [CrossRef]
  20. Zhou, G.; Tang, Y.; Zhang, W.; Liu, W.; Jiang, Y.; Gao, E.; Zhu, Q.; Bai, Y. Shadow Detection on High-Resolution Digital Orthophoto Map (DOM) using Semantic Matching. IEEE Trans. Geosci. Remote Sens. 2023, 61, 4504420. [Google Scholar]
  21. Gong, S. An Advanced Approach to Assessing Flood Risk in Urban Environments. Ph.D. Thesis, University of Technology Sydney, Sydney, Australia, 2024. [Google Scholar]
  22. Bai, Y.; Zhao, N.; Zhang, R.; Zeng, X. Storm water management of low impact development in urban areas based on SWMM. Water 2018, 11, 33. [Google Scholar] [CrossRef]
  23. Leitão, J.; Cardoso, A.; Marques, J.A.; Simões, N. Flood Management in Urban Drainage-Contributions for the Control of Water Drainage Systems using Underground Barriers. In Proceedings of the 2017 4th Experiment@International Conference, Faro, Portugal, 6–8 June 2017. [Google Scholar]
  24. Goharian, E.; Burian, S.J. Developing an integrated framework to build a decision support tool for urban water management. J. Hydroinformatics 2018, 20, 708–727. [Google Scholar] [CrossRef]
  25. McKinney, D.C. Modeling Water Resources Management at the Basin Level: Review and Future Directions; IWMI: Colombo, Sri Lanka, 1999. [Google Scholar]
  26. Deng, W.; Jiang, Z.; Zhang, S.; Ren, P.; Zhang, H.; Wang, Z. Dynamic Identification and Evolution of Urban-suburban-rural Transition Zones Based on the Blender of Natural and Humanistic Factors: A Case Study of Chengdu, China. Chin. Geogr. Sci. 2024, 34, 791–809. [Google Scholar] [CrossRef]
  27. Kavzoglu, T. Increasing the accuracy of neural network classification using refined training data. Environ. Model. Softw. 2009, 24, 850–858. [Google Scholar] [CrossRef]
  28. Zeng, Z.; Yuan, X.; Liang, J.; Li, Y. Designing and implementing an SWMM-based web service framework to provide decision support for real-time urban stormwater management. Environ. Model. Softw. 2021, 135, 104887. [Google Scholar] [CrossRef]
  29. Mohamoud, Y.; Parmar, R.; Wolfe, K. Modeling best management practices (BMPs) with HSPF. In Watershed Management 2010: Innovations in Watershed Management Under Land Use and Climate Change; ASCE: Reston, VA, USA, 2010; pp. 892–898. [Google Scholar]
  30. Poleto, C.; Tassi, R. Sustainable urban drainage systems. In Drainage Systems; IntechOpen: Rijeka, Croatia, 2012; pp. 55–72. [Google Scholar]
  31. House, M.; Ellis, J.; Herricks, E.; Hvitved-Jacobsen, T.; Seager, J.; Lijklema, L.; Aalderink, H.; Clifforde, I. Urban drainage-impacts on receiving water quality. Water Sci. Technol. 1993, 27, 117. [Google Scholar] [CrossRef]
  32. Zölch, T.; Henze, L.; Keilholz, P.; Pauleit, S. Regulating urban surface runoff through nature-based solutions–An assessment at the micro-scale. Environ. Res. 2017, 157, 135–144. [Google Scholar] [CrossRef]
  33. Zhou, Q. A review of sustainable urban drainage systems considering the climate change and urbanization impacts. Water 2014, 6, 976–992. [Google Scholar] [CrossRef]
  34. Niemczynowicz, J. Urban hydrology and water management–present and future challenges. Urban Water 1999, 1, 1–14. [Google Scholar] [CrossRef]
  35. Zhang, X.; Wang, K.; Wang, T. SWMM-based assessment of the improvement of hydrodynamic conditions of urban water system connectivity. Water Resour. Manag. 2021, 35, 4519–4534. [Google Scholar] [CrossRef]
  36. Zhang, X.; Qiao, W.; Huang, J.; Li, H.; Wang, X. Impact and analysis of urban water system connectivity project on regional water environment based on Storm Water Management Model (SWMM). J. Clean. Prod. 2023, 423, 138840. [Google Scholar] [CrossRef]
Figure 1. Overview of the study area.
Water 16 03336 g001
Figure 2. Flow chart of water quality optimization function.
Water 16 03336 g002
Figure 3. High and low tidal variability in 2021.
Water 16 03336 g003
Figure 4. Schematic diagram of the scheduling process in the Yangqi area.
Water 16 03336 g004
Figure 5. Flow velocity of the Mazhou and Wushan Rivers during periods of high water abundance.
Water 16 03336 g005
Figure 6. Flow velocity of Mazhou River and Wushan River during dry water period.
Water 16 03336 g006
Figure 7. Flow velocity of Baihu Ting River and Longjin Leapfrog Connected River during abundant water period.
Water 16 03336 g007
Figure 8. Flow velocity of Baihu Ting River and Longjin Leapfrog Connecting River during dry water period.
Water 16 03336 g008
Figure 9. Changes in ammonia nitrogen concentrations in the Mazhou River after optimization of the abundance period.
Water 16 03336 g009
Figure 10. Changes in ammonia nitrogen concentration after optimization of abundant water in Wushan River.
Water 16 03336 g010
Figure 11. Changes in ammonia nitrogen concentration in the Mazhou River after dry period optimization.
Water 16 03336 g011
Figure 12. Changes in ammonia nitrogen concentrations before and after dry period optimization in the Wushan River.
Water 16 03336 g012
Figure 13. Changes in ammonia nitrogen Concentrations after remediation of the Ma Chau River monitoring section.
Water 16 03336 g013
Figure 14. Changes in concentration of ammonia nitrogen at the monitoring section of Wushan River.
Water 16 03336 g014
Table 1. Yangqi River and Gangtou River Power Lift Dispatch Scheme.
Pumping StationLead-In MethodDesign Flow Rate of
Pumping Station (m3/s)
Gangtou Pumping StationSewerage6
Yangqi Pumping StationDraw water
(for irrigation)
18
Baihu Pavilion Integrated
Pumping Station
Sewerage8
Yixing Recharge Pumping
Station
Sewerage8
Disclaimer/Publisher’s Note: The statements, opinions and data contained in all publications are solely those of the individual author(s) and contributor(s) and not of MDPI and/or the editor(s). MDPI and/or the editor(s) disclaim responsibility for any injury to people or property resulting from any ideas, methods, instructions or products referred to in the content.

