Article

Refinement and Validation of the SPEcies at Risk Index for Metals (SPEARmetal Index) for Assessing Ecological Impacts of Metal Contamination in the Nakdong River, South Korea

EH Research & Consulting Co., Ltd., E TechHive, 410 Jeongseojin-ro, Seo-gu, Incheon 22689, Republic of Korea
*
Author to whom correspondence should be addressed.
Water 2024, 16(22), 3308; https://doi.org/10.3390/w16223308
Submission received: 4 October 2024 / Revised: 13 November 2024 / Accepted: 14 November 2024 / Published: 18 November 2024
(This article belongs to the Section Water Quality and Contamination)

Abstract

:
The SPEcies At Risk index for metals ( SPEAR m e t a l index) was refined using updated physiological sensitivity data and validated to assess the ecological impact of metal contamination on benthic macroinvertebrate communities in the upper Nakdong River, near a Zn smelter in Korea. Biosurvey and chemical monitoring data were collected at 18 sites surrounding the smelter and nearby mines. Acute ecotoxicity tests on 20 indigenous species from the Korean peninsula were conducted and used to update taxon-specific metal sensitivity data. The refined SPEAR m e t a l index, based on this updated sensitivity, was significantly lower than previous versions, with most values below the severe impact threshold (0.5) in the main stream. The correlation between hazard quotients in water and the SPEAR index improved, with the correlation coefficient increasing from 0.63 to 0.70. Despite consistently high benthic macroinvertebrate indices (BMIs) across the study area, generic ecological indices, such as total richness, EPT (Ephemeroptera, Plecoptera, and Trichoptera taxa richness), and Shannon’s diversity index, showed correlations with metal contamination levels. Principal component analysis identified the SPEAR m e t a l index as the primary indicator associated with metal contamination in both water and sediment. These findings highlight the improved performance of the refined SPEAR m e t a l index as a more sensitive and specific tool for assessing the ecological status of metal-impacted aquatic ecosystems compared to traditional indices.

1. Introduction

Metal contamination in aquatic ecosystems poses significant challenges to ecological health, necessitating the development and application of comprehensive assessment methods. Ecological risk assessments at a metal-contaminated site typically involve three complementary approaches: prospective assessments, ongoing ecotoxicological monitoring, and bioassessment [1,2,3]. Prospective assessments, utilizing chemical monitoring data, predict potential risks, while ecotoxicological monitoring evaluates the current status of aquatic ecosystems. Bioassessments, conducted in the field using ecological bioindicators, are essential for confirming the actual ecological impact of metals based on causal associations [4].
The integration of these approaches provides a more comprehensive understanding of metal contamination effects by incorporating multiple lines of evidence. This integrated framework aids in diagnosing chemical, ecotoxicological, and ecological conditions, offering a holistic view of environmental health. Moreover, it is particularly valuable in identifying key toxicants and stressors that may not be apparent through predictive models or current monitoring alone [5].
Traditionally, ecological indices such as species diversity and richness have been widely employed as general indicators of ecological status. However, these indices assume that all species contribute equally to the ecological system based solely on their presence/absence and abundance [6]. This assumption may lead to an oversimplification of complex ecological dynamics and potentially obscure the specific impacts of environmental stressors [7].
To address these limitations, more sophisticated trait-based bioindicators have been developed. The SPEcies At Risk (SPEAR) index represents a significant advancement in this field [8,9,10]. The SPEAR index integrates trait information, such as physiological sensitivity, into community structure data, allowing for a more nuanced understanding of ecosystem health, particularly in relation to pesticide and metal contamination.
Another example of a trait-based index is the Benthic Macroinvertebrate Index (BMI), which includes measures such as the Biological Monitoring Working Party (BMWP) [11] and the Korean Benthic macroinvertebrate Index of Biological Integrity (KB-IBI) [12,13]. These indices incorporate trait information on tolerance against biological oxygen demand, providing insights into organic matter pollution and low dissolved oxygen levels in aquatic ecosystems.
The incorporation of trait information in these indices represents a significant improvement over traditional metrics. By considering species-specific characteristics and sensitivities, these advanced bioindicators enable the identification of key stressors responsible for diagnosed ecological impacts [8,14]. This trait-based approach provides a more comprehensive and accurate assessment of ecosystem health, allowing for more effective environmental management and conservation strategies.
Despite these advancements, the practical application of metal-specific bioindicators, such as the SPEAR m e t a l index, to field datasets has been limited [15]. Ref. [16] made a pioneering contribution by applying existing metal sensitivity data to field observations. Their study revealed a discrepancy between laboratory-derived physiological sensitivity and observed field effects, underscoring the complexity of natural ecosystems and the limitations of extrapolating laboratory results to real-world scenarios.
Interestingly, the study by [16] found that predator ratios served as a more meaningful community descriptor in elucidating the effects of metal contamination in field conditions. These findings emphasize the critical need for further validation of the SPEAR m e t a l index across diverse metal-contaminated regions. Such validation would help to establish the robustness and applicability of the index across different ecological contexts and contamination scenarios.
To enhance the reliability of the SPEAR m e t a l index, further validation across diverse metal-contaminated regions is essential, along with the incorporation of additional sensitivity data, particularly for a wider range of taxa, with an emphasis on insect species [16]. Expanding the sensitivity database would allow for the derivation of more refined sensitivity values at specific taxonomic levels, potentially increasing the precision and broadening the applicability of the SPEAR m e t a l index in different ecological contexts.
This study also calculates and compares the SPEAR m e t a l index across different sections of the watershed, including the main stream and tributaries. Such site-specific analyses provide a deeper understanding of the spatial variability in metal contamination impacts, potentially revealing distinct contamination patterns, identifying areas of concern, and highlighting zones of ecological resilience within the watershed. This refined trait-based approach would better bridge the gap between laboratory-derived data and field observations, ultimately leading to more effective environmental management strategies.
The present study aims to validate the SPEAR m e t a l index as an effective tool for assessing the ecological impacts of metal contamination in aquatic ecosystems. Specifically, the refined SPEAR m e t a l index is applied to the upper Nakdong River, a region significantly affected by industrial activities, including zinc smelting and mining operations. This refined index incorporates newly obtained acute toxicity data from 20 indigenous species of the Korean peninsula, thereby enhancing its ecological accuracy and regional applicability. By evaluating the SPEAR m e t a l index across various sections of the watershed, including the main stream and tributaries, this study offers a comprehensive analysis of metal-induced ecological impacts and identifies key stressors and pollution sources within this critical river system in South Korea.

2. Materials and Methods

2.1. Labortory Acute Toxicity Test

2.1.1. Test Chemical and Test Organisms

To improve the reliability of calculated metal sensitivity values, additional toxicity data were generated specifically for indigenous Korean species. Copper was chosen as the target substance for toxicity testing due to several factors. First, previous studies have identified zinc and copper as the most prevalent metals in Korean river sediments [17,18], with copper posing particularly high ecological risks to aquatic communities [19]. Moreover, the extensive existing toxicity data for copper provides a robust basis for assessing species sensitivity across a broad range of taxa, thereby enhancing the overall reliability and comparability of the findings [20].
Copper(II) chloride dihydrate (CuC l 2 2 H 2 O, CAS No. 10125-13-0, >99% purity) was purchased from Sigma (St. Louis, MO, USA). Acute toxicity tests for copper were conducted with 20 indigenous species from Korean freshwater systems. These species belong to four taxonomic groups: Mollusca, Crustacea, Rotifera, and Insecta (further divided by order). The tested species included mollusks (Limnoperna fortunei, Semisulcospira gottschei, Corbicula leana, Radix auricularia, Pomacea canaliculata), crustaceans (Gammarus sobaegensis, Moina macrocopa, Acanthocyclops vernalis, Branchinella kugenumaensis), the rotifer (Brachionus calyciflorus), and insects: dipterans (Glyptotendipes tokunagai, Chironomus flaviplumus), trichopterans (Lepidostoma albardanum, Hydropsyche orientalis), ephemeropterans (Baetis fuscatus, Ephemera orientalis, Epeorus pellucidus), and odonates (Anax parthenope, Sieboldius albardae, Ophiogomphus obscurus). B. kugenumaensis, G. tokunagai, and M. macrocopa were obtained by subculture from EH Research & Consulting Co., Ltd., respectively. Other organisms were collected from Korean freshwaters and used for acute toxicity testing after acclimatization in dechlorinated tap water for 7 days. G. sobaegensis, H. orientalis, and L. albardanum were acquired from the Gapyeong Stream in Gyeonggi-do. A. vernalis, R. auricularia, and P. canaliculata were obtained from the Bernere Stream located in Bucheon City. L. fortunei was obtained from the Namhan River in Chungcheongbukdo. Other taxa, including L. fortunei, S. gottschei, C. leana, B. calyciflorus, C. flaviplumus, B. fuscatus, E. orientalis, E. pellucidus, A. parthenope, S. albardae, and O. obscurus, were all collected from the Namhan River.

2.1.2. Toxicity Test Method

The water acute toxicity tests were conducted in the laboratory for twenty indigenous species from Korean freshwater systems. Test durations were 24 h for M. macrocopa, B. kugenumaensis, and B. calyciflorus, and 96 h for the remaining species. No food was provided during the exposure period. The stock solution was prepared by dissolving appropriate amounts of CuC l 2 in distilled water. Test concentrations were determined through preliminary experiments to achieve a mortality rate between 20% and 80%. Environmental factors, such as water hardness and temperature, were calculated as geometric means at the start and end of the tests. The tests were conducted following established guidelines, including those of the OECD, US EPA, and others [21,22,23,24,25,26,27,28]. In acute toxicity testing, environmental factor, such as hardness and temperature, were determined as the geometric means of values measured at the beginning and end of the test. The results of the toxicity tests are summarized in Table S1.

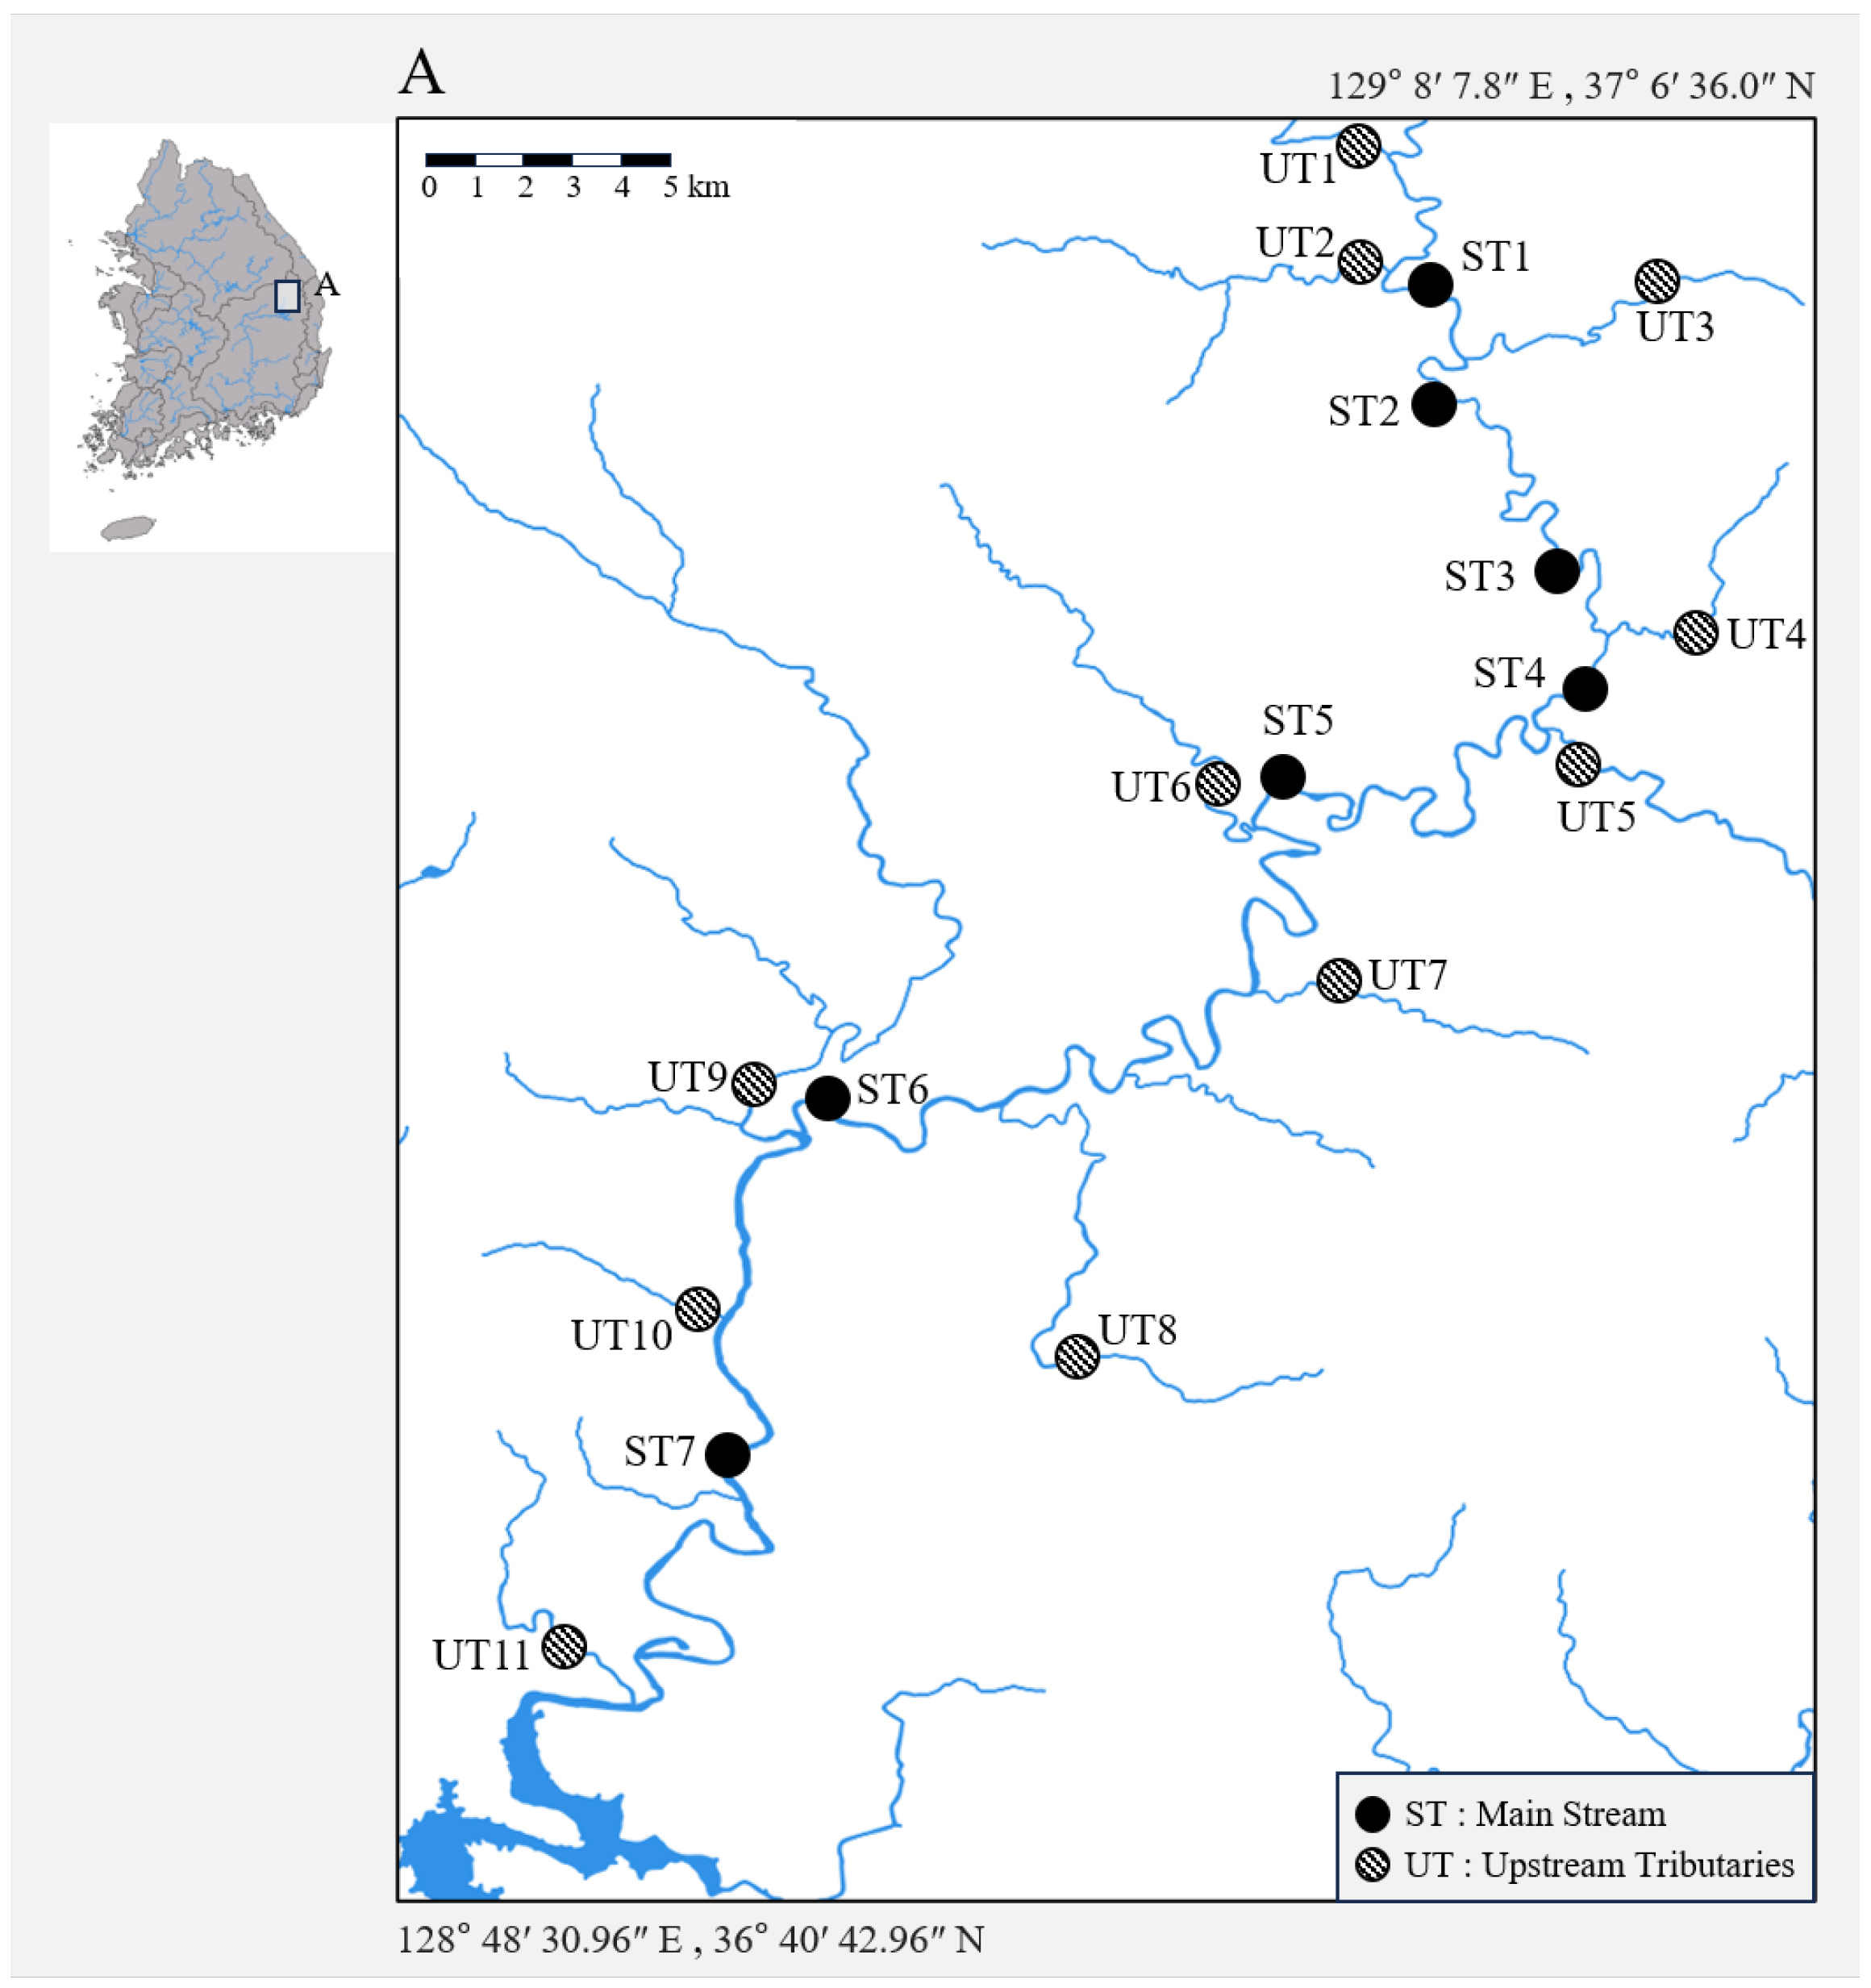
2.2. Field Monitoring Data

The study area was centered on the smelter in Andong City, Korea (Figure 1). Since this area has a long history of mining and smelting, massive heavy metal contamination was found to extend 70 km downstream in the main stream from the smelter. To assess the ecological impact of metal contamination, we utilized data on metal concentrations in sediments and surface water from [29]. Additionally, data on benthic macroinvertebrates were obtained from the National Aquatic Ecological Monitoring Program (NAEMP) database, managed by the National Institute of Environmental Research (NIER), South Korea. Benthic macroinvertebrates were sampled biannually (spring and fall) across the major river watersheds following the NAEMP protocol [30]. Data on sediments and surface water were integrated based on the sampling sites for benthic macroinvertebrates, resulting in a dataset comprising seven sites along the main stream and eleven sites in upstream tributaries.

2.3. Data Analysis

2.3.1. Calculation of Hazard Quotients (HQs) and Probable Effect Level Quotients (PELqs)

To assess the toxic impacts of hazardous substances in the upstream Nakdong River, we calculated the hazard quotients (HQs) for surface water and the mean Probable Effect Level quotients (mPELqs) for sediment. HQs for surface water were calculated by dividing the measured concentrations of metals in surface water samples by the respective US EPA water quality criteria for each metal. This calculation provides a quantitative measure of the potential ecological risk posed by these metals. For metals such as Cu, Zn, Ni, Cd, and Pb, hardness-adjusted criteria values were utilized, based on the average hardness of 60 mg/L in the upstream Nakdong River. The adjustment was performed according to the formula provided by the US EPA for calculating hardness-adjusted criteria:
C M C ( d i s s o l v e d ) = e m A [ ln ( h a r d n e s s ) ] + b A C F
where C M C ( d i s s o l v e d ) is the criterion maximum concentration for dissolved metals, m A is the slope of the hardness regression for the specific metal, b A is the y-intercept of the hardness regression for the specific metal, and C F is the conversion factor to convert from the total to the dissolved concentration. This adjustment is important because the toxicity of these metals can vary significantly with changes in water hardness, influencing their bioavailability and potential impact on aquatic life [31,32,33]. In contrast, for As, the criteria values were applied without any adjustment for hardness, reflecting the approach used in the assessment without considering hardness effects.
The mean Probable Effect Level quotient (mPELq) for sediments was calculated using the PEL quotient (PELq) values for each metal. PEL values for each metal in freshwater sediment were obtained from [34]. The PELq was determined by dividing the measured concentration of each metal by its corresponding PEL value and then averaging these quotients across all metals present in the sediment sample. This method allowed for a quantitative assessment of metal concentrations in sediment samples, taking into account the specific PEL thresholds for each metal.

2.3.2. Community Indices

To assess the biodiversity and species richness of the upstream Nakdong River, we calculated several ecological indices, including taxon richness (TR), EPT taxa richness (EPT), Shannon’s diversity index ( H ), and the Benthic Macroinvertebrate Index (BMI). Taxon richness (TR) was determined as the total number of distinct taxa collected at each monitoring site. EPT taxa richness (EPT) was calculated as the number of species belonging to the orders Ephemeroptera, Plecoptera, and Trichoptera within the same sites. Shannon’s diversity index ( H ) was computed using the following formula:
H = p i ln p i
where p i represents the proportion of individuals belonging to species i.
The Benthic Macroinvertebrate Index (BMI) was calculated using the following formula:
B M I = 4 i = 1 n s i h i g i i = 1 n h i g i × 25
where n is the number of taxa, s i is the unit indecision index of species i, h i is the appearance value of species i, and g i is the indicator weight of species i. The indicator weight of each taxon was determined according to the NAEMP protocol [13,30]. These indices provided insight into the macroinvertebrate community structure and overall ecological health of the streams investigated. The calculated indices are summarized in Table S2.

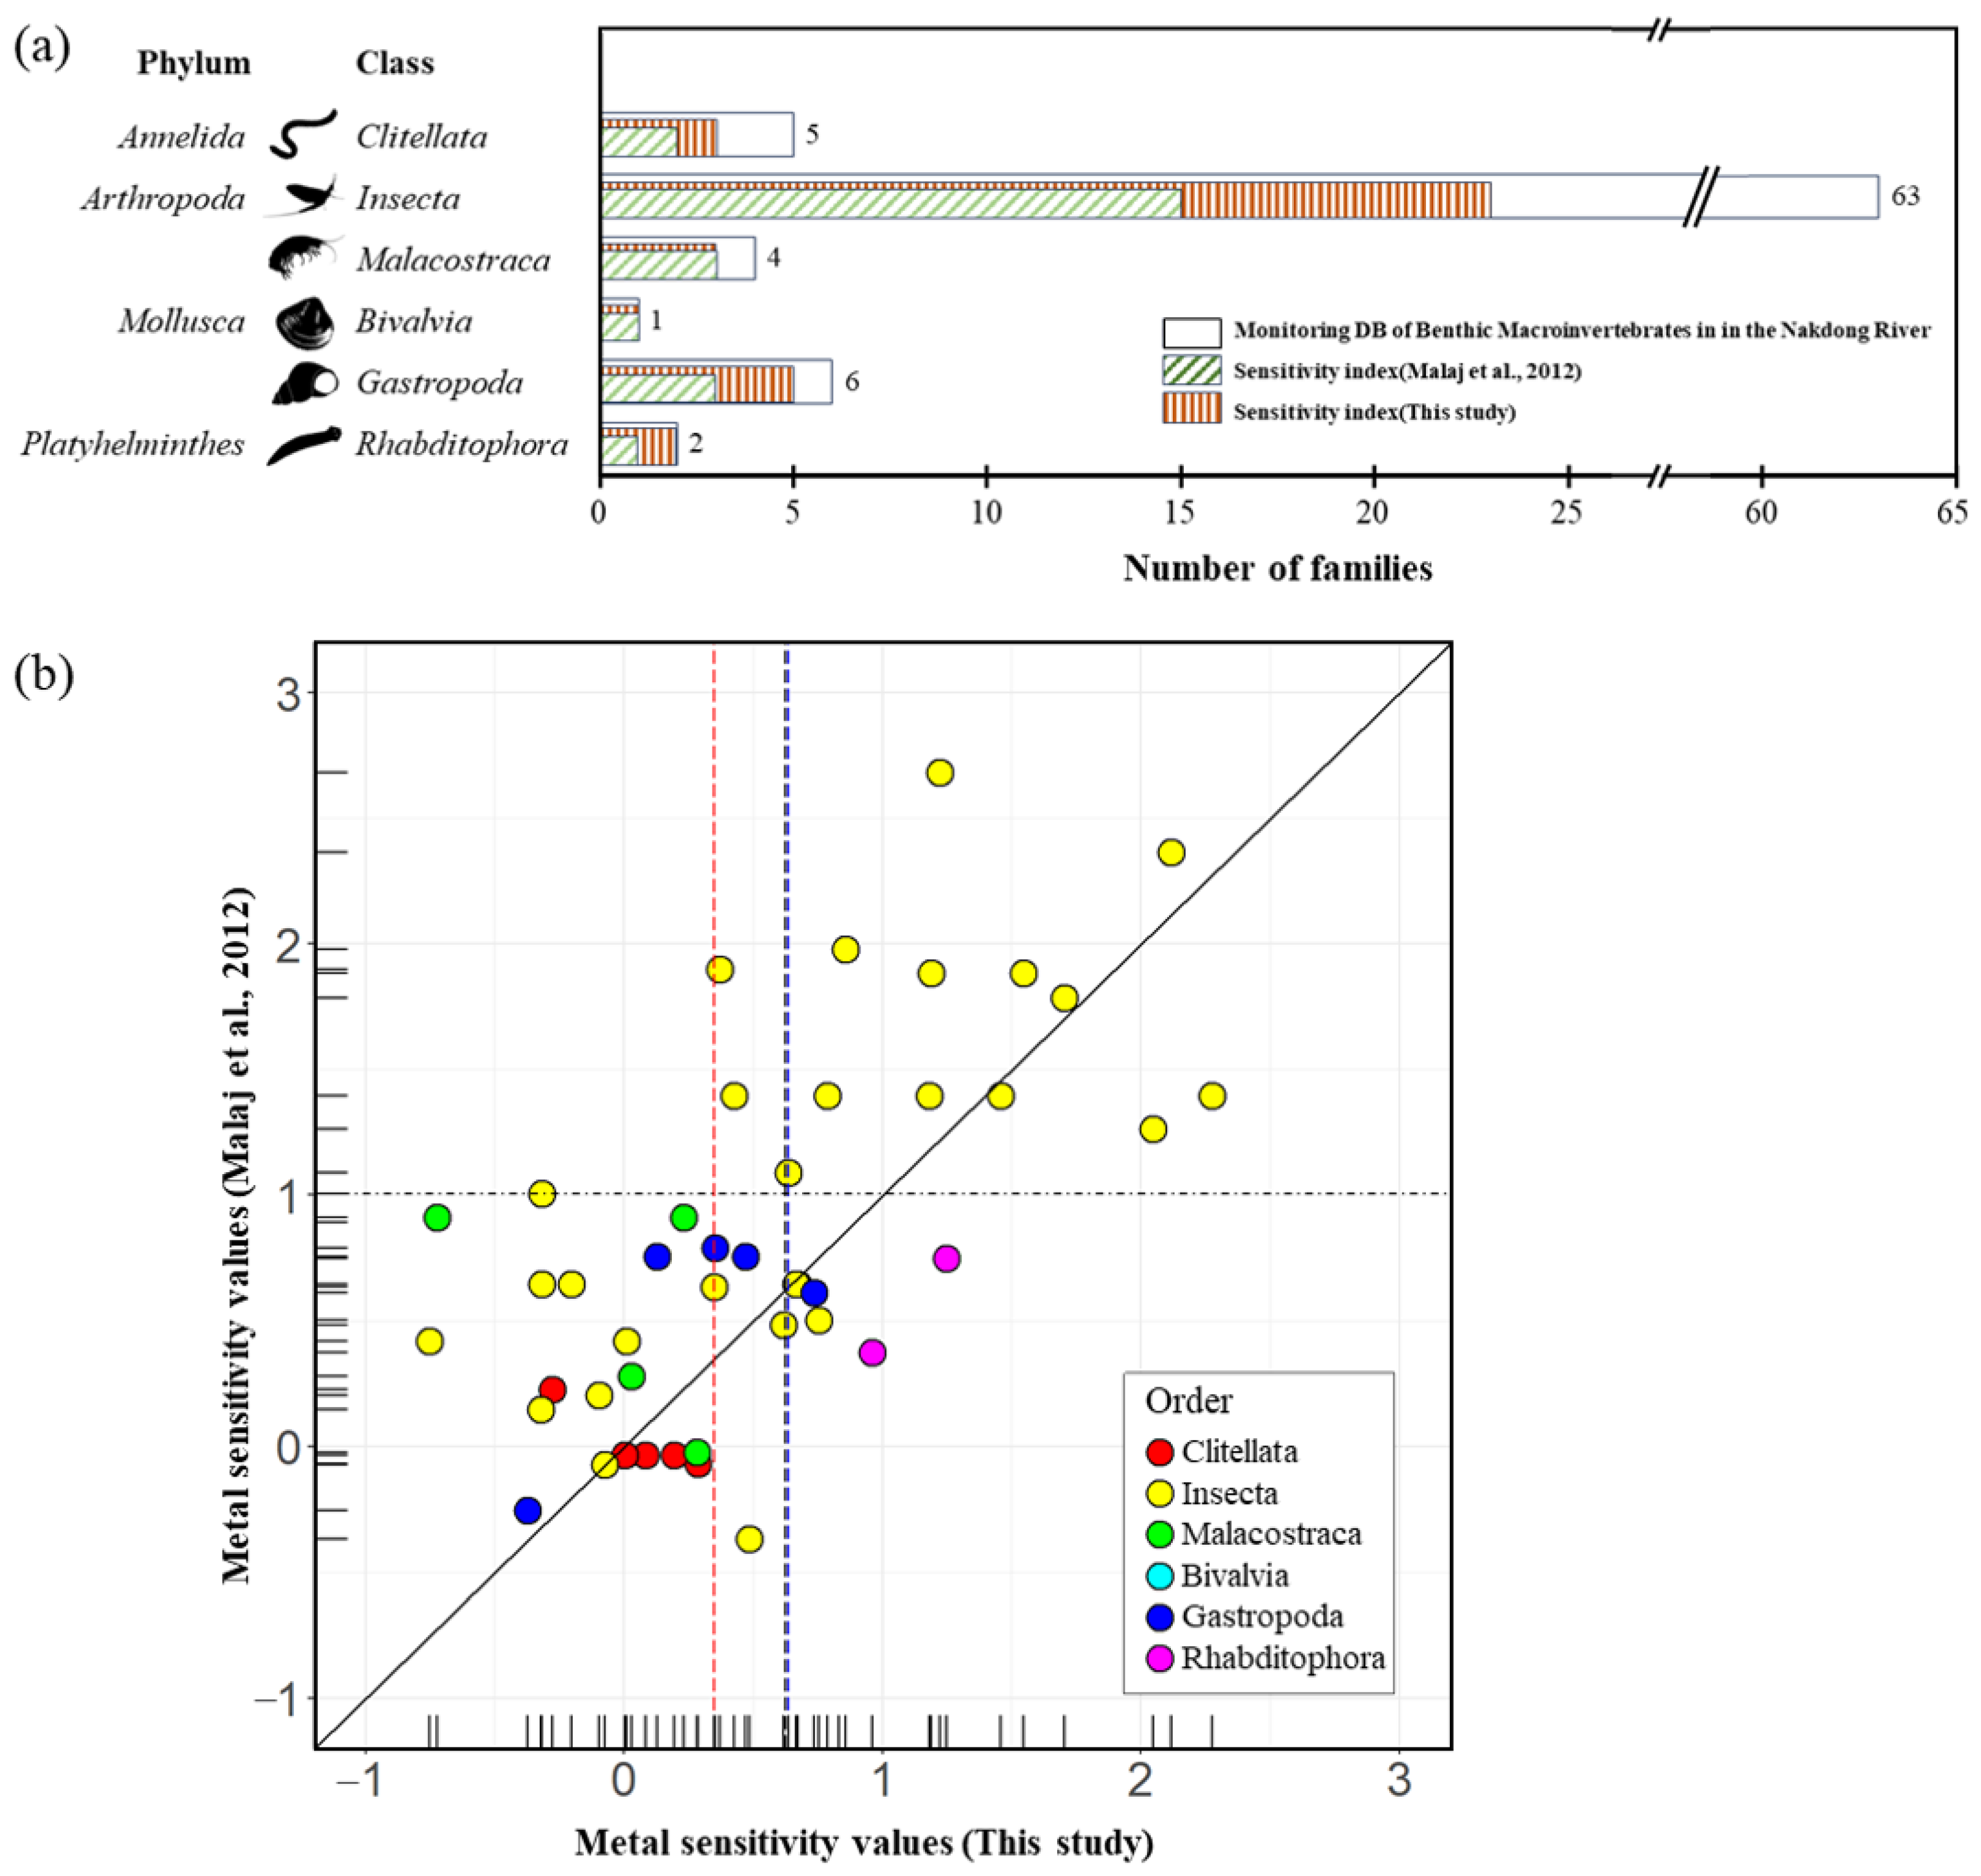
2.3.3. Calculation of Metal Sensitivity Value

In order to expand the applicability of the existing SPEAR index for metal, it was necessary to improve the sensitivity value. A wide range of test data from the Ecotoxicology Database System (ECOTOX; http://www.epa.gov/ecotox) on 14 March 2024 was collected, and a total of 12,108 toxicity test records for 14 metal ions, including 12,108 toxicity test records for 13 metal ions, including Al, As, Cd, Co, Cr, Cu, Fe, Hg, Mn, Ni, Pb, Se, and Zn, were obtained. Additionally, toxicity data from 20 species generated in our own experiments were included in the analysis.
The sensitivity index of freshwater macroinvertebrates to metals was determined according to the methodology outlined by [15]. The dataset underwent several preprocessing steps, including removing duplicates, filling missing values, and standardizing units. Taxonomic inconsistencies were harmonized to ensure consistency across studies, and the data were limited to freshwater macroinvertebrates. Furthermore, test data generated under different test conditions within the collected dataset were normalized to standard laboratory conditions (i.e., under 48 h of exposure time, 20 °C of temperature, and 50 mg/L CaC O 3 of hardness, as assumed in [15]). These standard laboratory conditions were normalized according to the following equation:
l o g L C 50 n o r m = l o g L C 50 o r i g i n a l t 0.5 0.58 12.52 H 0.79 0.33 3 e 0.11 T
where L C 50 n o r m is the normalized LC50, L C 50 o r i g i n a l is the original LC50 from the literature, t is exposure time, H is hardness values (mg CaC O 3 /mL), and T is temperature during the toxicity test.
The log-transformed normalized concentrations for multiple metals of the same aquatic organism and heavy metal were averaged. These values were then standardized according to
S i ( s p e ) = l o g L C 50 i ( s p e ) π i σ i
where LC50 is the species (spe) toxicity value, π i is the mean, and σ i is the standard deviation for each heavy metal (i).
All data transformations, standardizations, and statistical analyses were conducted using the methodology described by [15] in the free open-source software R (version 4.3.3). To obtain an aggregated sensitivity value, we used a linear mixed-effect (LME) model to test for significant differences in S i ( s p e ) values (species sensitivity to heavy metals), accounting for the unequal number of species representing each heavy metal, which created an unbalanced dataset. For this analysis, we limited the integration to eleven heavy metals, excluding Al and Mn, as they were deemed unsuitable for the aggregated S m e t a l calculations (Table S1, Figure S1).

2.3.4. Calculation of the SPEAR Index for Metals

The SPEAR (SPEcies At Risk) index was developed through a dichotomous classification of taxa into “species at risk” and “species not at risk”. This classification is based on four biological traits: physiological sensitivity to metal contaminants, generation time, exposure potential during periods of maximum contamination, and migration ability [8].
Physiological sensitivity is assigned a score of 1 for taxa with a relative sensitivity above a defined threshold, while those below receive a score of 0. Generation time sensitivity scores 1 for taxa with a generation time greater than or equal to a threshold, and 0 otherwise. Exposure sensitivity is scored 1 for epibenthic taxa and 0 for sediment-dwelling taxa. Lastly, migration sensitivity is 0 for organisms known to migrate rapidly, and 1 for all others. A taxon is defined as “species at risk” only if values for all four traits are equal to 1 [8].
The sensitivity value of freshwater macroinvertebrates to metals was determined using newly calculated values according to the methodology outlined by [15]. For the threshold value of physiological sensitivity, the median sensitivity score of 0.63 was determined by calculating the sensitivity values of 10 classes, 34 orders, and 166 families of resident taxa found in South Korea, obtained from the National Aquatic Ecological Monitoring Program (NAEMP) database (meaning that a taxon is considered sensitive only if its relative sensitivity score exceeds 0.63).
To compute the SPEAR index, the relative abundance of the “species at risk” is calculated for each sampling site. The formula for calculating the SPEAR index for metals is given by
S P E A R m e t a l = i = 1 n l o g ( x i + 1 ) y i = 1 n l o g ( x i + 1 )
where n is the number of taxa, x i is the abundance of taxon i, and y is 1 if taxon i is classified as “at risk”, otherwise 0.
This calculation is performed at the lowest taxonomic level identified, extending down to the species level where possible, to ensure an accurate representation of ecological risks associated with metal exposure. When data for a particular taxon were absent, sensitivity values were taken from the higher taxonomic levels. The derived SPEAR values allow for assessment of the ecological health of aquatic systems in relation to metal contamination, facilitating the identification of at-risk taxa and informing conservation and management efforts.

2.3.5. Statistical Analyses

Pearson’s correlation analysis was performed to assess the relationships between surface water metal HQs and biological indices, including TR, EPT, H’, and BMI. Additionally, correlations between the SPEAR m e t a l index and both surface water metal HQ and sediment metal PELq were examined. These analyses aimed to evaluate the response of the SPEAR m e t a l index to different levels of metal contamination in both surface water and sediment.
To investigate the relationships between biological indices and environmental variables, principal component analysis (PCA) was conducted. PCA was chosen due to its effectiveness in describing continuous changes in complex systems characterized by multiple parameters, making it suitable for this study [35]. PCA can provide insights into the complex relationships between metal contamination and various ecological indicators [36]. The analysis was performed using relevant libraries, following standard protocols for multivariate analysis.
Before conducting the PCA, all biological indices, including SPEAR m e t a l , TR, EPT, H’, surface water metal HQ, and sediment metal PELq, were standardized to a zero mean and a standard deviation of one, as the indices represent different units of measurement. This standardization ensured comparability across indices, improving the reliability of the results. PCA was applied to the standardized biological indices, with environmental variables passively projected onto the ordination space. This unconstrained approach allowed for the exploration of variability in the biological indices, including variability that was not explained by the environmental variables. The interpretability of the PCA axes was assessed using the Broken Stick criterion [37]. All statistical analyses were conducted employing the scipy libraries for data manipulation and correlation analysis, using Python 3.11.5.

3. Results

3.1. Updated Metal Sensitivity and SPEAR Index Calculation

Metal sensitivity was updated using new toxicity test results for twenty indigenous species in Korea, primarily focusing on insect taxa (Table S1). The total number of families with available toxicity data increased from 122 in 2012 to 411 in the current study. The median value of metal sensitivity shifted from 1.01 in 2012 to 0.63 in the present study (Figure 2). The LME model analysis revealed no statistically significant differences among the rankings of the 11 heavy metals examined (Figure S1 and Table S2). Consequently, an overall heavy metal sensitivity value ( S m e t a l ) was calculated for each taxon (Tables S2 and S3). The most sensitive species were identified as Villorita cyprinoides (−2.89), Physella gyri (−2.58), and Leptodea leptodon (−2.00), with families Mycetopodidae (−1.88) and Hyalellidae (−0.97) also showing high sensitivity. Among insect orders, Coleoptera (−0.31) and Ephemeroptera (−0.009) were most sensitive, while Odonata (1.82) were relatively tolerant. Other taxa, such as Plecoptera (1.18) and Trichoptera (1.19), exhibited intermediate sensitivity.
In the upper Nakdong River, 81 families across six classes of species were recorded, with Insecta representing the highest abundance at 94%. The most abundant orders within Insecta were Ephemeroptera (50%), Diptera (17%), and Trichoptera (8.1%). The taxon-specific coverage of the metal sensitivity index in this study accounted for 46% of the recorded taxa, compared to 31% in the previous sensitivity index reported by [15]. Insecta had the lowest coverage, with 37% of the 63 families covered in this study, while the previous research reported only 24% coverage. Other taxa in this study showed coverage rates exceeding 60% (Figure 2).
Figure 3 illustrates the impact of the updated ecotoxicity database on taxon coverage and metal sensitivity. The percentage of families with available toxicity data increased from 44% to 63% of the total number of families recorded in the study area (Figure 3a). Figure 3b demonstrates the correlation between metal sensitivities derived from the existing and updated ecotoxicity databases.
The analysis of sensitivity indices revealed distinct patterns across different datasets and stream types. For the whole dataset, the median value of S i -2024t exceeded that of S i -2012, indicating an overall increase in sensitivity with the updated index. In the main stream, S i -2024t demonstrated a higher median value compared to S i -2024s. However, this difference was not observed in the tributaries, where the median values of S i -2024t and S i -2024s were comparable.
For instance, in the Plecoptera order, the previous study assigned a uniform sensitivity value (1.39) to all lower taxa, whereas our study calculated different sensitivity values for each family: Chloroperlidae (0.78), Nemouridae (0.42), Perlodidae (1.45), and Perlidae (2.27). Conversely, Capniidae, Leuctridae, and Taeniopterygidae were assigned the sensitivity value of the higher taxonomic group (1.18). The median sensitivity value for species in the upper Nakdong River was 0.63 in our study, compared to 1.01 derived from the previous sensitivity index.

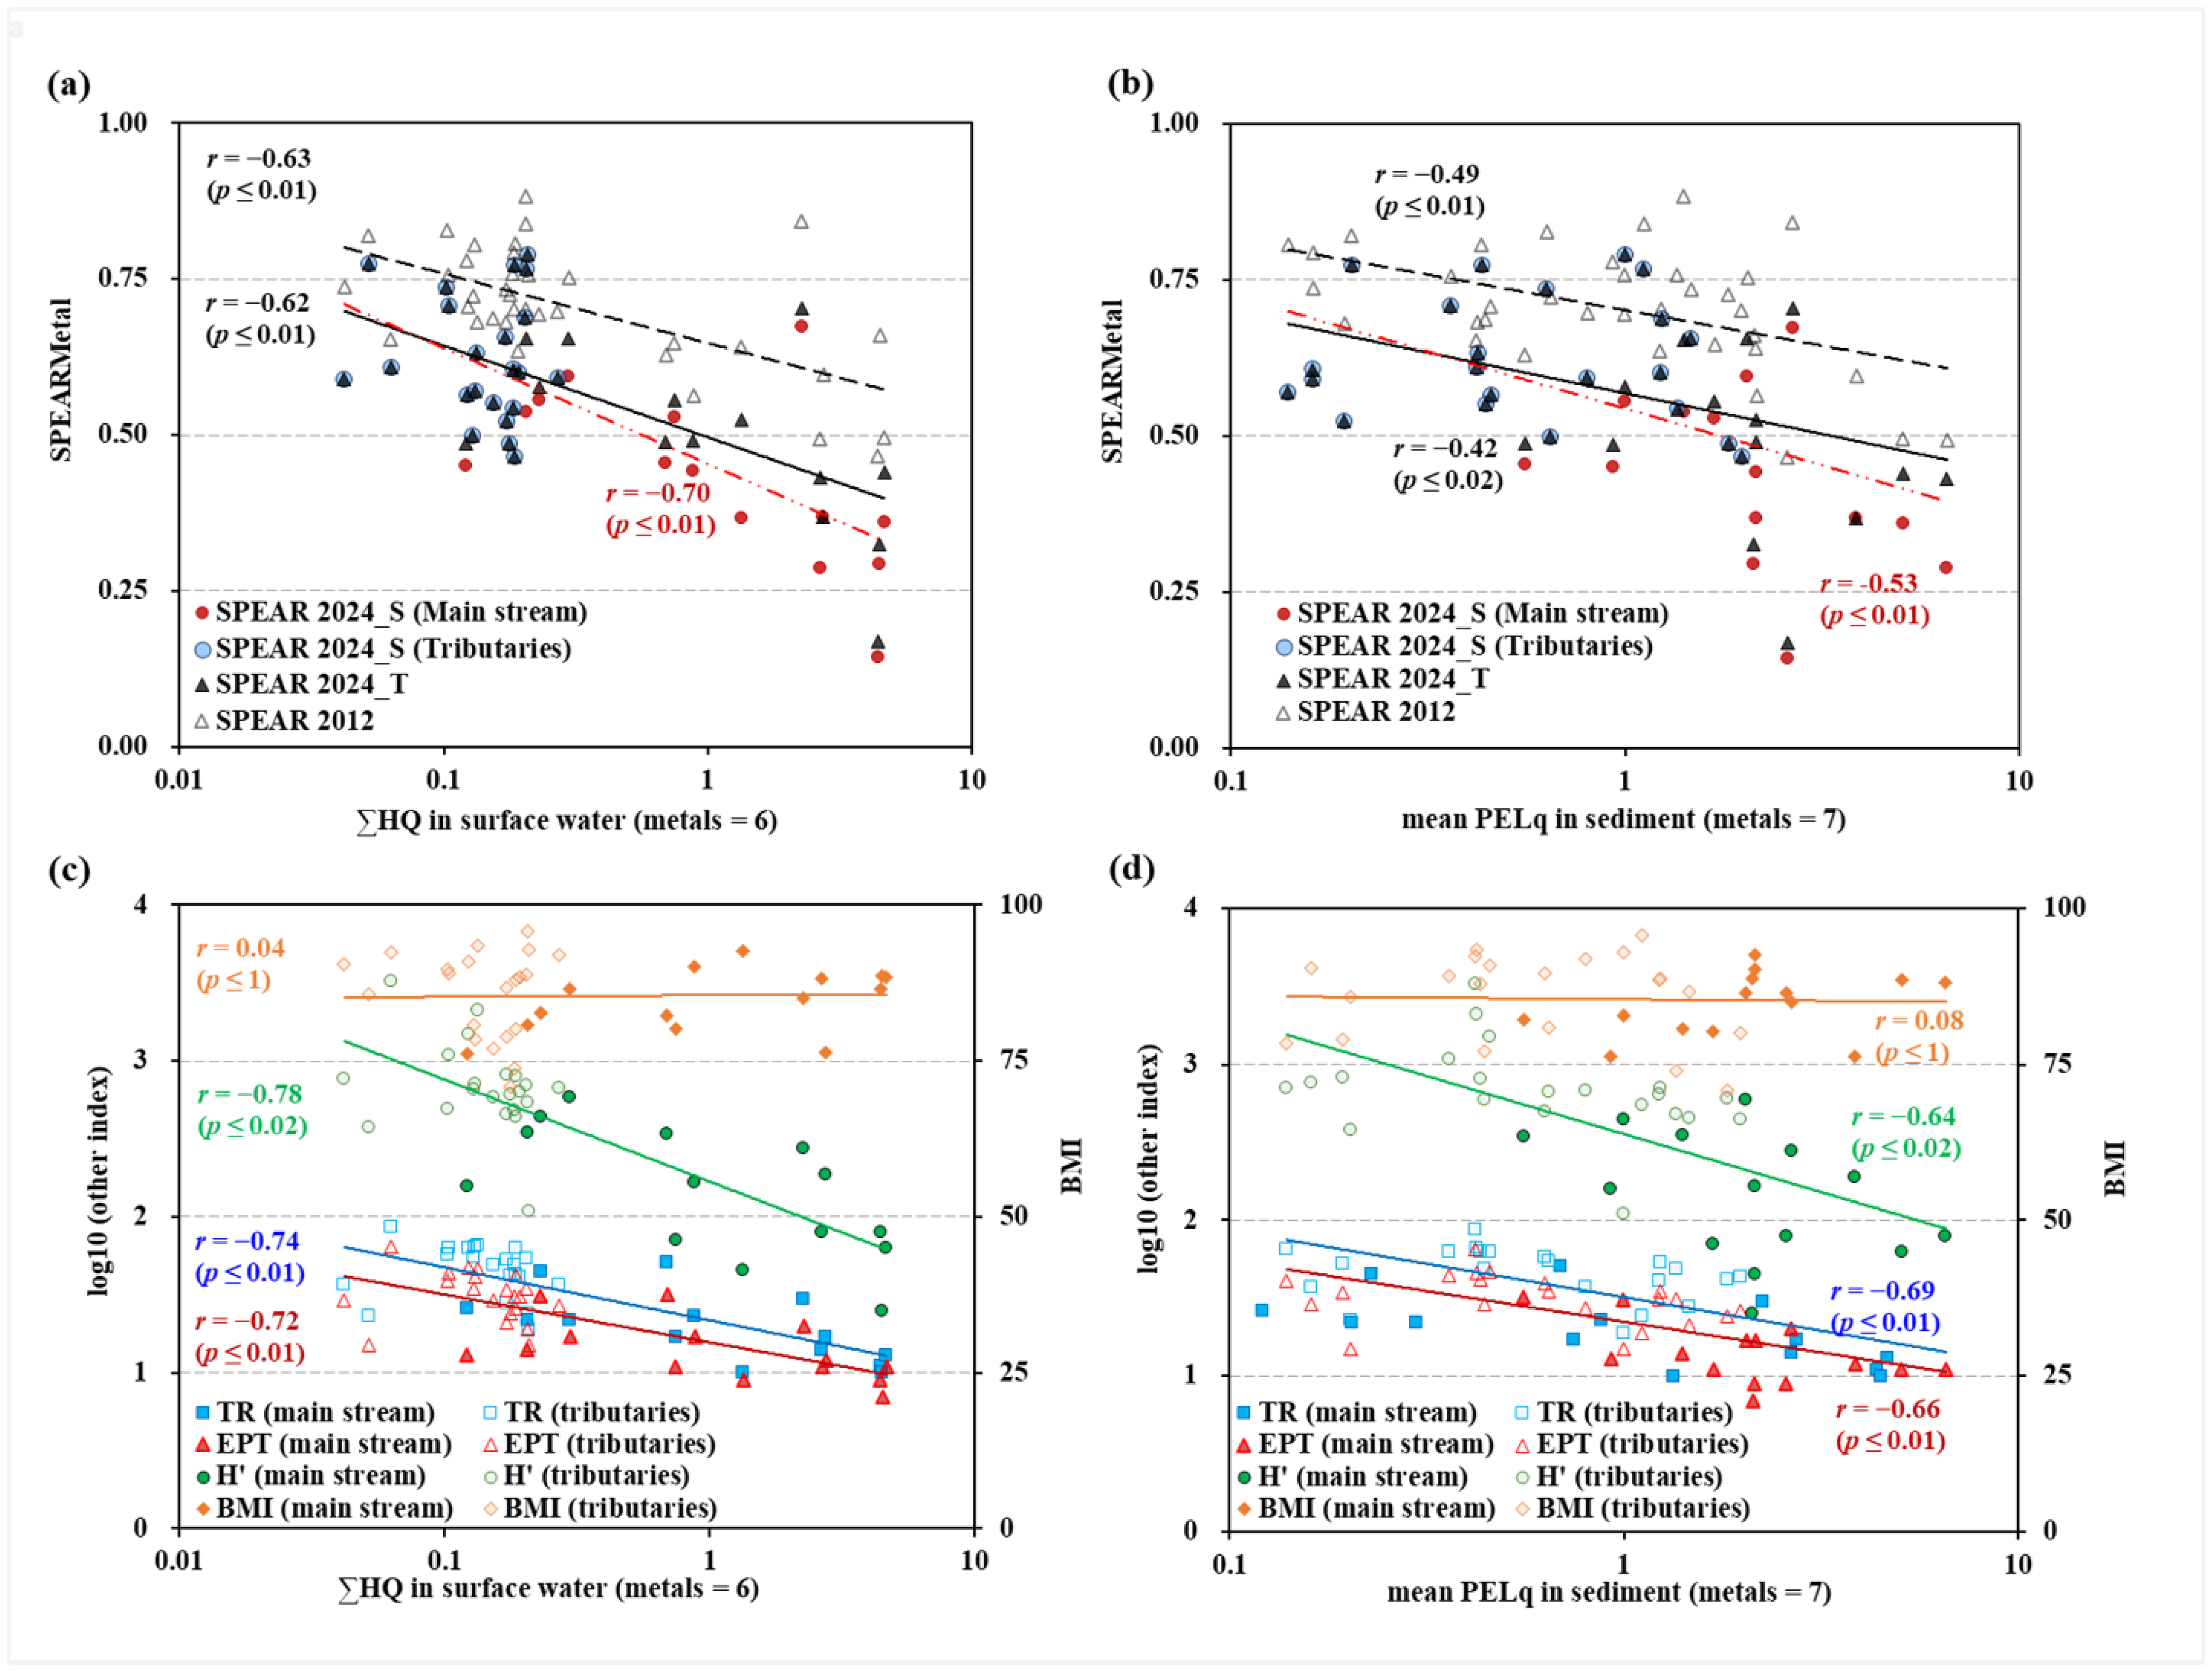
3.2. Association Between Metal Concentrations and SPEAR Index

The updated SPEAR index values for whole dataset (SPEAR-2024t) based on the new metal sensitivity data were lower than those derived from the previous version (SPEAR-2012) (Figure 4a). The median values were 0.70 for SPEAR-2012 and 0.56 for SPEAR-2024t, with a mean difference of 0.14 ± 0.06 (mean ± SD). While most SPEAR-2012 values exceeded 0.5, the majority of SPEAR-2024 values in the main stream fell below the severe level of the SPEAR index (0.5) [10,38]. SPEAR-2024s (median value: 0.64), calculated separately for the main stream and tributaries, yielded lower values than SPEAR-2024t (0.56), with a mean difference of 0.13 ± 0.15. A signicifant difference was observed between SPEAR-2024t (0.56) and SPEAR-2024s (0.45) in the main stream (mean difference: 0.11 ± 0.0085), but not in the tributaries (0.04 ± 0.0042). These results mean that the separating calculation of the SPEAR index is more sensitive to metal contamination.
The correlation coefficients (r) between the SPEAR indices and the sum of HQs in surface water were −0.63 (SPEAR-2012), −0.62 (SPEAR-2024t), and −0.70 (SPEAR-2024s). The refined SPEAR indices showed a significant correlation with both the sum of HQs for six metals in water and mPELqs for seven metals in sediment (Figure 4b). The correlation coefficients (r) between the SPEAR indices and mPELqs in sediment were −0.49 (SPEAR-2012), −0.42 (SPEAR-2024t), and −0.53 (SPEAR-2024s). The correlation coefficients (r) between SPEAR-2024s were greater than those of SPEAR-2012 and SPEAR-2024t. These results mean that the separating calculation of the SPEAR index is more specific to metal contamination.

3.3. Association Between Metal Contamination and Generic Ecological Indices

The relationship between metal contamination and various ecological indices was examined to assess the specificity of observed impacts. Generic ecological indices, including TR, EPT, and H’, showed significant negative correlations with both Σ T U and mPELq (Figure 4c,d). Specifically, sites with higher metal concentrations exhibited reduced species richness (r = −0.74, p < 0.01), a lower proportion of Ephemeroptera, Plecoptera, and Trichoptera taxa (r = −0.72, p < 0.01), and decreased H’ values (r = −0.78, p = 0.02) compared to uncontaminated sites.
These correlations suggest a selective disappearance of metal-sensitive species from contaminated areas. In contrast, the Benthic Macroinvertebrate Index (BMI), which is primarily sensitive to organic pollution, showed no significant correlation with metal contamination levels (r = 0.11, p > 0.05). This lack of association between BMI and metal contamination indicators ( Σ T U and mPELq) suggests that organic matter pollution was not a significant stressor in the studied system, further emphasizing the specificity of the observed ecological impacts to metal contamination.

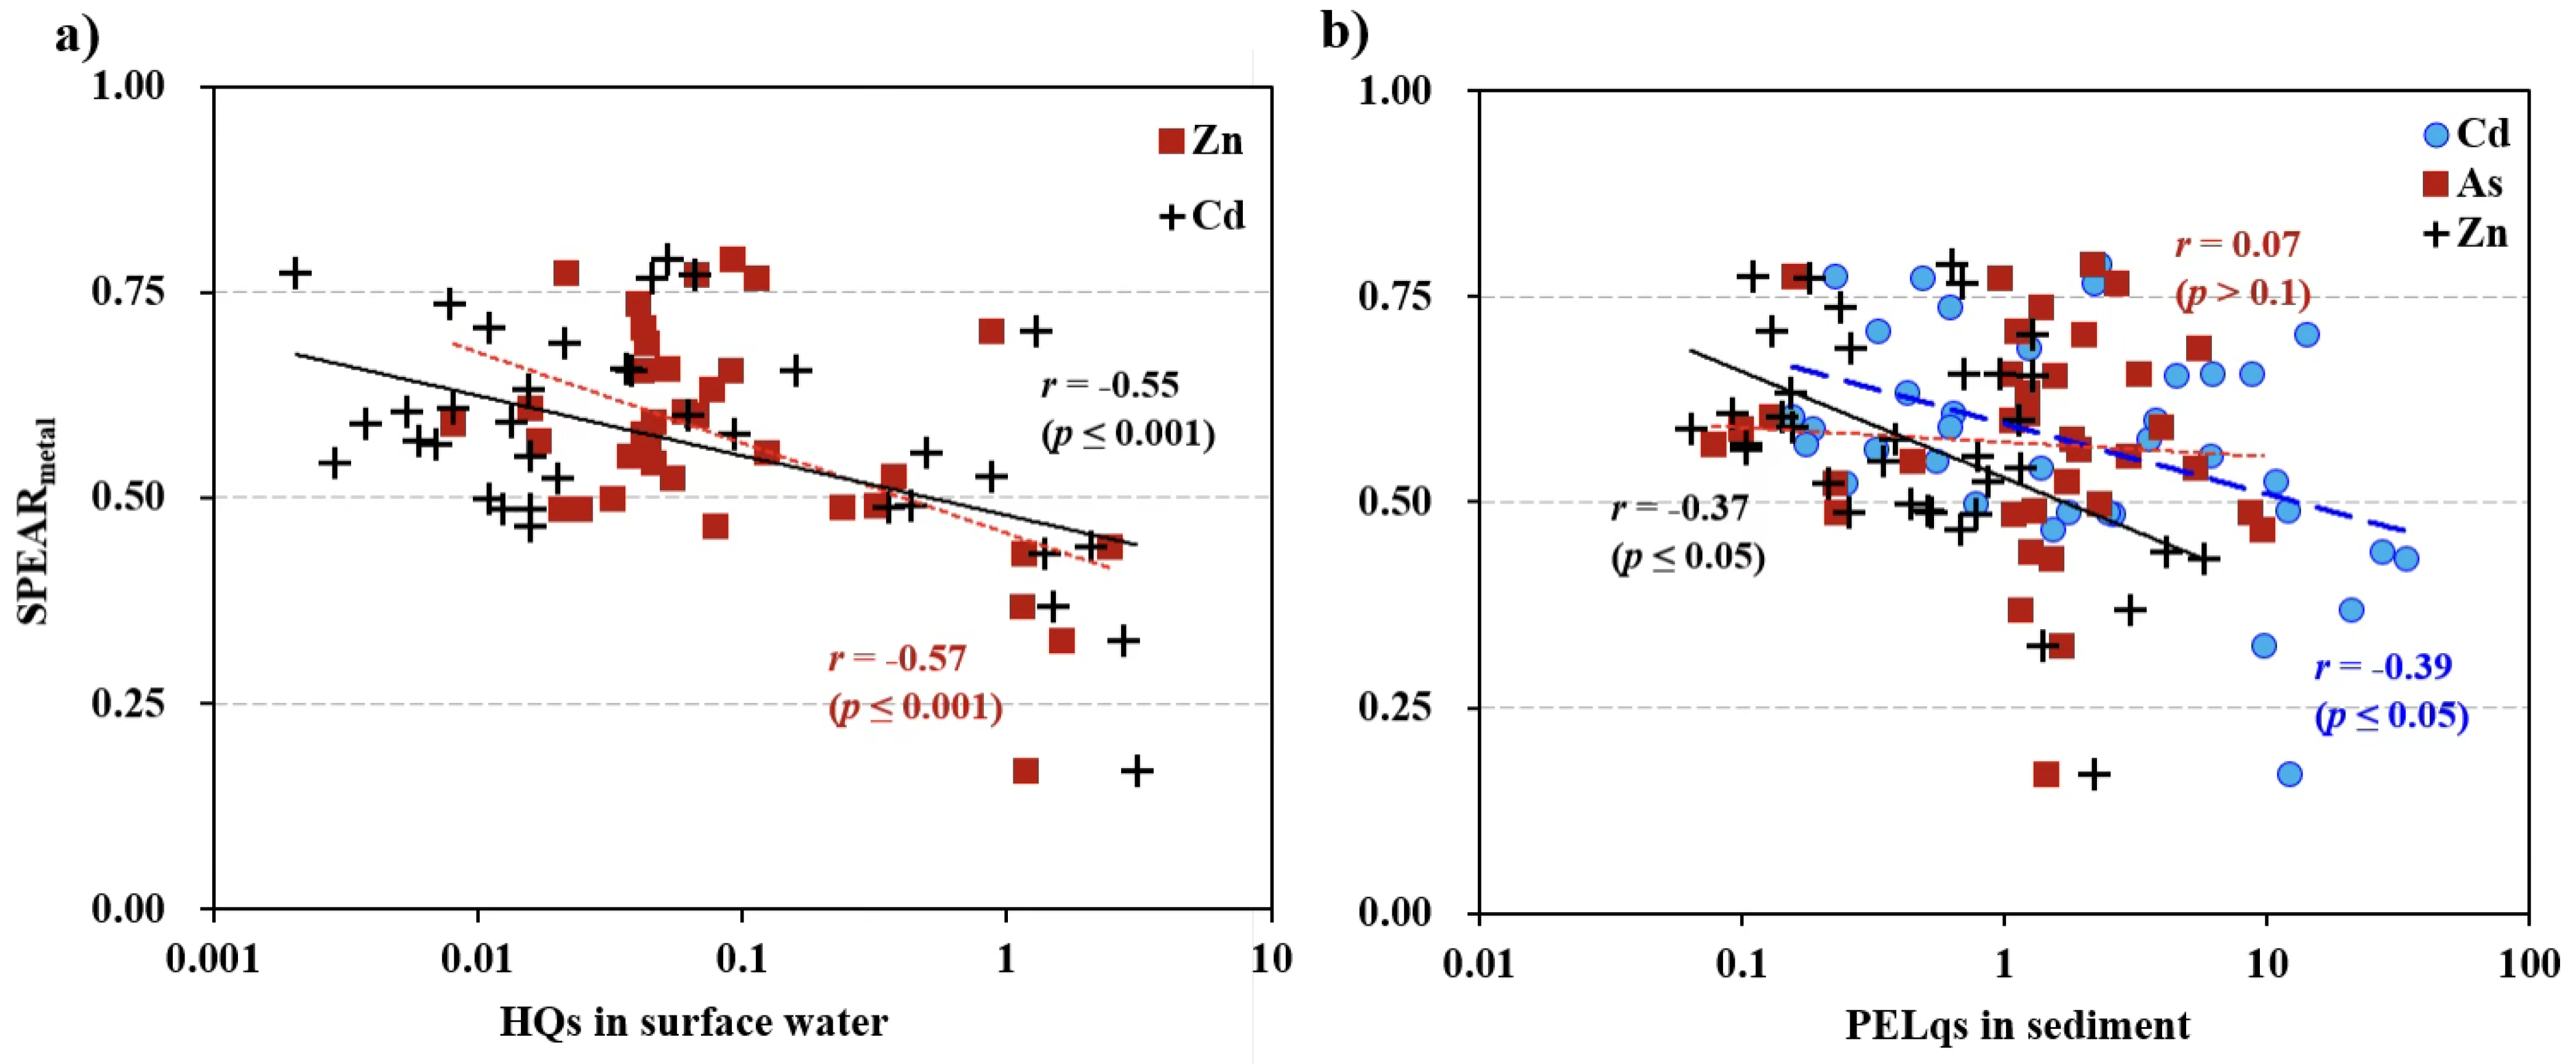
3.4. Relationship Between Individual Metal Concentrations and SPEAR Index

In the main stream samples, Cd and Zn were identified as potential key toxicants in surface water through HQ analysis [29]. SPEAR-2024s values for metals in the main stream and whole dataset also showed significant correlations with HQ values of Cd and Zn, with HQ ranges from 0.02 to 3.1 (Figure 5a). Other metals did not show significant relationships with SPEAR-2024s. In sediment samples, while both Cd and As were previously identified as key toxicants contributing to sediment toxicity, Cd and Zn displayed a significant relationship with the SPEAR m e t a l s index (r = 0.39, p < 0.05 for Cd; r = 0.37, p < 0.05 for Zn). As did not show a significant correlation. Notably, Cd PELq values exceeded 1 at several sites, while As PELq values remained below 1. Zn, despite having PELq values below 1, demonstrated a significant relationship with the SPEAR index (r = 0.08, p > 0.1).
A clear gradient of decreasing SPEAR index values was observed along the main stream, correlating with increasing distance from the Zn smelter. Near the smelter, HQ values exceeded 1, with both the sum and maximum HQ values following a similar pattern. Specifically, HQ values for Zn and Cd were greater than 1 in proximity to the smelter. In contrast, SPEAR values in the tributaries showed no discernible pattern, and the sum of HQ values remained below 1 (Figure A2).
In conclusion, Cd and Zn were identified as the primary stressors responsible for the ecological impacts of metal contamination in the upper Nakdong River near and downstream of the Zn smelter.

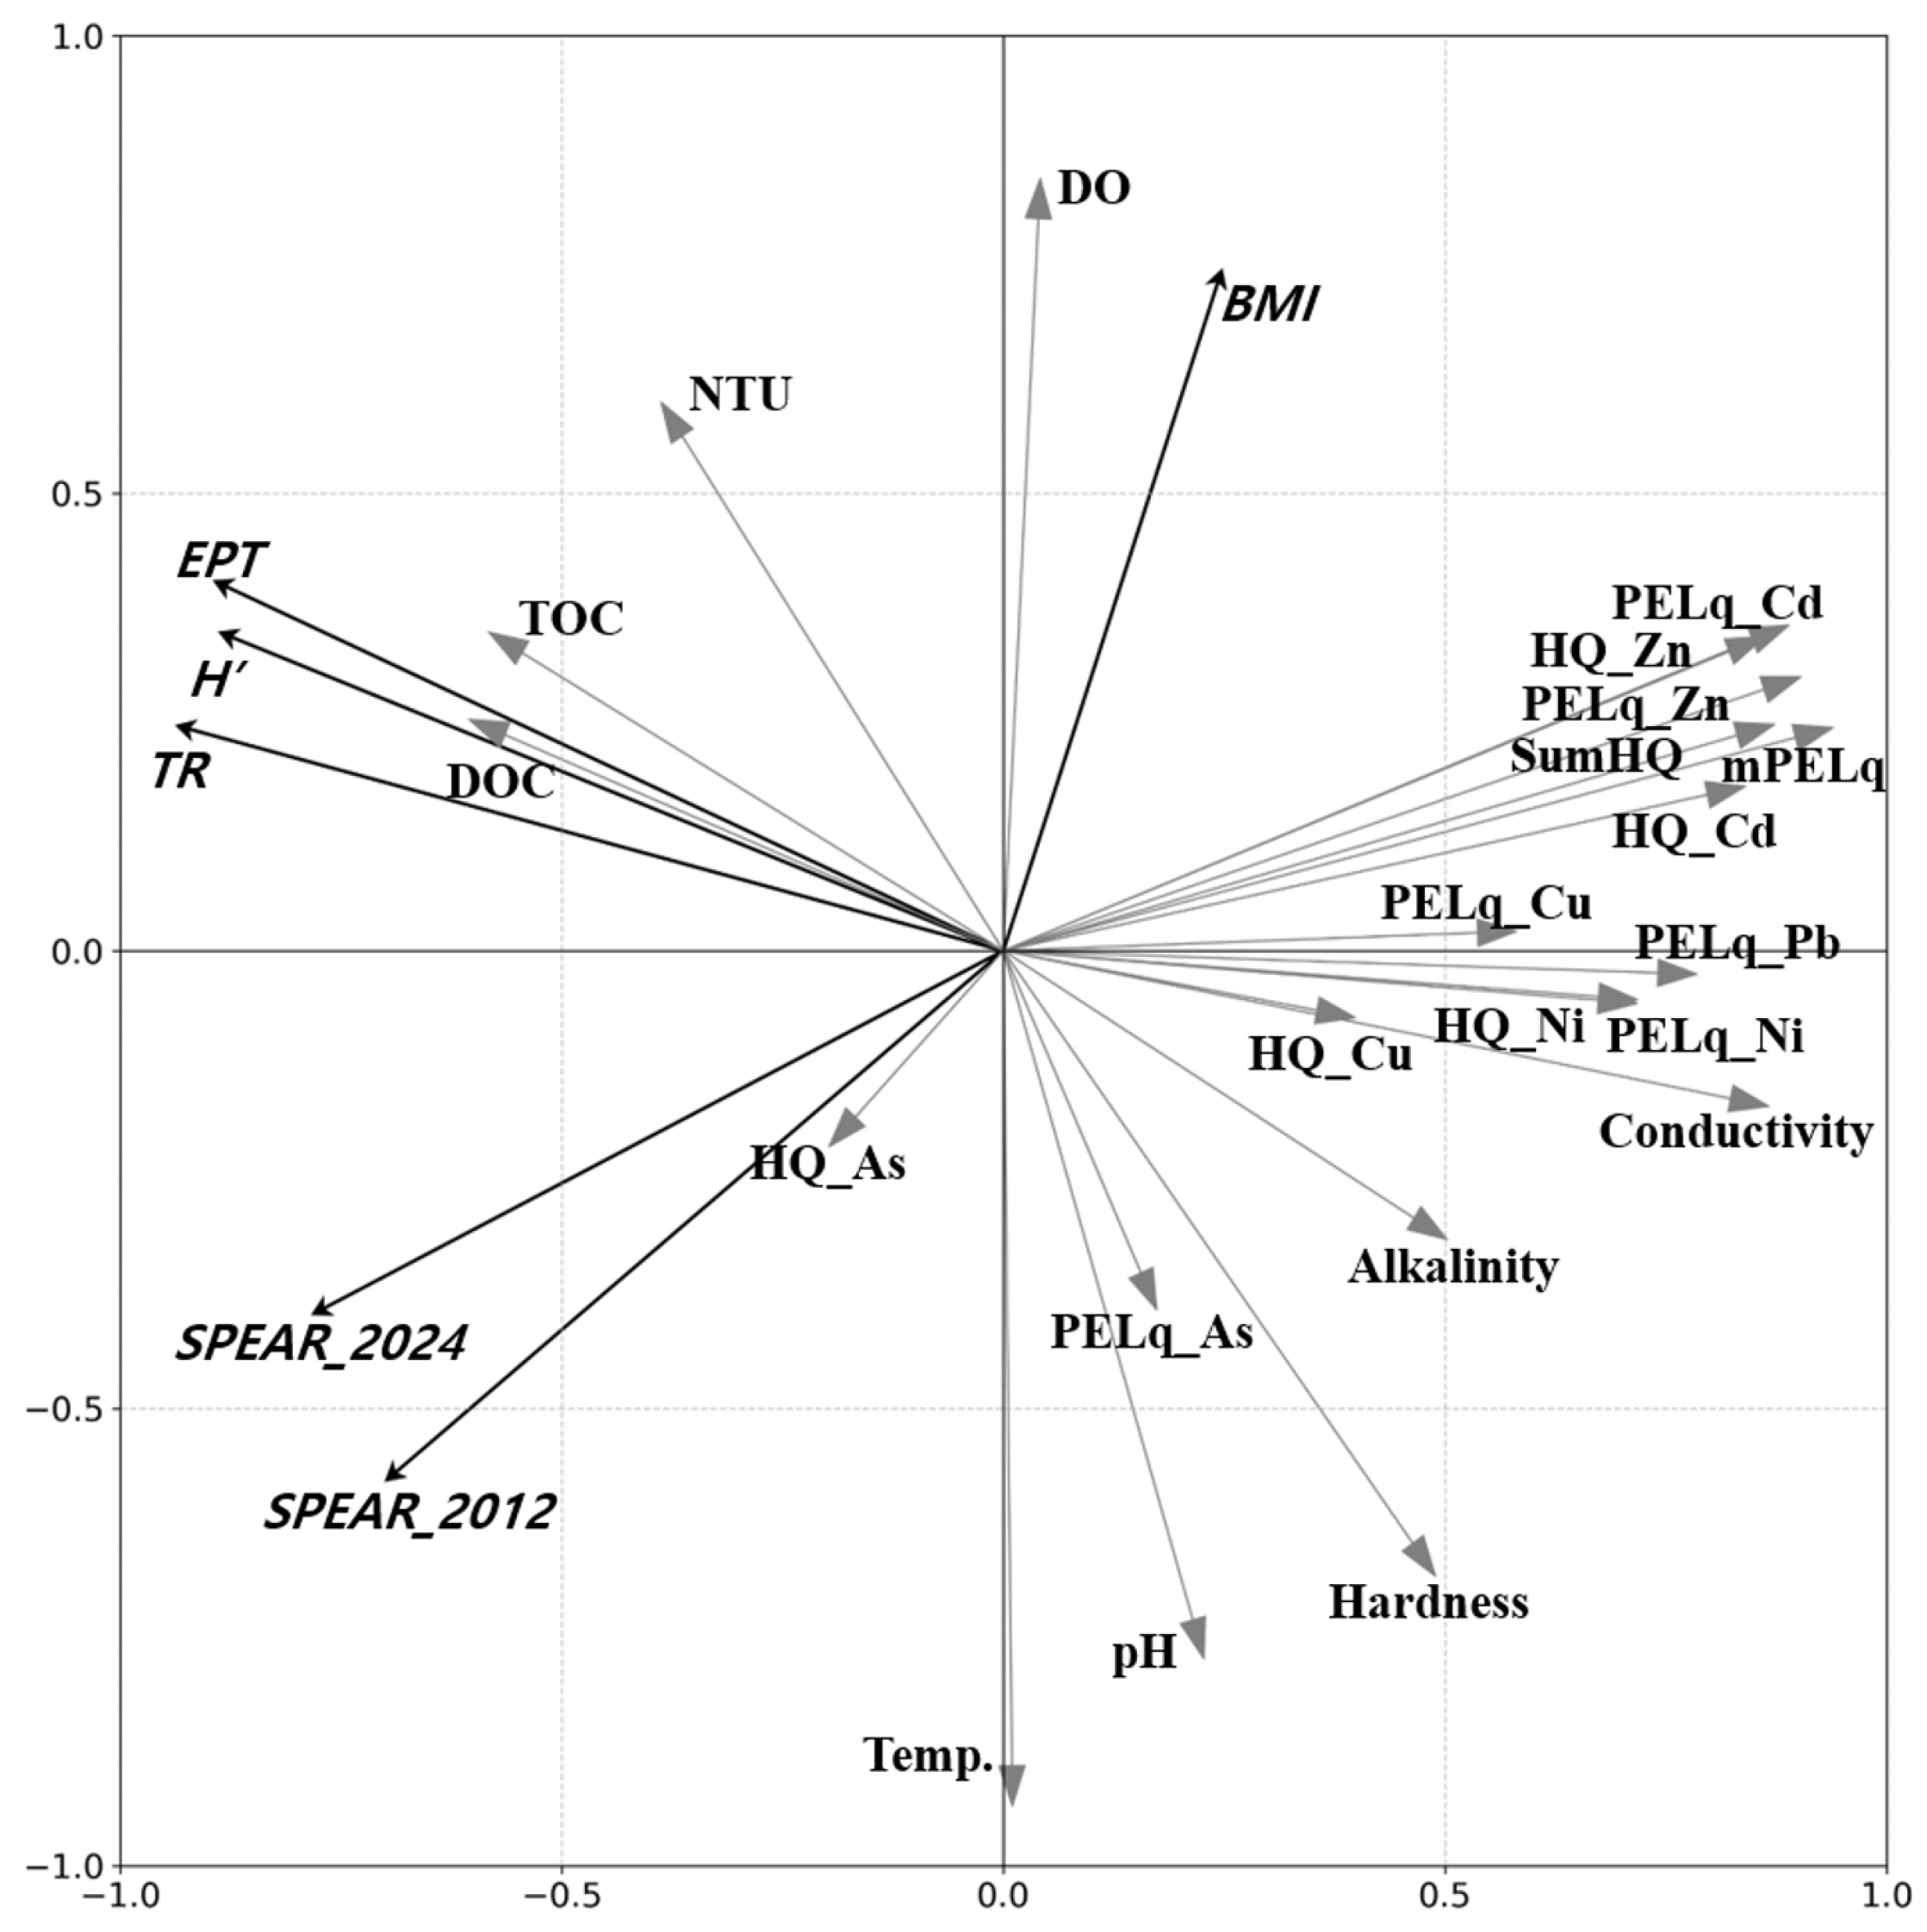
3.5. Multivariate Statistical Analysis to Analyze the Association Between Environmental Factors and Community Indices

Principal component analysis (PCA) was employed to elucidate the associations between environmental factors and community indices. Figure 6 presents the ordination plots from the PCA, illustrating the relationships between ecological indices and environmental factors for the total samples from the main stream and tributaries [8]. This visual representation aids in the interpretation of the complex interactions between various environmental parameters and community indices in the studied ecosystem. These findings highlight the value of using multiple indices, including both generic and stressor-specific indicators like SPEAR, in comprehensively assessing the ecological impacts of metal contamination in aquatic ecosystems.
The first principal component (PC1) demonstrated strong negative associations with most community indices, except for the BMI. PC1 also showed negative correlations with metal contamination indicators, with the exception of As, and with conductivity. Notably, the BMI did not show a significant association with PC1, suggesting its independence from metal contamination effects.
The second principal component (PC2) exhibited a strong positive association with the BMI and weak positive associations with other community indices. Interestingly, generic community indices (TR, EPT, and H’) showed weak positive associations with PC2, while SPEAR indices demonstrated weak negative relationships. PC2 was positively correlated with dissolved oxygen (DO) and turbidity (NTU), and weakly associated with total organic carbon (TOC), dissolved organic carbon (DOC), Cd (both HQ-Cd and PELq-Cd), Zn (both HQ-Zn and PELq-Zn), Σ HQ, and mPELq. Conversely, PC2 showed negative relationships with temperature, pH, and water hardness.
The PCA results also revealed that metal contamination, particularly by Cd and Zn, had weak negative relationships with SPEAR indices but weak positive relationships with other community indices. This differential response highlights the specificity of the SPEAR indices in detecting metal contamination effects.
In summary, the multivariate analysis yielded the following key findings: (1) The BMI did not show any correlation with metal contamination, but positive correlations with NTU and DO, weak positive associations with DOC and TOC, and negative correlations with temperature, pH, and water hardness. (2) Other community indices (TR, EPT, and H’) were associated with metal contamination as well as conductivity and alkalinity. (3) SPEAR indices demonstrated strong associations with metal contamination, particularly with Cd and Zn. The main stressors, such as Cd and Zn, showed stronger associations with SPEAR indices compared to generic community indices, underscoring the specificity of the SPEAR index in detecting metal contamination effects.

4. Discussion

This study provides a comparative analysis of two fundamental approaches to assessing ecological risks from metal contamination: toxicological methods and eco-epidemiological techniques. Each method offers distinct advantages that, when integrated, allow for a more comprehensive understanding of how metal pollution affects aquatic ecosystems [39,40].
Toxicological approaches, such as the calculation of HQs based on controlled experiments, offer predictive insights into ecological impacts through dose–response relationships. While these methods are powerful for identifying potential risks, they may not fully account for the complex, real-world interactions among multiple stressors [39,41].
Eco-epidemiological methods, on the other hand, provide a retrospective perspective by focusing on the observed ecological state of ecosystems affected by contamination. These approaches, particularly through the use of bioindicators, can directly reflect the cumulative impact of stressors like metals on community structure and function [15,16,33,42].
Trait-based bioindicators, such as the SPEAR index, add significant value to eco-epidemiol-ogical methods by targeting species traits sensitive to specific stressors. The SPEAR index has been shown to offer a more precise and focused diagnosis of metal-induced effects in aquatic ecosystems. However, limitations exist, particularly the potential for confounding factors, such as the presence of other pollutants or environmental variables, that could obscure the association between metal exposure and ecological impact [15,16].
The application of the SPEAR index for metals in the upper Nakdong River watershed provided significant insights into ecosystem responses to metal contamination. Both existing and updated SPEAR m e t a l indices showed robust associations with metal contamination levels in water (HQ) and sediment (mPELq) (Figure 4). Notably, this study is the first to demonstrate a correlation between the SPEAR m e t a l index and metal contamination in water and sediment, expanding the index’s utility beyond water column assessments. This relationship suggests that the SPEAR m e t a l index is sensitive to integrated metal exposure effects from both water and sediment compartments, reflecting long-term exposure and bioaccumulation processes.
These findings underscore the robustness of the SPEAR m e t a l index as an indicator of metal contamination across different environmental compartments, enhancing its ecological relevance and potential for holistic ecosystem health assessment. The index’s ability to bridge the gap between chemical monitoring data and ecological effects offers a more integrative approach to assessing metal impacts in aquatic ecosystems. Further research is needed to explore the mechanistic basis of the relationship between the SPEAR m e t a l index and sediment contamination, and to validate these findings across diverse aquatic ecosystems with varying sediment characteristics and metal contamination profiles.
The updated metal sensitivity database, encompassing a substantial portion of families in the study area, enhanced the index’s sensitivity (Figure 4). This improvement allowed for the detection of subtle shifts in community structure, which is crucial for early warning in environmental monitoring programs. A key finding was that calculating the SPEAR index separately for main streams and tributaries increased its sensitivity and diagnostic power. This result underscores the importance of considering habitat-specific variations when applying ecological indices, aligning with research advocating for the subdivision of study areas based on ecological or hydrological characteristics [38].
To elucidate the complex interactions between various environmental factors and metal contamination, principal component analysis (PCA) was employed. This multivariate approach revealed intricate relationships between metal contamination and other environmental variables, providing a more comprehensive understanding of how multiple factors shape aquatic community structures [43,44].
The study highlights the importance of incorporating uncertainty analysis in the application of the SPEAR index. Reporting the percentage of family coverage in the watershed would provide transparency and improve decision-making regarding the index’s reliability in different ecological contexts [15].
Interestingly, the predator ratio, previously proposed as a diagnostic tool for metal contamination, did not correlate with either the SPEAR index or the sum of hazard quotients. This discrepancy suggests that different bioindicators may respond differently depending on the ecosystem and stressor types, reinforcing the need for multiple lines of evidence in ecological assessments [2,45].
While the SPEAR index performed well in this study, the homogeneity of water chemistry across the watershed may have limited the role of metal bioavailability. This observation suggests the need for further validation in watersheds with more varied physicochemical conditions [46].
Future research directions should focus on validating the SPEAR index across watersheds with diverse habitat conditions, water chemistry profiles, and baseline community structures. Investigating the relationship between metal bioavailability and SPEAR index performance in different chemical environments, such as those with varying pH or dissolved organic carbon levels, would offer valuable insights. Furthermore, integrating the SPEAR index with other ecological indicators could yield a more holistic assessment of ecosystem health, potentially leading to the development of multi-metric indices that are more adaptable to specific environmental contexts.

5. Conclusions

This study demonstrates that the SPEAR index for metals is an effective and sensitive tool for evaluating the ecological impacts of metal contamination in aquatic ecosystems. The index’s strong correlation with metal exposure concentrations and its ability to detect subtle changes in community structure make it a valuable bioindicator for environmental monitoring, particularly in watersheds impacted by multiple pollution sources such as zinc smelting and mining activities. While the SPEAR index has shown significant potential, further research is needed to validate its applicability across diverse environmental conditions. The findings underscore the importance of refining the index for use in varied ecological contexts and integrating it with other ecological indicators to create a more comprehensive tool for ecological risk assessment. Ultimately, the development and application of such refined bioindicators will enhance our ability to monitor, assess, and manage metal contamination in aquatic ecosystems more effectively.

Supplementary Materials

The following supporting information can be downloaded at: https://www.mdpi.com/article/10.3390/w16223308/s1, Table S1: Summary of acute toxicity test results for selected freshwater species exposed to copper; Table S2: Summary of results for the fixed factors of the mixed-effect model; Table S3: Physiological sensitivity values for As, Cd, Co, Cr, Cu, Fe, Hg, Ni, Pb, Se, and Zn for each taxonomic level; Table S4: Summary of site-specific environmental parameters, macroinvertebrate community indices, and toxicity values in the upper Nakdong River; Table S5: Information on benthic macroinvertebrate species found in the upper Nakdong River; Figure S1: Pairwise mean comparison of physiological sensitivity values for each taxon of the eleven heavy metals expressed as S A s , S C d , S C o , S C r , S C u , S F e , S H g , S N i , S P b , S S e , and S Z n . Histograms display the distribution of standardized sensitivity values for each heavy metal. The upper panel shows the Pearson correlation coefficient (r) and the number of pairwise comparisons (n), while the lower panel presents the plotted values for each pair of heavy metals. References [15,22,26,28,47,48,49,50,51,52] are cited in the Supplementary Materials.

Author Contributions

D.-s.H. conceived the study, developed the methodology, performed formal analysis, wrote the original draft, and created the visualizations. J.K. conducted data analysis, performed statistical analysis, and contributed to the creation of visualizations. J.C. performed ecotoxicological tests, analyzed data, and contributed to the creation of visualizations. J.L. contributed to the methodology, conducted formal analysis, and reviewed and edited the manuscript. All authors have read and agreed to the published version of the manuscript.

Funding

This research was supported by the Environmental Technology Development Project (R&D) for securing water ecosystem health of the Korea Environment Industry & Technology Institute (KEITI). (Ministry of Environment R&D project number: 2022003050005).

Data Availability Statement

The data and source code for statistical analyses that support the findings of this study are available from the corresponding authors upon reasonable request.

Conflicts of Interest

Dae-sik Hwang, Jongwoo Kim, Jiwoong Chung, and Jong-Hyeon Lee are employees of EH R&C Co., Ltd. The paper reflects the views of the scientists and not the company.

Appendix A. Detailed Results of Data Analysis for Individual Metals

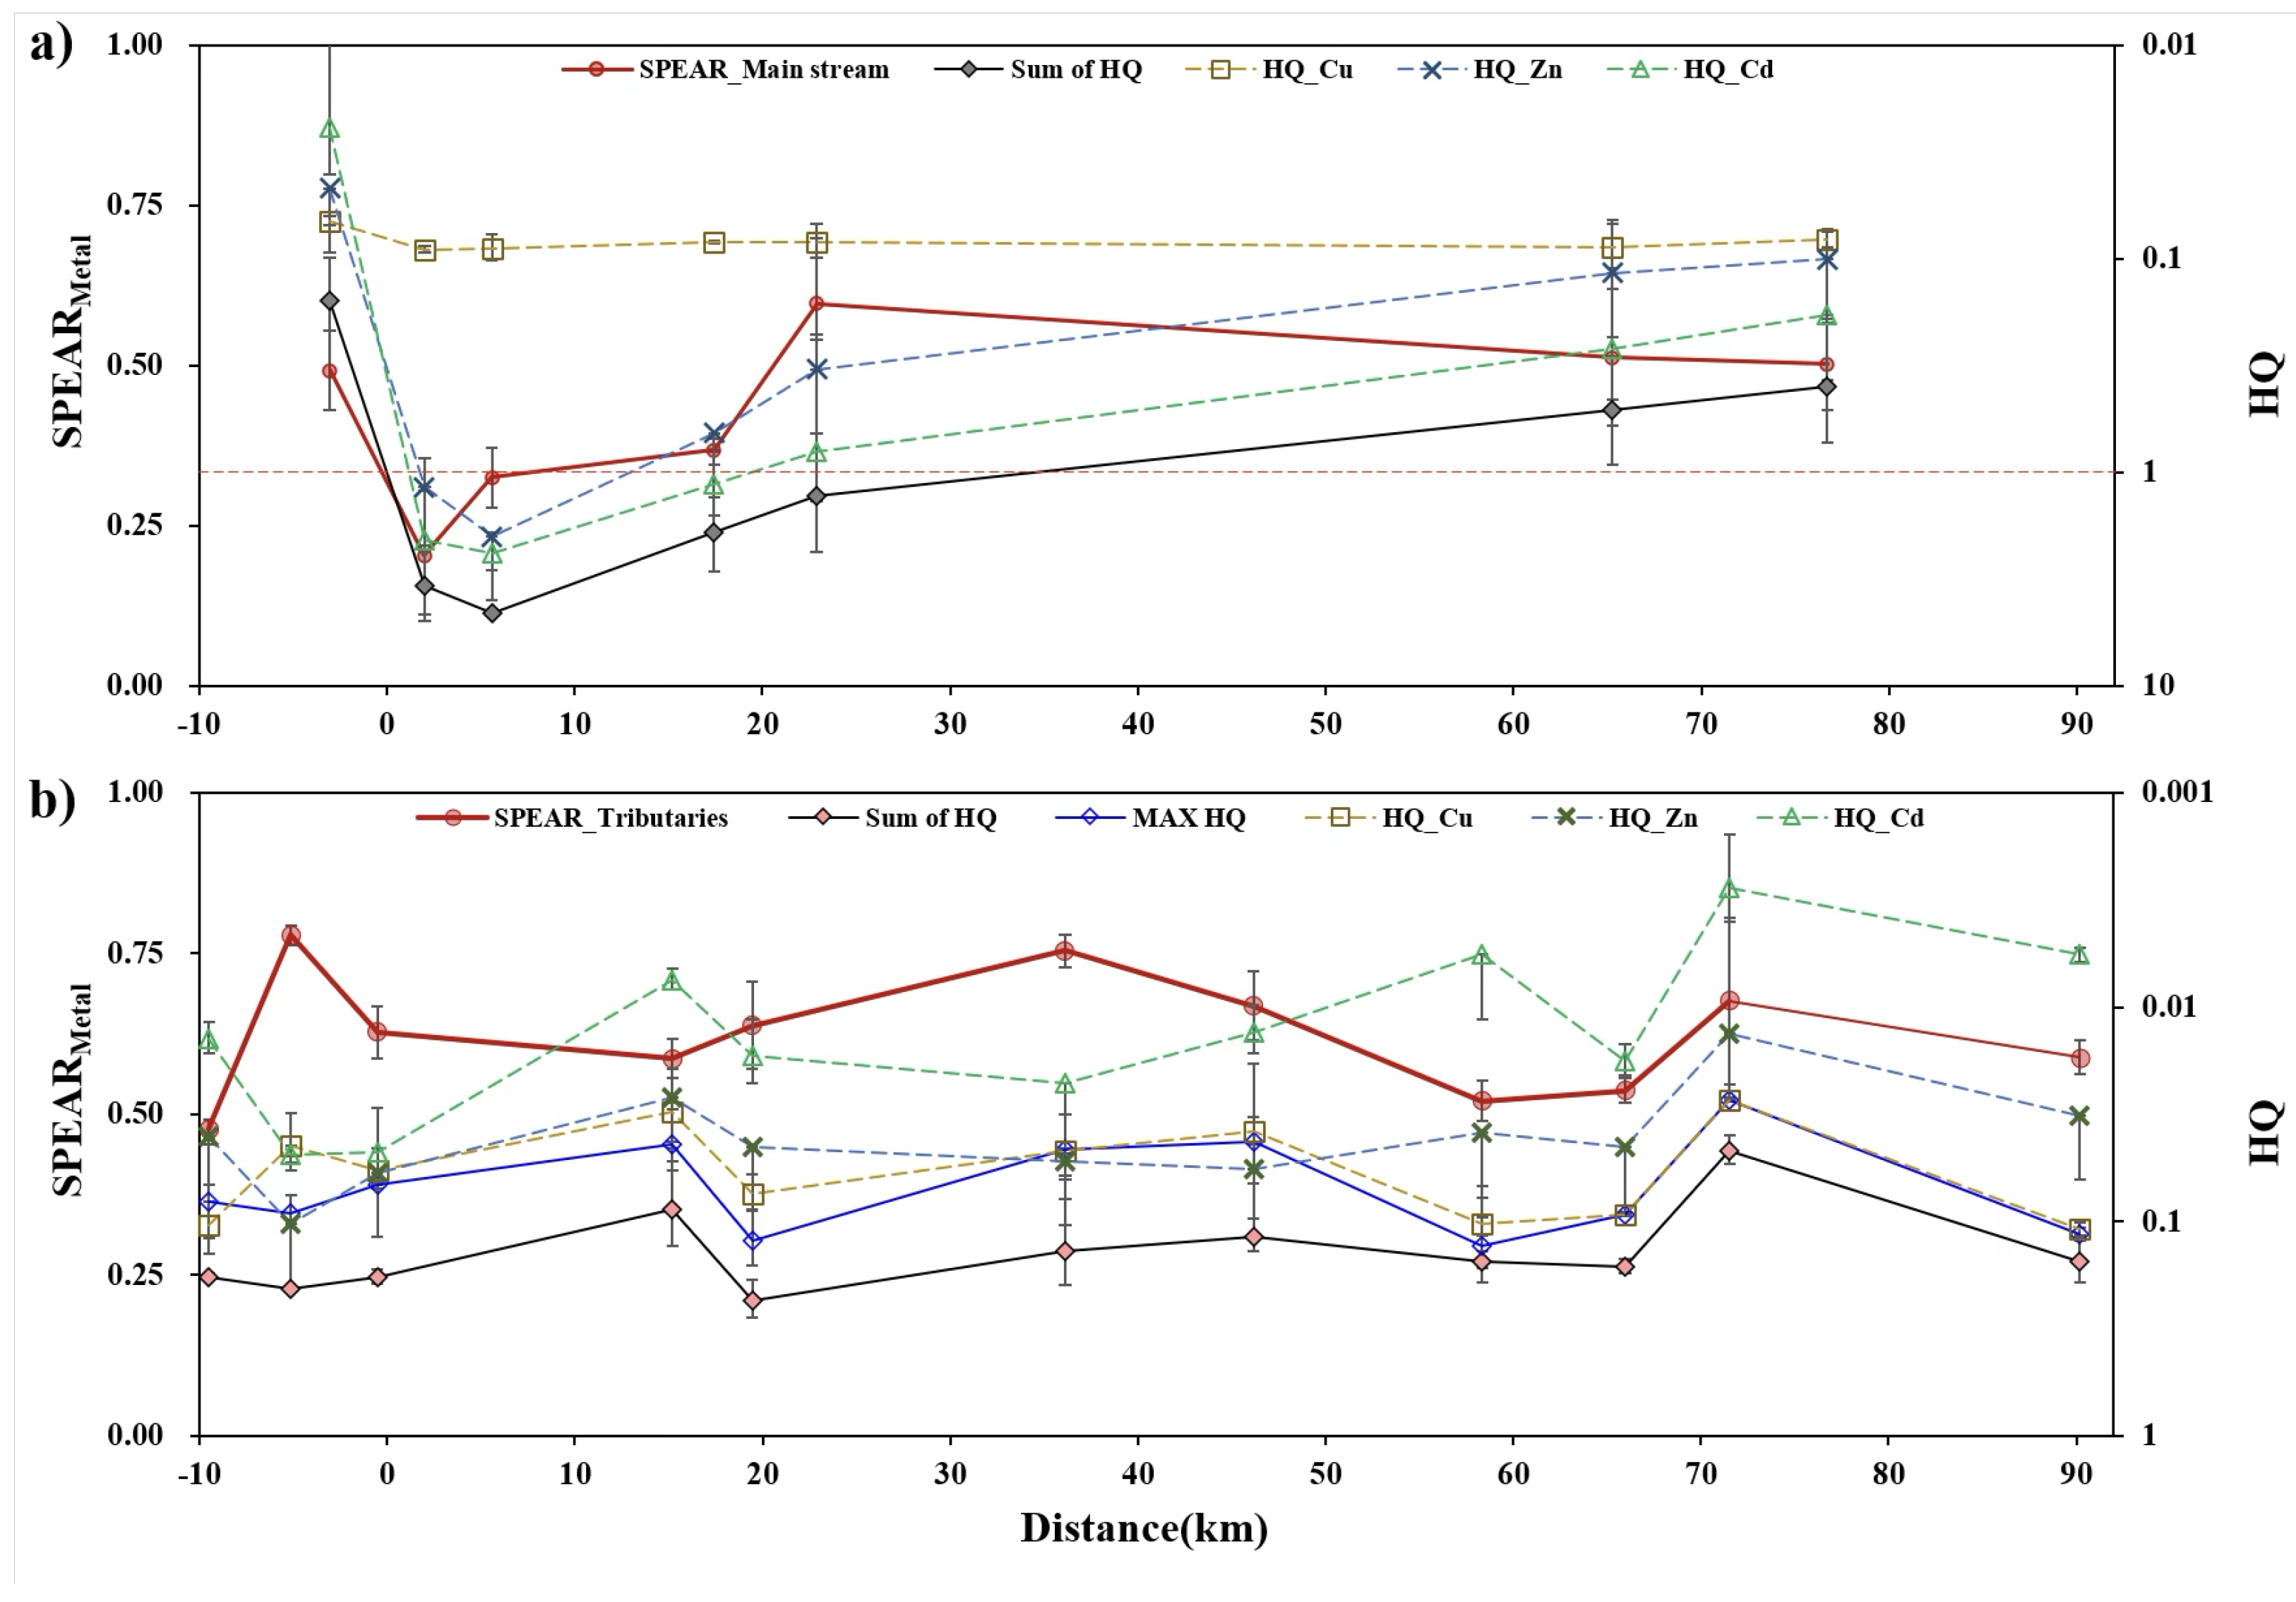
Appendix A.1. Gradient of Metal Concentration and SPEAR Index for Metals in the Main Stream and Tributaries

Figure A1. Gradient of metal concentration (Cu, Zn, and Cd) and the SPEAR index for metals ( SPEAR m e t a l ) (a) Main stream sites and (b) tributary sites in the upper Nakdong River.
Water 16 03308 g0a1

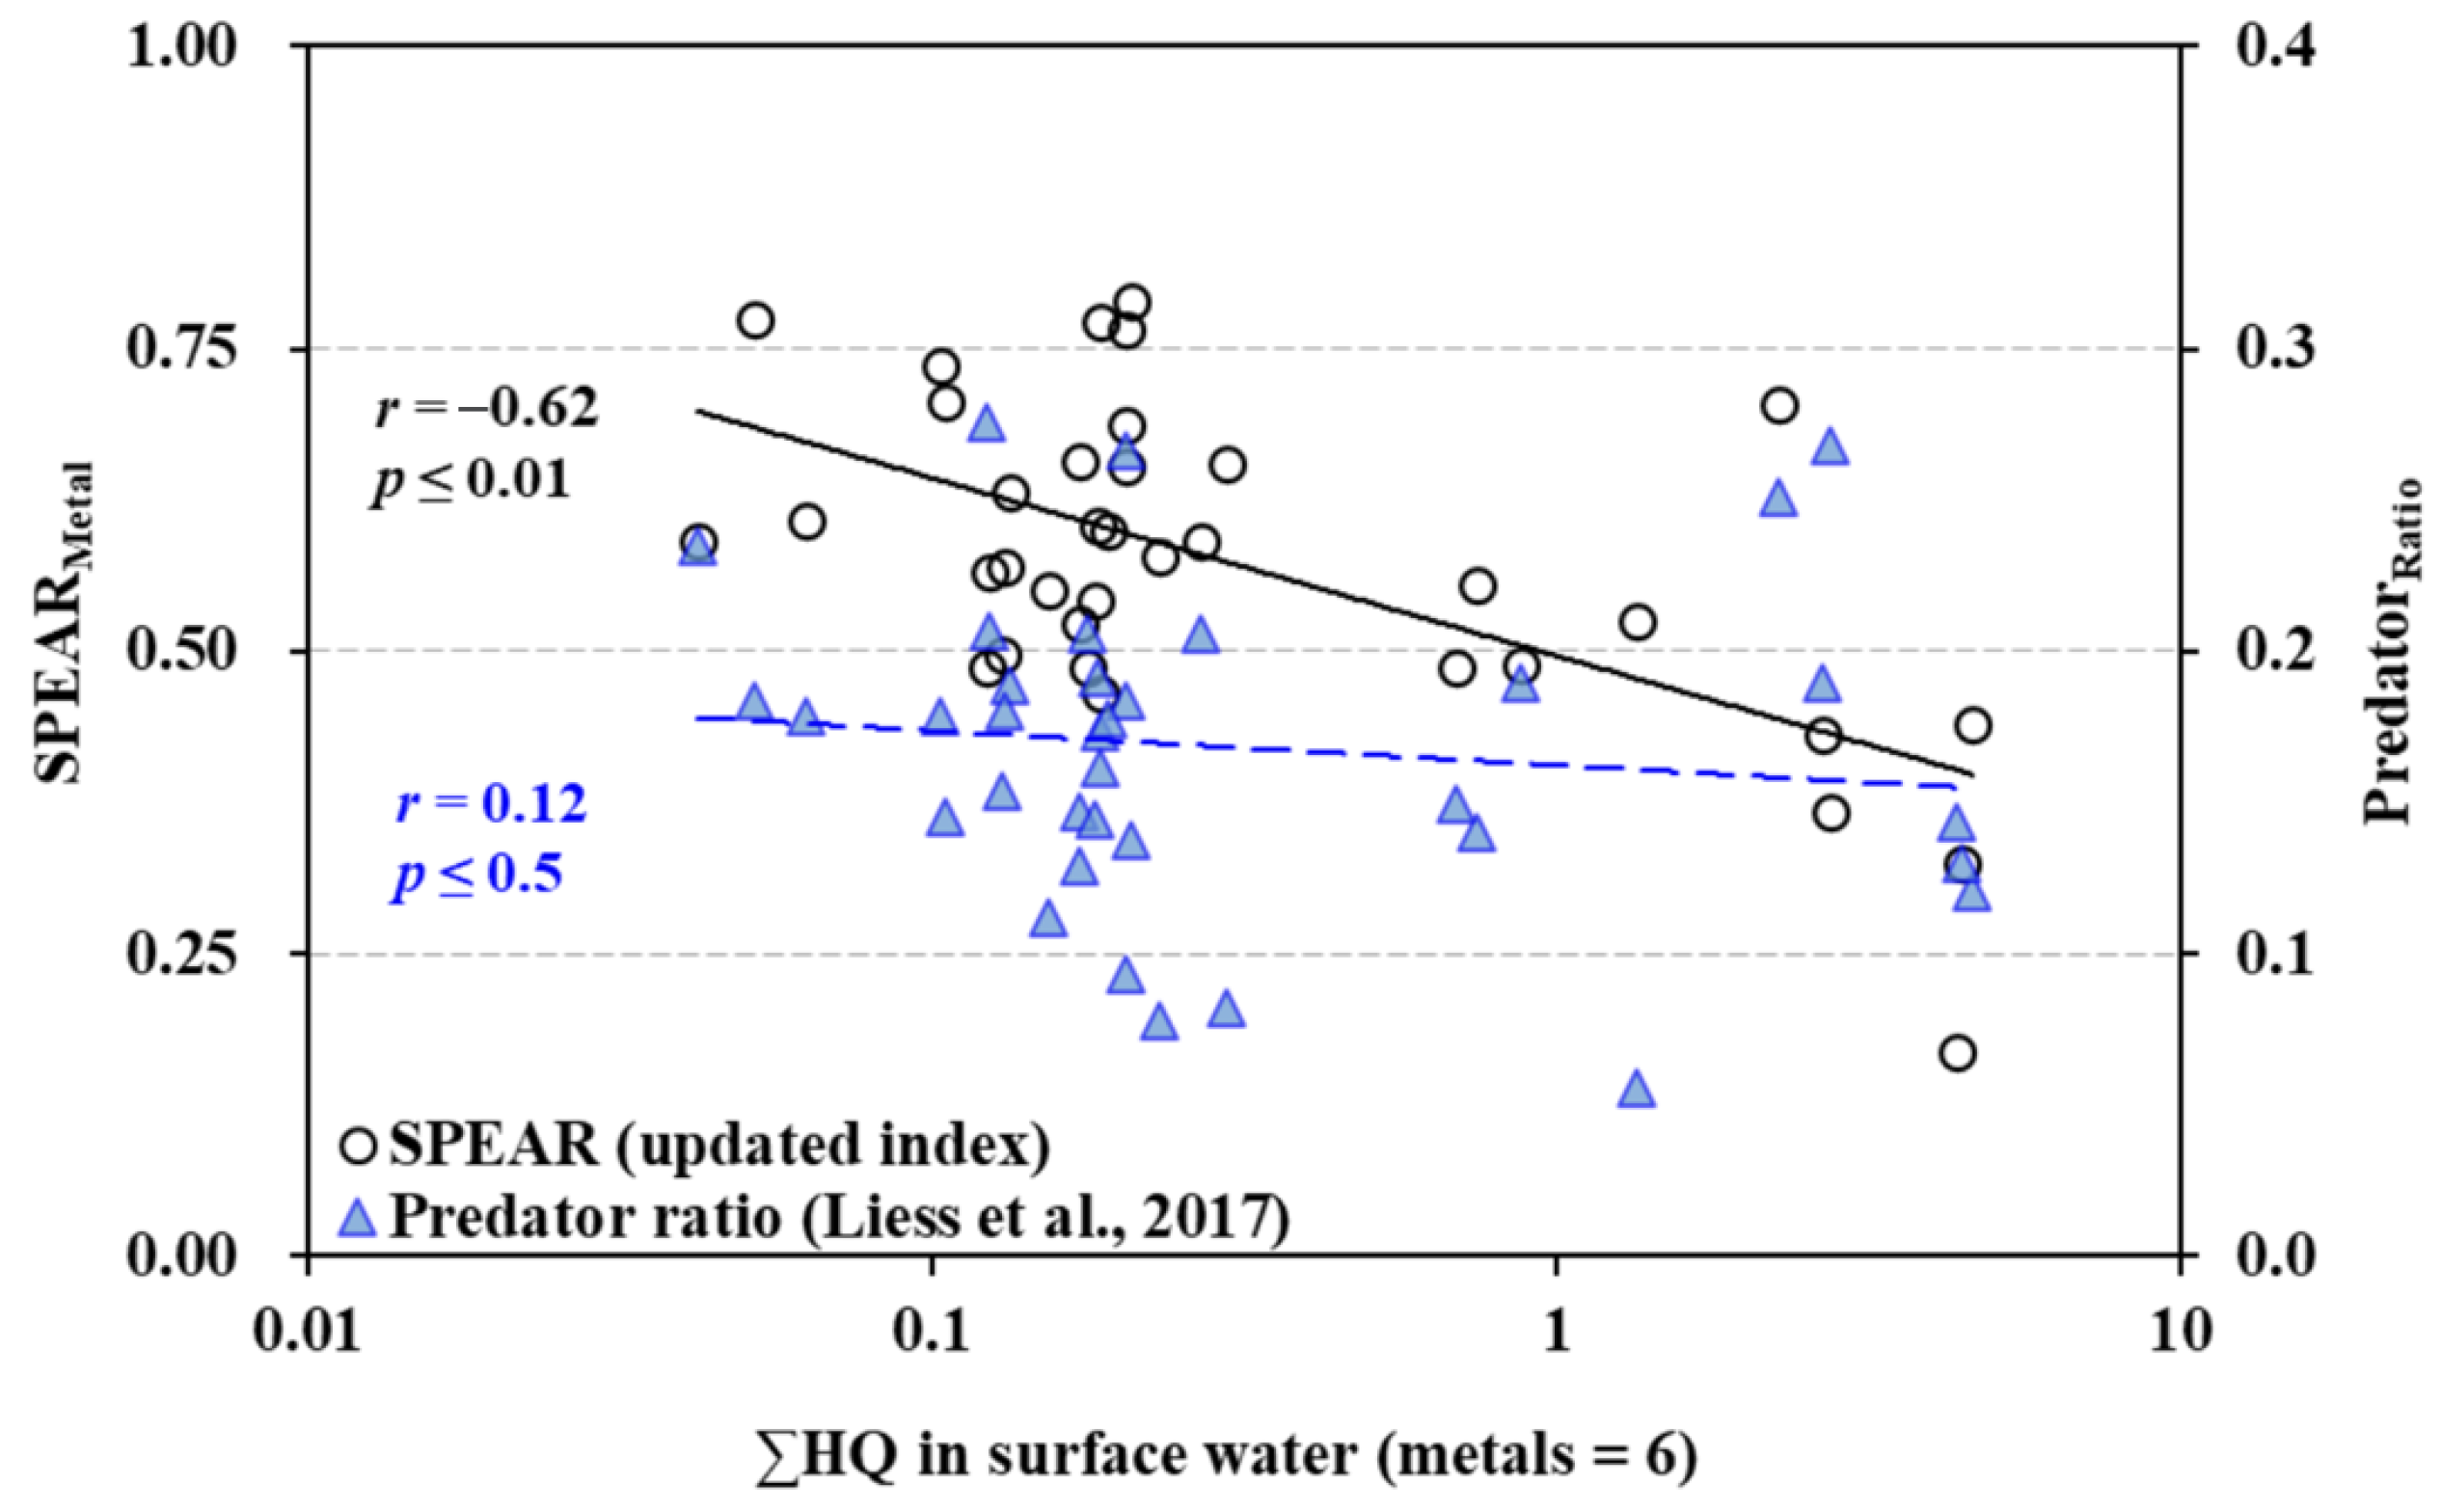
Appendix A.2. Relationship of the Sum of Toxic Units and SPEAR Index for Metals and Predator Ratio

Figure A2. Relationship of the sum of toxic units and SPEAR index for metals and predator ratio [16].
Water 16 03308 g0a2

References

  1. Suter, G.W., II; Norton, S.B.; Cormier, S.M. A methodology for inferring the causes of observed impairments in aquatic ecosystems. Environ. Toxicol. Chem. 2000, 19, 1089–1098. [Google Scholar] [CrossRef]
  2. Burton, G.A., Jr.; Chapman, P.M.; Smith, E.P. Weight-of-evidence approaches for assessing ecosystem impairment. Hum. Ecol. Risk Assess. 2002, 8, 1657–1673. [Google Scholar] [CrossRef]
  3. Cormier, S.M.; Suter, G.W. A framework for fully integrating environmental assessment. Environ. Manag. 2008, 42, 543–556. [Google Scholar] [CrossRef] [PubMed]
  4. Posthuma, L.; Dyer, S.D.; de Zwart, D.; Kapo, K.; Holmes, C.M.; Burton, G.A., Jr. Eco-epidemiology of aquatic ecosystems: Separating chemicals from multiple stressors. Sci. Total Environ. 2016, 573, 1303–1319. [Google Scholar] [CrossRef]
  5. Suter, G.W.; Cormier, S.M. Why and how to combine evidence in environmental assessments: Weighing evidence and building cases. Sci. Total Environ. 2011, 409, 1406–1417. [Google Scholar] [CrossRef]
  6. Magurran, A.E. Measuring Biological Diversity; John Wiley & Sons: Oxford, UK, 2013. [Google Scholar]
  7. Mouillot, D.; Graham, N.A.J.; Villéger, S.; Mason, N.W.H.; Bellwood, D.R. A functional approach reveals community responses to disturbances. Trends Ecol. Evol. 2013, 28, 167–177. [Google Scholar] [CrossRef]
  8. Liess, M.; Von Der Ohe, P.C. Analyzing effects of pesticides on invertebrate communities in streams. Environ. Toxicol. Chem. 2005, 24, 954–965. [Google Scholar] [CrossRef]
  9. Beketov, M.A.; Liess, M. An indicator for effects of organic toxicants on lotic invertebrate communities: Independence of confounding environmental factors over an extensive river continuum. Environ. Pollut. 2008, 156, 980–987. [Google Scholar] [CrossRef]
  10. Beketov, M.; Foit, K.; Schäfer, R.; Schriever, C.; Sacchi, A.; Capri, E.; Biggs, J.; Wells, C.; Liess, M. SPEAR indicates pesticide effects in streams—Comparative use of species-and family-level biomonitoring data. Environ. Pollut. 2009, 157, 1841–1848. [Google Scholar] [CrossRef]
  11. Stark, J.D.; Maxted, J.R. A User Guide for the Macroinvertebrate Community Index; Prepared for the Ministry for the Environment; Cawthron Report 1166; Cawthron Institute: Nelson, New Zealand, 2007. [Google Scholar]
  12. Jun, Y.C.; Won, D.H.; Lee, S.H.; Kong, D.S.; Hwang, S.J. A multimetric benthic macroinvertebrate index for the assessment of stream biotic integrity in Korea. Int. J. Environ. Res. Public Health 2012, 9, 3599–3628. [Google Scholar] [CrossRef]
  13. Kong, D.; Son, S.H.; Hwang, S.J.; Won, D.H.; Kim, M.C.; Park, J.H.; Jeon, T.S.; Lee, J.E.; Kim, J.H.; Kim, J.S.; et al. Development of benthic macroinvertebrates index (BMI) for biological assessment on stream environment. J. Korean Soc. Water Environ. 2018, 34, 183–201. [Google Scholar]
  14. Culp, J.M.; Armanini, D.G.; Dunbar, M.J.; Orlofske, J.M.; Poff, N.L.; Pollard, A.I.; Yates, A.G.; Hose, G.C. Incorporating traits in aquatic biomonitoring to enhance causal diagnosis and prediction. Integr. Environ. Assess. Manag. 2011, 7, 187–197. [Google Scholar] [CrossRef] [PubMed]
  15. Malaj, E.; Grote, M.; Schäfer, R.B.; Brack, W.; von der Ohe, P.C. Physiological sensitivity of freshwater macroinvertebrates to heavy metals. Environ. Toxicol. Chem. 2012, 31, 1754–1764. [Google Scholar] [CrossRef]
  16. Liess, M.; Gerner, N.V.; Kefford, B.J. Metal toxicity affects predatory stream invertebrates less than other functional feeding groups. Environ. Pollut. 2017, 227, 505–512. [Google Scholar] [CrossRef]
  17. Pandey, L.K.; Park, J.; Son, D.H.; Kim, W.; Islam, M.S.; Choi, S.; Lee, H.; Han, T. Assessment of metal contamination in water and sediments from major rivers in South Korea from 2008 to 2015. Sci. Total Environ. 2019, 651, 323–333. [Google Scholar] [CrossRef]
  18. Yang, H.J.; Bong, K.M.; Kang, T.W.; Hwang, S.H.; Na, E.H. Assessing heavy metals in surface sediments of the Seomjin River Basin, South Korea, by statistical and geochemical analysis. Chemosphere 2021, 284, 131400. [Google Scholar] [CrossRef] [PubMed]
  19. Park, J.; Lee, S.; Lee, E.; Noh, H.; Seo, Y.; Lim, H.; Shin, H.; Lee, I.; Jung, H.; Na, T.; et al. Probabilistic ecological risk assessment of heavy metals using the sensitivity of resident organisms in four Korean rivers. Ecotoxicol. Environ. Saf. 2019, 183, 109483. [Google Scholar] [CrossRef]
  20. Yanagihara, M.; Hiki, K.; Iwasaki, Y. Which distribution to choose for deriving a species sensitivity distribution? Implications from analysis of acute and chronic ecotoxicity data. Ecotoxicol. Environ. Saf. 2024, 278, 116379. [Google Scholar] [CrossRef]
  21. OECD. Test No. 203: Fish, acute toxicity test. In OECD Guidelines for the Testing of Chemicals, Section 2; Organisation for Economic Co-operation and Development: Paris, France, 1992; pp. 1–24. [Google Scholar]
  22. OECD. Test No. 202: Daphnia sp., acute immobilisation test. In OECD Guidelines for the Testing of Chemicals, Section 2; Organisation for Economic Co-operation and Development: Paris, France, 1975; p. 12. [Google Scholar]
  23. Greve, G.D.; Van der Geest, H.G.; Stuijfzand, S.C.; Engels, S.; Kraak, M.H. Development of ecotoxicity tests using laboratory reared larvae of the riverine caddisflies Hydropsyche angustipennis and Cyrnus trimaculatus. In Proceedings of the Section Experimental and Applied Entomology of the Netherlands Entomological Society (N. E. V.), Amsterdam, The Netherlands, 1998; Volume 9, pp. 205–210. [Google Scholar]
  24. Greve, G.D.; Van der Geest, H.G.; Stuijfzand, S.C.; Kureck, A.; Kraak, M.H. Development and validation of an ecotoxicity test using field collected eggs of the riverine mayfly Ephoron virgo. Proc. Sect. Exp. Appl. Entomol. Neth. Entomol. Soc. (Nev) 1999, 10, 105–110. [Google Scholar]
  25. Edition, F. Methods for Measuring the Acute Toxicity of Effluents and Receiving Waters to Freshwater and Marine Organisms; US Environmental Protection Agenc y US EPA: Washington, DC, USA, 2002. [Google Scholar]
  26. ASTM E 2122-01; Standard Guide for Conducting In-situ Field Bioassays With Marine, Estuarine, and Freshwater Bivalves. American Society for Testing and Materials (ASTM): West Conshohocken, PA, USA, 2001.
  27. Test Guidelines OPPTS 850.1035; Mysid Acute Toxicity Test. Office of Prevention, Pesticides and Toxic Substances. United States Environmental Protection Agency (US EPA): Washington, DC, USA, 1996.
  28. Test Guidelines OCSPP 850.1020; Gammarid Amphipod Acute Toxicity Test. Office of Chemical Safety and Pollution Prevention, United States Environmental Protection Agency (US EPA): Washington, DC, USA, 2016.
  29. Chung, J.; Kim, S.H.; Hwang, D.S.; Sung, C.G.; Moon, S.D.; Kim, C.; Choi, M.; Lee, J.H. Integrated Chemical and Ecotoxicological Assessment of Metal Contamination in the Andong Watershed: Identifying Key Toxicants and Ecological Risks. Water 2024, 16, 3176. [Google Scholar] [CrossRef]
  30. Survey and Evaluation Method for River and Stream Ecosystem Health Assessment; Technical Report; National Institute of Environmental Research (NIER): Incheon, Republic of Korea, 2024.
  31. Stephan, C.E.; Mount, D.I.; Hansen, D.J.; Gentile, J.; Chapman, G.A.; Brungs, W.A. Guidelines for Deriving Numerical National Water Quality Criteria for the Protection of Aquatic Organisms and Their Uses; US Environmental Protection Agency: Washington, DC, USA, 1985. [Google Scholar]
  32. DeForest, D.K.; Van Genderen, E.J. Application of US EPA guidelines in a bioavailability-based assessment of ambient water quality criteria for zinc in freshwater. Environ. Toxicol. Chem. 2012, 31, 1264–1272. [Google Scholar] [CrossRef] [PubMed]
  33. Mebane, C.A.; Dillon, F.S.; Hennessy, D.P. Acute toxicity of cadmium, lead, zinc, and their mixtures to stream-resident fish and invertebrates. Environ. Toxicol. Chem. 2012, 31, 1334–1348. [Google Scholar] [CrossRef] [PubMed]
  34. Jin, D.R.; Lee, C.H.; Kim, C.K.; Moon, S.D.; Huh, I.A.; Kim, S.; Park, M.S.; Lee, J.H. Development and validation of freshwater sediment quality assessment guidelines for trace elements in Korea. Environ. Eng. Res. 2022, 27, 200643. [Google Scholar] [CrossRef]
  35. Lepš, J.; Šmilauer, P. Multivariate Analysis of Ecological Data Using CANOCO; Cambridge University Press: Cambridge, UK, 2003. [Google Scholar]
  36. Carter, J.L.; Resh, V.H.; Hannaford, M.J. Macroinvertebrates as biotic indicators of environmental quality. In Methods in Stream Ecology; Academic Press: London, UK, 1996; Volume 99, pp. 2230–2235. [Google Scholar] [CrossRef]
  37. Jackson, D.A. Stopping rules in principal components analysis: A comparison of heuristical and statistical approaches. Ecology 1993, 74, 2204–2214. [Google Scholar] [CrossRef]
  38. Schäfer, R.B.; von der Ohe, P.C.; Rasmussen, J.; Kefford, B.J.; Beketov, M.A.; Schulz, R.; Liess, M. Thresholds for the effects of pesticides on invertebrate communities and leaf breakdown in stream ecosystems. Environ. Sci. Technol. 2012, 46, 5134–5142. [Google Scholar] [CrossRef]
  39. Chapman, P.M. Integrating toxicology and ecology: Putting the “eco” into ecotoxicology. Mar. Pollut. Bull. 2002, 44, 7–15. [Google Scholar] [CrossRef]
  40. Suter, G.W.I. Ecological Risk Assessment and Ecological Epidemiology for Contaminated Sites. Hum. Ecol. Risk Assess. Int. J. 2006, 12, 31–38. [Google Scholar] [CrossRef]
  41. Suter, I. Toxicological Benchmarks for Screening of Potential Contaminants of Concern for Effects on Aquatic Biota on the Oak Ridge Reservation, Oak Ridge, Tennessee; Technical Report; Oak Ridge National Laboratory (ORNL): Oak Ridge, TN, USA, 1993. [Google Scholar]
  42. Malaj, E.; Guénard, G.; Schäfer, R.B.; von der Ohe, P.C. Evolutionary patterns and physicochemical properties explain macroinvertebrate sensitivity to heavy metals. Ecol. Appl. 2016, 26, 1249–1259. [Google Scholar] [CrossRef]
  43. Van den Brink, P.J.; Ter Braak, C.J.F. Principal response curves: Analysis of time-dependent multivariate responses of biological community to stress. Environ. Toxicol. Chem. 2003, 22, 511–520. [Google Scholar] [CrossRef]
  44. Clements, W.H. Integrating effects of contaminants across levels of biological organization: An overview. J. Aquat. Ecosyst. Stress Recovery 2000, 7, 113–116. [Google Scholar] [CrossRef]
  45. Clements, W.H.; Carlisle, D.M.; Lazorchak, J.M.; Johnson, P.C. Heavy metals structure benthic communities in Colorado mountain streams. Ecol. Appl. 2000, 10, 626–638. [Google Scholar] [CrossRef]
  46. Clements, W.H.; Cadmus, P.; Brinkman, S.F. Responses of aquatic insects to Cu and Zn in stream microcosms: Understanding differences between single species tests and field responses. Environ. Sci. Technol. 2010, 44, 5176–5182. [Google Scholar] [CrossRef] [PubMed]
  47. ASTM E1440-91; Standard Guide for Acute Toxicity Test with the Rotifer Brachionus. American Society for Testing and Materials (ASTM): West Conshohocken, PA, USA, 2012.
  48. ASTM E729-96; Standard Guide for Conducting Acute Toxicity Tests on Test Materials with Fishes, Macroinvertebrates, and Amphibians. American Society for Testing and Materials (ASTM): West Conshohocken, PA, USA, 2014.
  49. Brinkman, S.F.; Vieira, N.K.M. Water Pollution Studies; Job Progress Report; Federal Aid Project F-243-R14; Colorado Division of Wildlife: Fort Collins, CO, USA, 2007. [Google Scholar]
  50. Greve, G.D.; van der Geest, H.G.; Stuijfz, S.C.; Engels, A.; Kraak, M.H.S. Development of ecotoxicity tests using laboratory reared larvae of the riverine caddisflies Hydropsyche angustipennis and Cyrnus trimaculatus (Trichoptera). Proc. Sect. Exp. Appl. Entomol. Neth. Entomol. Soc. (NEV) 1998, 9, 205–210. [Google Scholar]
  51. OECD. Test No. 235: Chironomus sp., Acute Immobilisation Test. In OECD Guidelines for the Testing of Chemicals, Section 2; Organisation for Economic Co-operation and Development: Paris, France, 2011. [Google Scholar]
  52. US EPA-821-R-02-012. Methods for Measuring the Acute Toxicity of Effluents and Receiving Waters to Freshwater and Marine Organisms Fifth Edition. 2002. Available online: https://www.epa.gov/sites/default/files/2015-08/documents/acute-freshwater-and-marine-wet-manual_2002.pdf (accessed on 10 November 2024).
Figure 1. Location map of sampling stations.
Water 16 03308 g001
Figure 2. Histogram of the metal sensitivity values for the SPEAR index. The black bar and solid line were the frequency of sensitivity values using the updated ecotoxicity dataset. The red bar and solid line were the frequency of sensitivity values in the existing SPEAR index for metal [15].
Water 16 03308 g002
Figure 3. Comparison of metal sensitivity values using the existing [15] and updated (this study) SPEAR indices in the upper Nakdong River. (a) Number of macroinvertebrate families in the upper Nakdong River and those with available ecotoxicity data. (b) Scatter plots comparing metal sensitivity values between the existing and updated indices. Black dashed lines represent the median metal sensitivity of the existing index. Red dotted lines indicate the main stream, and blue dotted lines indicate the tributaries.
Water 16 03308 g003
Figure 4. Site-specific relationships between contaminant concentrations, expressed as the sum of Hazard Quotients (HQs) or the mean Probable Effect Level quotient (mPELq), and ecological indices for macroinvertebrate community structure (TR, EPT, H , BMI, and SPEAR m e t a l ) in the upper Nakdong River. Scatter plots show: (a) SPEAR m e t a l vs. Σ T U , (b) SPEAR m e t a l vs. mPELq, (c) other ecological indices vs. Σ T U , (d) ther ecological indices vs. mPELq. TR: taxon richness, H : Shannon’s diversity index, EPT: Ephemeroptera, Plecoptera, and Trichoptera taxa richness, BMI: Benthic Macroinvertebrate Index. Linear relationships between the logarithm of Σ T U and SPEAR index calculated using the existing (SPEAR-2012) and newly updated (SPEAR-2024) taxon-specific metal sensitivity. The SPEAR-2012 values were calculated for the whole dataset, but SPEAR-2024 values were calculated for the whole dataset (SPEAR-2024t) and the main stream (SPEAR-2024s), separately.
Water 16 03308 g004
Figure 5. Site-specific relationship between individual metal concentrations and the SPEAR index for metals (SPEARmetal) in the main stream of the upper Nakdong River. (a) Hazard Quotients (HQs) of Zn and Cd in surface water, and (b) Probable Effect Level quotients (PELqs) of Zn, Cd, and As in sediment, are plotted against SPEARmetal values.
Water 16 03308 g005
Figure 6. Ordination plot for the principal component analysis of the ecological indices and environmental factors projected into the ordination model for the total samples from the main stream and tributaries. TR: taxon richness, H’: Shannon’s diversity index, EPT: Ephemeroptera, Plecoptera, and Trichoptera taxa richness, BMI: Benthic Macroinvertebrate Index, SPEAR-2012: SPEAR index for the existing metal sensitivity [15], SPEAR-2024s: SPEAR indices calculated in this study, sumHQ: the sum of the hazard quotients, mPELq: mean Probable Effect Level quotient, and Temp: temperature.
Water 16 03308 g006
Disclaimer/Publisher’s Note: The statements, opinions and data contained in all publications are solely those of the individual author(s) and contributor(s) and not of MDPI and/or the editor(s). MDPI and/or the editor(s) disclaim responsibility for any injury to people or property resulting from any ideas, methods, instructions or products referred to in the content.

