

Individual Importance Classification of Urban Stormwater Channel Networks: A Novel Approach Based on Permutation and Algebraic Graph Theory

 and
and
Abstract
1. Introduction
2. Methodology
2.1. Individual Importance Classification Based on Permutation Algebraic Graph Algorithm (PAGA)
2.2. Specific Steps
3. Application
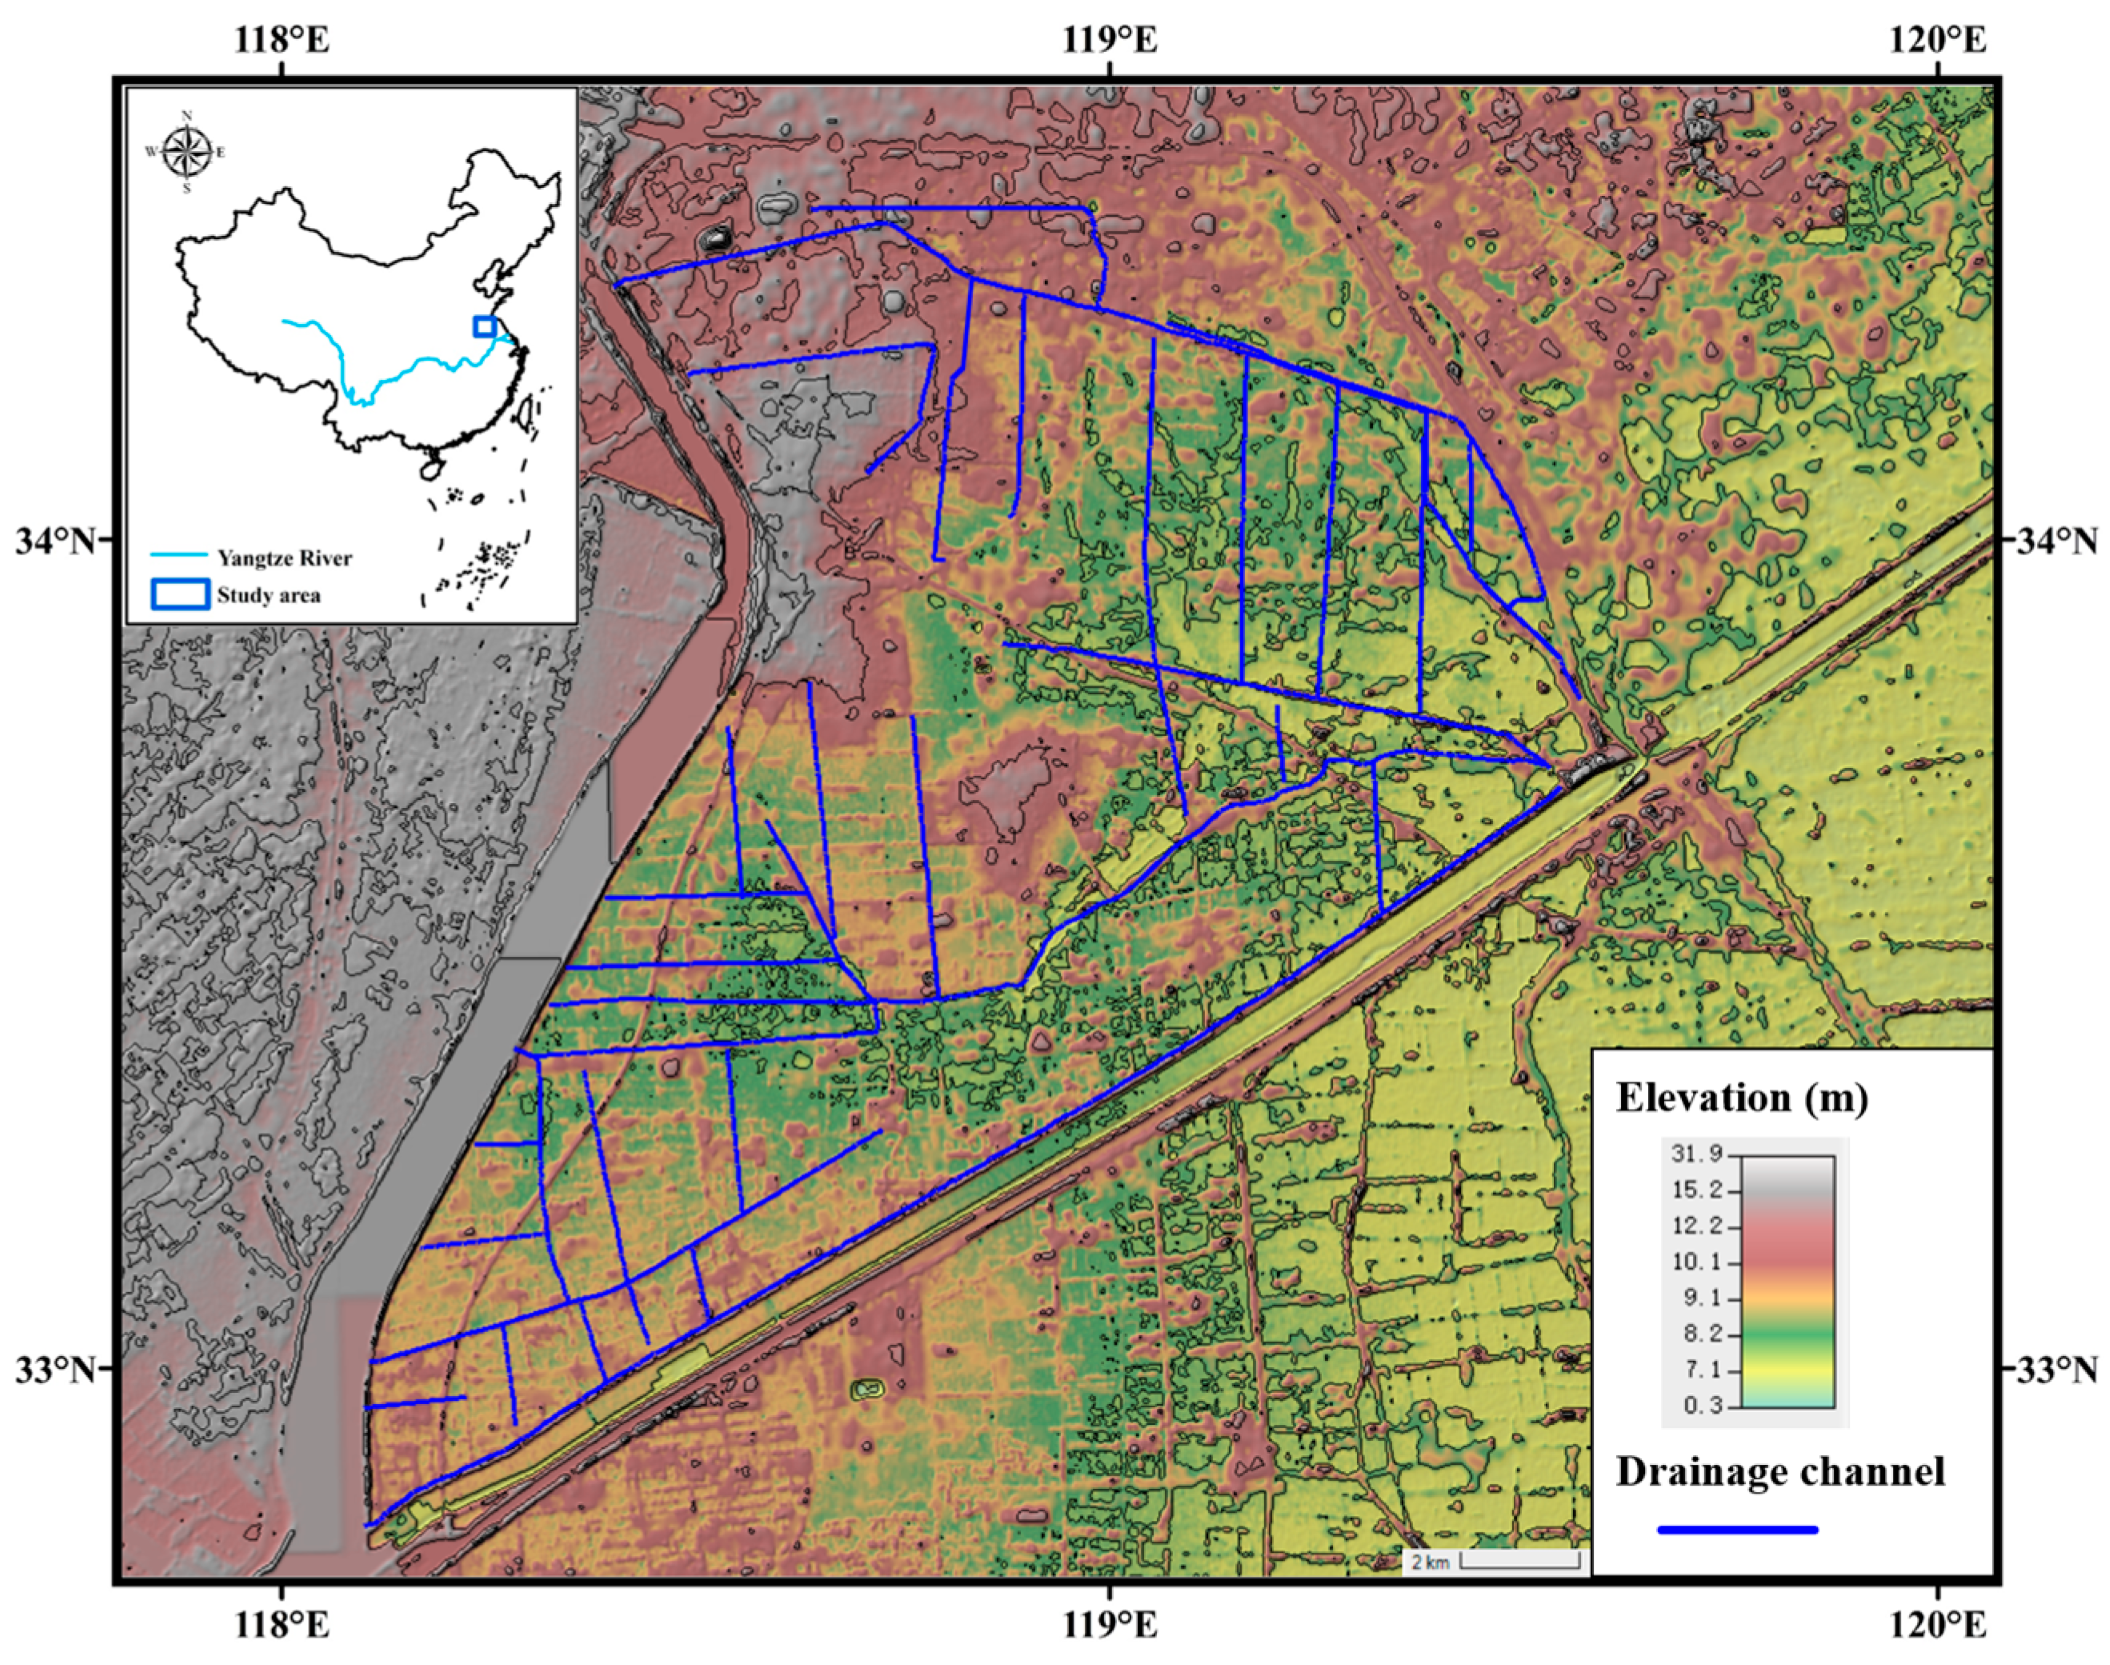
3.1. Study Area
3.2. Data Collection and Software
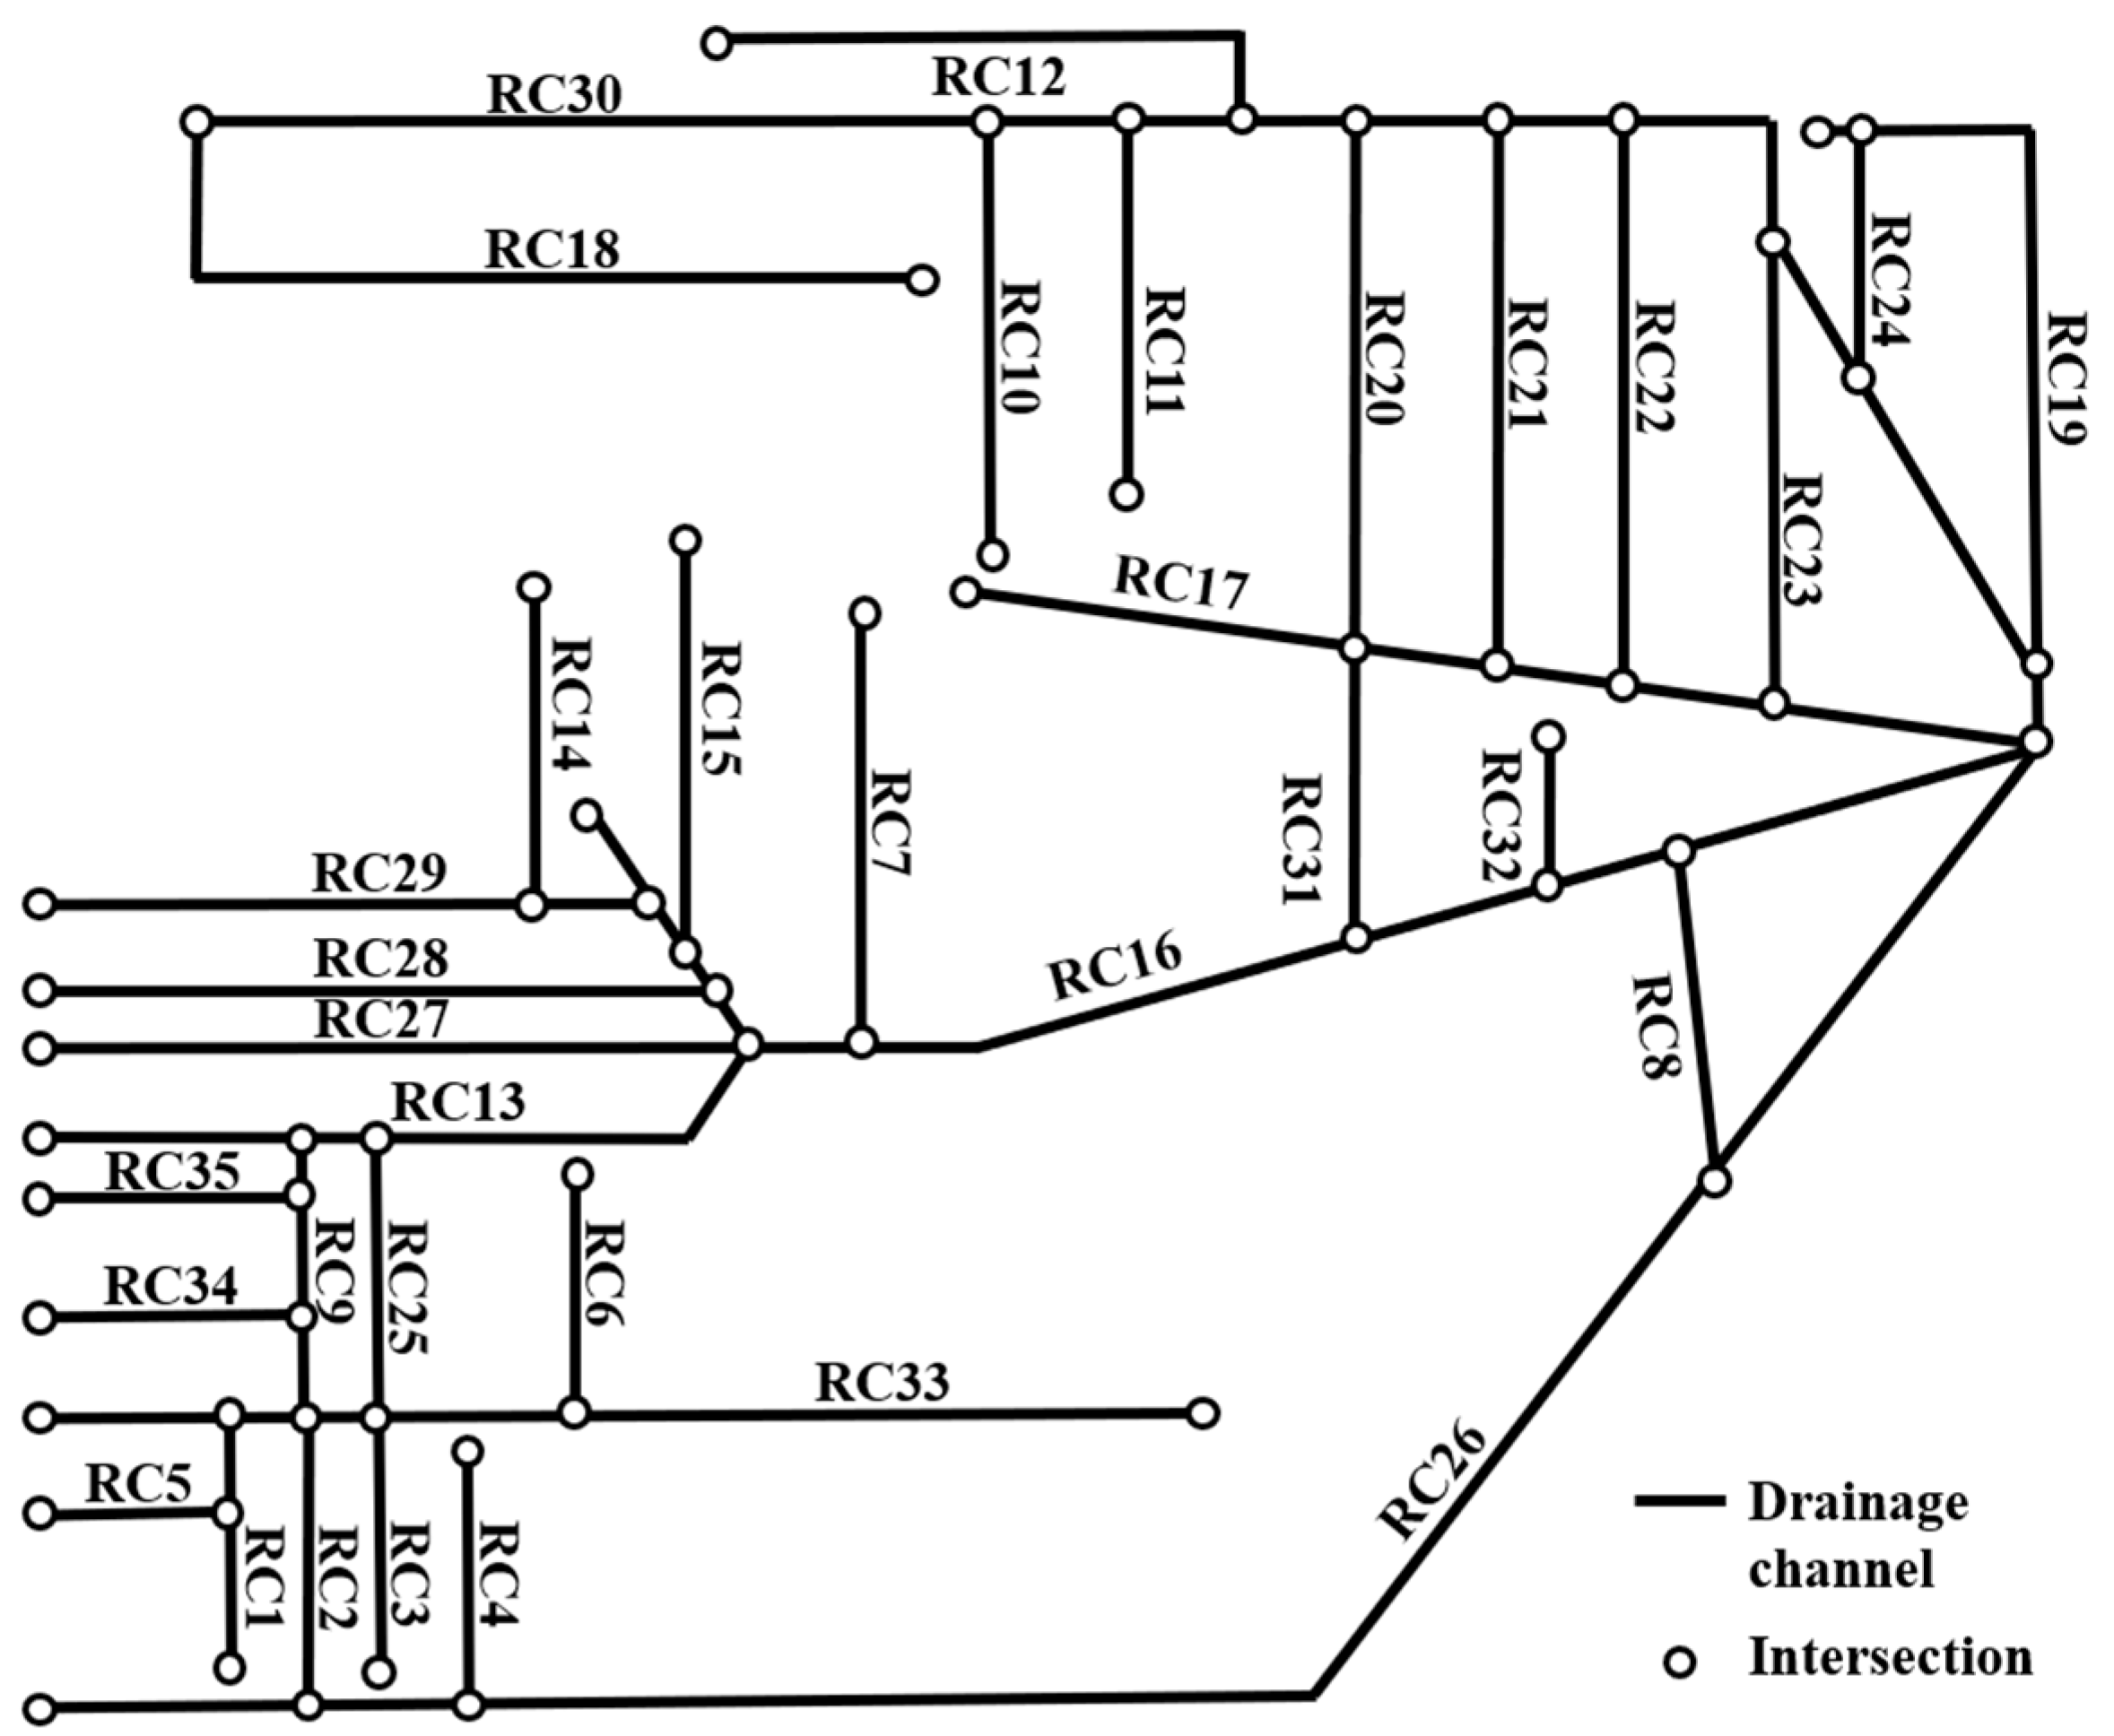
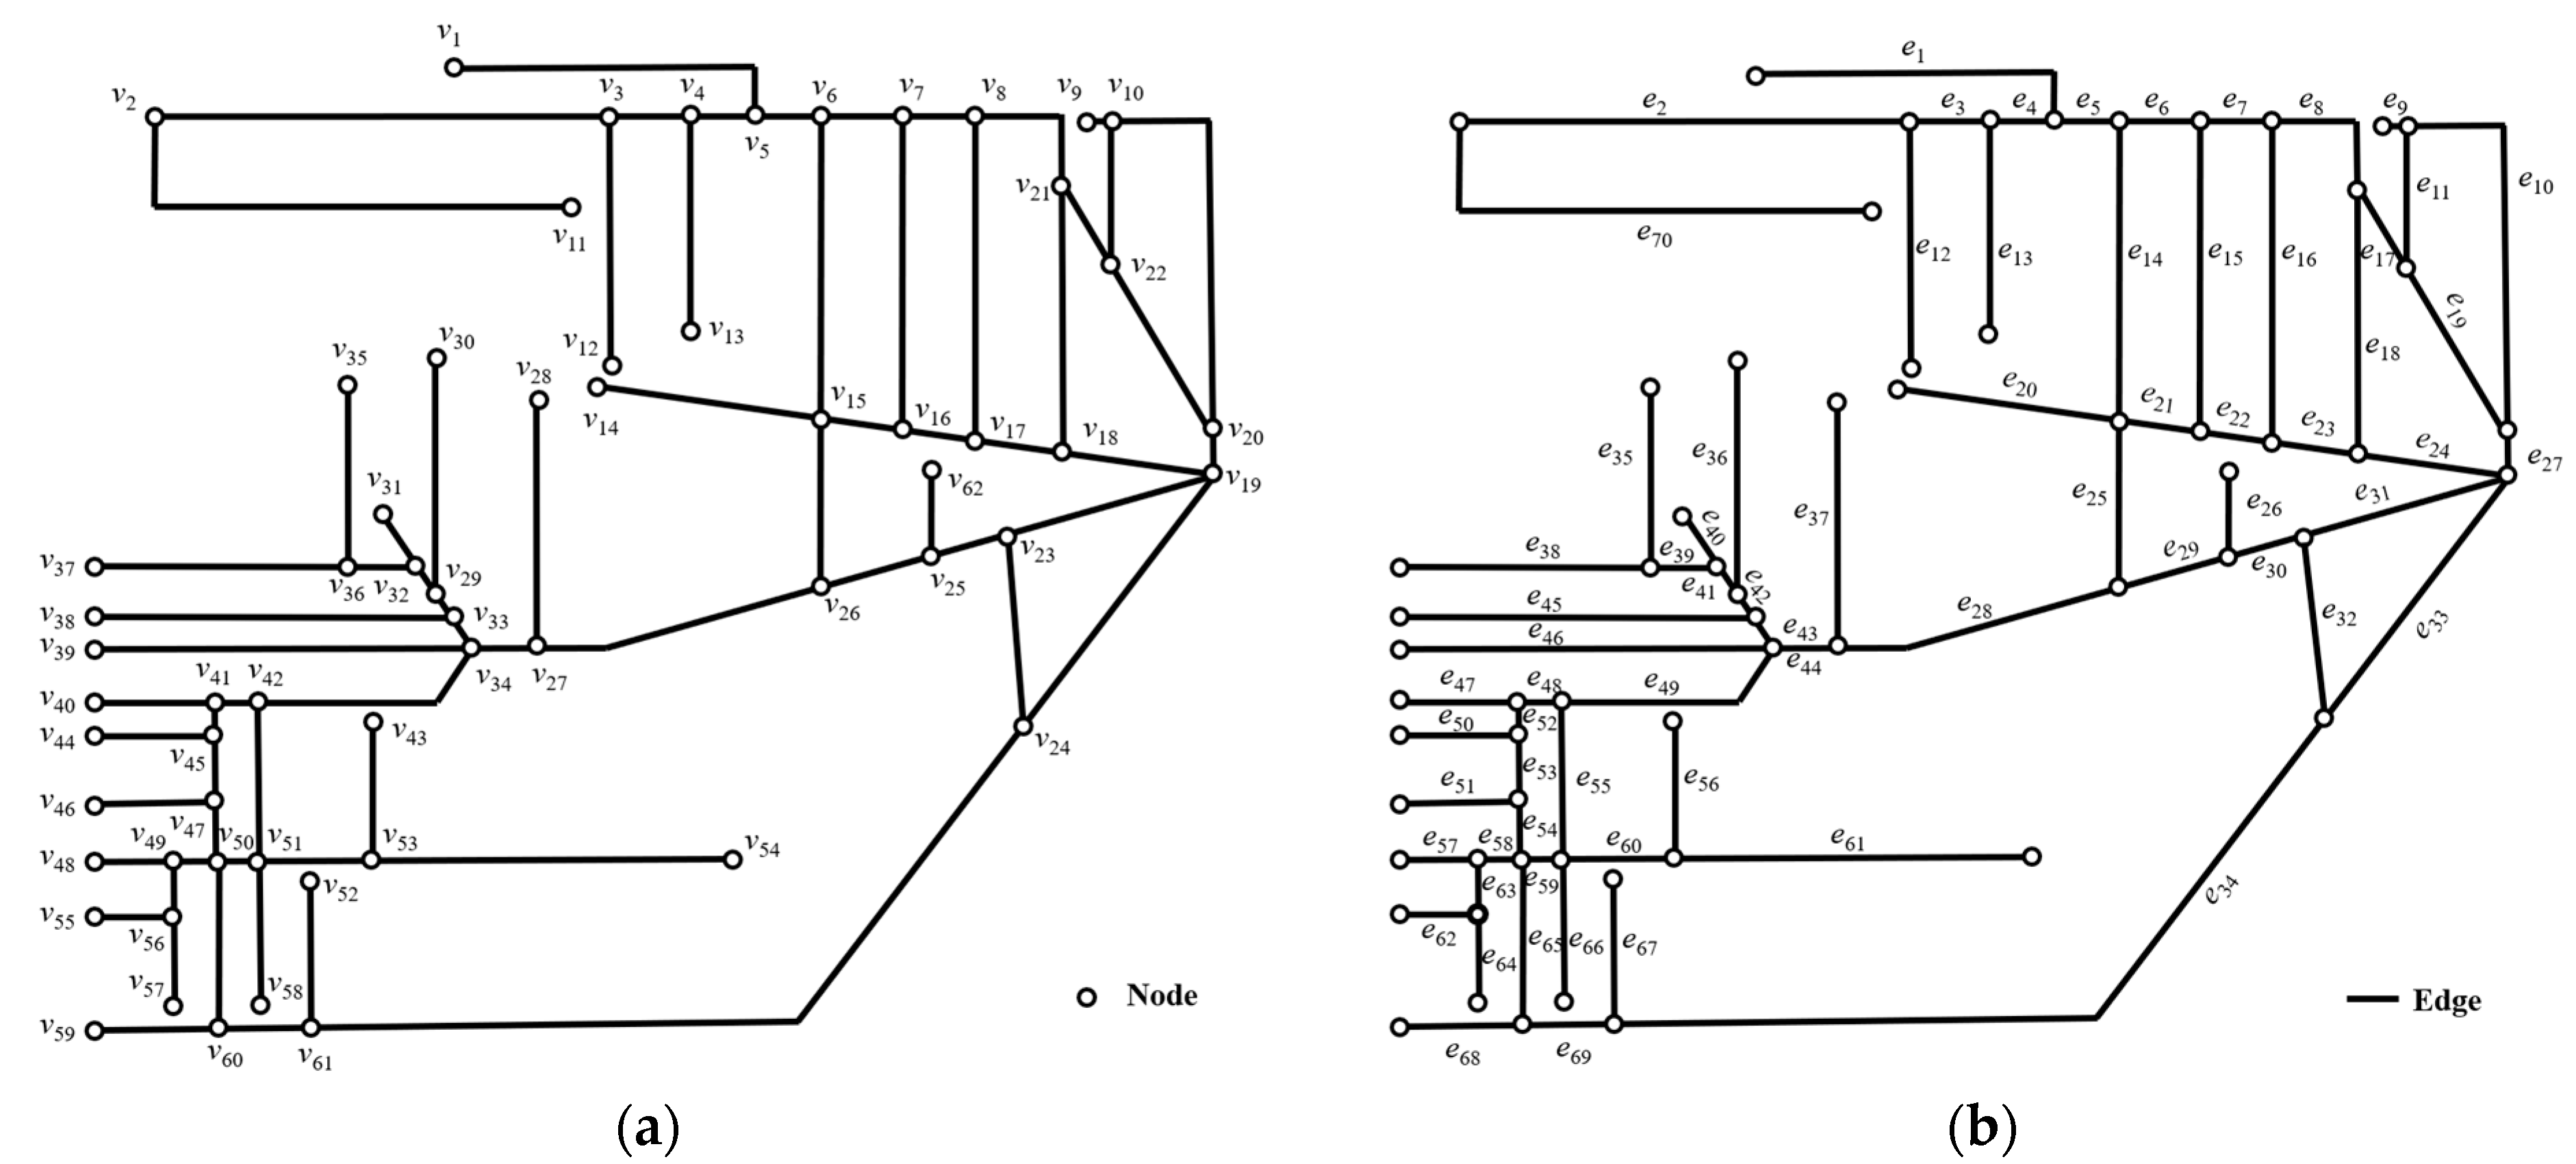
3.3. Graph Model of the Urban Stormwater Channel Network in the Study Area
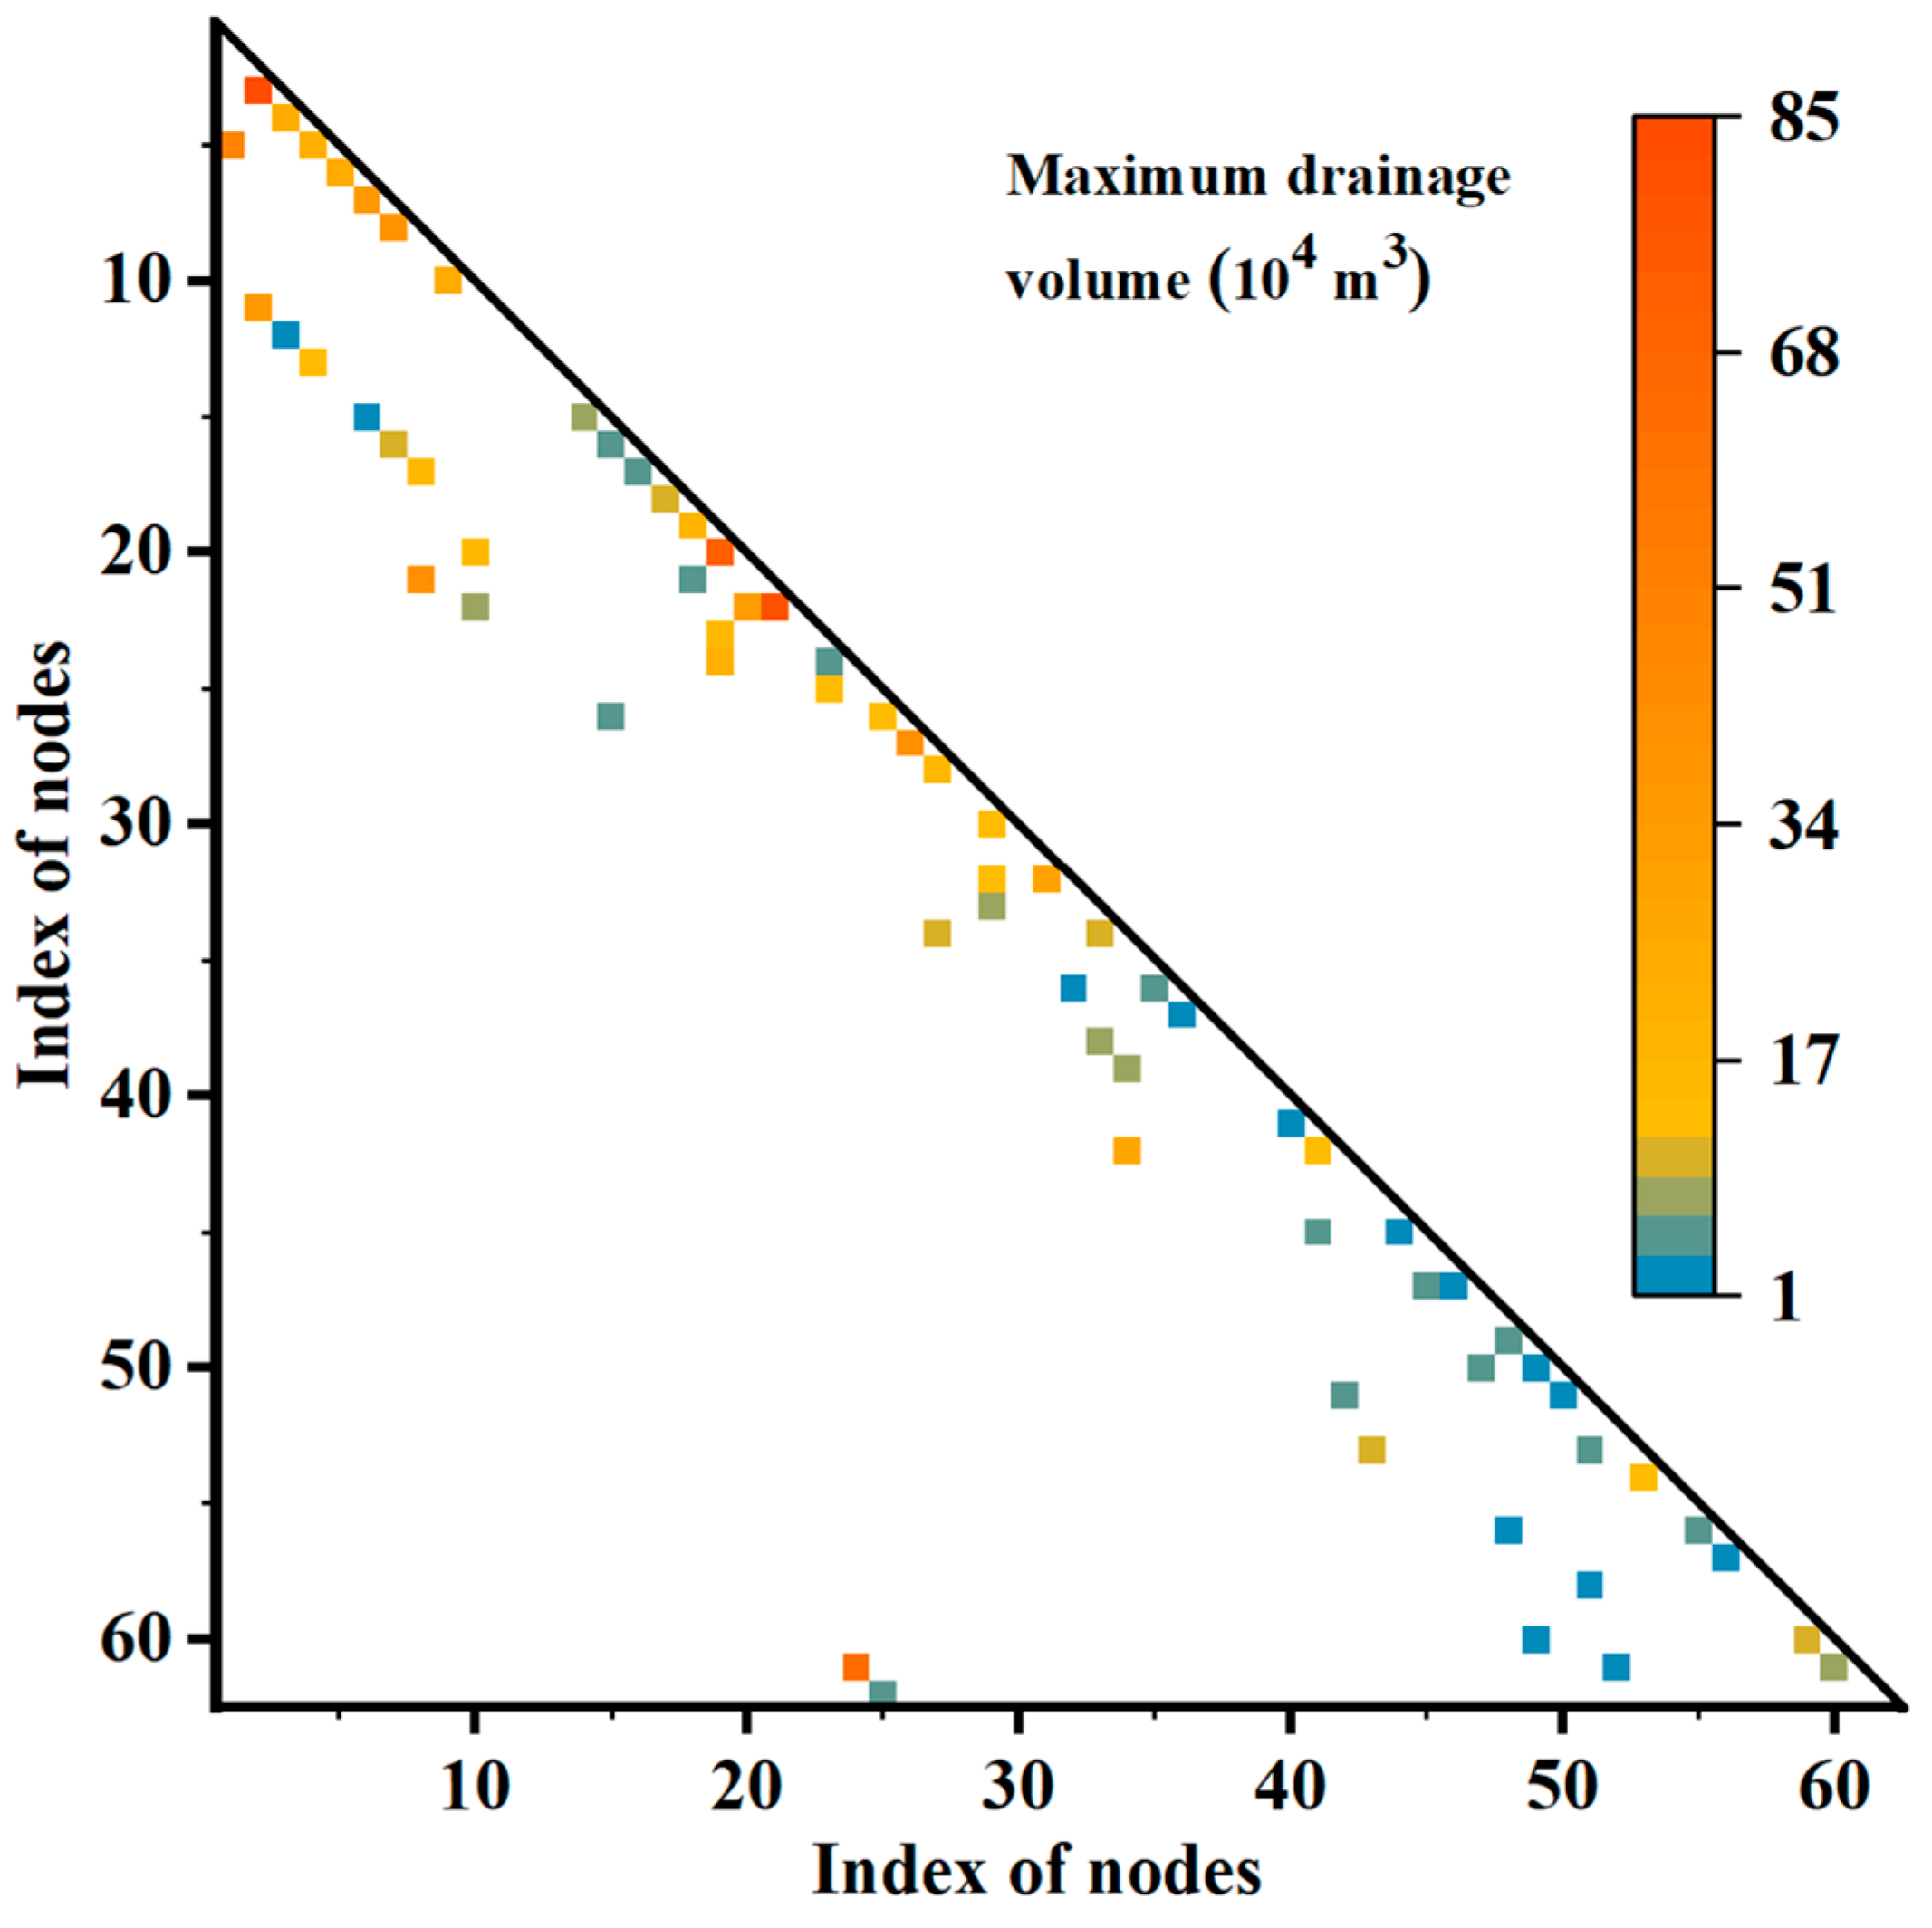
3.4. Weighted Adjacency Matrix of the Graph Model
4. Results and Discussion
5. Conclusions
Author Contributions
Funding
Data Availability Statement
Acknowledgments
Conflicts of Interest
Appendix A

| Name of Drainage Channels | Index of Channel Segments | Index of Edges | Voln (104 m3) | Pi (10−7) |
|---|---|---|---|---|
| RC1 | 1 | e63 | 15,255 | 0 |
| 2 | e64 | 6538 | 0 | |
| RC2 | 1 | e65 | 21,445 | 0.0111 |
| RC3 | 1 | e66 | 15,206 | 0 |
| RC4 | 1 | e67 | 12,678 | 0.7877 |
| RC5 | 1 | e62 | 55,840 | 0 |
| RC6 | 1 | e56 | 95,665 | 0 |
| RC7 | 1 | e37 | 157,292 | 0.0055 |
| RC8 | 1 | e32 | 54,266 | 361.8366 |
| RC9 | 1 | e47 | 7004 | 0 |
| 2 | e52 | 39,561 | 0 | |
| 3 | e53 | 50,026 | 0 | |
| 4 | e54 | 50,933 | 0 | |
| RC10 | 1 | e12 | 15,980 | 0.0023 |
| RC11 | 1 | e13 | 125,215 | 0.1785 |
| RC12 | 1 | e1 | 501,158 | 29.6839 |
| RC13 | 1 | e48 | 142,616 | 0 |
| 2 | e49 | 267,283 | 0.0002 | |
| RC14 | 1 | e35 | 50,447 | 0 |
| RC15 | 1 | e36 | 139,622 | 0 |
| RC16 | 1 | e40 | 290,918 | 0 |
| 2 | e41 | 138,688 | 0 | |
| 3 | e42 | 69,344 | 0 | |
| 4 | e43 | 118,083 | 0 | |
| 5 | e44 | 111,397 | 0.003 | |
| 6 | e28 | 400,042 | 0.2016 | |
| 7 | e29 | 140,015 | 1.1982 | |
| 8 | e30 | 126,680 | 50.9895 | |
| 9 | e31 | 152,976 | 2888.5039 | |
| RC17 | 1 | e20 | 81,772 | 0.015 |
| 2 | e21 | 58,434 | 1.2945 | |
| 3 | e22 | 59,190 | 40.8047 | |
| 4 | e23 | 98,620 | 384.8343 | |
| 5 | e24 | 177,103 | 4828.3902 | |
| RC18 | 1 | e70 | 352,968 | 0.5969 |
| RC19 | 1 | e9 | 252,072 | 767.518 |
| 2 | e10 | 172,883 | 8291.3245 | |
| RC20 | 1 | e14 | 16,784 | 1.0304 |
| RC21 | 1 | e15 | 110,086 | 174.4012 |
| RC22 | 1 | e16 | 161,774 | 1887.1536 |
| RC23 | 1 | e18 | 40,617 | 1713.5119 |
| RC24 | 1 | e11 | 75,596 | 4666.7021 |
| RC25 | 1 | e55 | 49,054 | 0 |
| RC26 | 1 | e68 | 104,255 | 0.2585 |
| 2 | e69 | 72,177 | 25.6048 | |
| 3 | e34 | 630,359 | 3246.2007 | |
| 4 | e33 | 217,401 | 7961.9953 | |
| RC27 | 1 | e46 | 73,565 | 0 |
| RC28 | 1 | e45 | 86,838 | 0 |
| RC29 | 1 | e38 | 24,037 | 0 |
| 2 | e39 | 10,302 | 0 | |
| RC30 | 1 | e2 | 846,717 | 1.5645 |
| 2 | e3 | 235,171 | 1.9807 | |
| 3 | e4 | 220,182 | 9.0993 | |
| 4 | e5 | 238,894 | 113.2594 | |
| 5 | e6 | 348,692 | 1331.6747 | |
| 6 | e7 | 397,317 | 9178.494 | |
| 7 | e8 | 413,463 | 45,573.66 | |
| 8 | e17 | 796,632 | 92,124.436 | |
| 9 | e19 | 327,524 | 91,494.407 | |
| 10 | e27 | 724,933 | 61,049.612 | |
| RC31 | 1 | e25 | 53,130 | 0.0994 |
| RC32 | 1 | e26 | 46,220 | 0.1043 |
| RC33 | 1 | e57 | 25,965 | 0 |
| 2 | e58 | 21,836 | 0 | |
| 3 | e59 | 26,285 | 0 | |
| 4 | e60 | 53,452 | 0 | |
| 5 | e61 | 121,012 | 0 | |
| RC34 | 1 | e51 | 32,500 | 0 |
| RC35 | 1 | e50 | 28,976 | 0 |
References
- Emmerling, J.; Andreoni, P.; Charalampidis, I.; Dasgupta, S.; Dennig, F.; Feindt, S.; Fragkiadakis, D.; Fragkos, P.; Fujimori, S.; Gilli, M.; et al. A Multi-Model Assessment of Inequality and Climate Change. Nat. Clim. Chang. 2024, 1–7. [Google Scholar] [CrossRef]
- Jun, T.; Rind, D. Increasing Contribution of the Atmospheric Vertical Motion to Precipitation in a Warming Climate. Commun Earth Environ 2024, 5, 541. [Google Scholar] [CrossRef]
- Du, H.; Donat, M.G.; Zong, S.; Alexander, L.V.; Manzanas, R.; Kruger, A.; Choi, G.; Salinger, J.; He, H.S.; Li, M.-H.; et al. Extreme Precipitation on Consecutive Days Occurs More Often in a Warming Climate. Bull. Am. Meteorol. Soc. 2022, 103, E1130–E1145. [Google Scholar] [CrossRef]
- Wang, Z.; Zhu, J.; Wu, Z. Study on the Spatial Distribution Characteristics of Traditional Villages and Their Response to the Water Network System in the Lower Yangtze River Basin. Sci. Rep. 2024, 14, 22586. [Google Scholar] [CrossRef] [PubMed]
- Dissanayake, L. Stream Corridor Encroachment and Its Consequences: The Case of Pinga Oya Tributary in the Upper Mahaweli River in Sri Lanka. Model. Earth Syst. Environ. 2021, 7, 1907–1916. [Google Scholar] [CrossRef]
- Ding, W.; Wu, J.; Tang, R.; Chen, X.; Xu, Y. A Review of Flood Risk in China During 1950–2019: Urbanization, Socioeconomic Impact Trends and Flood Risk Management. Water 2022, 14, 3246. [Google Scholar] [CrossRef]
- Zhang, W.; Villarini, G.; Vecchi, G.A.; Smith, J.A. Urbanization Exacerbated the Rainfall and Flooding Caused by Hurricane Harvey in Houston. Nature 2018, 563, 384–388. [Google Scholar] [CrossRef]
- Mizutori, M.; Debarati, G.-S. Human Cost of Disasters: An Overview of the Last 20 Years (2000–2019); Centre for Research on the Epidemiology of Disasters (CRED): Brussels, Belgium; United Nations Office for Disaster Risk Reduction (UNDRR): Geneva, Switzerland, 2020. [Google Scholar]
- Winsemius, H.C.; Aerts, J.C.J.H.; Van Beek, L.P.H.; Bierkens, M.F.P.; Bouwman, A.; Jongman, B.; Kwadijk, J.C.J.; Ligtvoet, W.; Lucas, P.L.; van Vuuren, D.P.; et al. Global Drivers of Future River Flood Risk. Nature Clim. Chang. 2016, 6, 381–385. [Google Scholar] [CrossRef]
- Horton, R.E. Erosional Development of Streams and Their Drainage Basins; Hydrophysical Approach to Quantitative Morphology. Geol. Soc. Am. Bull 1945, 56, 275. [Google Scholar] [CrossRef]
- Strahler, A.N. Quantitative Analysis of Watershed Geomorphology. Eos Trans. AGU 1957, 38, 913–920. [Google Scholar] [CrossRef]
- Shreve, R.L. Statistical Law of Stream Numbers. J. Geol. 1966, 74, 17–37. [Google Scholar] [CrossRef]
- Kamboj, V.; Kamboj, N.; Sharma, A.K. A Review on General Characteristics, Classification and Degradation of River Systems. Environ. Degrad. Causes Remediat. Strateg. 2020, 1, 47–62. [Google Scholar]
- Sah, R.K.; Das, A.K. Minimizing Ambiguities in Stream Classification of Complex Drainage Structures. J. Hydrol. 2017, 553, 224–230. [Google Scholar] [CrossRef]
- Dallaire, C.O.; Lehner, B.; Sayre, R.; Thieme, M. A Multidisciplinary Framework to Derive Global River Reach Classifications at High Spatial Resolution. Environ. Res. Lett. 2019, 14, 024003. [Google Scholar] [CrossRef]
- Tadaki, M.; Brierley, G.; Cullum, C. River Classification: Theory, Practice, Politics. WIREs Water 2014, 1, 349–367. [Google Scholar] [CrossRef]
- Meynell, P.-J.; Metzger, M.; Stuart, N. Identifying Ecosystem Services for a Framework of Ecological Importance for Rivers in South East Asia. Water 2021, 13, 1602. [Google Scholar] [CrossRef]
- Jung, K.; Lee, M.; An, H.; Um, M.-J.; Park, D. Characterization and Classification of River Networks in South Korea. Environ. Model. Softw. 2022, 156, 105495. [Google Scholar] [CrossRef]
- Larsen, S.; Comte, L.; Filipa Filipe, A.; Fortin, M.; Jacquet, C.; Ryser, R.; Tedesco, P.A.; Brose, U.; Erős, T.; Giam, X.; et al. The Geography of Metapopulation Synchrony in Dendritic River Networks. Ecol. Lett. 2021, 24, 791–801. [Google Scholar] [CrossRef]
- Mejía, A.I.; Niemann, J.D. Identification and Characterization of Dendritic, Parallel, Pinnate, Rectangular, and Trellis Networks Based on Deviations from Planform Self-similarity. J. Geophys. Res. 2008, 113, 2007JF000781. [Google Scholar] [CrossRef]
- Jung, K.; Shin, J.-Y.; Park, D. A New Approach for River Network Classification Based on the Beta Distribution of Tributary Junction Angles. J. Hydrol. 2019, 572, 66–74. [Google Scholar] [CrossRef]
- Fawen, L.; Qingyang, L.; Yong, Z. Characterization and Classification of River Network Types. Water Resour. Manag. 2023, 37, 6219–6236. [Google Scholar] [CrossRef]
- Li, M.; Wu, B.; Chen, Y.; Li, D. Quantification of River Network Types Based on Hierarchical Structures. Catena 2022, 211, 105986. [Google Scholar] [CrossRef]
- Zhou, Y.; Shen, D.; Huang, N.; Guo, Y.; Zhang, T.; Zhang, Y. Urban Flood Risk Assessment Using Storm Characteristic Parameters Sensitive to Catchment-Specific Drainage System. Sci. Total Environ. 2019, 659, 1362–1369. [Google Scholar] [CrossRef] [PubMed]
- Valizadeh, N.; Shamseldin, A.Y.; Wotherspoon, L. Quantification of the Hydraulic Dimension of Stormwater Management System Resilience to Flooding. Water Resour. Manag. 2019, 33, 4417–4429. [Google Scholar] [CrossRef]
- Jayawardene, I.; Herath, P.; Venayagamoorthy, G.K. A Graph Theory-Based Clustering Method for Power System Networks. In Proceedings of the 2020 Clemson University Power Systems Conference (PSC), Clemson, SC, USA, 10–13 March 2020; IEEE: Washington, DC, USA, 2020; pp. 1–8. [Google Scholar]
- Said, B.; Lathamaheswari, M.; Singh, P.K.; Ouallane, A.A.; Bakhouyi, A.; Bakali, A.; Talea, M.; Dhital, A.; Deivanayagampillai, N. An Intelligent Traffic Control System Using Neutrosophic Sets, Rough Sets, Graph Theory, Fuzzy Sets and Its Extended Approach: A Literature Review. Neutrosophic Sets Syst. 2022, 50, 10–26. [Google Scholar]
- Kaveh, A. Introduction to Graph Theory and Algebraic Graph Theory. In Topological Transformations for Efficient Structural Analysis; Springer International Publishing: Cham, Switzerland, 2022; pp. 5–21. ISBN 978-3-031-12299-6. [Google Scholar]
- Ebel, H.; Eberhard, P. A Comparative Look at Two Formation Control Approaches Based on Optimization and Algebraic Graph Theory. Robot. Auton. Syst. 2021, 136, 103686. [Google Scholar] [CrossRef]
- Jiang, W.; Yu, J. Impact of Rainstorm Patterns on the Urban Flood Process Superimposed by Flash Floods and Urban Waterlogging Based on a Coupled Hydrologic–Hydraulic Model: A Case Study in a Coastal Mountainous River Basin within Southeastern China. Nat. Hazards 2022, 112, 301–326. [Google Scholar] [CrossRef]
- Muthusamy, M.; Casado, M.R.; Butler, D.; Leinster, P. Understanding the Effects of Digital Elevation Model Resolution in Urban Fluvial Flood Modelling. J. Hydrol. 2021, 596, 126088. [Google Scholar] [CrossRef]
- Heritage, G.; Entwistle, N. Impacts of River Engineering on River Channel Behaviour: Implications for Managing Downstream Flood Risk. Water 2020, 12, 1355. [Google Scholar] [CrossRef]
- Frossard, J.; Renaud, O. Permutation Tests for Regression, ANOVA, and Comparison of Signals: The Permuco Package. J. Stat. Softw. 2021, 99, 1–32. [Google Scholar] [CrossRef]
- Nithila Devi, N.; Sridharan, B.; Bindhu, V.M.; Narasimhan, B.; Bhallamudi, S.M.; Bhatt, C.M.; Usha, T.; Vasan, D.T.; Kuiry, S.N. Investigation of Role of Retention Storage in Tanks (Small Water Bodies) on Future Urban Flooding: A Case Study of Chennai City, India. Water 2020, 12, 2875. [Google Scholar] [CrossRef]
- Sarker, S. Investigating Topologic and Geometric Properties of Synthetic and Natural River Networks under Changing Climate. Ph.D. Thesis, University of Central Florida, Orlando, FL, USA, 2021. [Google Scholar]
- Royle, G.F.; Godsil, C. Algebraic Graph Theory; Springer: New York, NY, USA, 2001; Volume 207. [Google Scholar]
- Mukherjee, C.; Mukherjee, G. Role of Adjacency Matrix in Graph Theory. IOSR J. Comput. Eng. 2014, 16, 58–63. [Google Scholar] [CrossRef]
- Shit, P.K.; Bera, B.; Islam, A.; Ghosh, S.; Bhunia, G.S. Introduction to Drainage Basin Dynamics: Morphology, Landscape and Modelling. In Drainage Basin Dynamics; Shit, P.K., Bera, B., Islam, A., Ghosh, S., Bhunia, G.S., Eds.; Geography of the Physical Environment; Springer International Publishing: Cham, Switzerland, 2022; pp. 1–9. ISBN 978-3-030-79633-4. [Google Scholar]
- Bonnini, S.; Assegie, G.M.; Trzcinska, K. Review about the Permutation Approach in Hypothesis Testing. Mathematics 2024, 12, 2617. [Google Scholar] [CrossRef]
- Chung, F.R. Spectral Graph Theory; American Mathematical Soc.: Providence, RI, USA, 1997; Volume 92. [Google Scholar]
- Hastie, T.; Friedman, J.; Tibshirani, R. The Elements of Statistical Learning; Springer Series in Statistics; Springer: New York, NY, USA, 2001; ISBN 978-1-4899-0519-2. [Google Scholar]


| Type | Applicable Networks | Factors Under Consideration | Limitations |
|---|---|---|---|
| Geomorphological | Dendritic and pinnate | Topological structure | Unable to handle the closed loop in the network |
| Divisional | Dendritic and pinnate | Hydraulic parameters and topological structure | A clear delineation of the catchment area for each segment is needed |
| Statistical | Dendritic, pinnate, and trellis | Topological structure | Quantitative analysis is not possible |
| PAGA | Dendritic, pinnate, and trellis | Hydraulic parameters and topological structure | / |
| Importance Levels 1 | Channel Segment | Index of Edges |
|---|---|---|
| Main segments | RC30-8 | e17 |
| RC30-9 | e19 | |
| RC30-10 | e27 | |
| RC30-7 | e8 | |
| Important segments | RC30-6 | e7 |
| RC19-2 | e10 |
Disclaimer/Publisher’s Note: The statements, opinions and data contained in all publications are solely those of the individual author(s) and contributor(s) and not of MDPI and/or the editor(s). MDPI and/or the editor(s) disclaim responsibility for any injury to people or property resulting from any ideas, methods, instructions or products referred to in the content. |
© 2024 by the authors. Licensee MDPI, Basel, Switzerland. This article is an open access article distributed under the terms and conditions of the Creative Commons Attribution (CC BY) license (https://creativecommons.org/licenses/by/4.0/).
Share and Cite
Zhong, Z.; Wan, J.; Bu, H.; Gao, Z.; Liu, T.; Wang, F.; Shao, Q.; Qiu, X.; Wang, L.; Cheng, J. Individual Importance Classification of Urban Stormwater Channel Networks: A Novel Approach Based on Permutation and Algebraic Graph Theory. Water 2024, 16, 3242. https://doi.org/10.3390/w16223242
Zhong Z, Wan J, Bu H, Gao Z, Liu T, Wang F, Shao Q, Qiu X, Wang L, Cheng J. Individual Importance Classification of Urban Stormwater Channel Networks: A Novel Approach Based on Permutation and Algebraic Graph Theory. Water. 2024; 16(22):3242. https://doi.org/10.3390/w16223242
Chicago/Turabian StyleZhong, Zhicheng, Jixiang Wan, Hao Bu, Zheng Gao, Tingting Liu, Fusheng Wang, Qianyu Shao, Xinyue Qiu, Liang Wang, and Jilin Cheng. 2024. "Individual Importance Classification of Urban Stormwater Channel Networks: A Novel Approach Based on Permutation and Algebraic Graph Theory" Water 16, no. 22: 3242. https://doi.org/10.3390/w16223242
APA StyleZhong, Z., Wan, J., Bu, H., Gao, Z., Liu, T., Wang, F., Shao, Q., Qiu, X., Wang, L., & Cheng, J. (2024). Individual Importance Classification of Urban Stormwater Channel Networks: A Novel Approach Based on Permutation and Algebraic Graph Theory. Water, 16(22), 3242. https://doi.org/10.3390/w16223242