Review

Bibliometric Insights into Microplastic Pollution in Freshwater Ecosystems

by
Gokhan Yildirim
1,2,
Monisha Anindita
1,
Xiao Pan
1,
Sumya Rahman
3,
Mohammad A. Alim
1,
Rehana Shaik
4 and
Ataur Rahman
1,*
1
School of Engineering, Design and Built Environment, Penrith Campus, Western Sydney University, Building XB, Kingswood, NSW 2751, Australia
2
Department of Environmental Engineering, Faculty of Engineering, Aksaray University, Aksaray 68100, Turkey
3
School of Health Sciences, Western Sydney University, Narellan Rd & Gilchrist Dr, Campbelltown, NSW 2560, Australia
4
International Institute of Information Technology, Hyderabad 500032, India
*
Author to whom correspondence should be addressed.
Water 2024, 16(22), 3237; https://doi.org/10.3390/w16223237
Submission received: 5 September 2024 / Revised: 30 October 2024 / Accepted: 7 November 2024 / Published: 11 November 2024
(This article belongs to the Section Water Quality and Contamination)

Abstract

:
Microplastic pollution in freshwater ecosystems has emerged as a significant environmental concern, warranting comprehensive investigation, and understanding. This study employs bibliometric analysis to systematically review and synthesize the existing literature on microplastic pollution in freshwater environments from 2013 to 2023. The exponential growth in research output was uncovered by analyzing 885 documents sourced from the Web of Science database, with an average annual growth rate of 73.13% and an average document citation of 30.17. Our findings highlight the dominance of primary and secondary microplastics as pollutants, their ecological consequences, and the resultant socio-economic implications. Notably, the Science of the Total Environment and Environmental Pollution journals emerge as leading publication venues, while China, Germany, and the USA lead in research contributions, underlining the global nature of microplastic pollution research. The analysis further outlines the most commonly cited works, identifying pivotal studies that have shaped current understanding and future research directions. This bibliometric analysis provides a comprehensive overview of the research landscape on microplastic pollution in freshwater ecosystems, helping researchers to identify knowledge gaps and emerging trends. These insights can guide future research directions and inform policymakers and stakeholders on where scientific efforts should be concentrated to better understand and address the impacts of microplastic pollution.

1. Introduction

Microplastics, minute fragments of plastic particles measuring less than 5 mm [1,2,3], have emerged as a critical environmental concern over the past decade [4,5,6]. The common primary sources of microplastics include cosmetics, detergents, paints, nappies, and insecticides. Larger polymers can be degraded by physical, chemical, and biological processes to form microplastics. These microplastics are infiltrating freshwater ecosystems at an alarming rate, threatening the delicate balance of the water ecosystem. In this paper, a bibliometric analysis was carried out to explore the intricate web of research surrounding microplastic pollution in freshwater environments.

1.1. Understanding Microplastics

Microplastics originate from various sources, which include the breakdown of larger plastic debris and the direct release of microplastic particles found in personal care products and industrial processes. Despite their small size, microplastics possess remarkable durability, persisting in the environment for extended periods. Their ubiquity within freshwater ecosystems is a testament to their ability to infiltrate even the most remote and pristine areas. Moreover, microplastics come in two main categories: primary microplastics, intentionally manufactured for specific applications [2], such as microbeads in cosmetics [7], and secondary microplastics, formed from the fragmentation of larger plastic items due to weathering and mechanical forces [8,9].

1.2. A Growing Threat to Freshwater Ecosystems

The past decade has witnessed a notable rise in research and concern regarding microplastic pollution in freshwater ecosystems [10,11]. Researchers, scientists, and environmentalists alike have turned their attention to these minuscule menaces, recognizing their potential to disrupt aquatic ecosystems [12,13] and harm the organisms [14,15] that rely on the ecosystem. As the understanding of the extent of microplastic pollution deepens, it becomes increasingly evident that this is not a localized issue but a global one.
Microplastic pollution poses a complex array of ecological threats, particularly due to its persistence in the environment and interactions with aquatic organisms. These particles are pervasive in aquatic environments, from oceanic products, such as sea salt [16], to freshwater systems, where they accumulate in organisms. Studies have demonstrated that microplastics can physically block the digestive tracts of aquatic species [17], interfere with nutrient absorption, and disrupt physiological processes, such as reproduction and growth [18].

1.3. An Alarming Escalation

While microplastic pollution in freshwater ecosystems has been recognized for some time, recent trends have shown a marked increase in both plastic production and waste mismanagement. For example, between 1950 and 2017, plastic production reached approximately 9.2 billion tons, with nearly half of this production occurring after 2004 [19]. In 2021 alone, global plastic production exceeded 400 million tons, which, combined with the long persistence of microplastics in the environment, poses significant risks to aquatic biodiversity and human health [20,21]. Microplastics have been found to accumulate in both aquatic organisms and the food chain, amplifying these risks [18]. Further microplastic contamination affects not only aquatic ecosystems but also terrestrial food chains through bioaccumulation. For instance, microplastics are ingested by aquatic organisms that are then consumed by humans, posing potential health risks [18]. Additionally, microplastics can enter soil ecosystems through sewage sludge used in agriculture, further spreading their environmental impact [21].
The societal and economic implications of microplastic pollution are equally significant. Tourism, agriculture, and fisheries, which rely heavily on freshwater ecosystems, are all vulnerable to the detrimental effects of microplastics. Moreover, the financial burden of addressing the consequences of microplastic pollution is substantial, making it not only an ecological crisis but also an economic one.
Recent reviews have explored the widespread presence and impacts of microplastics in aquatic environments. Cassio et al. [22] and Junaid et al. [23] both emphasize the complex interactions between microplastics and pollutants, particularly focusing on the toxicity and ecological consequences of micro- and nano-plastics (MNPs) in freshwater and marine ecosystems. They underscore the need for more research on the combined effects of MNPs and co-occurring chemicals, including bioaccumulation, transfer, and transgenerational impacts. Islam et al. [24] and Mishra et al. [25] examine microplastic pollution in Bangladesh and India’s riverine systems respectively, highlighting gaps in plastic waste management practices and the need for more comprehensive reviews of freshwater contamination. Similarly, Ding et al. [26] and Li et al. [27] analyze the dynamics of microplastics in freshwater ecosystems, identifying gaps in research due to historical biases toward marine pollution. Both reviews stress the importance of improved management strategies and policies to address the prevalence of microplastics and their ecological effects. Nguyen et al. [28] and Sarijan et al. [29] focus on the global abundance and distribution of microplastics and their interactions with pollutants, advocating for enhanced methodologies for detecting microplastics and mitigating their environmental impacts. The increasing concern about microplastic pollution has generated a wealth of research across multiple disciplines, ranging from ecological impacts to human health risks. However, this rapid expansion of studies has also led to fragmentation in the literature, making it difficult for researchers to synthesize findings, identify critical knowledge gaps, and chart future directions. A bibliometric analysis is urgently needed to systematically map the current state of research on microplastics, offering a comprehensive overview of the field’s evolution. This approach allows us to assess key trends, the most influential studies, and the collaborative networks shaping the discourse on microplastic pollution. By evaluating the existing body of literature, this study will clarify how research is currently structured, where the gaps lie, and how future investigations can be more effectively targeted. In addition, this work provides insights into how the topic of freshwater microplastic pollution is gaining attention locally versus globally, highlighting which countries are leading this research, identifying emerging trends, and analyzing the collaboration networks between nations. This level of detail is critical for understanding regional research focuses and for strengthening future international partnerships to address this global issue more effectively. Ultimately, this bibliometric analysis not only provides a necessary synthesis of the literature but also acts as a strategic guide for researchers and policymakers working to address one of the most pressing environmental issues of our time. By combining a quantitative assessment of research productivity with an analysis of collaboration networks and thematic trends, this study offers an invaluable resource for identifying knowledge gaps, fostering international collaborations, and guiding the future direction of research on microplastic pollution in freshwater ecosystems.

2. Materials and Methods

A standard workflow of science mapping in bibliometric analysis contains five stages: (1) research design, (2) data collection, (3) data analysis, (4) visualization and (5) interpretation. This study carried out bibliometric analysis using a methodological workflow [30] shown in Figure 1.
In order to conduct a thorough examination of the worldwide developments and patterns in research related to the issue of microplastic contamination in freshwater environments, the dataset of publications utilized in this investigation was assembled from the Web of Science (WOS) database, including Science Citation Index Expanded, Emerging Sources Citation Index, Social Sciences Citation Index, Conference Proceedings Citation Index and so forth. This dataset was analysed to determine the scope and level of research being conducted, as well as to identify potential gaps in knowledge and research directions for the future.
This bibliometric analysis was conducted to examine the conceptual evolution and trends in microplastic pollution in freshwater studies between the years 2013 to 2023. Science evolution (e.g., authorship, country of origin, citations) and networks (e.g., co-occurrence, co-citation, and co-authorship) were analysed using bibliometric methods (performance analysis and science mapping). Data collection was carried out in September 2023 using a series of descriptors related to microplastic pollution in freshwater systems, contained the title, abstract and keywords, together with Boolean logical functions (AND, OR), which allowed the search to be carried out:
TS = ((“microplastic” OR “micro-plastic” OR “(micro) plastic*” OR “nano-plastic” OR “nano-plastic”) AND (river* OR stream* OR lake* OR freshwater* OR “fresh water” OR pond* OR reservoir* OR “surface water” OR groundwater OR “ground water” OR “ground-water” OR wetland* OR rainwater OR rainfall) NOT (Ocean OR sea OR marine OR seawater OR saltwater OR coastal OR brine OR salinity OR beach OR seashore OR estuary OR deformation)).
The asterisk symbol (*) serves as a wildcard character signifying a fuzzy search, commonly employed to locate variations and derivatives of a given keyword. For instance, when using “microplastic*”, it also encompasses the term “microplastics”.
The h-index, g-index, and m-index provide a quantitative assessment of a researcher’s scholarly output and influence within their field. The h-index was developed by Hirsch [31] to evaluate and quantify academic impacts. The h-index is an author’s (or journal’s) number of publications (h), each of which has been cited in other documents at least h times. Simply, a higher h-index shows a greater academic impact. Therefore, the h-index emerges as a significant parameter for appraising both the quantity and quality of academic research within the realm of bibliometric analysis [32,33]. Egghe [34] introduced the g-index as an enhancement of the h-index with the specific purpose of assessing the global citation performance of a collection of articles. Costas et al. [35] highlighted the increased sensitivity of the g-index in comparison to the h-index and underlined the complementary relationship between these two metrics. The m-index was proposed by Hirsch [31] as an alternative or complement to the h-index. The m-index is determined by dividing the h-index by the number of years the academic has been actively involved in their field, with the duration measured from their first published paper.

3. Results

The overview of this bibliometric analysis focusing on the primary characteristics of a research dataset related to microplastic pollution in freshwater ecosystems encompasses a ten-year timespan (2013–2023) and draws data from 214 distinct sources, including journals and books. In total, the dataset comprises 885 documents, reflecting a substantial annual growth rate of 73.13% and an average document age of 1.49 years. These documents received notable recognition, with an average of 30.17 citations per document and a cumulative reference count of 29,021. Citation distribution reveals that 50% of the papers have fewer than 9 citations, with the first quartile at 2 citations and the third quartile at 29 citations. While most of the papers have modest citation counts, the dataset includes a few highly cited papers, with a maximum citation count reaching 974, indicating a skewed distribution. The content of these documents is rich, featuring 1595 unique keywords plus terms and 2459 author’s keywords. Figure 2 provides a visual representation of the temporal trends in publication output, concurrently shedding light on the average citation rates, while also highlighting the research production of different nations. China is the leading country in terms of publications, with its growth rate sharply accelerating, particularly from 2020 onward, culminating in 805 articles by 2023. This growth significantly outpaced the contributions from other countries during the same period.

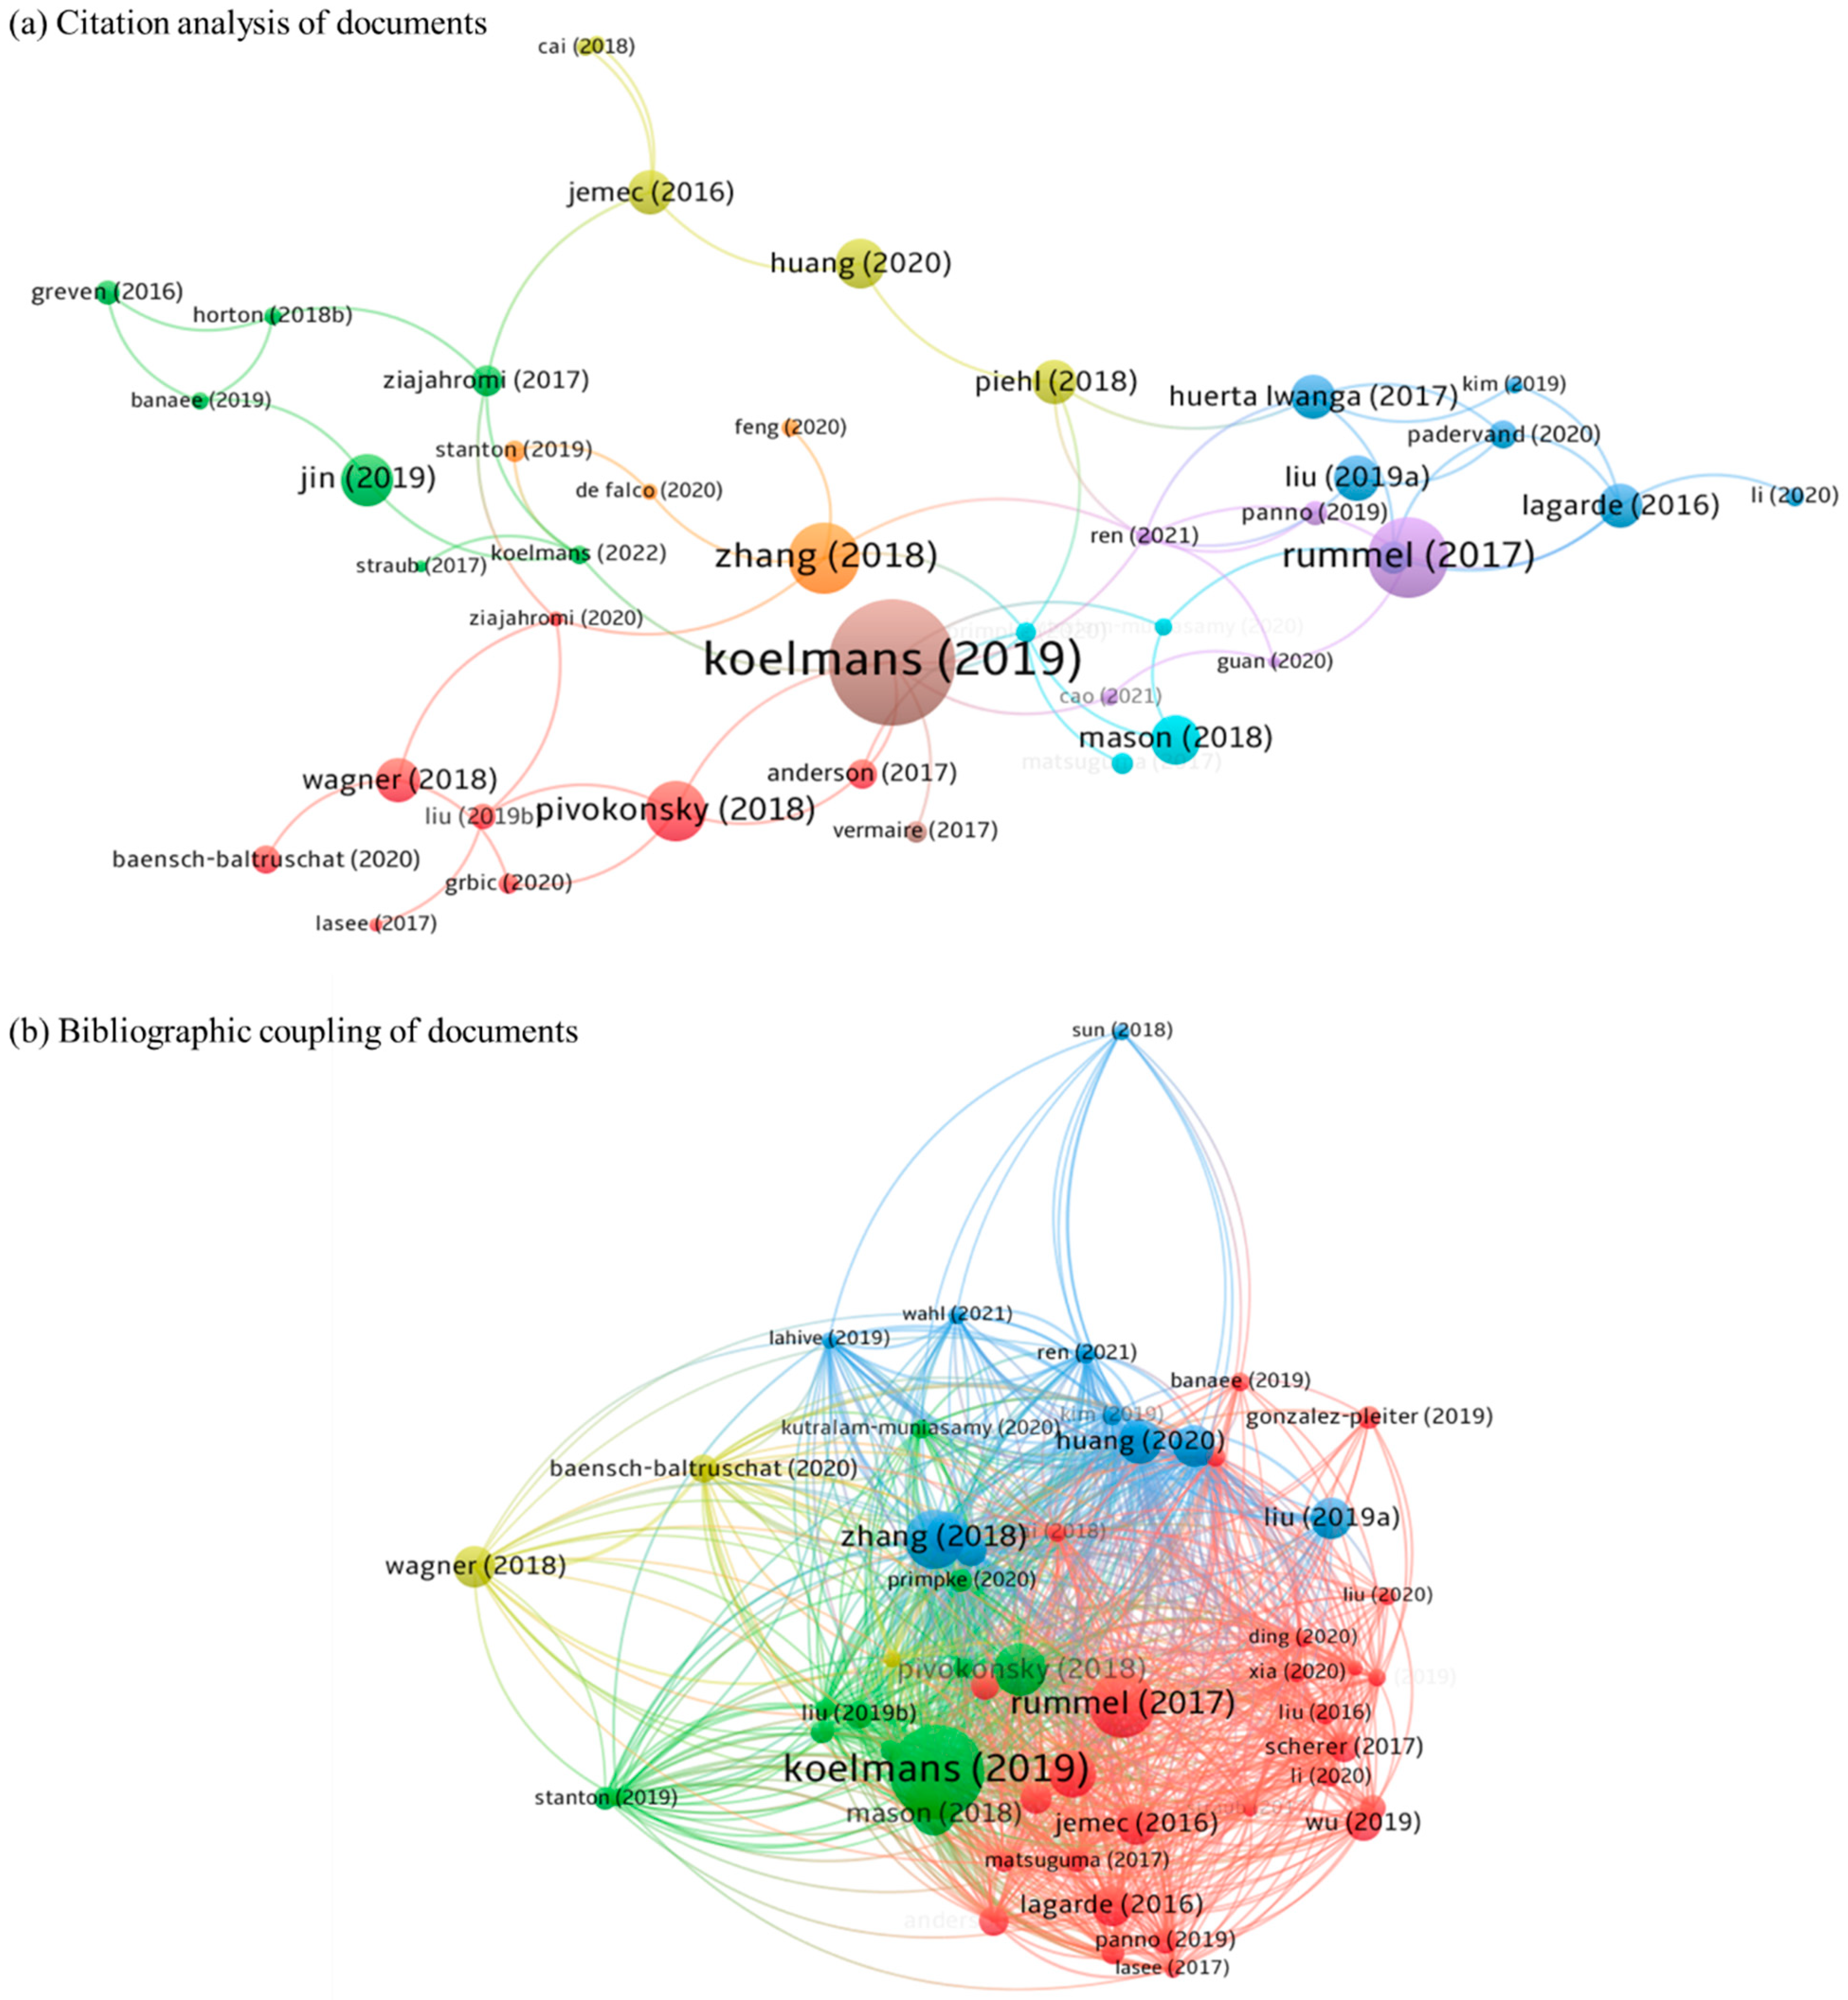
3.1. Key Sources and Highly Cited Publications

In the realm of academic publishing, the productivity and impact of scholarly journals play a crucial role in disseminating scientific knowledge. Table 1 presents a comprehensive overview of the top ten journals in the field of microplastic pollution in freshwater, showcasing their productivity, impact metrics, and historical context since their inception. Science of the Total Environment emerges as the leading journal with the highest h-index (39), g-index (74), and total citations (5780), signifying a remarkable impact despite being established in 2018. The Environmental Pollution journal follows closely behind, with a substantial h-index (29) and total citations (3621), highlighting its significance in the field since its inception in 2016. The year of first issue (PY-start) can help explain the varying degrees of impact, with older journals having had more time to accumulate citations and reputation. It is important to acknowledge that this table illustrates the journals’ regional influence, as evidenced by their presence in 885 publications related to microplastic pollution in freshwater ecosystems.
Figure 3a displays the network map, while Figure 3b focuses on journals in the context of the number of citations created using VOSviewer (Version 1.6.19). The prominent journals identified in Table 1 can also be cross-verified on the map through the size of their respective nodes. Notably, the journals are categorized into seven distinct clusters. More details can be found in Table S1. Cluster-1 (red) and Cluster-2 (green) each consist of 7 journals, while Cluster-3 (blue) and Cluster-4 (yellow) each comprise 5 journals (Figure 3a). Each journal’s cluster assignment reflects its interconnectedness with others in the same group. For example, in Cluster-1, which is represented in red colour, journals such as Science of the Total Environment have shown substantial link strength (27) and total citations (5780), making it one of the most influential in the cluster. The average publication year for Cluster-1 is approximately 2021.66, indicating that these journals have been publishing relatively recent research. In contrast, Cluster-4, in yellow, is characterized by journals like Environmental Pollution, with a remarkable total link strength (27) and total citations (3621), reflecting significant impact within the cluster. These journals, on average, published their documents around 2021.16. The analysis helps discern which journals are prominent within their respective clusters and offers insights into the trends, influence, and publication patterns in the field of study.
Bibliographic coupling and citation analysis are both techniques used in bibliometrics to understand the relationships between academic documents. Citation analysis (Figure 4a) examines the impact of documents by counting how many times they are cited by other documents, revealing their influence within the academic community. Bibliographic coupling (Figure 4b), on the other hand, looks at the similarity between documents based on their shared references, helping identify related documents or research trends.
Figure 4a illustrates eight distinct clusters of publications based on citation analysis related to microplastic pollution in freshwater ecosystems. Cluster-1 (red), spanning the years 2017 to 2020 and linked by 15 connections, features eight publications. Notably, Pivokonsky et al. [36] leads with an impressive 471 citations, and Baensch-Baltruschat et al. [37] stands out with a high normalized citation score of 3.986. Cluster-2 (green), covering the years 2016 to 2022, displays a broader temporal range and is connected through 20 links. Koelmans et al. [38] is a prominent publication within this cluster, amassing 149 citations, while Jin et al. [39] commands attention with 407 citations. Cluster-3 (blue), comprised of 25 links and publications mainly from 2016 to 2020, showcases significant diversity. Padervand et al. [40] is a standout publication with a remarkable normalized citation score of 3.986. In Cluster-4 (yellow), which predominantly includes publications from 2018 to 2020, 13 connections were found. Huang et al. [41] is a noteworthy publication, garnering 383 citations, while Jemec et al. [42] and Piehl et al. [43] contribute substantially. Cluster-5 (purple), covering mainly the years from 2017 to 2021 and linked by 17 connections, highlights [44] with an impressive 631 citations and Cao et al. [45] with a high normalized citation score of 4.431. Cluster-6 (turquoise), encompassing publications from 2017 to 2020 and linked by 13 connections, includes Primpke et al. [46] as a notable publication with substantial citations (163) and links (6). Mason et al. [47] exhibits the most influence within this cluster in terms of citation (389). In Cluster-7 (orange), Zhang et al. [48] emerges as the standout publication with 554 citations, primarily focusing on publications from recent years. Lastly, Cluster-8 (brown), with publications mainly from 2017 to 2019 and 12 connections, is characterized by Koelmans et al. [1] as the most influential publication, boasting 974 citations. These clusters provide an invaluable overview of the microplastic pollution research landscape, reflecting diverse citation patterns and the evolving focus of research over time.
Figure 4b visually represents four discrete publication clusters derived from bibliographic coupling analysis pertaining to the topic of microplastic pollution in freshwater ecosystems. In Cluster-1 (red), primarily comprising publications from 2016, significant connections among several publications was found. It boasts an impressive total link strength of 1057, highlighting the extensive connections among the publications. Notably, Rummel et al. [44] and Jin et al. [39] stand out with high citation counts of 631 and 407, respectively. These publications have significantly contributed to the cluster’s normalized citations, with Jin et al. [39] achieving an outstanding score of 3.328. [49] and Jemec et al. [42] showcase the cluster’s early contributions, while Wu et al. [50] and Ziajahromi et al. [51] highlight the more recent additions to the research landscape. It is important to mention that Koelmans et al. [38] makes a significant impact with 149 citations and a remarkable normalized citation score of 13.638, indicating its influential status. Cluster-2 (green), covering publications mainly from 2018 to 2020, is characterized by a network of 557 connections. Koelmans et al. [1] and Pivokonsky et al. [36] emerge as influential publications with 974 and 471 citations, respectively. These publications are pivotal in shaping the cluster’s research landscape, and their high link strength reflects the interconnectivity of the documents in this cluster. Additionally, Primpke et al. [46] holds the highest number of total links, a notable 342, within the cluster. In Cluster-3 (blue), spanning from 2017 to 2021 and connected through 530 links, Zhang et al. [48] stands out with the highest number of citations at 554, signifying its noteworthy impact within this cluster. Huang et al. [41] follows closely with 383 citations, attaining the highest normalized citations score of 6.939, showcasing its significant influence. Furthermore, Ren et al. [52] and Cao et al. [45] are relatively recent additions to the cluster, but they have already garnered noteworthy attention with 4.738 and 4.431 normalized citations, respectively. The publication by Sun et al. [53] stands out as a relatively less cited work, demonstrating its lower impact within this cluster. Cluster 4 (yellow) comprises publications that have moderate interlinking and a total links of 102, indicating a moderate level of connectedness among the works. In addition, [54] is the most cited publication in this cluster with 351 citations, suggesting its significant influence within the field. Baensch-Baltruschat et al. [37] and Ziajahromi et al. [55] have also garnered notable attention with 220 and 122 citations, respectively. Both of these publications exhibit higher-than-average normalized citations, underlining their impact and relevance.
The quantity of citations received by an article serves as a prominent indicator of its academic impact and influence. Table 2 presents the top 10 highly cited publications. The publication by Koelmans et al. [1] from the Netherlands, with a total of 974 citations, stands out as the most highly cited paper in the field of microplastic pollution in freshwater ecosystems, indicating its significant impact and influence in this research area. China also plays a prominent role, with authors like Zhang et al. [48], Jin et al. [39], and others amassing a total of 1705 citations. Notably, Huang et al. [41] achieves the highest total citation per year at 95.75 after Koelmans et al. [1] of 194.80, highlighting the global significance of this research in advancing the understanding of microplastic pollution. There is the possibility that an article in one discipline can be cited by another discipline. It is therefore essential to use citation analysis to determine the degree of connectivity between pairs of articles in the network created of 885 papers. Table 3 presents the findings of a citation analysis for the top 10 publications, whether they were cited within 885 papers or on a global scale. Specifically, local citations denote the frequency of citations originating from within this network (885 papers), whereas global citations encompass the complete tally of Scopus citations received by these papers. The data presented in Table 3 highlight substantial disparities between local and global citations. These discrepancies can be attributed to the interdisciplinary appeal of the field of microplastic pollution in freshwater ecosystems, attracting researchers from various domains. Moreover, the juxtaposition of papers in terms of their rankings based on local and global citations underscores that these two metrics do not necessarily align.
Notably, Koelmans et al. [1] from the Netherlands claims the top position with a substantial 974 global citations, signifying their significant global impact in this research domain. The article by Koelmans et al. [1] (receiving the highest citations) is a review article, published in Water Research, focused on microplastics in drinking water and fresh water sources. This is the outcome of a research project between the Netherlands and World Health Organization (WHO). Since drinking water is critically important, microplastic contamination of this water is of great concern, and hence this article has received great attention. The article by Rummel et al. [44] is the result of a collaborative research between Germany and Sweden, which reviewed the interactions of microbial colonization on plastic surfaces and surrounding environments in aquatic bodies. This has received the second highest number of citations since it focuses on several key issues regarding microplastic pollution of the aquatic environment, e.g., resuspension of contaminants and biofilm, and plastic interaction.
Scherer et al. [58] from Germany and Liu et al. [59] from Denmark have relatively high local citation/global citation ratios of 24.78% and 19.21%, respectively, indicating strong recognition within their local research domains. It is evident that, while some publications enjoy a more pronounced local impact, others have made a substantial global imprint, reflecting the dynamic nature of scientific influence in this field.

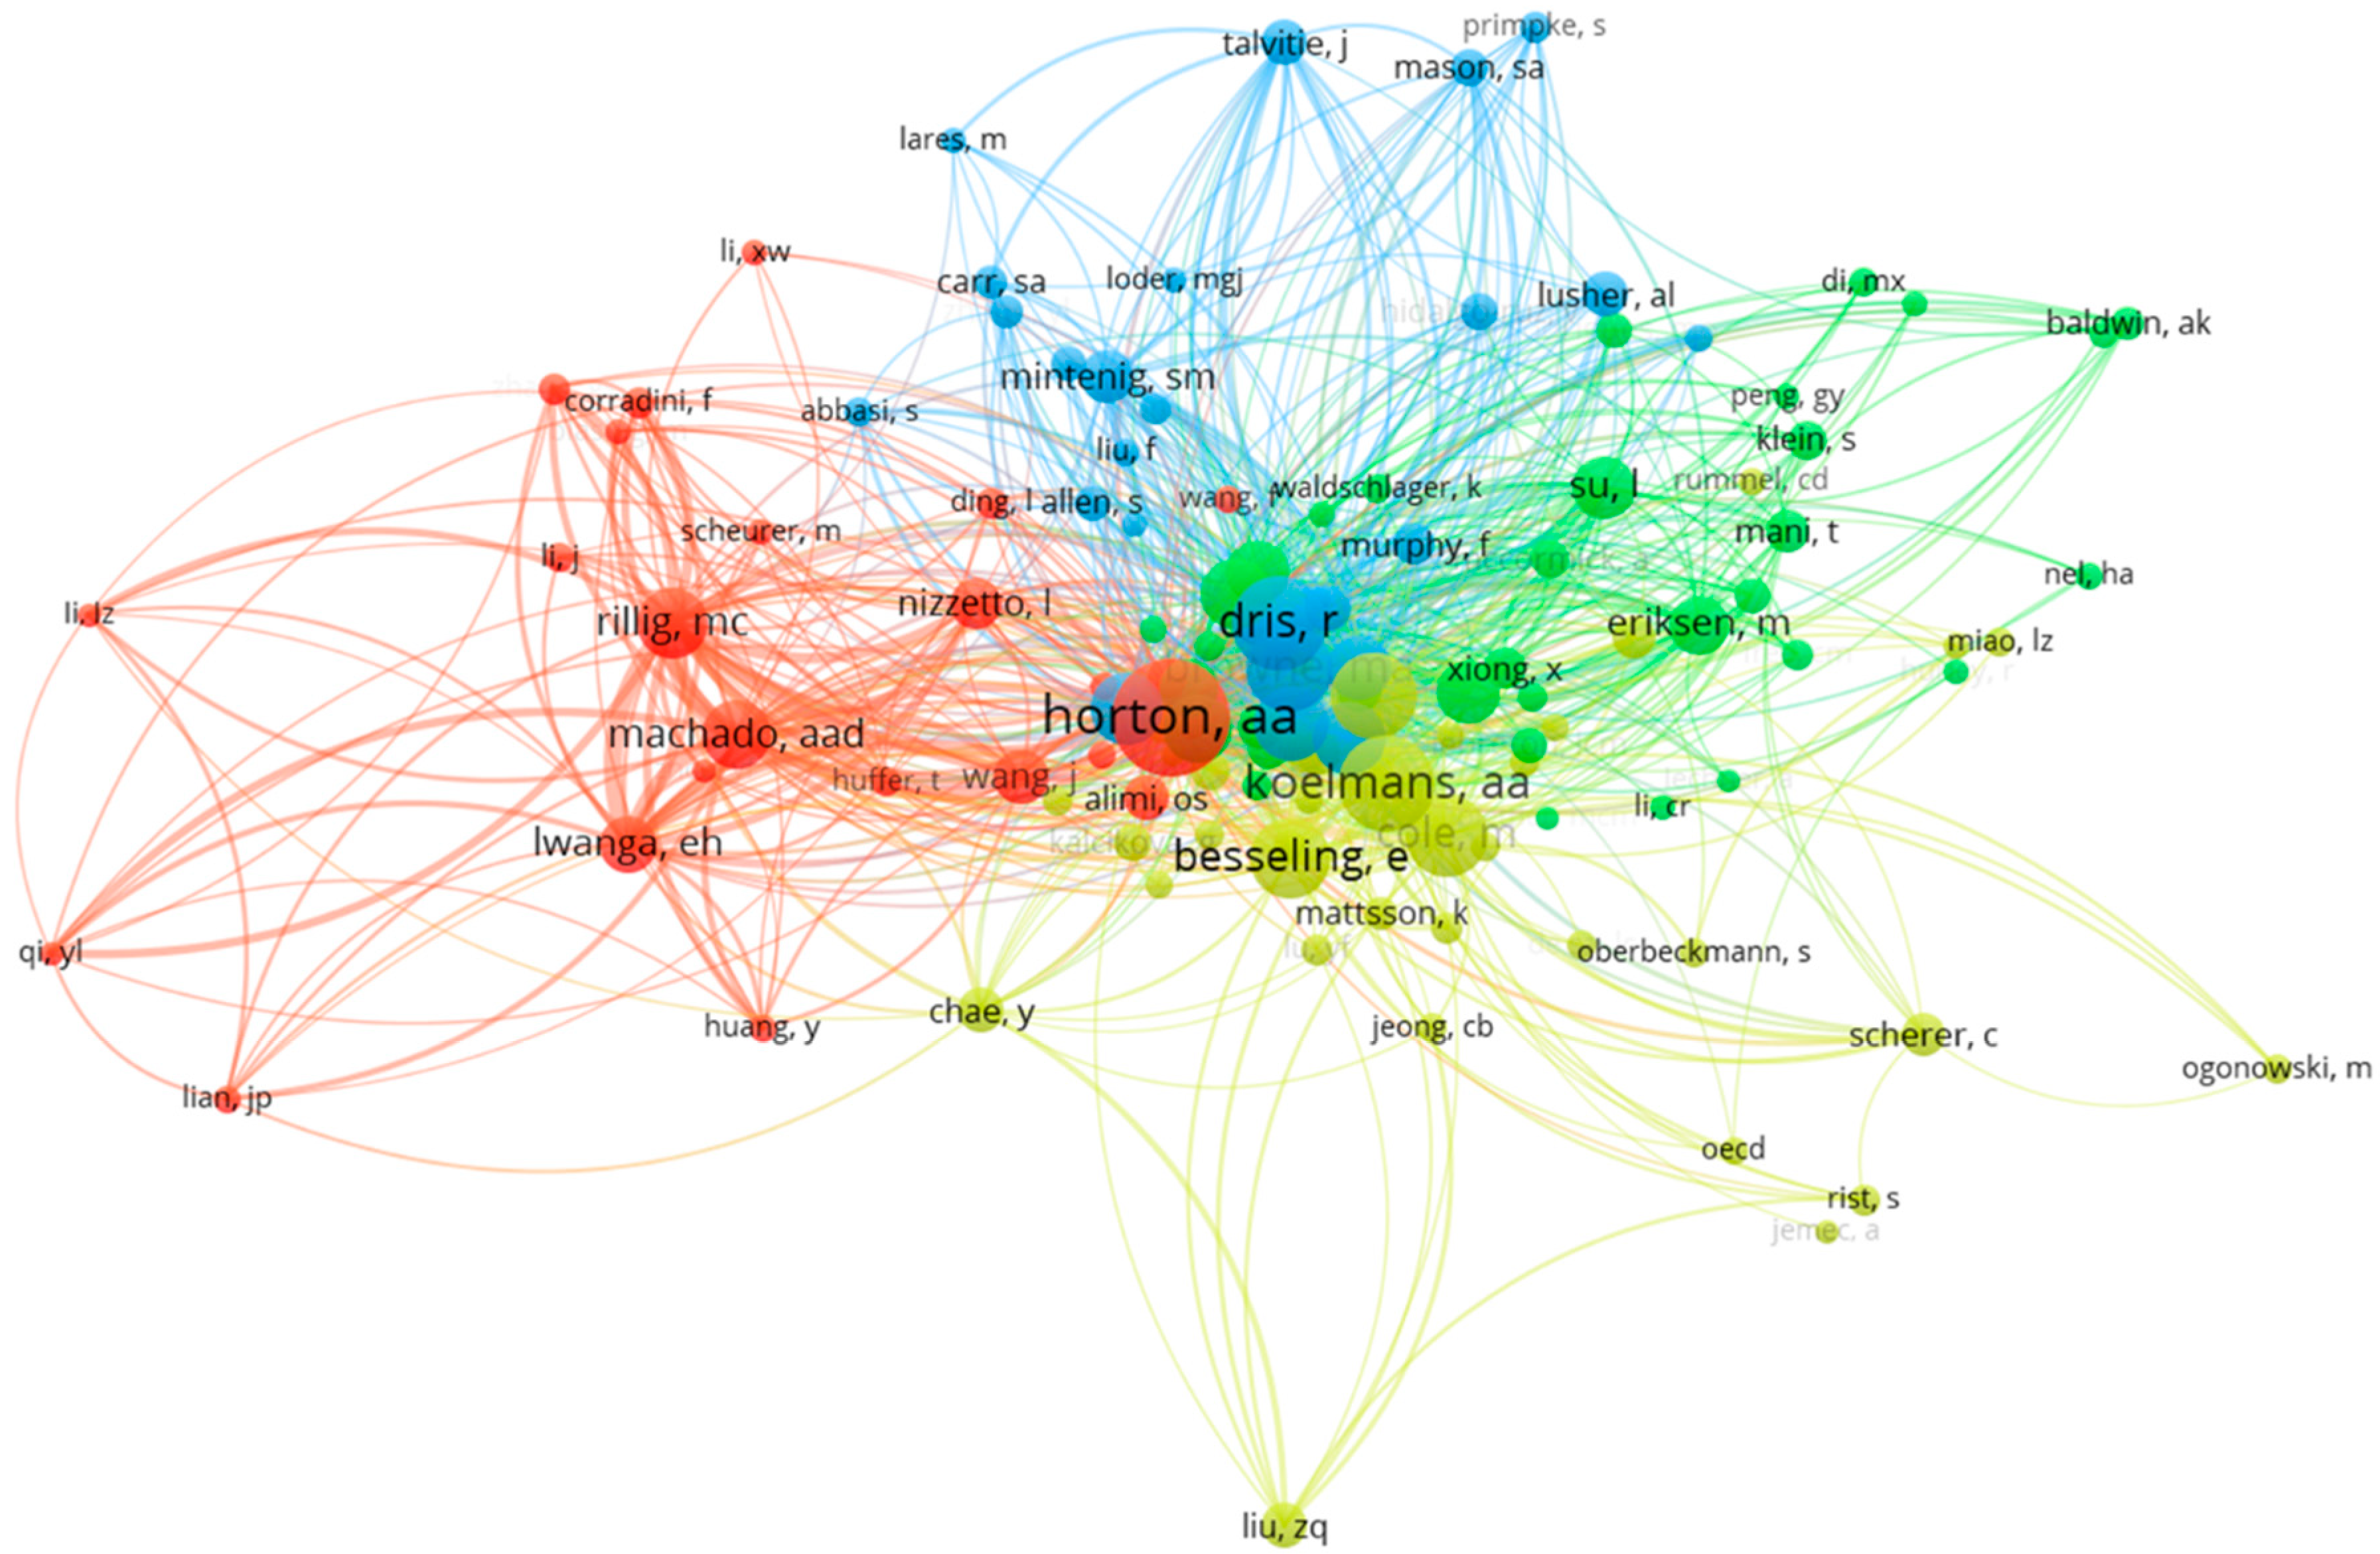
3.2. Author Statistics

The number of total publications by an author may reflect his/her research strength and the academic impact he/she has made. Therefore, the volume of a researcher’s publications within a specific field is considered a significant metric for assessing the author’s impact in that field [33]. Based on the findings, a total of 4051 authors collectively generated 885 publications. Of these authors, 82% (3323) had one publication, while 12.4% (501) had two publications. Notably, 31 authors, constituting a mere 0.8% of the entire author population, had more than five papers to their credit. It is noteworthy that these 31 authors’ contributions accounted for a substantial 23.3% (206) of the overall publication count. Table 4 presents a ranking of the most productive and influential authors in microplastic pollution in freshwater related studies. Koelmans AA (Wageningen University and Research, Netherlands) stands out as the most influential and productive author, boasting an impressive h-index of 12, the highest number of total citations at 1957, and a substantial g-index of 15, indicating a significant impact on his field. He has also published 15 papers, starting his research interest in this field in 2016. Rochman CM (University of Toronto, Canada), boasting an h-index of 9 and a g-index of 12, has a comparatively lower publication count (12) than Koelmans AA, but it is noteworthy that Rochman began her research career more recently in 2020 and holds the highest M-index among the listed authors, reflecting the significance and diversity of her research impact.
Co-authorship analysis provides valuable insights into authors’ collaborative patterns and relationships within the academic community. In a co-authorship analysis, the author must have at least five documents and five citations. For authors, the presence of only 4 authors linked to each other, while 25 authors remain unlinked, suggests a close-knit collaborative subnetwork within the larger group, with the isolated authors potentially having diverse research interests or representing early-career researchers in this field.
Figure 5 depicts the formation of four distinct author clusters, each comprising researchers with common research interests or co-citation patterns. The total link strength within each cluster varies, with Cluster 4 (red) having the highest total link strength (5991) and Cluster 2 (green) following closely (3626). These high link strengths indicate strong co-citation relationships among authors within these clusters. Horton AA in Cluster 4 (red) has the highest total citations (338), while Wang WF in Cluster 2 (green) has the lowest total citations between clusters but the highest in Cluster 2 (green) (264). This indicates varying levels of impact and recognition in their respective fields of study. The presence of co-citation patterns in each cluster implies collaborative research efforts, knowledge exchange, and shared expertise among authors. This networked collaboration is likely to have contributed to the advancement of research in their respective domains. Prominent authors from each cluster include: Cluster 1 (yellow) Koelmans AA and Rochman CM, with a total link strength of 4726 and 4427, alongside 264 and 231 citations, respectively; Cluster 2 (green) Wang WF and Thompson RC, with a total link strength of 3626 and 2962 and a total of 181 and 175 citations, respectively; Cluster 3 (blue) Dris R and Browne MA, with a total link strength of 5113 and 4308, and 256 and 243 total citations, respectively; and Cluster 4 (red) Horton AA and Rillig MC, with a total link strength of 5991 and 4059, alongside 338 and 184 citations.

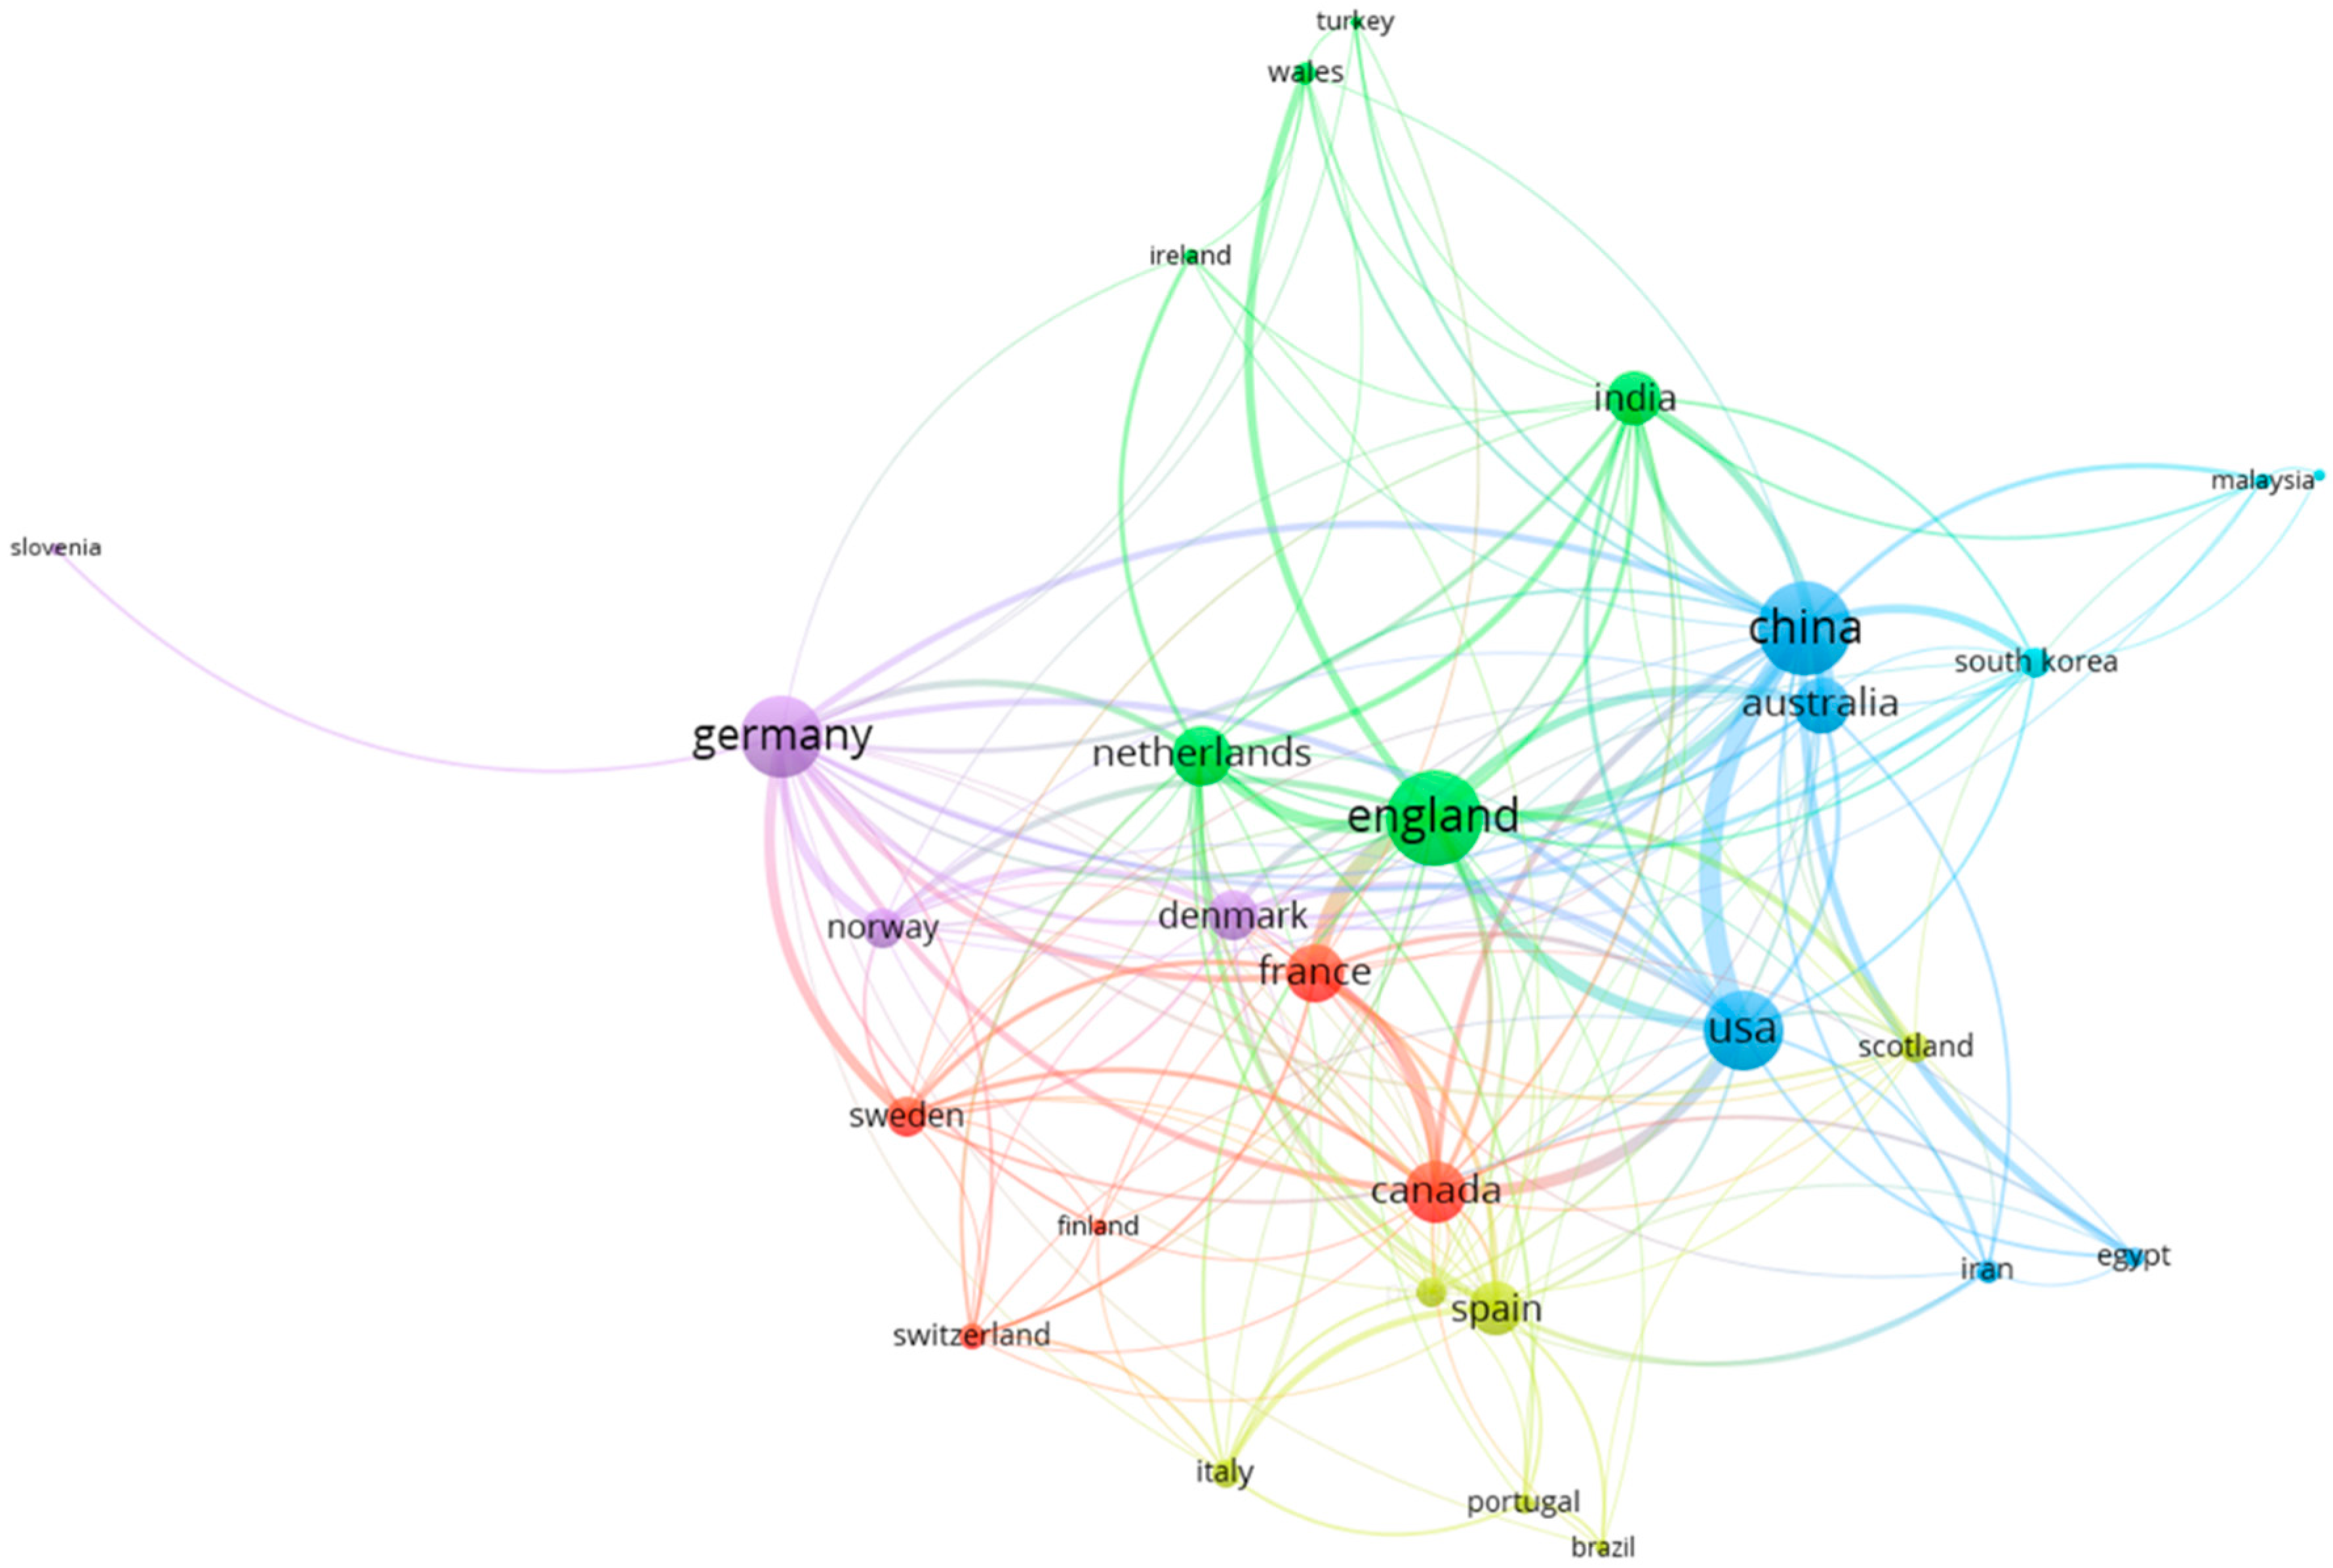
3.3. Contribution of Countries

The quantification of publications serves as a crucial metric for evaluating the trajectory of advancement within a particular domain of research. Table 5 presents the most active countries in microplastic pollution in the freshwater field, showing that China’s 278 articles, 8645 total citations, and 57 multiple country publications reflect its prolific research output, global influence, and commitment to international research collaboration. Germany and the USA follow closely in terms of articles, with 57 and 56, respectively, while demonstrating different strengths. Germany’s high MCP-Ratio (0.228) signifies a significant collaborative research effort, the USA’s total citations of 1802 showcase the impact of its research, and the United Kingdom stands out with a substantial MCP ratio of 0.400, indicating a strong emphasis on collaborative research endeavors.
Figure 6 illustrates scientific production of countries in terms of number of publications. It can be seen that the number of publications (articles) in Table 5 and Figure 6 are different. This is because Figure 6 was generated by quantifying the occurrence of “author affiliations by country”. In other words, if an article includes three authors affiliated with the USA, China, and Australia, the count for each of these countries will be increased accordingly.
Figure 7 illustrates global partnerships among countries, considering a minimum threshold for both publication productivity and citation impact. Co-authorship analysis has been employed in various research studies to examine scientific collaboration [61,62,63,64]. Network visualization maps provide a visual representation of the scope and intensity of connections between countries. The size of the circles indicates the overall influence of each country, while the thickness of the lines signifies the depth of collaboration between any two countries. Utilizing the full counting method for co-authorship analysis [65], it is observed that there were a total of 354 connections established among 29 out of the 79 countries, forming six distinct clusters within the research field. The subsequent country pairs were identified as having robust collaborative relationships: China–USA (link strength = 12), England–France (link strength = 10), Australia–China (link strength = 9), Canada–USA (link strength = 7), England–Netherlands (link strength = 7), England–USA (link strength = 7). The top five countries with the highest total link strength in terms of co-authorships are as follows: England = 72, China = 71, Germany = 60, USA = 59, and Canada = 44. The Bibliometrix (R package 4.1.3) [66] performs its analysis for the United Kingdom as a whole entity, considering all its constituent countries together. On the other hand, VOSviewer (Version 1.6.19) [65] allows for a more detailed approach by addressing England, Wales, and Scotland as separate entities, which can provide a more fine-grained analysis of research collaborations and networks within the UK.

3.4. Keyword Statistics

The frequency analysis of keywords serves as a crucial research tool, offering insights into the fundamental components of the associated research field [67]. It helps to identify and highlight the key themes, concepts, and areas of focus within the study. Table 6 lists the most frequently used keyword plus, and authors’ keywords, in microplastic pollution in freshwater-related studies during 2016–2023. Keywords plus are index terms generated through a computer algorithm, primarily drawn from frequently recurring words (those appearing more than once) in both document titles and reference lists. The utilization of keywords plus enriches bibliometric analysis by enhancing the breadth and depth of content representation within a document [68], given that they constitute the predominant subset of author-provided keywords [69]. Consequently, keywords plus have gained widespread adoption as a valuable tool for pinpointing research gaps and emerging trends in various scientific investigations [70,71,72].
Notably, the keyword “Pollution” saw a remarkable increase in total frequency from 10 in 2016–2018 to 128 in 2022–2023, signifying a substantial surge in research focus. “Freshwater” exhibited consistent interest, with TF values of 7, 68, and 91 for the respective time periods. “Microplastics” demonstrated significant growth, with a total frequency of 3 in 2016–2018, rising to 63 in 2022–2023. On the authors’ keywords front, “Microplastics” led the way with a substantial increase from a frequency of 6 in 2016–2018 to 199 in 2022–2023. “Microplastic” also showed noteworthy growth, from 10 in 2016–2018 to 95 in 2022–2023. These numerical trends underscore the dynamic nature of environmental research, marked by an escalating emphasis on issues such as pollution and microplastic contamination, while also highlighting the enduring importance of freshwater ecosystems in environmental science over the years.

4. Discussion

The present study focused on the evolution of the microplastic research field in the last decade (2013–2023). The analysis used data from 885 documents to understand the annual growth rate and average age of the documents, which have been found to be 73.13% and 1.49 years, respectively, reflecting a significant interest. Many of these studies are related to developing strategies that would substantially reduce plastic usage and the subsequent impact on greenhouse gas emissions [73]. It can be argued that researchers worldwide have been taking significant steps towards fulfilling their share of UNEA Resolution 5/14, where 193 UN member states agreed to initiate an internationally legally binding instrument to control plastic pollution [74].
The countries that showed the most interest in microplastic topics were China, followed by Australia and the USA. The growth rate for China sharply increased from 2020 onward. It is extraordinary to see that Chinese researchers published 805 articles on microplastics in 2023. The leading journal that is at the forefront of publishing microplastic-related articles is Science of the Total Environment, according to all the matrices considered for this study. The other journals that are very close in the race are Environmental Pollution and the Journal of Hazardous Materials and Water Research. This demonstrates the importance and significance of the research area. One of the interesting findings in some of these studies is that microplastics already make their way to pollute freshwater systems. Traces of microplastics have been detected in freshwater bodies in Europe, North America, and Asia. It is also reported that freshwater fauna are ingesting microplastics, which is detrimental to their health, and there is potential that these pollutants will eventually affect human health [75,76]. Although the initial attention was primarily focused on plastic pollution in marine environments, with significant studies highlighting its detrimental impact on marine ecosystems [77,78,79,80], in the last few years several research articles have been published focusing on microplastics in freshwater systems, including several review articles [75,81,82,83]. The dynamics of microplastics in freshwater were proposed by Ding et al. [26], who investigated chemical stability and disposal methods. Li et al. [27] also published an article on microplastic pollution in freshwater and presented a comprehensive understanding of the sources and effective detection and characterization methods. Meanwhile, Sarijan et al. [29] explored the geographical variations of contaminants and discussed the methods of microplastic extraction.
A highly cited paper was published by Koelmans et al. [1] from the Netherlands, with a total of 974 citations. The focus of the paper was microplastic pollution in freshwater ecosystems. It was also found that the same author stands out as the most influential and productive author, with an h-index of 12. The strongest scientific collaboration was found between China and the USA. It is interesting that, most of the time, European countries have collaborated with each other, but networking is rare in countries outside of Europe. It is also unfortunate to see that the collaboration between developed and developing countries is limited, which is an enormous hurdle to eliminating plastics, as this is a global problem. Information sharing and awareness are crucial to attaining success, as most people in developing countries may not realise the impact of this problem. Workshops, seminars, conferences, and high school exhibitions may be some of the strategies that can be implemented in developing countries to disseminate the research findings in a more engaging and effective way.
One of the most important issues is that microplastics contaminate marine animals, ecosystems, and habitats, which has made this a transboundary issue. There is a lack of policy direction and mitigation measures to combat the situation, as most of the international treaties on pollution control are non-binding to a country. Research on recycling, development of alternative bio-degradable materials, source controls and public awareness would help to reduce microplastic pollution.

5. Conclusions

This bibliometric analysis offers a comprehensive overview of the scholarly landscape surrounding microplastic pollution in freshwater ecosystems over the past decade (2013–2023). The following conclusions are drawn from this study:
  • An exponential growth is found in the number publications dealing with microplastic pollutions in freshwater ecosystems, with an annual growth rate of 73.13% in publications and an average citation rate of 30.17 per document.
  • The leading publication venues are Science of the Total Environment and Environmental Pollution, which have played pivotal roles in disseminating high-impact research in this domain.
  • It is observed that the contributions of China, Germany, and the USA are more dominant, and the network visualization maps and co-authorship analyses reveal a dynamic landscape of international collaborations, forming robust partnerships among several countries: China–USA, England–France, and Australia–China.
  • The author statistics reveal a highly collaborative and productive scholarly community, with a small cohort of researchers significantly shaping the field. Notably, Koelmans AA (Wageningen University and Research, Netherlands) emerges as a key figure, with a substantial body of work that includes 15 publications and an h-index of 12, reflecting his considerable impact and leadership in microplastic research since 2016. Similarly, Rochman CM’s (University of Toronto, Canada) notable contributions, highlighted by her h-index of 9 and the highest M-index despite her more recent entry into the field, underscore the dynamic and influential nature of individual scholarly contributions.

Supplementary Materials

The following supporting information can be downloaded at: https://www.mdpi.com/article/10.3390/w16223237/s1, Table S1: Network and overlay visualization of citation analysis for journals. Table S2: Citation analysis of publications (minimum number of citations are 100 for each).

Author Contributions

G.Y.: Conceptualization, Methodology, Software, Analysis, Visualization, Writing original draft; M.A.: Conceptualization, Writing original draft, Validation; X.P.: Conceptualization, Methodology, Software, Analysis, Visualization, Writing original draft; S.R.: Writing original draft, Validation, Writing: Review and Editing; M.A.A.: Conceptualization, Writing original draft; R.S.: Writing—Review and Editing, Validation; A.R.: Conceptualization, Writing—review and editing, Supervision. All authors have read and agreed to the published version of the manuscript.

Funding

This research received no external funding.

Data Availability Statement

The data presented in this study are openly available in the Web of Science database (https://www.webofscience.com/, accessed on 12 September 2023).

Acknowledgments

The authors acknowledge the developers of all the software/tools used in the bibliometric analysis.

Conflicts of Interest

The authors declare that there are no conflicts of interest.

References

  1. Koelmans, A.A.; Mohamed Nor, N.H.; Hermsen, E.; Kooi, M.; Mintenig, S.M.; De France, J. Microplastics in freshwaters and drinking water: Critical review and assessment of data quality. Water Res. 2019, 155, 410–422. [Google Scholar] [CrossRef] [PubMed]
  2. Eerkes-Medrano, D.; Thompson, R.C.; Aldridge, D.C. Microplastics in freshwater systems: A review of the emerging threats, identification of knowledge gaps and prioritisation of research needs. Water Res. 2015, 75, 63–82. [Google Scholar] [CrossRef] [PubMed]
  3. Koelmans, A.A.; Besseling, E.; Shim, W.J. Nanoplastics in the Aquatic Environment. Critical Review.pdf. Mar. Anthropog. Litter 2015, 325–340. [Google Scholar] [CrossRef]
  4. Su, L.; Xue, Y.; Li, L.; Yang, D.; Kolandhasamy, P.; Li, D.; Shi, H. Microplastics in Taihu Lake, China. Environ. Pollut. 2016, 216, 711–719. [Google Scholar] [CrossRef]
  5. Cozar, A.; Echevarria, F.; Gonzalez-Gordillo, J.I.; Irigoien, X.; Ubeda, B.; Hernandez-Leon, S.; Palma, A.T.; Navarro, S.; Garcia-de-Lomas, J.; Ruiz, A.; et al. Plastic debris in the open ocean. Proc. Natl. Acad. Sci. USA 2014, 111, 10239–10244. [Google Scholar] [CrossRef]
  6. Rocha-Santos, T.; Duarte, A.C. A critical overview of the analytical approaches to the occurrence, the fate and the behavior of microplastics in the environment. TrAC Trends Anal. Chem. 2015, 65, 47–53. [Google Scholar] [CrossRef]
  7. Fendall, L.S.; Sewell, M.A. Contributing to marine pollution by washing your face: Microplastics in facial cleansers. Mar. Pollut. Bull. 2009, 58, 1225–1228. [Google Scholar] [CrossRef]
  8. Singh, B.; Sharma, N. Mechanistic implications of plastic degradation. Polym. Degrad. Stab. 2008, 93, 561–584. [Google Scholar] [CrossRef]
  9. Thompson, R.C.; Olsen, Y.; Mitchell, R.P.; Davis, A.; Rowland, S.J.; John, A.W.; McGonigle, D.; Russell, A.E. Lost at sea: Where is all the plastic? Science 2004, 304, 838. [Google Scholar] [CrossRef]
  10. Eriksen, M.; Mason, S.; Wilson, S.; Box, C.; Zellers, A.; Edwards, W.; Farley, H.; Amato, S. Microplastic pollution in the surface waters of the Laurentian Great Lakes. Mar. Pollut. Bull. 2013, 77, 177–182. [Google Scholar] [CrossRef]
  11. Yonkos, L.T.; Friedel, E.A.; Perez-Reyes, A.C.; Ghosal, S.; Arthur, C.D. Microplastics in four estuarine rivers in the Chesapeake Bay, U.S.A. Environ. Sci. Technol. 2014, 48, 14195–14202. [Google Scholar] [CrossRef] [PubMed]
  12. Long, M.; Moriceau, B.; Gallinari, M.; Lambert, C.; Huvet, A.; Raffray, J.; Soudant, P. Interactions between microplastics and phytoplankton aggregates: Impact on their respective fates. Mar. Chem. 2015, 175, 39–46. [Google Scholar] [CrossRef]
  13. Desforges, J.P.; Galbraith, M.; Ross, P.S. Ingestion of Microplastics by Zooplankton in the Northeast Pacific Ocean. Arch. Environ. Contam. Toxicol. 2015, 69, 320–330. [Google Scholar] [CrossRef] [PubMed]
  14. Farrell, P.; Nelson, K. Trophic level transfer of microplastic: Mytilus edulis (L.) to Carcinus maenas (L.). Environ. Pollut. 2013, 177, 1–3. [Google Scholar] [CrossRef]
  15. Lei, L.; Wu, S.; Lu, S.; Liu, M.; Song, Y.; Fu, Z.; Shi, H.; Raley-Susman, K.M.; He, D. Microplastic particles cause intestinal damage and other adverse effects in zebrafish Danio rerio and nematode Caenorhabditis elegans. Sci. Total Environ. 2018, 619–620, 1–8. [Google Scholar] [CrossRef]
  16. Yang, D.; Shi, H.; Li, L.; Li, J.; Jabeen, K.; Kolandhasamy, P. Microplastic Pollution in Table Salts from China. Environ. Sci. Technol. 2015, 49, 13622–13627. [Google Scholar] [CrossRef]
  17. Brennecke, D.; Ferreira, E.C.; Costa, T.M.; Appel, D.; da Gama, B.A.; Lenz, M. Ingested microplastics (>100 mum) are translocated to organs of the tropical fiddler crab Uca rapax. Pollut. Mar. Pollut. Bull. 2015, 96, 491–495. [Google Scholar] [CrossRef]
  18. Diepens, N.J.; Koelmans, A.A. Accumulation of Plastic Debris and Associated Contaminants in Aquatic Food Webs. Environ. Sci. Technol. 2018, 52, 8510–8520. [Google Scholar] [CrossRef]
  19. Gasperi, J.; Wright, S.L.; Dris, R.; Collard, F.; Mandin, C.; Guerrouache, M.; Langlois, V.; Kelly, F.J.; Tassin, B. Microplastics in air: Are we breathing it in? Curr. Opin. Environ. Sci. Health 2018, 1, 1–5. [Google Scholar] [CrossRef]
  20. Van Cauwenberghe, L.; Janssen, C.R. Microplastics in bivalves cultured for human consumption. Environ. Pollut. 2014, 193, 65–70. [Google Scholar] [CrossRef]
  21. Wright, S.L.; Kelly, F.J. Plastic and Human Health: A Micro Issue? Environ. Sci. Technol. 2017, 51, 6634–6647. [Google Scholar] [CrossRef] [PubMed]
  22. Cassio, F.; Batista, D.; Pradhan, A. Plastic Interactions with Pollutants and Consequences to Aquatic Ecosystems: What We Know and What We Do Not Know. Biomolecules 2022, 12, 798. [Google Scholar] [CrossRef] [PubMed]
  23. Junaid, M.; Siddiqui, J.A.; Liu, S.; Lan, R.; Abbas, Z.; Chen, G.; Wang, J. Adverse multigeneration combined impacts of micro(nano)plastics and emerging pollutants in the aquatic environment. Sci. Total Environ. 2023, 882, 163679. [Google Scholar] [CrossRef] [PubMed]
  24. Islam, T.; Li, Y.; Rob, M.M.; Cheng, H. Microplastic pollution in Bangladesh: Research and management needs. Environ. Pollut. 2022, 308, 119697. [Google Scholar] [CrossRef]
  25. Mishra, A.K.; Singh, J.; Mishra, P.P. Microplastics in freshwater ecosystem: A serious threat for freshwater environment. Int. J. Environ. Sci. Technol. 2022, 20, 9189–9204. [Google Scholar] [CrossRef]
  26. Ding, R.; Tong, L.; Zhang, W. Microplastics in Freshwater Environments: Sources, Fates and Toxicity. Water Air Soil Pollut. 2021, 232, 181. [Google Scholar] [CrossRef]
  27. Li, C.; Busquets, R.; Campos, L.C. Assessment of microplastics in freshwater systems: A review. Sci. Total Environ. 2020, 707, 135578. [Google Scholar] [CrossRef]
  28. Nguyen, M.-K.; Rakib, M.R.J.; Lin, C.; Hung, N.T.Q.; Le, V.-G.; Nguyen, H.-L.; Malafaia, G.; Idris, A.M. A comprehensive review on ecological effects of microplastic pollution: An interaction with pollutants in the ecosystems and future perspectives. TrAC Trends Anal. Chem. 2023, 168, 117294. [Google Scholar] [CrossRef]
  29. Sarijan, S.; Azman, S.; Said, M.I.M.; Jamal, M.H. Microplastics in freshwater ecosystems: A recent review of occurrence, analysis, potential impacts, and research needs. Environ. Sci. Pollut. Res. Int. 2021, 28, 1341–1356. [Google Scholar] [CrossRef]
  30. Zupic, I.; Čater, T. Bibliometric methods in management and organization. Organ. Res. Methods 2015, 18, 429–472. [Google Scholar] [CrossRef]
  31. Hirsch, J.E. An index to quantify an individual’s scientific research output. Proc. Natl. Acad. Sci. USA 2005, 102, 16569–16572. [Google Scholar] [CrossRef]
  32. Molinari, J.-F.; Molinari, A. A new methodology for ranking scientific institutions. Scientometrics 2008, 75, 163–174. [Google Scholar] [CrossRef]
  33. Wang, Z.; Zhao, Y.; Wang, B. A bibliometric analysis of climate change adaptation based on massive research literature data. J. Clean. Prod. 2018, 199, 1072–1082. [Google Scholar] [CrossRef]
  34. Egghe, L. Theory and practise of the g-index. Scientometrics 2006, 69, 131–152. [Google Scholar] [CrossRef]
  35. Costas, R.; Bordons, M. Is g-index better than h-index? An exploratory study at the individual level. Scientometrics 2008, 77, 267–288. [Google Scholar] [CrossRef]
  36. Pivokonsky, M.; Cermakova, L.; Novotna, K.; Peer, P.; Cajthaml, T.; Janda, V. Occurrence of microplastics in raw and treated drinking water. Sci. Total Environ. 2018, 643, 1644–1651. [Google Scholar] [CrossRef]
  37. Baensch-Baltruschat, B.; Kocher, B.; Stock, F.; Reifferscheid, G. Tyre and road wear particles (TRWP)—A review of generation, properties, emissions, human health risk, ecotoxicity, and fate in the environment. Sci. Total Environ. 2020, 733, 137823. [Google Scholar] [CrossRef]
  38. Koelmans, A.A.; Redondo-Hasselerharm, P.E.; Nor, N.H.M.; de Ruijter, V.N.; Mintenig, S.M.; Kooi, M. Risk assessment of microplastic particles. Nat. Rev. Mater. 2022, 7, 138–152. [Google Scholar] [CrossRef]
  39. Jin, Y.; Lu, L.; Tu, W.; Luo, T.; Fu, Z. Impacts of polystyrene microplastic on the gut barrier, microbiota and metabolism of mice. Sci. Total Environ. 2019, 649, 308–317. [Google Scholar] [CrossRef]
  40. Padervand, M.; Lichtfouse, E.; Robert, D.; Wang, C. Removal of microplastics from the environment. A review. Environ. Chem. Lett. 2020, 18, 807–828. [Google Scholar] [CrossRef]
  41. Huang, Y.; Liu, Q.; Jia, W.; Yan, C.; Wang, J. Agricultural plastic mulching as a source of microplastics in the terrestrial environment. Environ. Pollut. 2020, 260, 114096. [Google Scholar] [CrossRef] [PubMed]
  42. Jemec, A.; Horvat, P.; Kunej, U.; Bele, M.; Kržan, A. Uptake and effects of microplastic textile fibers on freshwater crustacean Daphnia magna. Environ. Pollut. 2016, 219, 201–209. [Google Scholar] [CrossRef] [PubMed]
  43. Piehl, S.; Leibner, A.; Löder, M.G.J.; Dris, R.; Bogner, C.; Laforsch, C. Identification and quantification of macro- and microplastics on an agricultural farmland. Sci. Rep. 2018, 8, 17950. [Google Scholar] [CrossRef] [PubMed]
  44. Rummel, C.D.; Jahnke, A.; Gorokhova, E.; Kühnel, D.; Schmitt-Jansen, M. Impacts of Biofilm Formation on the Fate and Potential Effects of Microplastic in the Aquatic Environment. Environ. Sci. Technol. Lett. 2017, 4, 258–267. [Google Scholar] [CrossRef]
  45. Cao, Y.; Zhao, M.; Ma, X.; Song, Y.; Zuo, S.; Li, H.; Deng, W. A critical review on the interactions of microplastics with heavy metals: Mechanism and their combined effect on organisms and humans. Sci. Total Environ. 2021, 788, 147620. [Google Scholar] [CrossRef]
  46. Primpke, S.; Christiansen, S.H.; Cowger, W.; De Frond, H.; Deshpande, A.; Fischer, M.; Holland, E.B.; Meyns, M.; O’Donnell, B.A.; Ossmann, B.E.; et al. Critical Assessment of Analytical Methods for the Harmonized and Cost-Efficient Analysis of Microplastics. Appl. Spectrosc. 2020, 74, 1012–1047. [Google Scholar] [CrossRef]
  47. Mason, S.A.; Welch, V.G.; Neratko, J. Synthetic Polymer Contamination in Bottled Water. Front. Chem. 2018, 6, 407. [Google Scholar] [CrossRef]
  48. Zhang, G.S.; Liu, Y.F. The distribution of microplastics in soil aggregate fractions in southwestern China. Sci. Total Environ. 2018, 642, 12–20. [Google Scholar] [CrossRef]
  49. Lagarde, F.; Olivier, O.; Zanella, M.; Daniel, P.; Hiard, S.; Caruso, A. Microplastic interactions with freshwater microalgae: Hetero-aggregation and changes in plastic density appear strongly dependent on polymer type. Environ. Pollut. 2016, 215, 331–339. [Google Scholar] [CrossRef]
  50. Wu, X.; Pan, J.; Li, M.; Li, Y.; Bartlam, M.; Wang, Y. Selective enrichment of bacterial pathogens by microplastic biofilm. Water Res. 2019, 165, 114979. [Google Scholar] [CrossRef]
  51. Ziajahromi, S.; Kumar, A.; Neale, P.A.; Leusch, F.D.L. Impact of Microplastic Beads and Fibers on Waterflea (Ceriodaphnia dubia) Survival, Growth, and Reproduction: Implications of Single and Mixture Exposures. Environ. Sci. Technol. 2017, 51, 13397–13406. [Google Scholar] [CrossRef] [PubMed]
  52. Ren, Z.; Gui, X.; Xu, X.; Zhao, L.; Qiu, H.; Cao, X. Microplastics in the soil-groundwater environment: Aging, migration, and co-transport of contaminants—A critical review. J. Hazard. Mater. 2021, 419, 126455. [Google Scholar] [CrossRef] [PubMed]
  53. Sun, M.; Ye, M.; Jiao, W.; Feng, Y.; Yu, P.; Liu, M.; Jiao, J.; He, X.; Liu, K.; Zhao, Y.; et al. Changes in tetracycline partitioning and bacteria/phage-comediated ARGs in microplastic-contaminated greenhouse soil facilitated by sophorolipid. J. Hazard. Mater. 2018, 345, 131–139. [Google Scholar] [CrossRef] [PubMed]
  54. Wagner, S.; Hüffer, T.; Klöckner, P.; Wehrhahn, M.; Hofmann, T.; Reemtsma, T. Tire wear particles in the aquatic environment—A review on generation, analysis, occurrence, fate and effects. Water Res. 2018, 139, 83–100. [Google Scholar] [CrossRef]
  55. Ziajahromi, S.; Drapper, D.; Hornbuckle, A.; Rintoul, L.; Leusch, F.D.L. Microplastic pollution in a stormwater floating treatment wetland: Detection of tyre particles in sediment. Sci. Total Environ. 2020, 713, 136356. [Google Scholar] [CrossRef]
  56. Liu, P.; Qian, L.; Wang, H.; Zhan, X.; Lu, K.; Gu, C.; Gao, S. New Insights into the Aging Behavior of Microplastics Accelerated by Advanced Oxidation Processes. Environ. Sci. Technol. 2019, 53, 3579–3588. [Google Scholar] [CrossRef]
  57. Huerta Lwanga, E.; Gertsen, H.; Gooren, H.; Peters, P.; Salánki, T.; van der Ploeg, M.; Besseling, E.; Koelmans, A.A.; Geissen, V. Incorporation of microplastics from litter into burrows of Lumbricus terrestris. Environ. Pollut. 2017, 220, 523–531. [Google Scholar] [CrossRef]
  58. Scherer, C.; Brennholt, N.; Reifferscheid, G.; Wagner, M. Feeding type and development drive the ingestion of microplastics by freshwater invertebrates. Sci. Rep. 2017, 7, 17006. [Google Scholar] [CrossRef]
  59. Liu, F.; Vianello, A.; Vollertsen, J. Retention of microplastics in sediments of urban and highway stormwater retention ponds. Environ. Pollut. 2019, 255, 113335. [Google Scholar] [CrossRef]
  60. Panno, S.V.; Kelly, W.R.; Scott, J.; Zheng, W.; McNeish, R.E.; Holm, N.; Hoellein, T.J.; Baranski, E.L. Microplastic Contamination in Karst Groundwater Systems. Groundwater 2019, 57, 189–196. [Google Scholar] [CrossRef]
  61. Iqbal, U.; Riaz, M.Z.B.; Barthelemy, J.; Perez, P.; Idrees, M.B. The last two decades of computer vision technologies in water resource management: A bibliometric analysis. Water Environ. J. 2023, 37, 373–389. [Google Scholar] [CrossRef]
  62. Glänzel, W. National characteristics in international scientific co-authorship relations. Scientometrics 2001, 51, 69–115. [Google Scholar] [CrossRef]
  63. Adams, J.D.; Black, G.C.; Clemmons, J.R.; Stephan, P.E. Scientific teams and institutional collaborations: Evidence from U.S. universities, 1981–1999. Res. Policy 2005, 34, 259–285. [Google Scholar] [CrossRef]
  64. Yildirim, G.; Rahman, A.; Singh, V. A Bibliometric Analysis of Drought Indices, Risk, and Forecast as Components of Drought Early Warning Systems. Water 2022, 14, 253. [Google Scholar] [CrossRef]
  65. van Eck, N.J.; Waltman, L. Software survey: VOSviewer, a computer program for bibliometric mapping. Scientometrics 2010, 84, 523–538. [Google Scholar] [CrossRef]
  66. Aria, M.; Cuccurullo, C. bibliometrix: An R-tool for comprehensive science mapping analysis. J. Informetr. 2017, 11, 959–975. [Google Scholar] [CrossRef]
  67. Su, H.-N.; Lee, P.-C. Mapping knowledge structure by keyword co-occurrence: A first look at journal papers in Technology Foresight. Scientometrics 2010, 85, 65–79. [Google Scholar] [CrossRef]
  68. Garfield, E. KeyWords Plus-ISI’s breakthrough retrieval method. 1. Expanding your searching power on current-contents on diskette. Curr. Contents 1990, 32, 5–9. [Google Scholar]
  69. Zhang, J.; Yu, Q.; Zheng, F.; Long, C.; Lu, Z.; Duan, Z. Comparing keywords plus of WOS and author keywords: A case study of patient adherence research. J. Assoc. Inf. Sci. Technol. 2016, 67, 967–972. [Google Scholar] [CrossRef]
  70. Mao, N.; Wang, M.-H.; Ho, Y.-S. A Bibliometric Study of the Trend in Articles Related to Risk Assessment Published in Science Citation Index. Hum. Ecol. Risk Assess. Int. J. 2010, 16, 801–824. [Google Scholar] [CrossRef]
  71. Yildirim, G.; Alim, M.A.; Rahman, A. Review of Rainwater Harvesting Research by a Bibliometric Analysis. Water 2022, 14, 3200. [Google Scholar] [CrossRef]
  72. Li, J.; Wang, M.-H.; Ho, Y.-S. Trends in research on global climate change: A Science Citation Index Expanded-based analysis. Glob. Planet. Chang. 2011, 77, 13–20. [Google Scholar] [CrossRef]
  73. OECD. Towards Eliminating Plastic Pollution by 2040—A Policy Scenario Analysis; OECD: Paris, France, 2023. [Google Scholar]
  74. UNEP. End Plastic Pollution: Towards an International Legally Binding Instrument; UNEP: Nairobi, Kenya, 2022. [Google Scholar]
  75. Ivar Do Sul, J.A.; Costa, M.F. The present and future of microplastic pollution in the marine environment. Environ. Pollut. 2014, 185, 352–364. [Google Scholar] [CrossRef] [PubMed]
  76. Li, W.; Li, X.; Tong, J.; Xiong, W.; Zhu, Z.; Gao, X.; Li, S.; Jia, M.; Yang, Z.; Liang, J. Effects of Environmental and Anthropogenic Factors on the Distribution and Abundance of Microplastics in Freshwater Ecosystems. Sci. Total Environ. 2023, 856, 159030. [Google Scholar] [CrossRef]
  77. Sharma, S.; Chatterjee, S. Microplastic pollution, a threat to marine ecosystem and human health: A short review. Environ. Sci. Pollut. Res. 2017, 24, 21530–21547. [Google Scholar] [CrossRef]
  78. Tsang, Y.Y.; Mak, C.W.; Liebich, C.; Lam, S.W.; Sze, E.T.P.; Chan, K.M. Microplastic pollution in the marine waters and sediments of Hong Kong. Mar. Pollut. Bull. 2017, 115, 20–28. [Google Scholar] [CrossRef]
  79. Van Cauwenberghe, L.; Vanreusel, A.; Mees, J.; Janssen, C.R. Microplastic pollution in deep-sea sediments. Environ. Pollut. 2013, 182, 495–499. [Google Scholar] [CrossRef]
  80. Li, J.; Liu, H.; Paul Chen, J. Microplastics in freshwater systems: A review on occurrence, environmental effects, and methods for microplastics detection. Water Res. 2018, 137, 362–374. [Google Scholar] [CrossRef]
  81. Prata, J.C.; Silva, C.J.; Serpa, D.; Soares, A.M.; Gravato, C.; Silva, A.L.P. Mechanisms Influencing the Impact of Microplastics on Freshwater Benthic Invertebrates: Uptake Dynamics and Adverse Effects on Chironomus Riparius. Sci. Total Environ. 2023, 859, 160426. [Google Scholar] [CrossRef]
  82. Alessandra, C.; Cesarini, G.; Scalici, M. Microplastics in Freshwater: What Is the News from the World? Diversity 2020, 12, 276. [Google Scholar] [CrossRef]
  83. Wu, W.-M.; Yang, J.; Criddle, C.S. Criddle. Microplastics Pollution and Reduction Strategies. Front. Environ. Sci. Eng. 2016, 11, 6. [Google Scholar]
Figure 1. Implemented bibliometric analysis workflow in this study.
Water 16 03237 g001
Figure 2. (a) Annual publications (2013–2023) and (b) production over time of top 10 countries. Total number of publications is given in the parenthesis for each country.
Water 16 03237 g002
Figure 3. Network and overlay visualization of citation analysis for journals. Individual published journals are represented by nodes. The size of each node is determined by its total link strength within the network. Links connecting the nodes indicate the strength of relationships between these journals, with the width of the links reflecting the intensity of these relationships. The distance separating the nodes signifies the degree of relatedness between the journals. To aid in categorization, colours in (a) are employed to group journals into clusters based on their citations, providing a visual representation of the thematic or content similarities among them whereas colour in (b) represents average publication year.
Water 16 03237 g003
Figure 4. Citation analysis and bibliographic coupling of documents. (a) Each cluster colour represents a group of papers that frequently cite one another, indication closely connected studies within the field. (b) Each cluster colour represents a set of documents with shared bibliographies, suggesting that these papers are working on overlapping or related topics.
Water 16 03237 g004
Figure 5. Author network visualization via co-citation analysis. Node size represents the quantity of citations received by each author, while the connections between nodes delineate the co-citation associations among authors. The thickness of these connections characterizes the intensity of co-citation relationships. The spacing between nodes signifies the degree of author relatedness, and the colours indicate the co-citation-based cluster to which each author is affiliated.
Water 16 03237 g005
Figure 6. Countries’ scientific production.
Water 16 03237 g006
Figure 7. Network visualization map of country co-authorships. Countries with a minimum of 10 published and cited articles were included. The map includes 29 out of 79 countries in 6 clusters. Each colour represents a cluster of countries with strong co-authorship ties, indicating frequent collaboration on research.
Water 16 03237 g007
Table 1. The most productive journals by the number of publications.
RankJournalh-Indexg-Indexm-IndexTCNPPY-Start
1Science of the Total Environment39746.557801522018
2Environmental Pollution29603.6253621762016
3Journal of Hazardous Materials22363.6671351552018
4Water Research21443.52884442018
5Chemosphere183531290412018
6Environmental Science and Pollution Research16232.667568332018
7Environmental Science and Technology19292.7141572292017
8Water10152259232019
9Environmental Toxicology and Chemistry8141451142016
10Environmental Research6102117132021
Table 2. Globally, the most frequently cited publications on microplastic pollution in freshwater-related studies.
RankAuthorCountryTCTCPYNTCJournal
1Koelmans et al. [1]Netherlands974194.807.96Water Research
2Rummel et al. [44]Germany63190.142.54Environmental Science and Technology Letters
3Zhang et al. [48]China55492.332.84Science of the Total Environment
4Pivokonsky et al. [36]Czech Republic47178.502.41Science of the Total Environment
5Jin et al. [39]China40781.403.33Science of the Total Environment
6Mason et al. [47]United States38964.831.99Frontiers in Chemistry
7Huang et al. [41]China38395.756.94Environmental Pollution
8Liu et al. [56]China36172.202.95Environmental Science and Technology
9Wagner et al. [54]Germany35158.501.80Water Research
10Huerta Lwanga et al. [57]Mexico34949.861.41Environmental Pollution
Notes: Country refers to the country where the first institution of the author’s latest paper; TC is total citation; TCPY is total citation per year; NTC is normalized total citation.
Table 3. The top 10 publications’ citation measures.
RankAuthorCountryLCGCLC/GC Ratio (%)NLC
1Koelmans et al. [1]Netherlands9997410.168.49
2Scherer et al. [58]Germany5723024.781.94
3Rummel et al. [44]Germany536318.401.81
4Zhang et al. [48]China455548.122.81
5Jemec et al. [42]Slovenia4334212.572.01
6Liu et al. [59]Denmark3920319.213.34
7Lagarde et al. [49]France3834610.981.78
8Pivokonsky et al. [36]Czech Republic364717.642.25
9Panno et al. [60]United States3519118.323.00
10Wu et al. [50]China3429711.452.91
Notes: Country refers to the country where the first institution of the author’s latest paper; LC is local citation and presents citation within the 885 publications; GC is global citation presents actual Scopus citation, NLC is normalized local citation.
Table 4. The most productive and influential authors.
RankAuthorh-Indexg-Indexm-IndexTCLCNPPY-Start
1Koelmans AA12151.501957200152016
2Rochman CM9122.2540664122020
3Horton AA771.177339372018
4Wu CX7101.7522441102020
5Xiong X781.751763782020
6Gasperi J661.5095962020
7Li YM681.503053782020
8Liu ZQ681.503373782020
9Redondo-H. PE671.004105272018
10Zhao YL681.503053782020
Notes: TC is total citation; LC is local citation within 885 papers; NP is number of publications; PY-start is year of the first published paper.
Table 5. The most productive countries by the number of publications (based on corresponding author).
RankCountryArticlesTCSCPMCPMCP Ratio
1China2788645221570.205
2Germany57286544130.228
3USA5618024970.125
4United Kingdom50167830200.400
5Canada399943270.179
6Korea326952660.188
7Italy294792090.310
8Australia257641960.240
9France25180513120.480
10India243721860.250
Notes: TC is total citations; SCP is single country publication; MCP is multiple country publication; MCP-ratio is MCP/Articles.
Table 6. Frequently used keywords plus and authors’ keywords over time.
RankKeyword PlusTF2016–20182019–20212022–2023
1Pollution2201082128
2Freshwater16676891
3Particles149125780
4Sediments11864666
5Microplastics10533963
6Ingestion9844153
7Water9013059
8River8713551
9Toxicity8433744
10Accumulation8153640
RankAuthors’ KeywordsTF2016–20182019–20212022–2023
1Microplastics301696199
2Microplastic164105995
3Freshwater5102031
4Nano-plastics4011920
5Plastic Pollution3941718
6Sediment3801226
7Pollution3001119
8Nano-plastic283817
9Toxicity2111010
10Wastewater212109
Note: TF is total frequency.
Disclaimer/Publisher’s Note: The statements, opinions and data contained in all publications are solely those of the individual author(s) and contributor(s) and not of MDPI and/or the editor(s). MDPI and/or the editor(s) disclaim responsibility for any injury to people or property resulting from any ideas, methods, instructions or products referred to in the content.

