Article

Are Water Filters Effective Against Microplastics?

by
Igor David da Costa
1,2,*,
Natalia Neto dos Santos Nunes
3,
Leonardo Lopes Costa
2,4 and
Ilana Rosental Zalmon
2
1
Department of Exact, Biological and Earth Sciences, Fluminense Federal University, Santo Antônio de Pádua, Rio de Janeiro 28470-000, Brazil
2
Environmental Sciences Laboratory, University of North Rio de Janeiro, Campos dos Goytacazes, Rio de Janeiro 28013-602, Brazil
3
Graduate Program in Environmental Sciences, Federal University of Rondônia, Rolim de Moura, Rondônia 76801-974, Brazil
4
Solar Brazil Institute for Development, Health and Research—ISOBRAS, Campos dos Goytacazes, Rio de Janeiro 28010-170, Brazil
*
Author to whom correspondence should be addressed.
Water 2024, 16(22), 3189; https://doi.org/10.3390/w16223189
Submission received: 16 October 2024 / Revised: 27 October 2024 / Accepted: 5 November 2024 / Published: 7 November 2024
(This article belongs to the Section Wastewater Treatment and Reuse)

Abstract

:
Microplastics (MPs) are reported as ubiquitous in the environment. In recent years, these microplastic particles have been found in table salt, seafood, and honey, as well as in drinking water. However, the process by which water reaches households for consumption has not yet been investigated. Thus, we compared the concentration, shape, color, size, and polymer types of MPs in water sources that have passed through different filtration techniques for human consumption such as water purifiers, ceramic filters, and tap water. A total of 9262 items of microplastics were identified in the analyzed water samples. Higher MP concentration (ANOVA, F = 68.16; D.F. = 2; p < 0.01) was observed in water from purifiers (1.41 MPs/L) and taps (1.13 MPs/L) compared to ceramic filter water (0.49 MPs/L). Transparent fibers ranging in size from <500 µ to >5 mm, composed of polyester, polypropylene, and polyamide, were predominant in all water samples. We emphasize that regulations and restrictions related to the production and use of plastics, promotion of environmental education (scientific dissemination) for the population, and the development and popularization of filters that promote the retention of MPs at the source and also in sinks are useful measures for reducing contamination of water bodies and water for human consumption.

1. Introduction

Although plastics are extremely useful materials for modern society, plastic production and waste generation continue to increase, exacerbating environmental impacts [1]. The breakdown of large plastic items inadvertently produces microplastics (MPs), characterized as particles smaller than 5 mm. These are widespread pollutants in aquatic and terrestrial ecosystems that pose a threat to the environment and human health [2,3].
The ubiquity of MPs in the environment is an undeniable fact [4]. Reports of MPs in freshwater environments are constantly expanding and updating, particularly in rivers, lakes, reservoirs, and groundwater [5]. This highlights the issue of MPs in water for human consumption, given that the mentioned environments are sources of drinking water [5,6,7,8]. MPs can be ingested through drinking water, which is the main route through which humans are exposed to such synthetic particles [9], presenting risks to human health [10]. Recently, MPs have indeed been found in various human tissues and organs, such as the lungs, heart, blood, testicles, placenta, and brain [11,12].
Studies on MPs in drinking water began in 2018, focusing on bottled water [13,14,15]. Since then, MPs have been reported in tap water, drinking water treatment plants (DWTPs), and the water supply chain [16,17]. A recent review by Yang et al. [5], considering the occurrence of MPs in bottled water, tap water, and water from DWTPs, indicates that only two studies have been conducted to quantify the abundance of MPs in tap water in Brazil (e.g., central region of Brazil, [18]; southern Brazil [19]). Despite being relatively recent, knowledge about MPs in water for human consumption has rapidly increased [10].
Although the demand for bottled water is growing all over, most Brazilian people do not have the means or choose not to buy it and use other alternatives, such as water purifiers and domestic water filters. The practice of filtering water before drinking is ancient and aids in its potability by eliminating solid particles and pathogens [20]. Filters retain impurities in the water through a porous material that allows water to pass through. Bellingieri [21] defines the common clay filter as a set of two ceramic (clay) containers, equipped with one or more filter candles and fitted with a tap in the lower container. The candle (ceramic filter) is a hollow cylindrical piece made of porous material whose function is to retain particles and bacteria present in the water. The main users of this filtration system are low-income families, who purchase filters at small- and medium-sized stores, supermarkets, and building material stores [22]. However, due to the impracticality of maintenance, this system has fallen out of use and has been replaced by more modern versions, such as water purifiers, which can be attached to the faucet and contain an activated carbon filter inside, allowing water to pass through a filtering element with smaller pores [20].
In light of the known effects of MPs on biotic and abiotic matrices [23], their role in absorbing and transferring pollutants (e.g., heavy metals, pesticides, and pharmaceuticals) [24], their colonization by microorganisms [25], the annual increase in MP discharges into aquatic environments [26], and the presence of MPs in human body [11,12], arguments linking MPs and public health have been raised [24]. Thus, this study aimed to compare the concentration, shape, color, size, and polymer types of MPs present in water for consumption in educational institutions and residences that collect water from the main water supply sources for the population in southeastern Brazil, the Paraíba do Sul River basin (PSR), an important point of plastic outflow into the South Atlantic. As a null hypothesis, it was tested that the concentration and richness (number of MP morphotypes and colors combinations) of MPs do not vary between water filtration systems, given the continuous and regular influx of MPs throughout the year from local domestic and industrial discharges [27,28] and the inability of water treatment plants to retain MPs.

2. Materials and Methods
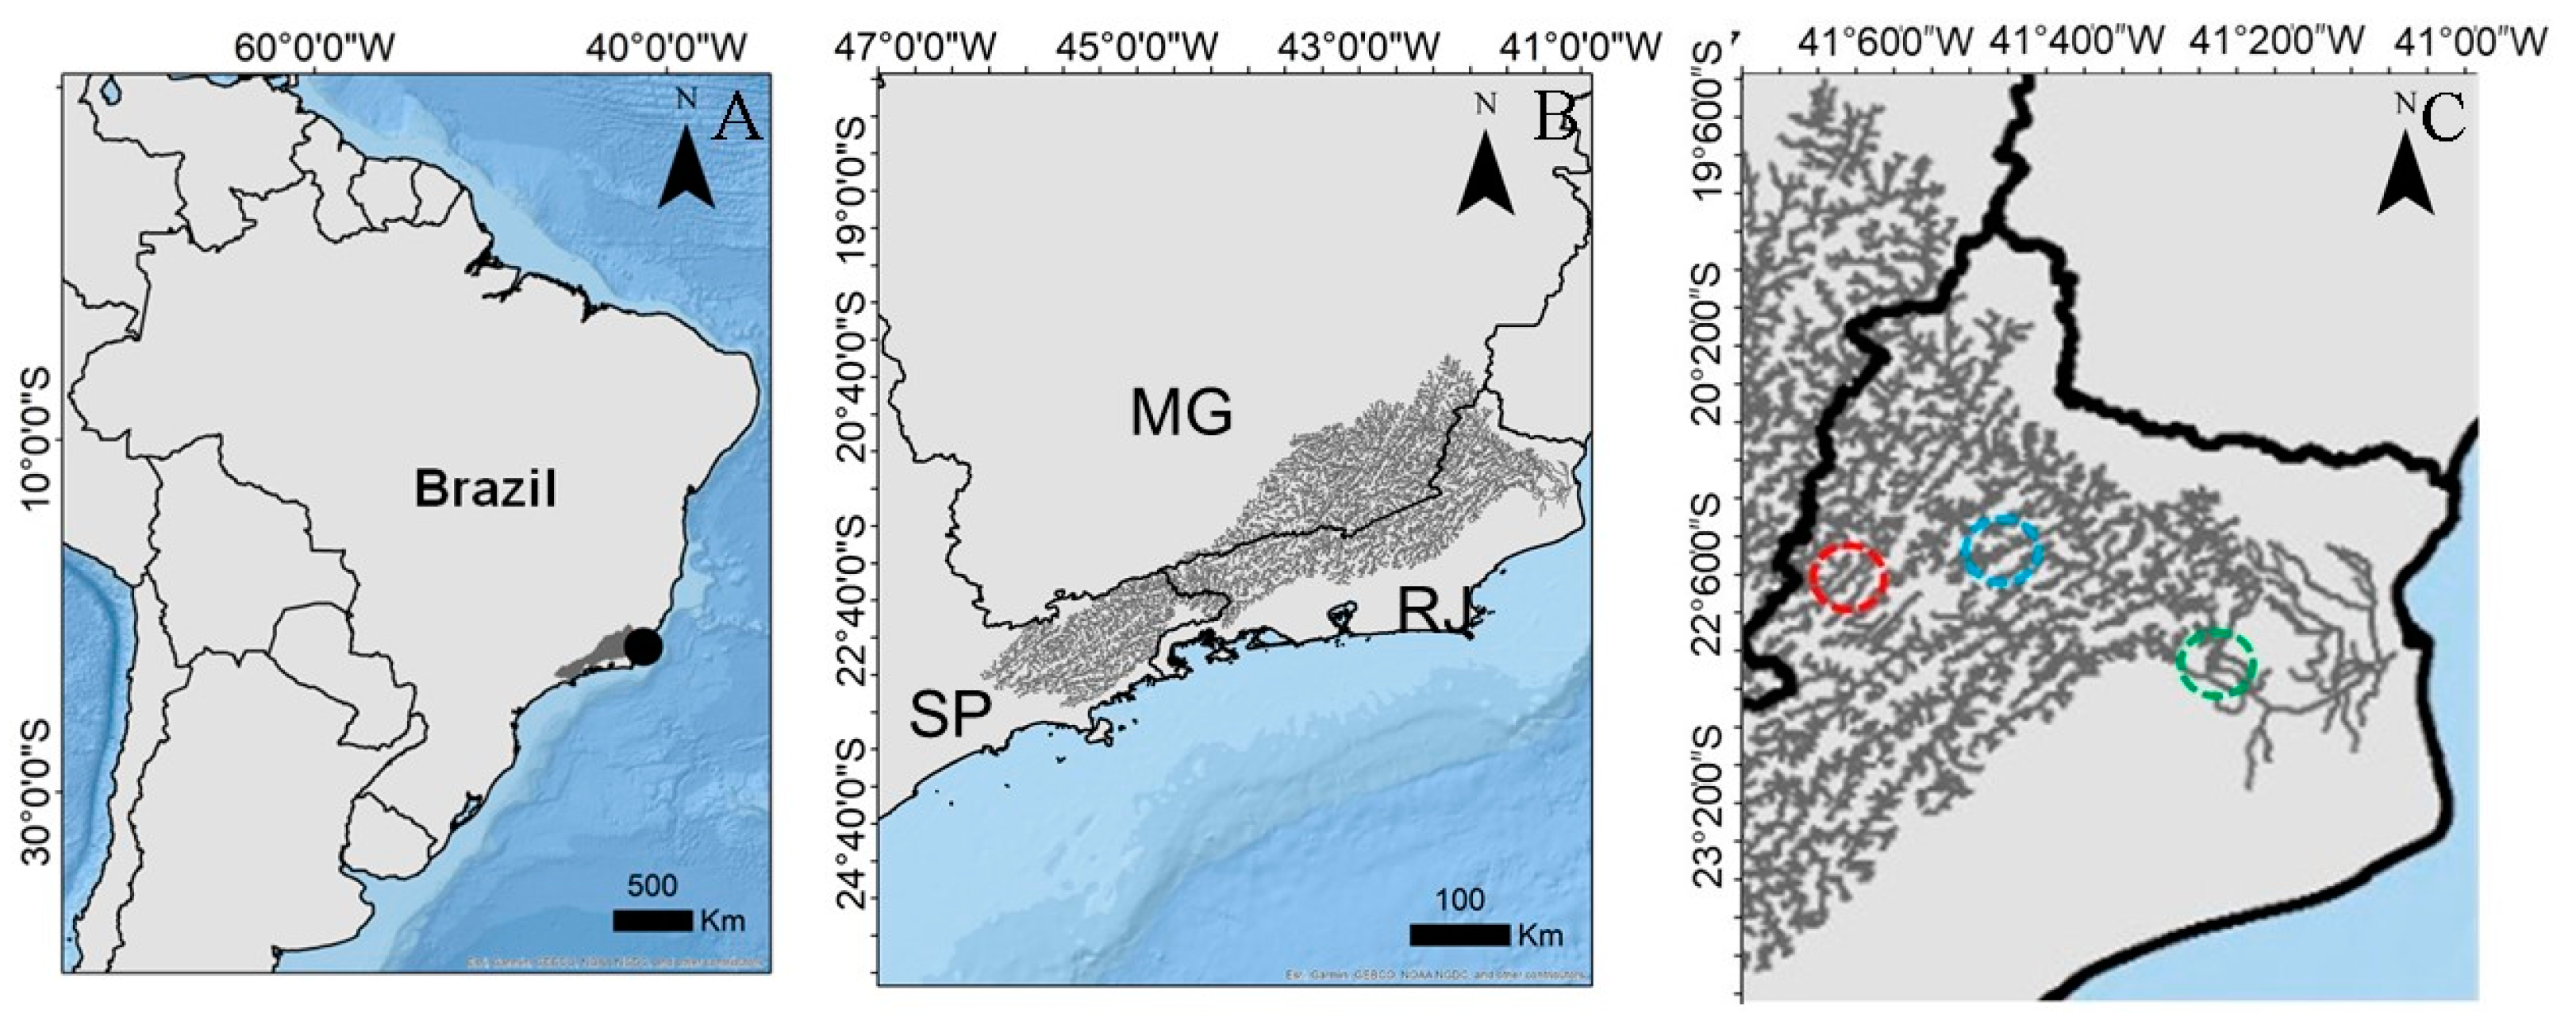
2.1. Study Area

This study was conducted in households and educational institutions located in the Paraíba do Sul River basin (PSR), which covers an area of 62,074 km2 and is 1145 km long. Flow rates vary from 1158 m3s−1 in summer to 444 m3s−1 in winter [29]. The PSR spans three states in southeastern Brazil: São Paulo, Rio de Janeiro, and Minas Gerais, totaling 184 municipalities [30] and encompassing 14.5 million inhabitants [31]. The PSR basin is included in the region with the highest population density and water demand in South America [32,33] and holds significant national importance as it is located in a region that concentrates Brazil’s major industrial and population centers, responsible for generating 12% of Brazil’s gross domestic product [31].
The main anthropogenic impacts on the basin are related to dams and watercourse diversions [34], agriculture (rice and sugarcane cultivation), automotive and aerospace industries, sand mining, tourism, and services [30,31]. The low coverage of basic sanitation, which leads to the discharge of untreated domestic sewage directly into watercourses [35], as well as the decreasing vegetation cover, are major environmental impacts in the basin [36].

2.2. Sampling

Water sampling was conducted between March and September 2023 at nine collection points, comprising four educational institutions and five residences, all located in the lower Paraíba do Sul River (PSR) region in southeastern Brazil (Figure 1).
Tap water (TW) samples were collected at each location using a metal pipe, with a small piece of latex hose attached to the upper end directly connected to the water outlet (as described in [37]) and a digital water volume meter (Joekol brand, Yueqing, China) attached to the lower end. After the water passed through the meter, the water was directed into a 500 mL aluminum collection cup with two 4 cm diameter openings covered with 100 µ filters where the water was filtered and the MPs remained retained inside the collection cup. Water samples from tap filters (TF), from brands “Ativi Filtro” (São Paulo, São Paulo, Brazil), “Shop Ribeiro” (São Paulo, São Paulo, Brazil), “Shophidraulica” (Frraz de Vasconcelos, São Paulo, Brazil), and “Metais” (São Paulo, São Paulo, Brazil), attached to faucets or pipes, followed the same water collection procedures as tap water treatment. Each commercial water purifier has filtering elements (activated carbon) included in the filter cartridge (candle) of the filter, a component located inside the water purifier (as described in [38]) (Figure 2D). The tap filters were 10” high x 2.1/2” in diameter (33 cm high × 12 cm diameter); they were manufactured in pure polypropylene (non-toxic material, filter element durability = 3000 L of water or 6 months, maximum flow = 400 L/hour, maximum working pressure = 7 Kgf/cm² and retention level of 5 microns). The water purifier cartridges belonged to class E of the National Institute of Metrology, Quality, and Technology (INMETRO), which indicates that the equipment retains particles between >30 and <50 µ. For water sampling filtered with ceramic filters (candle filter = CF), two aluminum cans (35 cm height × 23 cm width) with a volume of 18 L each were adapted, without epoxy varnish on the internal walls (Figure 2A,B). A hole was made in the bottom of one of the cans, and a ceramic filter (candle) was attached, with the cans stacked on top of each other (Figure 2). The filter (6 cm diameter × 13 cm height × 6 cm height of the filter base connector; weight = 150 g) is made of ceramic material with a microporous wall that filters water by gravity, classified by INMETRO in class A with particle retention between ≥ 0.5 and 1 µ (filter element durability = 6 months of use or at least 500 L of filtered water, minimum flow rate = 0.5 L/hour and maximum flow rate = 3 L/hour) (Figure 2C). The collection cup with samples from each treatment was washed with ultrapure water several times, and the water samples were stored in glass containers and sealed with aluminum caps.
A total of 170 L (0.17 m3) of water was sampled in duplicate for each treatment, resulting in a total of 54 samples (18 tap water samples + 18 water purifier samples + 18 ceramic filter samples).

2.3. Sample Processing

The water samples were evaporated in glass containers tightly covered with aluminum foil with small holes (1 mm). The containers were placed in a drying oven at 49 °C for 72 h. Afterwards, 200 mL of 30% (v/v) H2O2 (Synth, Diadema, São Paulo, Brazil) was added to the dry mass, which was then left to incubate for 3 days at 40 °C. The solution was transferred to a vacuum filtration system with Whatman GF/C microfiber filters of 0.45 µm (WhatmanTM, Bandai, Fukushima, Japan.). The filters were observed under a stereomicroscope (Zeiss Stemi 305, Thornwood, NY, USA) at 80× magnification (PL10 × 23 Br Foc). MPs were identified, counted, and categorized by morphotypes (fibers and fragments), size, and colors [39].

2.4. Observation and Identification of MPs

All particles were measured in millimeters. The MPs are normally defined as plastic particles that are less than 5 mm in their longest dimension [40]; the size of the particles was measured based on the longest side of the observed particles using a scale connected to the stereomicroscope. The size of each particle was directly measured and recorded.
MPs were categorized based on color and morphotypes, with the latter divided into fibers and fragments [41]. A total of 1472 (16%) MPs were randomly selected for polymer composition identification. MPs were analyzed using Fourier transform infrared spectroscopy (FTIR) (detailed information in Frias et al. [42]). The samples were compressed on a Thermo Diamond anvil, and infrared spectra were acquired using a Nicolet® Nexus spectrophotometer (Madison, WI, USA) coupled to a continuous microscope (15× objective lens) with an MCT-A detector, cooled with liquid nitrogen. Spectra were collected in transmittance mode from 4000 to 700 cm−1 with a resolution of 4 cm−1 and digitized 128 times. Only polymers corresponding to reference spectra > 85% (compared to Open Specy—MicroplasticSpectra) were considered.

2.5. Procedures for Quality Assurance and Quality Control (QA/QC)

We followed the latest and strictest QA/QC criteria for MP analysis [43]. Ceramic candles purchased from commercial establishments, aluminum cans, metal pipes, the collection cup, and glassware used during sampling were rinsed multiple times, before and after use, with filtered Milli-Q water to avoid cross-contamination. To prevent deposition of MPs from the air, equipment was washed with filtered water and covered with aluminum foil during field sampling and laboratory analysis. During water collection from taps and water purifiers, the collection cup was covered with aluminum foil. Filters adapted with aluminum cans had their lids opened only when filling the compartment with tap water. For field control, two pre-washed Petri dishes with Milli-Q water were used. These remained open during sampling and were subsequently filled with filtered water in the laboratory. Field controls were analyzed following the same laboratory procedures as all other samples. Before starting laboratory analyses, all instruments were washed three times with filtered Milli-Q water and covered with aluminum foil. Plastic equipment was not used during field collection and laboratory analyses (e.g., aluminum trays, glass containers, and cotton clothing). Samples were analyzed by a single researcher in a closed laboratory, without external ventilation and air conditioning. Before the digestion process, reagents were filtered using a vacuum pump with Whatman GF/C 0.45 μm glass microfiber filter papers. To monitor deposition of MPs from the air in the laboratory [44], three Petri dishes were installed near each sample (blank), and then the blank was filled with filtered Milli-Q water followed by filtration using the aforementioned microfiber filter papers and vacuum pump. The blank showed a few MPs (n = 12), which were not compatible in morphotypes and color with those in the water samples, indicating that external contamination was minimal and did not affect the patterns investigated in the present study.

2.6. Data Analysis

To test differences in the concentration and richness (number of MP morphotypes and color combinations) of MPs among the ceramic filter, tap filter, and tap water treatments, an ANOVA was conducted [45]. The assumptions of linearity, homoscedasticity, and normality of the data were inspected using the function “car” in R software. To meet the ANOVA assumptions, MP concentration values were transformed into square roots. The significance of the predictor variable (filtration systems) was tested using 95% confidence intervals (p < 0.05), and if significant, the Tukey test was applied for pair-wise comparisons.
A non-metric multidimensional scaling analysis (NMDS) was used to examine multidimensional spatial variation in the abundance of each MP category (morphotypes and color combination) among ceramic filter, tap filter, and tap water. The dissimilarity matrix used in the ordination was also constructed using the Bray–Curtis index. The nMDS was performed using PAST software (version 2.1.7 [46]). We compared the scores of the first axis of the NMDS among treatments using a unidirectional permutation analysis of variance with the “lmp” function, available in the “lmPerm” package in R software (Version 2.1.0, R Foundation for Statistical Computing, Vienna, Austria) [47]. A Similarity Percentages analysis (SIMPER) was run with the “simper” function from the {vegan} R package based on 9999 permutations in order to indicate the individual contribution (>1% contribution) of each MP category [48] to the dissimilarity between filtration systems.

3. Results

3.1. MP Abundance and Concentration

MPs were found in all samples, totaling 9262 (mean ± SD, 171 ± 123) particles and 26 categories (black, blue, gray, yellow, white, brown, pink, transparent, gold, orange, green, red, purple, tangled transparent fibers, and black, blue, pink, yellow, red, orange, gray, purple, white, transparent, green, and colored fragments). The MP concentration in the ceramic filter (CF) treatment ranged from 0.38 to 0.58 MPs/L (0.49 ± 0.07) (382.4 to 588.0 MPs/m3; 489.5 ± 72.1), in the tap filter (TF) from 0.97 to 1.68 MPs/L (1.41 ± 0.20) (940.6 to 1688.2 MPs/m3; 1406.8 ± 205.8), and in tap water (TW) from 0.68 to 1.55 MPs/L (1.13 ± 0.35) (682.4 to 1558.8 MPs/m3; 1130.3 ± 357.5). The MP concentration in CF samples was significantly lower than in TW and TF (ANOVA, F = 68.16; p < 0.01) (Figure 3A). Similarly, the MP richness in CF samples (9.0 ± 2.0) was also significantly lower than in TW (18.5 ± 3.61) and TF (20.3 ± 2.72) (ANOVA, F = 81.89; p < 0.01) (Figure 3B).

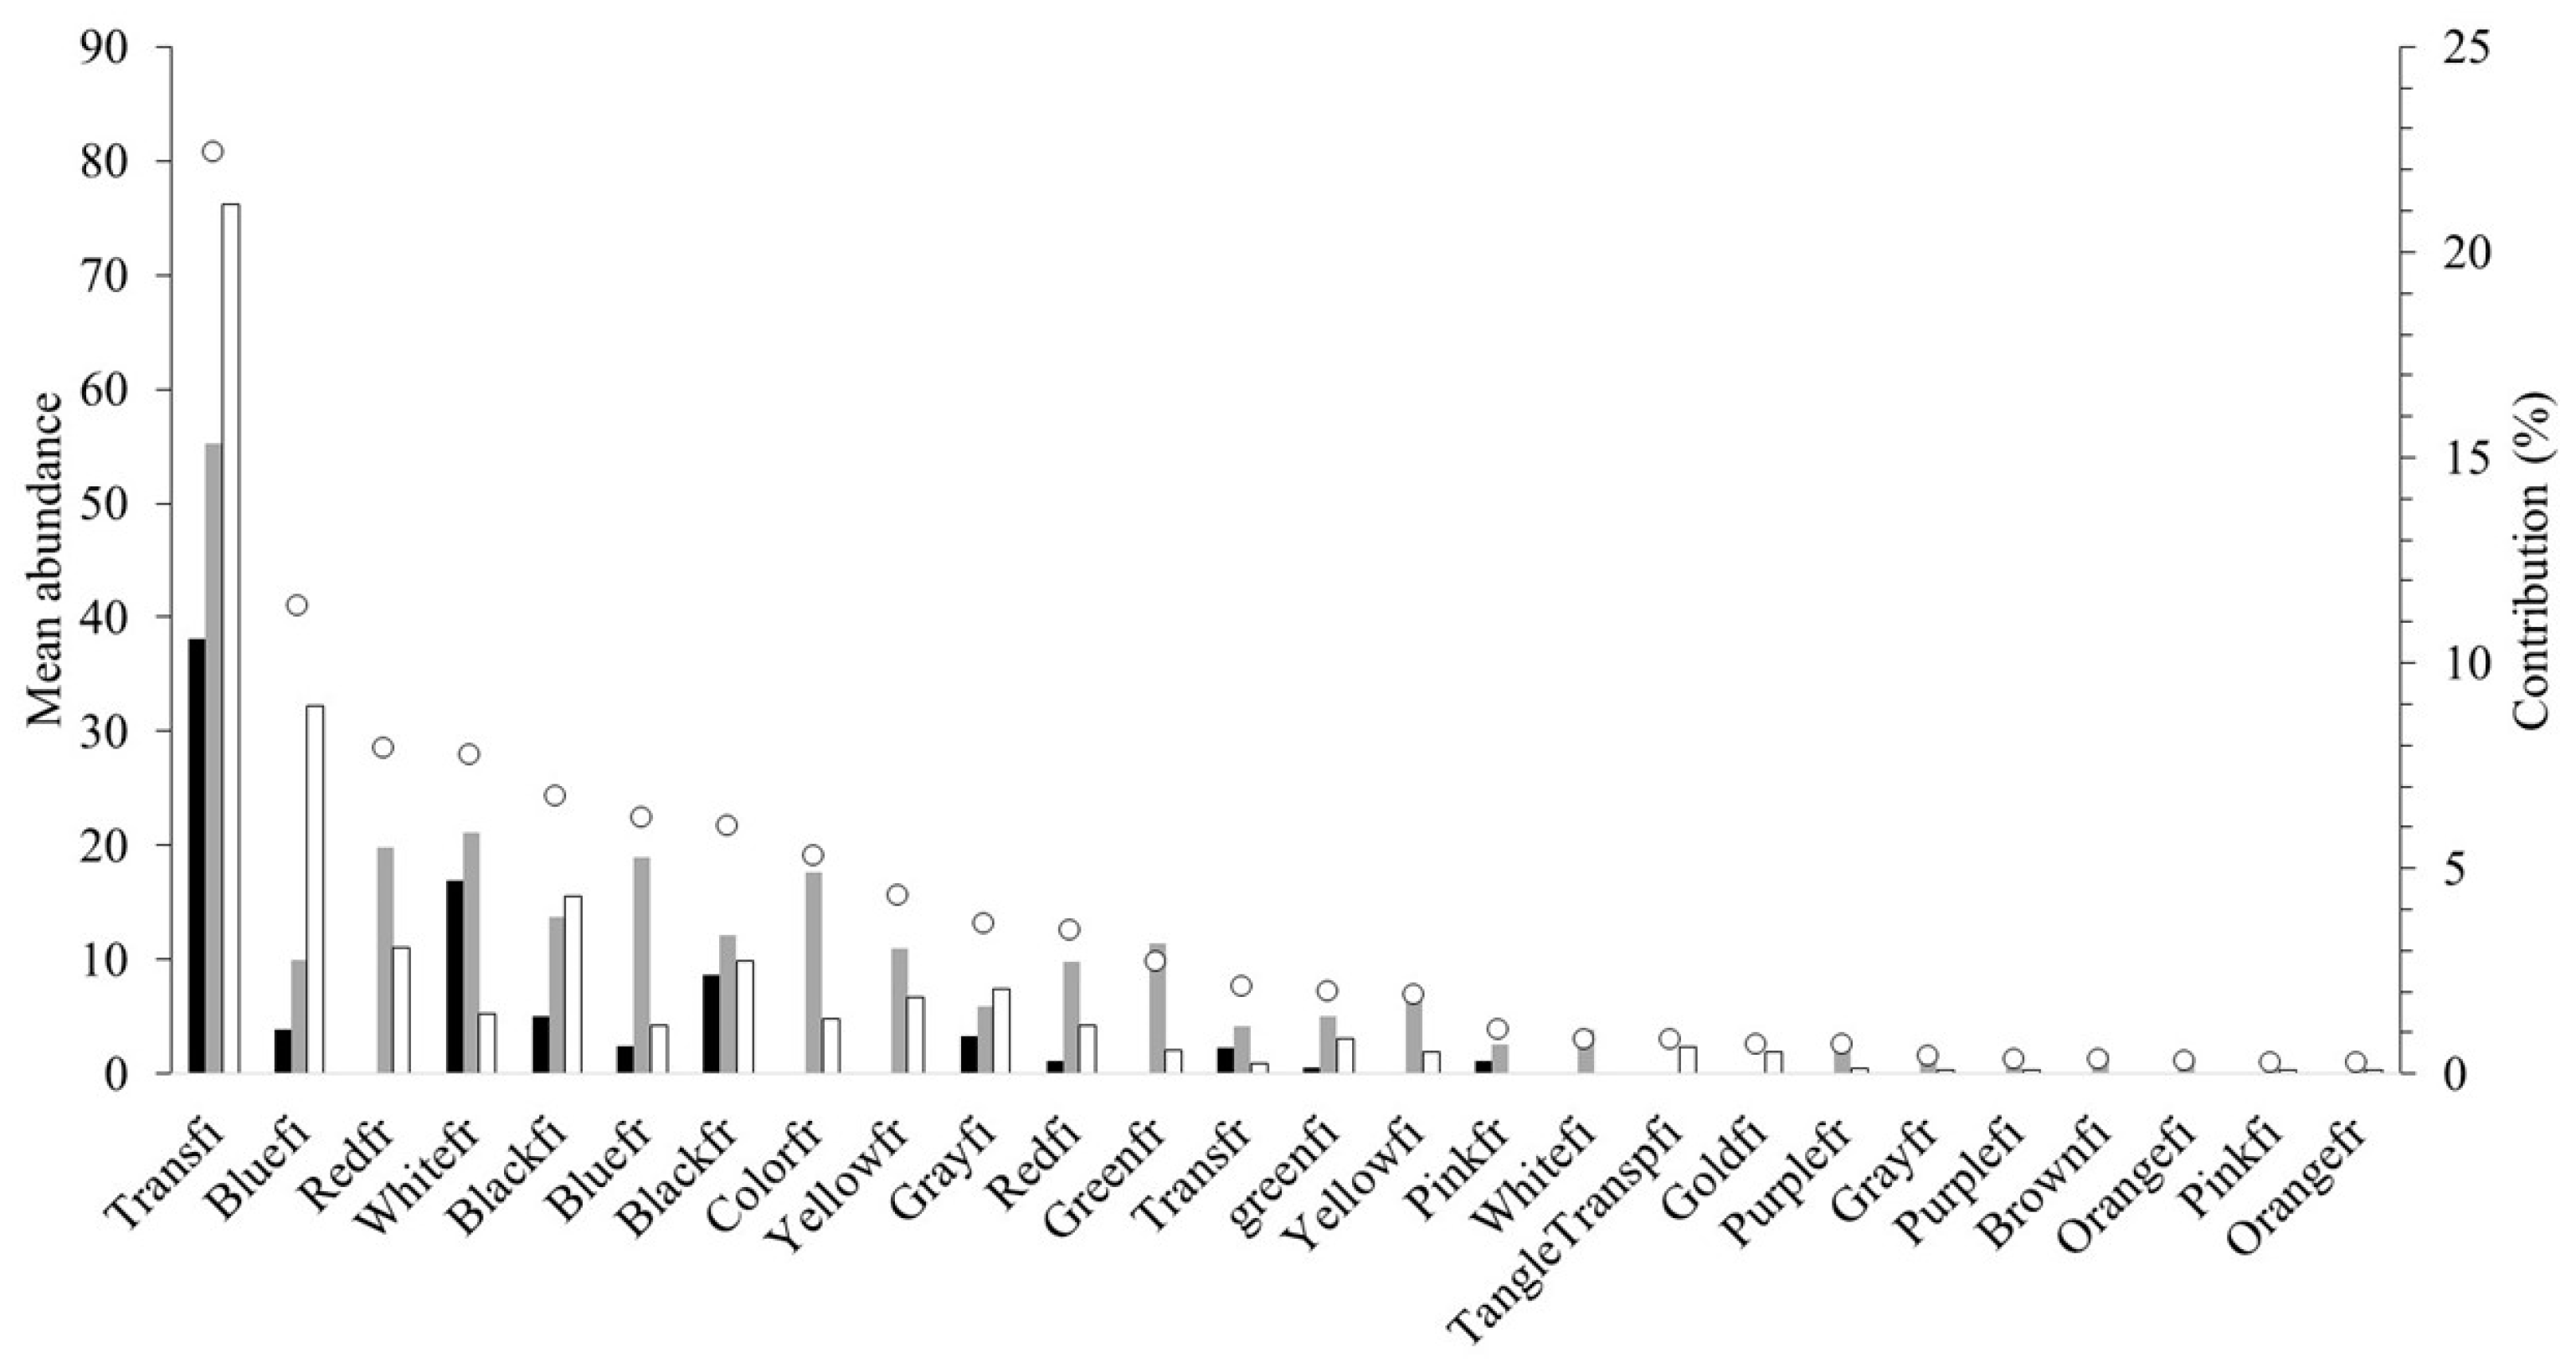
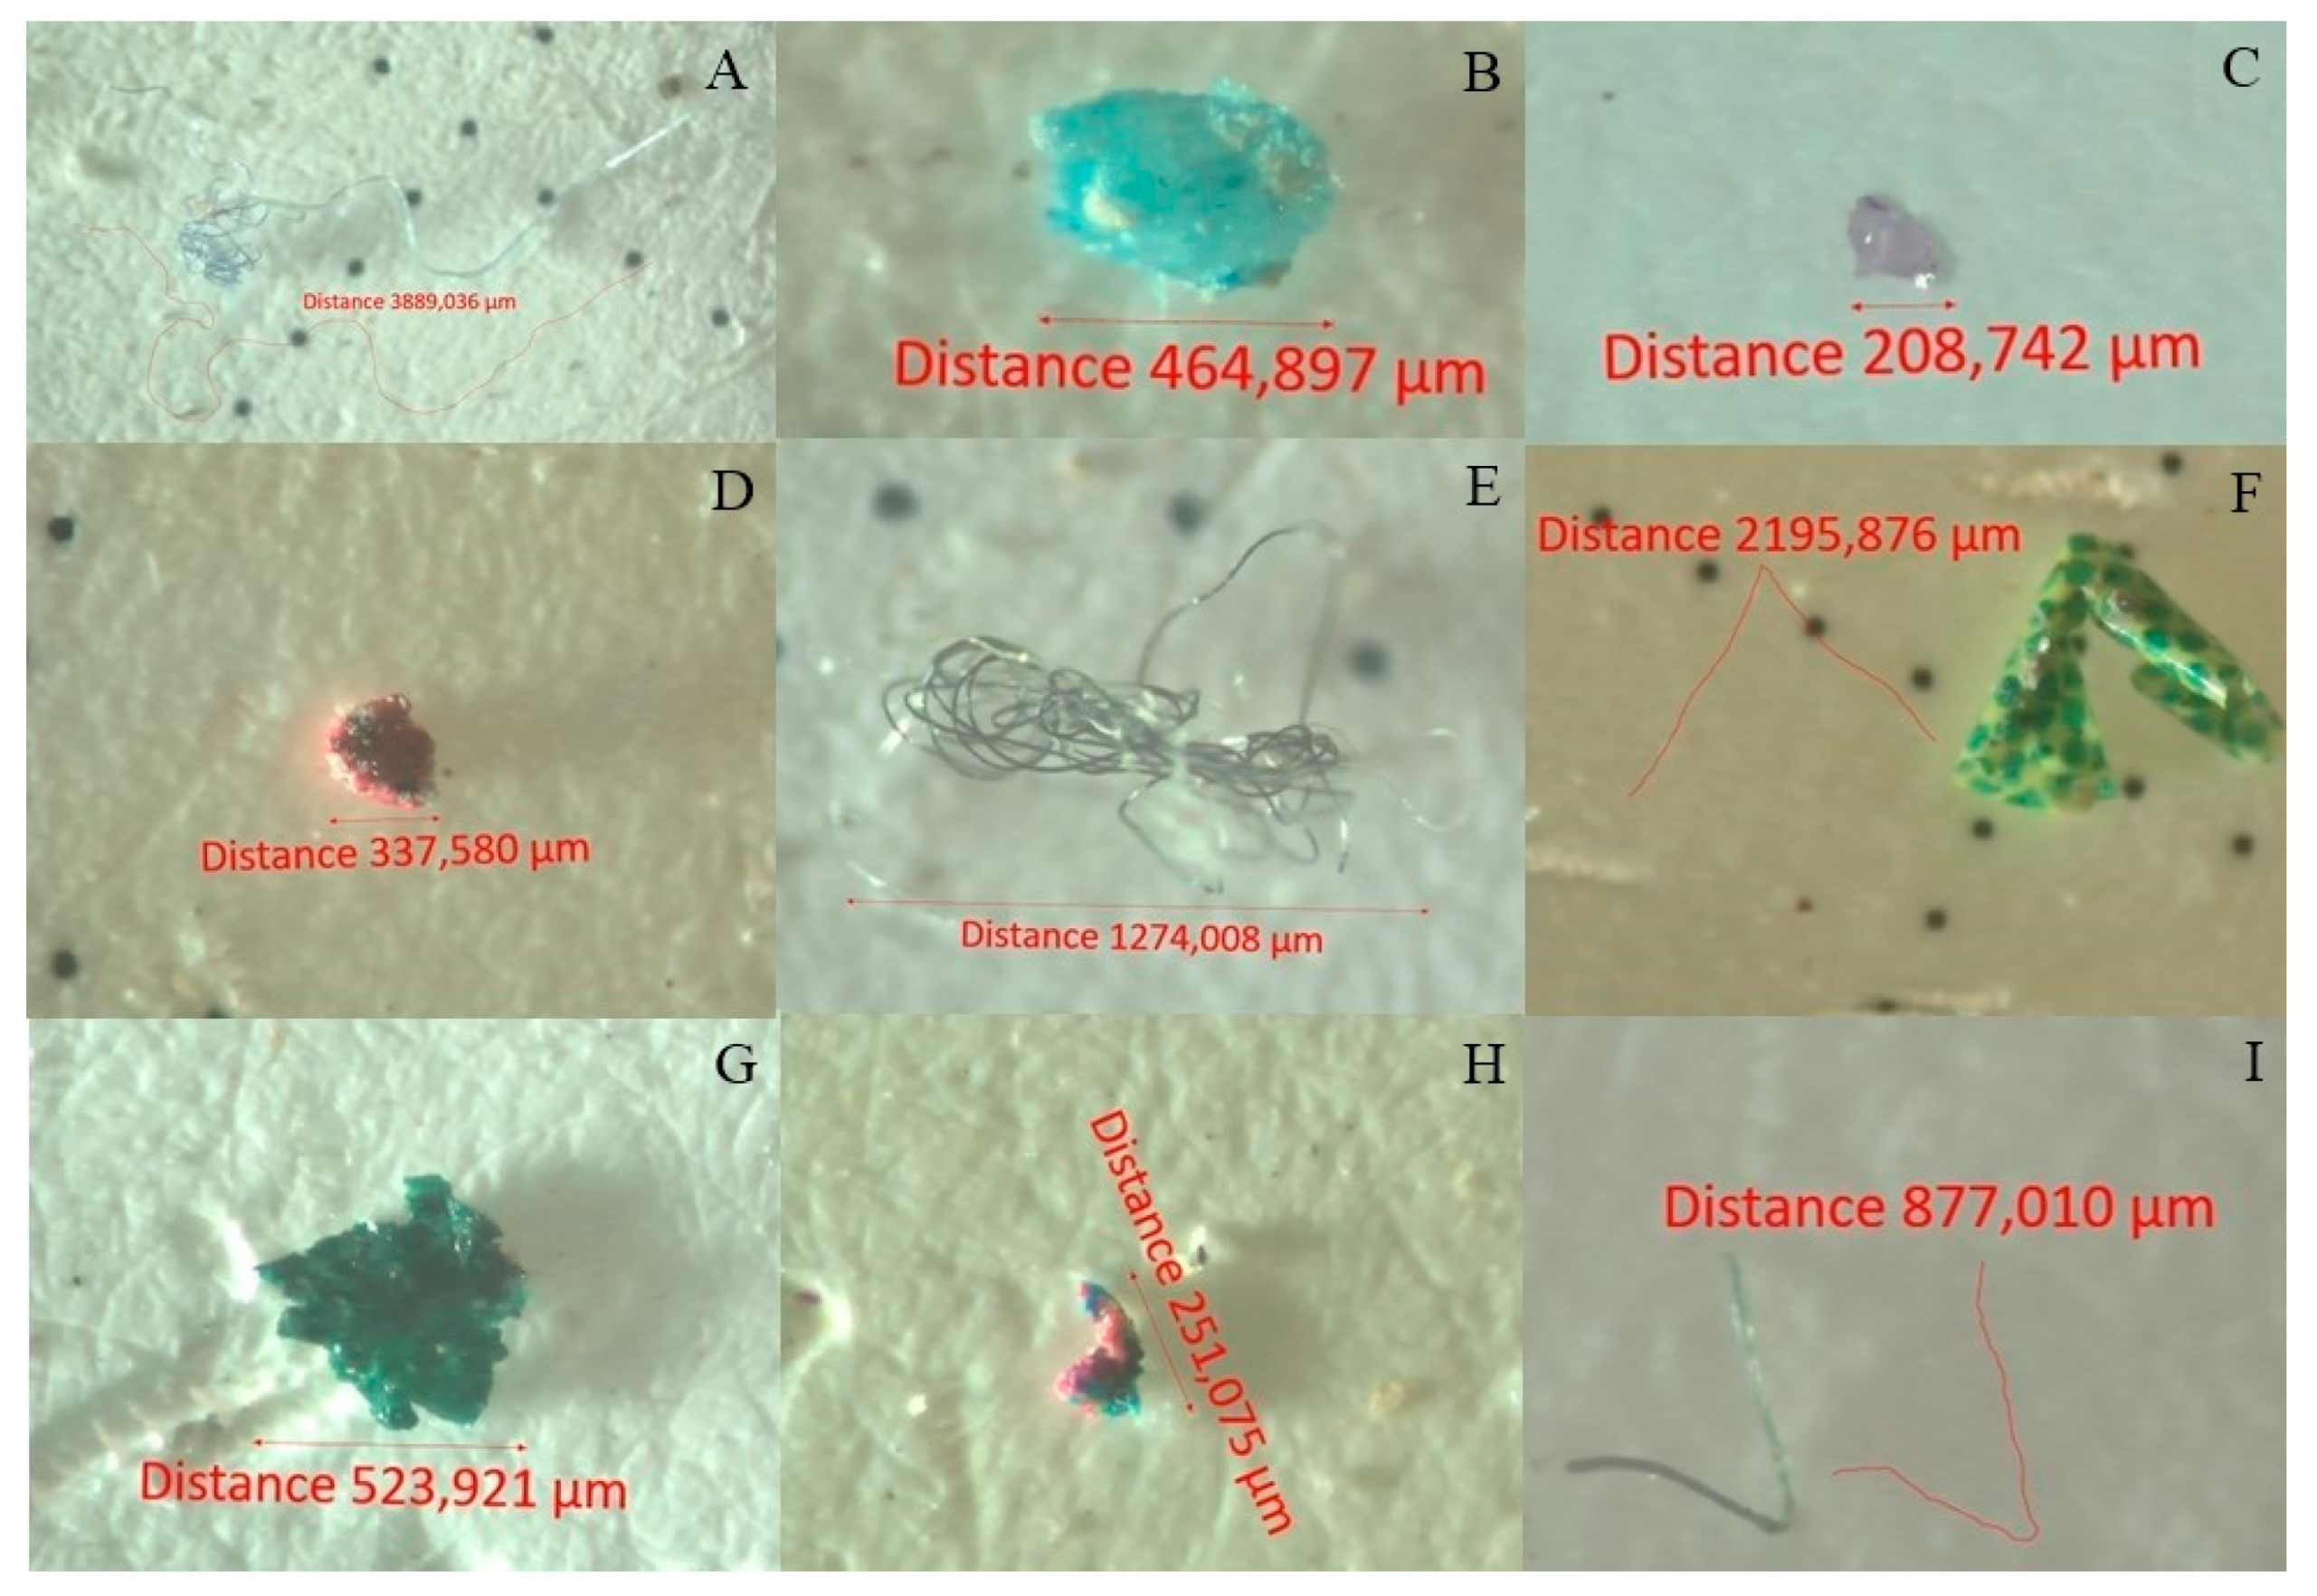
3.2. MP Characteristics

Transparent MPs were predominant in CF, TF, and TW (48%, 25%, and 41%, respectively), followed by black (CF = 16%, TF = 11%, and TW = 13%) and blue (CF = 8%, TF = 12%, and TW = 19%) colors (Figure 4A). Only two MP morphotypes (fragments and fibers) were observed. Fibers were predominant in CF (62%) and TW (76%), while fragments were more representative in TF (52%) (Figure 4B). CF-filtered water samples showed the majority of MPs with smaller sizes (< 500 µ = 41%; > 500 µ–1 mm = 35%), while larger MPs were found in TF (> 5 mm = 26%; 4 mm–5 mm = 18%) and TW (> 5 mm = 23%; 3 mm–4 mm = 16%) (Figure 4C). Six types of plastic polymers were detected in the treatments: polyester (PES), polypropylene (PP), polyethylene terephthalate (PET), polyamide (PA), polyvinylidene chloride (PVDC), and high-density polyethylene (HDPE). PES was the predominant polymer in all three treatments (CF = 43%, TF = 30% and TW = 35%), followed by PA (CF = 30%, TF = 28% and TW = 36%), PP (CF = 10%, TF = 19% and TW = 12%), and PET (CF = 11%, TF = 19% and TW = 12%) (Figure 4D).

3.3. The Relationship Between MP Morphotype Abundance and Filter Types

The ordination of samples based on the abundance of MP morphotypes (morphotypes and color combinations) represented 63% (axis 1) of the total abundance. This showed that the filter type affected the overall abundance of MPs (stress = 0.15; FNMDS1 = 24.4; d.f. = 2.0; p = <0.01), with CF being segregated from TW and TF (Figure 5).
A total of 15 categories of MPs contributed to 95% of the dissimilarity among treatments. Among them, transparent fibers were more abundant (22%) in CF, TF, and TW, followed by blue fibers in TW (11%) and white fragments in TF (7%) (Figure 6).
According to the morphotypes of the MPs recovered in each treatment, they were considered secondary, meaning they resulted from the fragmentation of larger plastic items (Figure 7).

4. Discussion

Few studies have quantified MPs in drinking water compared to aquatic environments (in situ), mainly comparing different water purifiers. All water samples analyzed in this study contained MPs. The average concentration of plastic items was 1.0 ± 0.45 MPs/L, with higher values observed for TW and TF compared to CF. Among all studied systems, lower MP concentration was noted in tap water in Denmark (0.31 MPs/L) [48] and Iran (0.11 MPs/L) [17]. However, studies in Brazil have found much higher MP concentration in drinking water (~100 MPs/L, Sinos River, [19]; Paranoá lake [18]). Thus, the great MP values in drinking water collected from the RPS were expected. The PSR basin is one of the most populous and industrialized areas in South America, with approximately 14 million inhabitants [49], a high number of industries (approximately 8000 industries) [50], and low basic sanitation coverage [51]. Additionally, we highlight the lower retention of small microplastic particles by wastewater treatment plants (WWTPs) [52]. The influence of WWTPs on the size distribution and variety of polymers has not been fully elucidated yet [52].
The composition and concentration of MPs differed among the analyzed treatments, rejecting the null hypothesis. Lower concentration and richness of MPs were observed in CF water compared to TW and TF, respectively. Sturm et al. [53] describe that such purification systems are generally made of plastic materials, and that over time and due to the lack of maintenance of internal parts, the degradation of plastic components produces MPs that are incorporated into the water flow [53]. Drinking water treatment plants (DWTPs) present an important contribution in retaining MPs from raw water (water captured from rivers and streams) [54]. Studies conducted in three DWTPs in the Czech Republic demonstrated the removal of 70 to 83% of MPs (>100 μm to 1 μm) with water treatment comprising coagulation/flocculation, sedimentation, or flotation, as well as sand and activated carbon filtration [15], revealing the presence of up to 628 ± 28 MPs/L of treated water, of which 95% of the MPs were smaller than 10 μm [15]. Considering the absence of significant differences in the concentration and richness of MPs between TF and TW, we suggest that these water purifiers concentrate MPs because activated carbon fragments have a porous surface (micro-, meso-, and macropores), with the presence of recesses and edges [55], which likely adhere MPs to their surface. Thus, the retention of MPs in the system is even greater due to the high compaction of the activated carbon fragments inside a closed container and subjected to high hydraulic pressure.
The samples analyzed in CF showed lower concentration values compared to the other treatments; however, smaller-sized MPs (< 500 µ) were detected more in this filtration system. Porous ceramic filters have been popular in Brazil since the late 19th century [21]. These operate simply, with the upper container responsible for storing the water that is filtered by gravity. With slow and drop-by-drop pressure, the water passes to the lower container through the porous walls of the filter [56]. Despite being rustic, this water filter is classified as Class A by INMETRO, indicating its high capacity to retain particles up to 1 µm, ensuring the retention of most pollutants and bacteria [56]. The higher presence of smaller-sized MPs (< 500 µm to 1 mm) in our results can be explained by the presence of grooves in the external wall of the ceramic filters. We observed the presence of recesses between the base of the ceramic structure and the plastic disc that supports this structure, which is still attached to the overall filter structure by plastic nuts, washers, and threads, allowing the passage of smaller MPs. However, Ingram [57] highlights that the Brazilian clay filter is the most effective purification system on the planet, considering that the composition of the filtration chamber and ceramic candles are effective in retaining chlorine, pesticides, iron, and aluminum, in addition to retaining 95% of lead in the water and 99% of the protozoan Cryptosporidium, which causes intestinal infections [57]. Thus, ceramic filters also seem to be an excellent option for home MP filtration; however, they require regular maintenance and cleaning to maintain working quality.
The prevalence of transparent, black, and blue MPs corroborates with the results of studies conducted in the PSR [27,28], adjacent environments [28,58], and global publications [59,60]. Wan et al. [61], at a landfill in southeast China, found transparent MPs to be predominant in most samples. The color of MPs in a sample can be related to the deterioration of the original plastic due to weathering [62]. Commonly used plastic products such as plastic bags, packaging, and containers are usually transparent. Previous works show that transparent and white MPs are frequent in soil, inland waters, and oceans [63]. Regardless of their morphotypes, size, or color, MPs can cause mechanical injuries, reduce growth rates, decrease fertility, and lead several aquatic organisms to death [64]. Additionally, MPs facilitate the transport of pollutants (e.g., heavy metals, medicines, and pesticides) adsorbed from the aquatic environment to the MPs [65], thus characterizing a public health issue [66].
Synthetic fibers are widely documented as the primary form of MPs globally [6,67], including in Brazil [68] and the PSR [27,28]. These fibers are predominantly associated with the discharge of treated and untreated sewage, as well as industrial effluents [69] in inland water ecosystems, and constitute almost 60% of global fiber consumption, with PES, polyamide, acrylic polymers, and polyolefins being the most common types [70,71]. They are used for various purposes, including packaging, textiles, and fishing gear [72]. Globally, atmospheric MPs are also dominated by microfibers, with textile wear being their main source [73].
Polyester (PES) and polyamide (PA) were confirmed as the predominant polymers in all three analyzed treatments, which is consistent with findings from various studies [60,74,75,76]. PES is used in various items, such as textile manufacturing for clothing and in the general consumer products industry, with high annual production worldwide. The morphology of the fibers is useful for keeping particles floating on the water surface. Additionally, environmental factors like temperature and wind can promote the resuspension of MPs from deep and dense waters to the surface and, therefore, be captured by DWTPs. Polyamide (PA) is a synthetic polymer of economic importance and follows a contamination pattern similar to PES and PET.
Despite regulations, restrictions, and subsidies to reduce the use of disposable plastics, there are no specific measures for MPs introduced into the ecosystem in Brazil, causing potential environmental damage. Law No. 10.936 [77], which established the National Solid Waste Policy, consists of principles, objectives, and instruments, as well as guidelines for integrated solid waste management, highlighting shared responsibility among consumers. Biodegradable polymers are considered a solution to reduce solid waste disposal and dependence on petroleum-based plastics. However, although there have been advances in the investigation and development of biodegradable plastics, they have not yet reached their full potential, as indicated by their current limited use. The various degradation effects associated with these materials can also pose an additional burden, especially when considering adverse impacts on organisms. Therefore, it is important to formulate regulations and restrictions related to the production and use of plastics, promote environmental education and scientific dissemination to the population, and develop and popularize filters that promote the retention of MPs both at the source (e.g., washing machines) and at the sink (e.g., DWTPs and household taps), aiming to prevent the continuous introduction of MPs into aquatic environments.

5. Conclusions

This is the first study to demonstrate the presence of MPs in water filtration systems commonly used in Brazil. We rejected the null hypothesis, as the composition and concentration of MPs differed among filtration systems, with significantly lower abundance and richness of MPs in ceramic filters compared to other systems. Transparent fibers ranging from <500 µm to >5 mm, composed of PES, PP, PET, and PA, were found in all water samples. MPs vary in morphotype, size, and chemical composition, thus posing a challenge to traditional pollutant risk assessments. Developing more robust models to assess the risks of MPs to public health is an urgent issue. Given that water chemistry, extraction techniques, treatment, and transportation vary regionally, these factors should be considered in future studies, along with further research to improve the sampling and analysis of MPs in drinking water, especially nanoplastics. Our study shows that it is possible to analyze large volumes of samples using simple and reliable sampling and analysis techniques, and we concluded that simple filtration systems can be effective in retaining MPs.

Author Contributions

Conceptualization, I.D.d.C. Validation, I.D.d.C. and N.N.d.S.N. Visualization, I.D.d.C., N.N.d.S.N. and L.L.C. Writing, I.D.d.C. and N.N.d.S.N. Review, L.L.C. and I.R.Z. Editing, L.L.C. and I.R.Z. Resources, I.R.Z. All authors have read and agreed to the published version of the manuscript.

Funding

This research was funded by Fundação de Amparo a Pesquisa do Estado do Rio de Janeiro (FAPERJ) numbers E-26/010.002616/2019, E-26/200.620/2022, E-26/210.384/2022, and CNPq 301505/2022-5.

Data Availability Statement

Data are contained within the article. The data used to support the findings of this study are available from the corresponding author upon request.

Acknowledgments

We are grateful to the staff members of the Universidade Estadual do Norte Fluminense (UENF) for their help and assistance during the fieldwork. We are also grateful to the reviewers and academic editor.

Conflicts of Interest

The authors declare that they have no known competing financial interests or personal relationships that could have appeared to influence the work reported in this paper.

References

  1. OECD. Global Plastics Outlook: Economic Drivers, Environmental Impacts and Policy Options; OECD: Paris, France, 2022; Available online: http://www.oecd-ilibrary.org/environment/global-plastics-outlook_de747aef-en (accessed on 12 July 2024).
  2. Ryberg, M.W.; Hauschild, M.Z.; Wang, F.; Averous-Monnery, S.; Laurent, A. Global environmental losses of plastics across their value chains. Resour. Conserv. Recycl. 2019, 151, 104459. [Google Scholar] [CrossRef]
  3. Koelmans, A.A.; Redondo-Hasselerharm, P.E.; Nor, N.H.M.; de Ruijter, V.N.; Mintenig, S.M.; Kooi, M. Risk assessment of microplastic particles. Nat. Rev. Mater. 2022, 7, 138–152. [Google Scholar] [CrossRef]
  4. Bäuerlein, P.S.; Hofman-Caris, R.C.; Pieke, E.N.; Ter Laak, T.L. Fate of microplastics in the drinking water production. Water Res. 2022, 221, 118790. [Google Scholar] [CrossRef] [PubMed]
  5. Yang, C.; Gao, X. Impact of microplastics from polyethylene and biodegradable mulch films on rice (Oryza sativa L.). Sci. Total Environ. 2024, 828, 154579. [Google Scholar] [CrossRef] [PubMed]
  6. Hale, R.C.; Seeley, M.E.; La Guardia, M.J.; Mai, L.; Zeng, E.Y. A global perspective on microplastics. J. Geophys. Res. Ocean. 2020, 125, 123–135. [Google Scholar] [CrossRef]
  7. Nirmala, K.; Rangasamy, G.; Ramya, M.; Shankar, V.U.; Rajesh, G. A critical review on recent research progress on microplastic pollutants in drinking water. Environ. Res. 2023, 222, 115312. [Google Scholar] [CrossRef]
  8. Gao, S.; Yan, K.; Liang, B.; Shu, R.; Wang, N.; Zhang, S. The different ways microplastics from the water column and sediment accumulate in fish in Haizhou Bay. Sci. Total Environ. 2023, 854, 158575. [Google Scholar] [CrossRef]
  9. Zuri, G.; Karanasiou, A.; Lacorte, S. Microplastics: Human exposure assessment through air, water, and food. Environ. Int. 2023, 179, 108150. [Google Scholar] [CrossRef]
  10. World Health Organization. Microplastics in Drinking-Water; WHO: Geneva, Switzerland, 2019. [Google Scholar]
  11. Kaushik, A.; Singh, A.; Gupta, V.K.; Mishra, Y.K. Nano/Micro-Plastic, an invisible threat getting into the Brain. Chemosphere 2024, 361, 142380. [Google Scholar] [CrossRef]
  12. Alijagic, A.; Suljević, D.; Fočak, M.; Sulejmanović, J.; Šehović, E.; Särndahl, E.; Engwall, M. The triple exposure nexus of microplastic particles, plastic-associated chemicals, and environmental pollutants from a human health perspective. Environ. Int. 2024, 108736. [Google Scholar] [CrossRef]
  13. Choudhary, S.; Neelavanan, K.; Saalim, S.M. Microplastics in the surface sediments of Krossfjord-Kongsfjord system, Svalbard, Arctic. Mar. Pollut. Bull. 2022, 176, 113452. [Google Scholar] [CrossRef] [PubMed]
  14. Oßmann, B.E.; Sarau, G.; Holtmannspötter, H.; Pischetsrieder, M.; Christiansen, S.H.; Dicke, W. Small-sized microplastics and pigmented particles in bottled mineral water. Water Res. 2018, 141, 307–316. [Google Scholar] [CrossRef] [PubMed]
  15. Pivokonsky, M.; Cermakova, L.; Novotna, K.; Peer, P.; Cajthaml, T.; Janda, V. Occurrence of microplastics in raw and treated drinking water. Sci. Total Environ. 2018, 643, 1644–1651. [Google Scholar] [CrossRef] [PubMed]
  16. Pérez-Guevara, F.; Roy, P.D.; Elizalde-Martínez, I.; Kutralam-Muniasamy, G.; Shruti, V.C. Human exposure to microplastics from urban decentralized pay-to-fetch drinking-water refill kiosks. Sci. Total Environ. 2022, 848, 157722. [Google Scholar] [CrossRef] [PubMed]
  17. Taghipour, H.; Ghayebzadeh, M.; Ganji, F.; Mousavi, S.; Azizi, N. Tracking microplastics contamination in drinking water in Zahedan, Iran: From source to consumption taps. Sci. Total Environ. 2023, 872, 162121. [Google Scholar] [CrossRef]
  18. Pratesi, C.B.; Almeida, M.A.S.; Paz, G.S.C.; Teotonio, M.H.R.; Gandolfi, L.; Pratesi, R.; Zandonadi, R.P. Presence and quantification of microplastic in urban tap water: A pre-screening in Brasilia, Brazil. Sustainability 2021, 13, 6404. [Google Scholar] [CrossRef]
  19. Ferraz, M.; Bauer, A.L.; Valiati, V.H.; Schulz, U.H. Microplastic concentrations in raw and drinking water in the Sinos River, Southern Brazil. Water 2020, 12, 3115. [Google Scholar] [CrossRef]
  20. Fernandes, C.V.; Misael, C.G.A.; Chaves, F.J.F.; Santos, J.S.B.; Cavalcante, J.N.A. Estudo da qualidade das águas processadas em filtros de barro tradicionais contrapondo os filtros modernos. Blucher Mater. Sci. Proc. 2015, 3, 1–7. [Google Scholar]
  21. Bellingieri, J.C. Água de beber: A filtração doméstica e a difusão do filtro de água em São Paulo. An. Mus. Paul. História Cult. Mater. 2004, 12, 161–191. [Google Scholar] [CrossRef]
  22. Bellingieri, J.C. Uma análise da indústria de filtros de água no Brasil. Cerâmica Ind. 2006, 11, 31–35. [Google Scholar]
  23. Ali, M.U.; Lin, S.; Yousaf, B.; Abbas, Q.; Munir, M.A.M.; Ali, M.U.; Wong, M.H. Environmental emission, fate and transformation of microplastics in biotic and abiotic compartments: Global status, recent advances and future perspectives. Sci. Total Environ. 2021, 791, 148422. [Google Scholar] [CrossRef] [PubMed]
  24. Emenike, P.C.; Araoye, O.V.; Academe, S.O.; Unokiwedi, P.; Omole, D.O. The Effects of Microplastics in Oceans and Marine Environment on Public Health—A Mini-Review; IOP Publishing: Philadelphia, PA, USA, 2022. [Google Scholar]
  25. Liang, R.; Sun, F.; Zhang, C.; Zhang, R.; Wang, H.; Wang, X. Interaction between microplastics and microorganisms in soil environment: A review. Chin. J. Biotechnol. 2023, 39, 500–515. [Google Scholar] [CrossRef]
  26. Suzuki, G.; Uchida, N.; Tanaka, K.; Higashi, O.; Takahashi, Y.; Kuramochi, H.; Osako, M. Global discharge of microplastics from mechanical recycling of plastic waste. Environ. Pollut. 2024, 348, 123855. [Google Scholar] [CrossRef] [PubMed]
  27. da Costa, I.D.; Nunes, N.N.; Costa, L.L.; Zalmon, I.R. Is the Paraíba do Sul River colourful? Prevalence of microplastics in freshwater, south-eastern Brazil. Mar. Freshw. Res. 2022, 73, 1439–1449. [Google Scholar] [CrossRef]
  28. da Costa, I.D.; Costa, L.L.; Zalmon, I.R. Microplastics in water from the confluence of tropical rivers: Overall review and a case study in Paraíba do Sul River basin. Chemosphere 2023, 338, 139493. [Google Scholar] [CrossRef]
  29. Cotovicz Jr, L.C.; Vidal, L.O.; de Rezende, C.E.; Bernardes, M.C.; Knoppers, B.A.; Sobrinho, R.L.; Abril, G. Carbon dioxide sources and sinks in the delta of the Paraíba do Sul River (Southeastern Brazil) modulated by carbonate thermodynamics, gas exchange and ecosystem metabolism during estuarine mixing. Mar. Chem. 2020, 226, 103869. [Google Scholar] [CrossRef]
  30. Marengo, J.A.; Alves, L.M. Tendências hidrológicas da bacia do rio Paraíba do Sul. Rev. Bras. Meteorol. 2005, 20, 215–226. [Google Scholar]
  31. Comitê de Integração da Bacia Hidrográfica do Rio Paraíba do Sul. Rio que te quero vivo—Conheça mais sobre a bacia do rio Paraíba do Sul; CEIVAP: Rio de Janeiro, Brazil, 2024; Available online: https://www.ceivap.org.br/arquivos/CartilhaVirtual.pdf (accessed on 20 July 2024).
  32. Lima, F.P.; Azevedo-Santos, V.M.; Santos, V.M.; Vidotto-Magnoni, P.; Soares, C.L.; Manzano, F.V.; Nobile, A.B. Plastic ingestion by commercial and non-commercial fishes from a Neotropical river basin. Water Air Soil Pollut. 2021, 232, 29. [Google Scholar] [CrossRef]
  33. Meneguelli-Souza, A.C.; Pestana, I.A.; Azevedo, L.S.; Almeida, M.G.; Souza, C.M.M. Arsenic in the lower drainage basin of the Paraíba do Sul River (Southeast Brazil): Dynamics between the water column and sediment. Environ. Monit. Assess. 2021, 193, 1–15. [Google Scholar] [CrossRef]
  34. Oliveira, E.C. Mudanças na sedimentação do delta do Rio Paraíba do Sul nos últimos 40 anos: Resultados do manejo excessivo. In O Homem e as Zonas Costeiras; Fundação de Amparo a Pesquisa do Estado do rio de Janeiro: Rio de Janeiro, Brazil, 2015; pp. 174–178. [Google Scholar]
  35. FEAM. Programa Minas Trata Esgoto, Relatório de progresso do Programa Minas Trata Esgoto; Fundação Estadual do Meio Ambiente: Belo Horizonte, Brazil, 2013; Available online: http://www.feam.br/minas-trata-esgoto (accessed on 12 July 2024).
  36. Guedes, H.A.; Silva, D.D.; Elesbon, C.; Ribeiro, A.T.D.; Soares, J.H. Aplicação da análise estatística multivariada no estudo da qualidade da água do Rio Pomba, MG. Rev. Bras. Eng. Agric. Ambient. 2012, 16, 558–563. [Google Scholar] [CrossRef]
  37. Pittroff, M.; Müller, Y.K.; Witzig, C.S.; Scheurer, M.; Storck, F.R.; Zumbülte, N. Microplastic analysis in drinking water based on fractionated filtration sampling and Raman microspectroscopy. Environ. Sci. Pollut. Res. 2021, 28, 59439–59451. [Google Scholar] [CrossRef] [PubMed]
  38. Feld, L.; Silva, V.H.D.; Murphy, F.; Hartmann, N.B.; Strand, J. A study of microplastic particles in Danish tap water. Water 2021, 13, 2097. [Google Scholar] [CrossRef]
  39. Lusher, A.L.; Bråte, I.L.N.; Munno, K.; Hurley, R.R.; Welden, N.A. Is it or isn’t it: The importance of visual classification in microplastic characterization. Appl. Spectrosc. 2020, 74, 1139–1153. [Google Scholar] [CrossRef] [PubMed]
  40. Lusher, A.; Hollman, P.; Mendoza-Hill, J. Microplastics in Fisheries and Aquaculture: Status of Knowledge on Their Occurrence and Implications for Aquatic Organisms and Food Safety; Food and Agriculture Organization of United Nations: Rome, Italy, 2017. [Google Scholar]
  41. Galgani, F.; Hanke, G.; Werner, H.; De Vrees, L. Marine litter within the European Marine Strategy Framework Directive. ICES Mar. Sci. 2013, 70, 1055–1064. [Google Scholar] [CrossRef]
  42. Frias, J.P.G.L.; Otero, V.; Sobral, P. Evidence of microplastics in samples of zooplankton from Portuguese coastal waters. Mar. Environ. Res. 2014, 18, 143–159. [Google Scholar] [CrossRef]
  43. Schymanski, D.; Oßmann, B.E.; Benismail, N.; Boukerma, K.; Dallmann, G.; Von der Esch, E.; Ivleva, N.P. Analysis of microplastics in drinking water and other clean water samples with micro-Raman and micro-infrared spectroscopy: Minimum requirements and best practice guidelines. Anal. Bioanal. Chem. 2021, 413, 5969–5994. [Google Scholar] [CrossRef]
  44. Bessa, F.; Barría, P.; Neto, J.M.; Frias, J.P.; Otero, V.; Sobral, P.; Marques, J.C. Occurrence of microplastics in commercial fish from a natural estuarine environment. Mar. Pollut. Bull. 2018, 128, 575–584. [Google Scholar] [CrossRef]
  45. Zar, J.H. Bioestatistical Analysis; Prentice Hall: Saddle River, New Jersey, USA, 1999. [Google Scholar]
  46. Hammer, Ø.; Harper, D.A.; Ryan, P.D. PAST: Paleontological statistics software package for education and data analysis. Palaeontol. Electron. 2001, 4, 9–25. [Google Scholar]
  47. Wheeler, B.; Torchiano, M.; Torchiano, M.M. Package ‘lmPerm’. R Package Version 2.1.0. Available online: https://cran.r-project.org/web/packages/lmPerm/lmPerm.pdf (accessed on 2 July 2024).
  48. Oksanen, J.; Guillaume Blanchet, F.; Friendly, M.; Kindt, R.; Legendre, P.; McGlinn, D. Vegan: Community Ecology Package; R Core Team; R Foundation for Statistical Computing: Vienna, Austria, 2017. [Google Scholar]
  49. Comitê de Integração da Bacia Hidrográfica do Rio Paraíba do Sul. Deliberação CEIVAP nº 259, de 5 de abril de 2018. Dispõe sobre a atualização do Preço Público Unitário—PPU da metodologia da cobrança pelo uso dos recursos hídricos de domínio da União na Bacia Hidrográfica do rio Paraíba do Sul; CEIVAP: Rio de Janeiro, Brazil, 2018. [Google Scholar]
  50. Santana, G.R.; Santos, E.B.; da Silva, M.G.A.J. Caracterização espaço-temporal das secas na bacia do Rio Paraíba do Sul. Anu. Inst. Geociênc. 2020, 43, 364–375. [Google Scholar] [CrossRef]
  51. Obraczka, M.; Pinto, S.D.O.M.; Marques, C.F.; Ohnuma, A.A. Jr. Emprego de indicadores na avaliação do saneamento-região hidrográfica médio Paraíba do Sul. Rev. Int. Ciências 2019, 9, 3–21. [Google Scholar] [CrossRef]
  52. Barchiesi, M.; Chiavola, A.; Di Marcantonio, C.; Boni, M.R. Presence and fate of microplastics in the water sources: Focus on the role of wastewater and drinking water treatment plants. J. Water Process Eng. 2021, 40, 101787. [Google Scholar] [CrossRef]
  53. Sturm, M.T.; Myers, E.; Schober, D.; Korzin, A.; Schuhen, K. Beyond microplastics: Implementation of a two-stage removal process for microplastics and chemical oxygen demand in industrial wastewater streams. Water 2024, 16, 268. [Google Scholar] [CrossRef]
  54. Tang, K.H.D.; Hadibarata, T. Microplastics removal through water treatment plants: Its feasibility, efficiency, future prospects and enhancement by proper waste management. Environ. Chall. 2021, 5, 100264. [Google Scholar] [CrossRef]
  55. Díaz, L.; Huesca, R.H.; Armenta, A.G. Characterization of the Microporous Structure of Activated Carbons through Different Approaches. Ind. Eng. Chem. 1999, 38, 1396. [Google Scholar] [CrossRef]
  56. Caramello, N.; Furtado, M.S.; Rodrigues, A.B. Monitoramento da qualidade de água residencial e in natura para análise de tratamento alternativo, Amapá, Brasil. Nat. Resour. 2022, 12, 107–122. [Google Scholar]
  57. Ingram, C. The Drinking Water Book: How to Eliminate Harmful Toxins from Your Water; Celestial Arts: Toronto, Ontario, Canada, 2006. [Google Scholar]
  58. da Costa, I.D.; Costa, L.L.; Zalmon, I.R. Are fishes selecting the trash they eat? Influence of feeding mode and habitat on microplastic uptake in an artificial reef complex (ARC). Sci. Total Environ. 2023, 904, 166788. [Google Scholar] [CrossRef]
  59. Frank, Y.A.; Vorobiev, E.D.; Vorobiev, D.S.; Trifonov, A.A.; Antsiferov, D.V.; Soliman Hunter, T.; Strezov, V. Preliminary screening for microplastic concentrations in the surface water of the Ob and Tom Rivers in Siberia, Russia. Sustainability 2020, 13, 80. [Google Scholar] [CrossRef]
  60. Chinfak, N.; Sompongchaiyakul, P.; Charoenpong, C.; Shi, H.; Yeemin, T.; Zhang, J. Abundance, composition, and fate of microplastics in water, sediment, and shellfish in the Tapi-Phumduang River system and Bandon Bay, Thailand. Sci. Total Environ. 2021, 781, 146700. [Google Scholar] [CrossRef]
  61. Wan, L.; Cheng, H.; Liu, Y.; Shen, Y.; Liu, G.; Su, X. Global meta-analysis reveals differential effects of microplastics on soil ecosystem. Sci. Total Environ. 2023, 867, 161403. [Google Scholar] [CrossRef]
  62. Pastorelli, G.; Cucci, C.; Garcia, O.; Piantanida, G.; Elnaggar, A.; Cassar, M.; Strlič, M. Environmentally induced colour change during natural degradation of selected polymers. Polym. Degrad. Stab. 2014, 107, 198–209. [Google Scholar] [CrossRef]
  63. Yang, J.; Li, L.; Li, R.; Xu, L.; Shen, Y.; Li, S.; Luo, Y. Microplastics in an agricultural soil following repeated application of three types of sewage sludge: A field study. Environ. Pollut. 2021, 289, 117943. [Google Scholar] [CrossRef] [PubMed]
  64. Zicarelli, G.; Romano, C.; Gallo, S.; Valentino, C.; Pepe Belomo, V.; Leonetti, F.L.; Giglio, G.; Neri, A.; Marsili, L.; Milazzo, C.; et al. Diet and plastic ingestion in the blackmouth catsharkGaleus melastomus, Rafinesque 1810, in Italian waters. Animals 2023, 13, 1039. [Google Scholar] [CrossRef] [PubMed]
  65. Ta, A.T.; Babel, S. Occurrence and spatial distribution of microplastic contaminated with heavy metals in a tropical river: Effect of land use and population density. Mar. Pollut. Bull. 2023, 191, 114919. [Google Scholar] [CrossRef] [PubMed]
  66. Gambino, I.; Bagordo, F.; Grassi, T.; Panico, A.; De Donno, A. Occurrence of microplastics in tap and bottled water: Current Knowledge. Int. J. Environ. Res. Public Health 2022, 19, 5283. [Google Scholar] [CrossRef] [PubMed]
  67. Gasperi, J.; Wright, S.L.; Dris, R.; Collard, F.; Mandin, C.; Guerrouache, M.; Tassin, B. Microplastics in air: Are we breathing it in? Curr. Opin. Environ. Sci. Health 2018, 1, 1–5. [Google Scholar] [CrossRef]
  68. Sodré, F.F.; Arowojolu, I.M.; Canela, M.C.; Ferreira, R.S.; Fernandes, A.N.; Montagner, C.C.; Waldman, W.R. How natural and anthropogenic factors should drive microplastic behavior and fate: The scenario of Brazilian urban freshwater. Chemosphere 2023, 340, 139813. [Google Scholar] [CrossRef]
  69. Li, Y.; Liu, C.; Yang, H.; He, W.; Li, B.; Zhu, X.; Tang, K.H.D. Leaching of chemicals from microplastics: A review of chemical types, leaching mechanisms and influencing factors. Sci. Total Environ. 2024, 906, 167666. [Google Scholar] [CrossRef]
  70. FAO-ICAC. Food and Agriculture Organization of the United Nations and International Cotton Advisory Committee. Washington, 2013. Available online: https://sewitagain.com/wp-content/uploads/2013/12/FAO-ICAC-Survey-2013-Update-and-2011-Text.pdf (accessed on 1 July 2024).
  71. Cesa, F.S.; Turra, A.; Baruque-Ramos, J. Synthetic fibers as microplastics in the marine environment: A review from textile perspective with a focus on domestic washings. Sci. Total Environ. 2017, 598, 1116–1129. [Google Scholar] [CrossRef]
  72. González-Pleiter, M.; Edo, C.; Velázquez, D.; Casero-Chamorro, M.C.; Leganés, F.; Quesada, A.; Rosal, R. First detection of microplastics in the freshwater of an Antarctic Specially Protected Area. Mar. Pollut. Bull. 2020, 161, 111811. [Google Scholar] [CrossRef]
  73. Xu, C.; Zhang, B.; Gu, C.; Shen, C.; Yin, S.; Aamir, M.; Li, F. Are we underestimating the sources of microplastic pollution in terrestrial environment? J. Hazard. Mater. 2020, 400, 123228. [Google Scholar] [CrossRef]
  74. Lin, L.; Zuo, L.Z.; Peng, J.P.; Cai, L.Q.; Yan, Y.; Xu, X.R. Occurrence and distribution of microplastics in an urban river: A case study in the Pearl River along Guangzhou City, China. Sci. Total Environ. 2018, 644, 375–381. [Google Scholar] [CrossRef] [PubMed]
  75. Haberstroh, C.J.; Arias, M.E.; Yin, Z.; Sok, T.; Wang, M.C. Plastic transport in a complex confluence of the Mekong River in Cambodia. Environ. Res. Lett. 2021, 16, 231–252. [Google Scholar] [CrossRef]
  76. Laermanns, H.; Lehmann, M.; Klee, M.; Löder, M.G.; Gekle, S.; Bogner, C. Tracing the horizontal transport of microplastics on rough surfaces. Microplastics Nanoplastics 2021, 1, 11. [Google Scholar] [CrossRef]
  77. Decreto 10.936/2022. Regulamentação da Política Nacional de Resíduos S´olidos. Presidência da República. Brazil, 2022. Available online: https://www.in.gov.br/web/dou/-/decreto-n-10 (accessed on 20 July 2024).
Figure 1. Map of the study area showing the Paraíba do Sul River basin (dark gray) (A) crossing three states (MG— Minas Gerais, SP— São Paulo, and RJ— Rio de Janeiro) (B) and the sampling sites (red dashed circle = Santo Antônio de Pádua city, blue dashed circle = Cambuci city, and green dashed circle = Campos dos Goytacazes city) (C) in the low portion of the basin.
Water 16 03189 g001
Figure 2. Water filtration system adapted with aluminum cans (A), highlighting (solid red arrow) the positioning (B) of the candle filter (C) and tap filter (D), with emphasis on the internal activated carbon filter (dashed red arrow).
Water 16 03189 g002
Figure 3. Concentration (A) and richness (B) of microplastic in drinking water from tap water (TW), tap filter (TF), and candle filter (CF) in southeastern Brazil. Boxes represent the 25th and 75th percentiles, and whiskers represent the 10th and 90th percentiles. The solid lines within the boxes indicate the median values. Different letters indicate significant differences with 95% confidence intervals.
Water 16 03189 g003
Figure 4. Color (A), morphotypes (B), size (C), and polymer (D) of MPs in drinking water collected from tap water (TW), tap filter (TF), and candle filter (CF) in southeastern Brazil.
Water 16 03189 g004
Figure 5. Ordination of samples along the first two axes of the non-metric multidimensional scaling analysis (NMDS) based on MP abundance (Bray–Curtis index in each site). CF = blue circle, TF = red circle, TW = green circle.
Water 16 03189 g005
Figure 6. Mean abundance (bars) and relative contribution of MPs (circle) to the dissimilarity between CF (black bars), TF (grays bars), and TW (white bars) estimated through a SIMPER analysis. The denomination of each type of MP is provided by its color, accompanied by the acronym “fi” for fibers and “fr” for fragments.
Water 16 03189 g006
Figure 7. Photomicrographs of microplastics found in CF, TF, and TW. Faded blue fiber (A), blue fragment (B), pink fragment (C), red fragment (D), gray fiber (E), colorful fragment (F), green fragment (G), colorful fragment (H), and black fiber (I).
Water 16 03189 g007
Disclaimer/Publisher’s Note: The statements, opinions and data contained in all publications are solely those of the individual author(s) and contributor(s) and not of MDPI and/or the editor(s). MDPI and/or the editor(s) disclaim responsibility for any injury to people or property resulting from any ideas, methods, instructions or products referred to in the content.

