Article

Sustainability Prediction by Evaluating the Emergy of a Co-Treatment System for Municipal Wastewater and Acidic Water Using Intermittent Electrocoagulation

by
Luigi Bravo-Toledo
1,
Paul Virú-Vásquez
1,
Ruben Rodriguez-Flores
1,
Luis Sierra-Flores
2,
José Flores-Salinas
2,
Freddy Tineo-Cordova
2,
Rolando Palomino-Vildoso
2,
César Madueño-Sulca
2,
Cecilia Rios-Varillas de Oscanoa
2 and
Alex Pilco-Nuñez
2,*
1
Faculty of Environmental Engineering and Natural Resources, Universidad Nacional del Callao, Callao 07011, Peru
2
Faculty of Chemical and Textile Engineering, Universidad Nacional de Ingeniería, Lima 15001, Peru
*
Author to whom correspondence should be addressed.
Water 2024, 16(21), 3081; https://doi.org/10.3390/w16213081
Submission received: 18 September 2024 / Revised: 16 October 2024 / Accepted: 20 October 2024 / Published: 28 October 2024
(This article belongs to the Section Wastewater Treatment and Reuse)

Abstract

:
The objective of this research was to evaluate the sustainability of a co-treatment system that combines Municipal Wastewater (MW) and Acid Mine Drainage (AMD) through the technique of intermittent electrocoagulation, applied as an advanced solution to improve contaminant removal efficiency and optimize energy balance. Four scenarios were analyzed: Treatment I (with a 1/7 ratio of urban wastewater to AMD), Treatment II (which includes an artificial wetland), Treatment IIIa (which introduces electrocoagulation to enhance sulfate removal and pH regulation), and Treatment IIIb (which employs a 1/15 ratio of AMD to eutrophic water). The methodology focused on calculating key sustainability indicators such as the Net Yield Ratio (EYR), Emergy Inversion Ratio (EIR), Environmental Loading Ratio (ELR), and Sustainability Index (SI), in order to assess the impact of each technology on the energy efficiency and environmental load of the system. The results showed that, although Treatment IIIa was effective in contaminant removal, the EIR increased to 0.18 and the ELR rose to 0.62, indicating a higher reliance on non-renewable inputs due to increased energy demand. However, Treatment IIIb, which combines electrocoagulation with eutrophic water, significantly improved the sustainability of the system, achieving an SI of 2.31 and an ELR of 1.22, reflecting a reduction in energy efficiency due to intensive use of external resources, but overall greater sustainability compared to the other scenarios. This research concludes that intermittent electrocoagulation, when integrated with synergistic resources like eutrophic water, can enhance contaminant removal efficiency and improve the use of renewable resources, minimizing environmental load and increasing the sustainability of wastewater treatment systems.

1. Introduction

Global concern over aquatic pollution from Acidic Water (AW) and Municipal Wastewater (MW) has grown in recent years. Both wastewater types present complex challenges, requiring integrated solutions for effective treatment [1]. The treatment of AW and urban wastewater is a critical challenge affecting ecosystems and communities worldwide [2]. Urban wastewater, originating from domestic and industrial activities, contains organic matter, nutrients, and other contaminants that, if untreated, contribute to eutrophication and disease spread [3]. AW, produced by mining activities, is highly corrosive and rich in toxic heavy metals, threatening aquatic ecosystems and drinking water sources [3]. Cerro de Pasco in Peru exemplifies these environmental impacts, suffering from Acid Mine Drainage (AMD), which has contaminated water bodies and affected public health [4]. The lack of a Municipal Wastewater Treatment Plant (MWTP) has led to untreated domestic effluents degrading Lake Patarcocha [5]. These issues underscore the need for integrated, sustainable water management solutions in the region.
There are various technologies available for treating AW and MW, each with specific mechanisms to address the contaminants present. For treating Acidic Water (AW), lime neutralization [6] is commonly used to precipitate metals and sulfates, reducing their mobility and toxicity. Limestone treatment [7] is another neutralization method that helps buffer the pH of AW. Adsorption [8] employs materials like activated carbon to capture dissolved contaminants effectively. Membrane technologies [9] provide physical separation of contaminants, while electrodialysis [10] uses electric currents to remove ions from water. Advanced oxidation processes [11] involve generating reactive species that break down complex organic pollutants. Anoxic limestone drains [12] offer a passive method of neutralizing acidity, and sulfate-reducing bioreactors [13] use microorganisms to convert sulfates into less harmful sulfides, which also precipitate metals. For treating Municipal Wastewater (MW), adsorption [14] is used to remove various pollutants, including organic and inorganic compounds. Coagulation–flocculation [15] helps aggregate fine particles into larger ones that can be easily removed. Filtration [16] is a physical process to remove suspended solids. Electrocoagulation [17] is also used in MW treatment to remove colloidal particles and metals. Anaerobic bioreactors [18] use anaerobic microorganisms to break down organic matter, producing methane as a byproduct. Microalgae [19] are employed to absorb nutrients like nitrogen and phosphorus, improving water quality. Moving bed biofilm reactors [20] provide a surface for biofilms to grow, enhancing the breakdown of organic pollutants. Activated sludge [21] involves the use of aerated microbial communities to degrade organic matter in wastewater. Wetlands [22] utilize natural biological processes to filter and degrade pollutants. The importance of wetlands as a treatment method in the co-treatment of AW and municipal wastewater lies in their ability to facilitate synergies between different contaminants. Johnson [23] demonstrated that wetlands enable the co-treatment of sewage and mine waters by promoting interactions such as the precipitation of iron oxides and the removal of phosphorus and ammonia. Additionally, Younger [24] showed that full-scale wetland systems can effectively reduce key contaminants, including iron, ammonium, and phosphorus, thereby improving overall water quality and reducing environmental risks. These studies highlight the role of wetlands in achieving contaminant removal through natural processes, making them an effective, low-energy solution for treating both acidic and urban wastewater in a sustainable manner.
The application of electrocoagulation is crucial for the removal of contaminants and the improvement of water quality, particularly in the treatment of wastewater generated by mining and industrial activities [25]. Electrocoagulation is a physicochemical process that utilizes an electric current to induce coagulation, aiding in the separation of phases within the wastewater [26]. In this process, sacrificial iron or aluminum anodes release cations that function as coagulants, promoting the adhesion and aggregation of contaminant particles [27].
This method has advantages over traditional coagulation as it does not require chemical additives, reducing costs. Additionally, hydrogen bubbles formed at the cathode promote electroflotation, which, combined with sedimentation, enhances separation efficiency [28]. Intermittent electrocoagulation, also known as batch electrocoagulation, involves alternating phases of electrocoagulation and resting [29]. During the electrocoagulation phase, an electric current is applied to destabilize and coagulate contaminants, while the resting phase allows for the natural formation of oxidized and reduced compounds, enhancing pollutant removal efficiency. This approach is beneficial as it provides time for redox reactions to fully develop, improving the overall quality of treated water. The intermittent process also helps to minimize energy consumption by reducing the duration of active treatment, while ensuring effective formation and separation of coagulants, making it a cost-effective and sustainable method for wastewater treatment.
By reducing dependence on external chemicals and minimizing sludge generation, electrocoagulation optimizes resource use and environmental impact, making it an attractive option for co-treatment of wastewater and AMD. However, most current research is limited to experimental and pilot-scale tests, lacking long-term environmental assessments [30]. The absence of standardized evaluation protocols hinders a comprehensive understanding of the environmental impact. Emergy synthesis offers a promising approach by assessing both natural and economic aspects, guiding the development of more sustainable co-treatment technologies. Emergy analysis utilizes a common unit to measure and compare diverse resource inputs, offering a comprehensive measure of a system’s total resource use [31]. Unlike traditional economic accounting, which primarily considers human labor, emergy accounts for the work carried out by nature to produce the natural capital (water, energy, minerals, etc.) underlying system inputs [32]. This approach is particularly valuable in evaluating wastewater treatment processes. For example, Chen [33] demonstrated how emergy analysis can be applied to constructed wetlands to assess local sustainability, providing insights into the balance between environmental costs and benefits. Similarly, Polyakova [34] used emergy analysis to evaluate the economic and ecological aspects of wastewater treatment systems, helping to identify the most sustainable technologies for long-term application. Emergy analysis thus plays a crucial role in guiding decision-making for optimizing resource use and minimizing environmental impacts in wastewater treatment [35].
This approach allows for a comprehensive understanding of system behavior, enabling the optimization of interactions between components and the evaluation of sustainability [36]. Emergy assessment facilitates the comparison of different wastewater treatment models by using sustainability indices, providing a clear measure of their environmental and economic performance [35]. This study aims to evaluate the sustainability of four co-treatment scenarios for urban wastewater and AMD in Cerro de Pasco, Peru. By analyzing these scenarios, the study will support decision-making and identify improvement strategies for practical implementation, ultimately contributing to more sustainable water management practices in regions affected by mining activities.

2. Materials and Methods

2.1. A Description of the Case Study

Cerro de Pasco is located at an altitude of 4360 m above sea level and has an average perimeter of 1400 m [37]. Cerro de Pasco boasts substantial water resources yet faces significant environmental challenges due to historical and ongoing mining activities. The negative impacts of legacy mining waste and catastrophic incidents have severely disrupted local ecosystems, causing imbalances in both natural and social environments [38]. The pervasive effect of AMD generated by environmental liabilities in Pasco has resulted in the modification of surface and subterranean watercourses, deterioration of soil quality, and significant landscape transformation.
Mining companies such as Aurex, Cerro SAC, and El Brocal have historically discharged industrial effluents into surface water bodies, including Yanamate and Quiulacocha lakes (Figure 1). Consequently, these water bodies have been transformed into repositories of AW and tailings [39]. This environmental degradation is compounded by urban wastewater management issues stemming from the high population density associated with mining activities. Notably, untreated urban wastewater from the central and eastern parts of the city, which encompass major commercial centers and hotels, is discharged directly into Patarcocha Lake. This practice has resulted in severe contamination of the lake [35].

2.2. Characterization of Urban Wastewater and Acid Water

Urban and acid wastewater generate inputs as renewable and non-renewable resources known as emergy flows. Initial characterizations of eutrophic lakes (Table 1) and AW from Quiulacocha Lake (Table 2) were utilized to determine emergy input estimates.

2.3. Study Scenarios

This research analyzed four scenarios projected for the operation of a co-treatment plant for urban wastewater, eutrophic water, and AW. The scenarios incorporated a combination of active (with associated emergy costs) and passive (without emergy costs) unit processes. This approach facilitates the determination of future development trajectories and informs the potential construction of a full-scale co-treatment plant. The emergy analysis and sustainability assessment were conducted by examining the unit processes and sub-processes comprising the co-treatment facility, as well as its construction and operational parameters. This comprehensive evaluation aims to provide insights into the most sustainable and efficient configuration for addressing the complex water treatment challenges in the region.

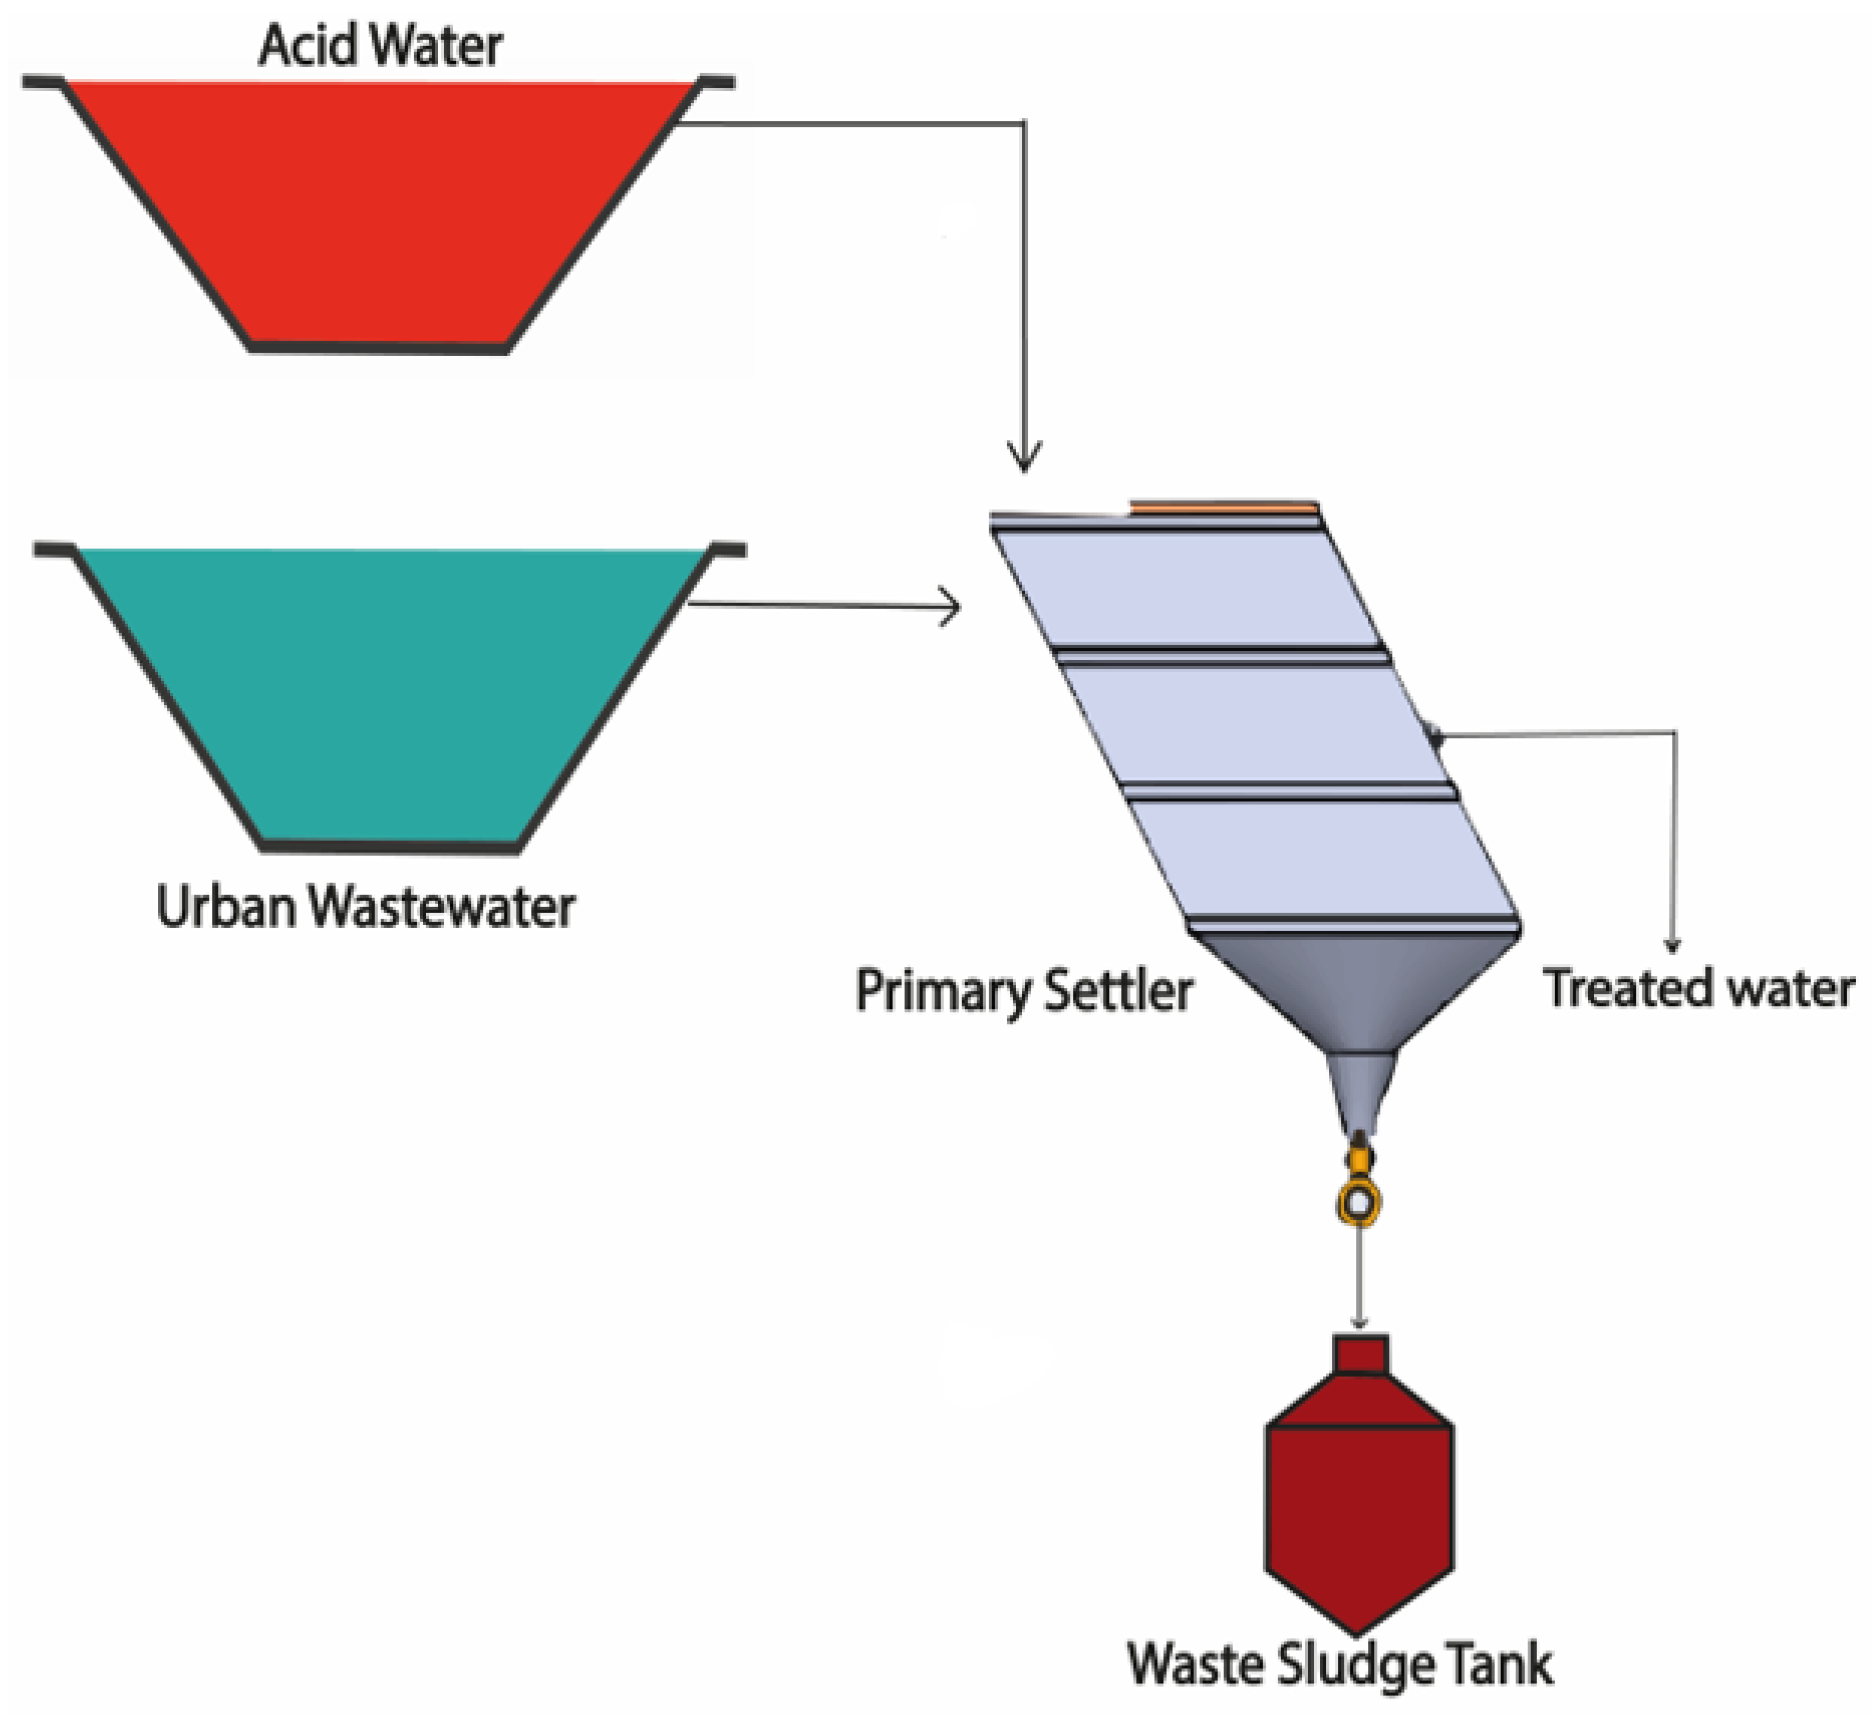
2.3.1. Scheme of Treatment I

Figure 2 illustrates the scheme of Treatment I, a scenario specifically designed to evaluate a co-treatment process that integrates AW and MW. This approach proposes the use of a primary sedimentation tank as the main unit for the initial mixing and treatment of both types of water. The sedimentation tank enables the controlled combination of AW, typically from mining activities, with urban wastewater derived from domestic and industrial sources. In this co-treatment process, the sedimentation tank facilitates partial neutralization of AW and promotes the settling of suspended solids, achieving a crucial first stage of purification that significantly enhances water quality. The sludge generated during sedimentation is collected in a dedicated storage tank designed for efficient waste management.
The combined flow into the sedimentation tank, supplied from an equalization unit, is 10 L/s, with a volumetric mixing ratio of 1/7 (v/v) between AW and MW, meaning that for every unit of AW, seven units of urban wastewater are mixed. This mixing ratio is strategically selected to maximize the efficiency of the sedimentation process, effectively reducing contaminants and improving the chemical stability of water. Treatment I serves as a foundational step that primarily aims at reducing suspended solids and partially neutralizing acidic conditions, thus preparing the wastewater for further treatment in subsequent stages.

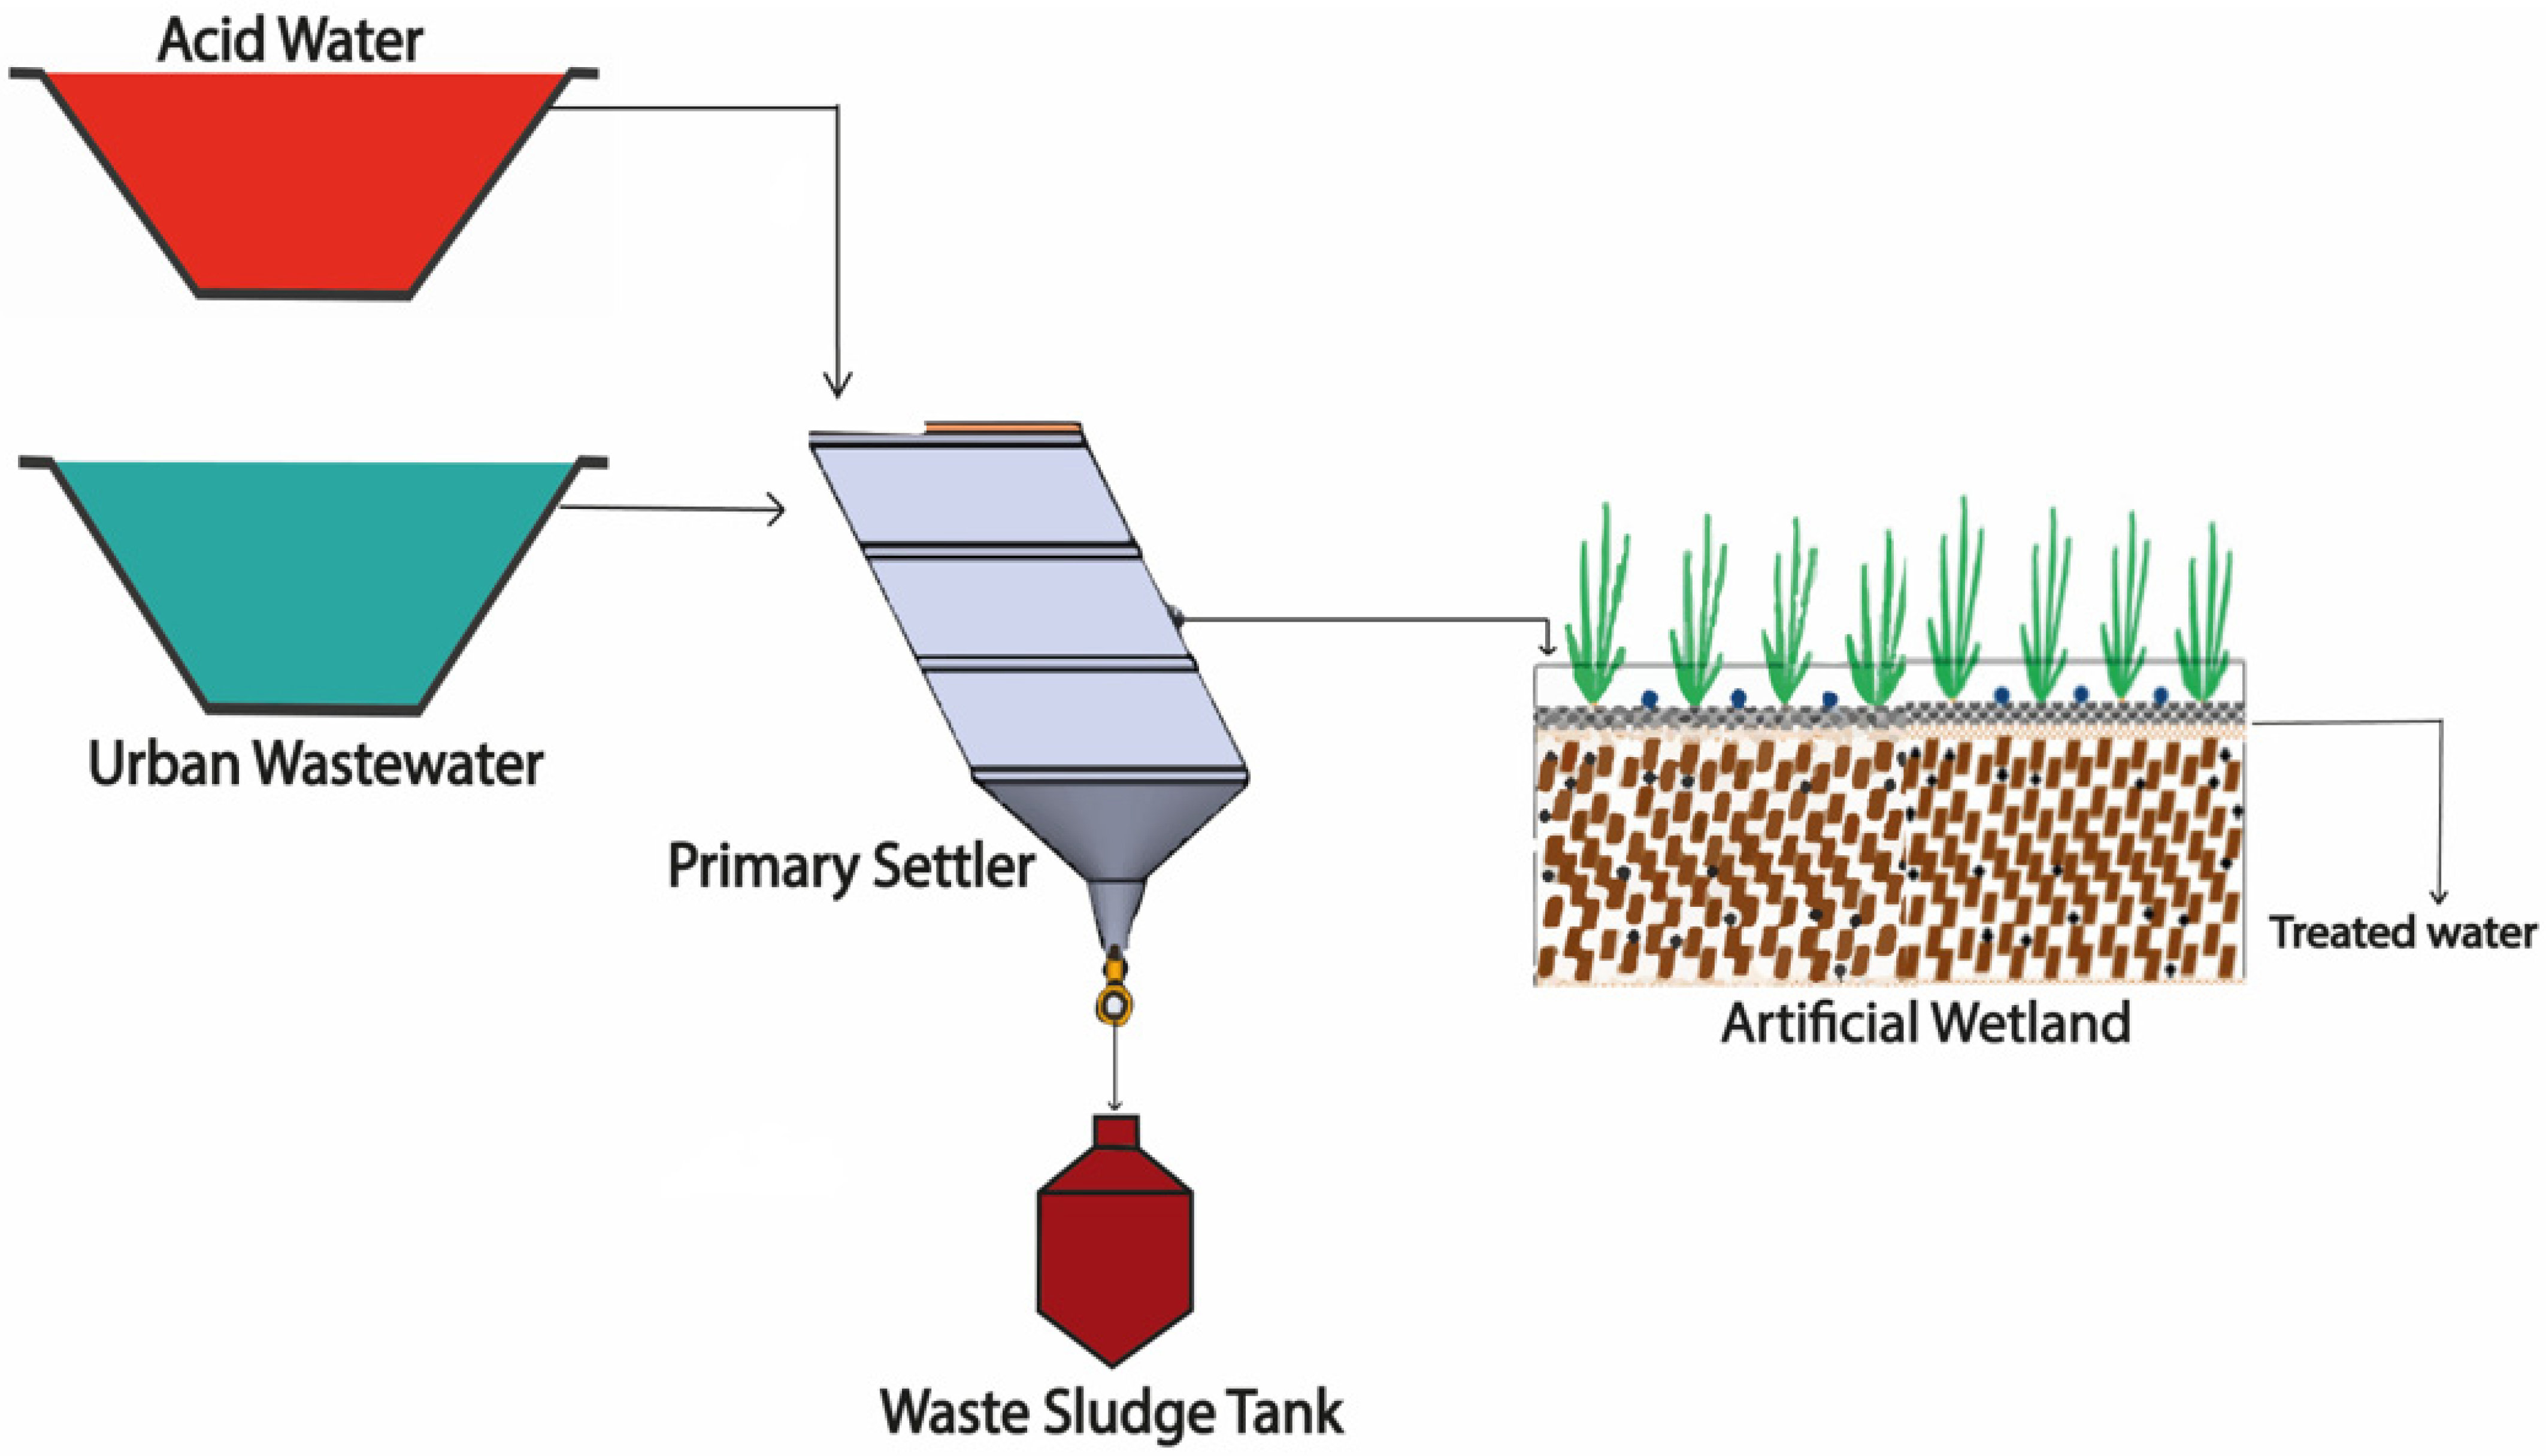
2.3.2. Scheme of Treatment II

Figure 3 illustrates the scheme of Treatment II, a scenario evaluating a co-treatment system comprising a primary sedimentation tank followed by a horizontal subsurface flow constructed wetland. This integrated approach builds upon the foundational treatment provided in Treatment I by addressing the limitations of primary sedimentation in removing specific contaminants, particularly sulfates, and enhancing the pH regulation of the effluent. The subsurface wetland provides additional treatment, significantly improving the removal efficiency of these parameters and offering a more advanced, sustainable level of treatment. The system operates with a combined wastewater flow rate of 10 L/s, utilizing a volumetric mixing ratio of 1:7 (v/v) between AMD and urban wastewater. This ratio is critical for optimizing treatment process efficacy, ensuring efficient contaminant removal from both urban sources and AMD. The subsurface wetland facilitates additional biological and physical treatment processes, with vegetation and filtering media acting to reduce sulfate levels and stabilize pH, thereby enhancing final effluent quality. Treatment II represents an evolution from Treatment I by integrating complementary biological processes that target specific contaminants not effectively removed by sedimentation alone. This scenario underscores the importance of combining primary sedimentation with constructed wetland technology to effectively address the complexity of mixed wastewater, thus providing a more sustainable solution. By combining these treatment technologies, the system aims to optimize process sustainability and minimize the environmental impact of discharges.

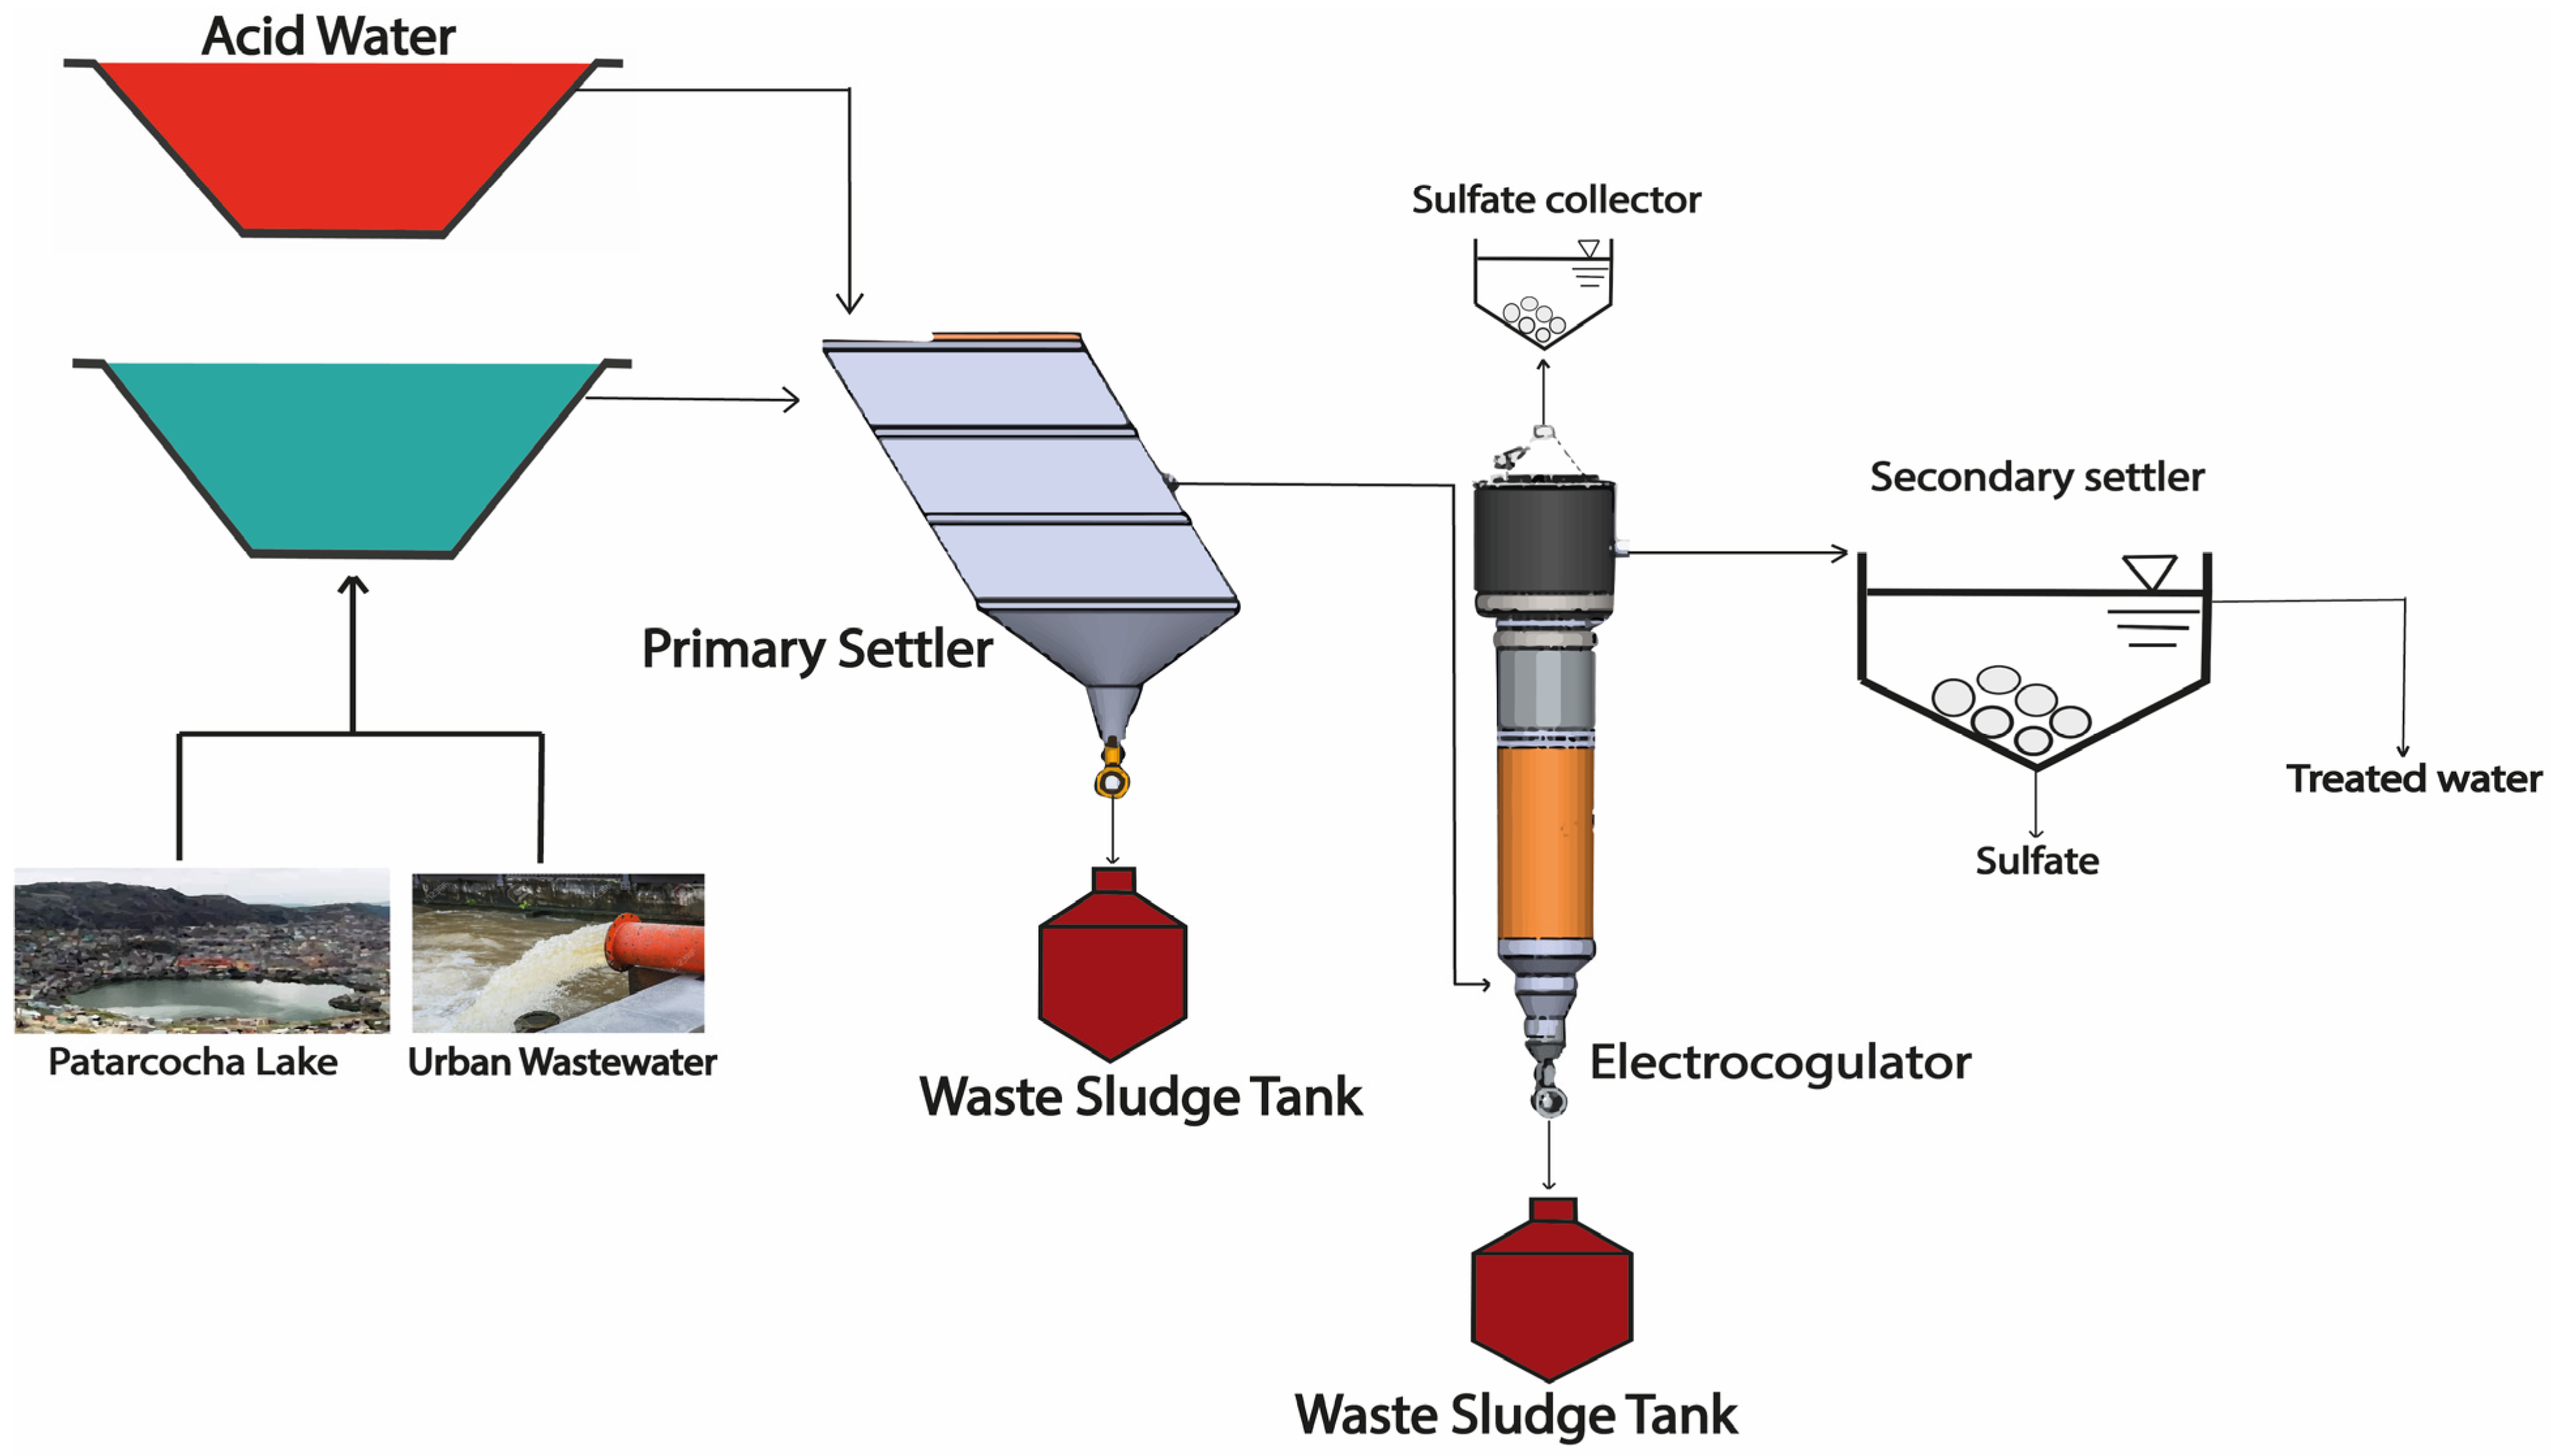
2.3.3. Treatment IIIa and IIIb

Figure 4 illustrates the scheme of Treatment IIIa and IIIb. These scenarios present primary unit processes, including a primary sedimentation tank, followed by an up-flow electrocoagulator with cylindrical electrodes, and then a secondary sedimentation tank. This design is characterized by the inclusion of subprocesses such as sludge tanks and a bed for sulfate recovery resulting from the electrocoagulation process. Treatment IIIa and IIIb build upon the processes outlined in Treatment II by introducing electrocoagulation, which specifically targets not only sulfates but also the nutrient load contributing to eutrophication. The difference between the two types of treatment lies in the type of wastewater used: Scenario IIIa employs urban wastewater, while scenario IIIb uses eutrophic water from Lake Patarcocha. This distinction is essential to understanding the sustainability of the process based on the change in resources used, which, along with phosphates, contributes to co-treatment with greater accessibility.
In both treatments, the combined wastewater flow is 10 L/s. The volumetric mixing ratio for Treatment IIIa is 1/7 (v/v) between AW and urban wastewater, while for Treatment IIIb, the mixing ratio is 1/15 (v/v) between AW and eutrophic water from the lake. These ratios have been strategically selected to optimize the efficiency of the co-treatment process, ensuring effective contaminant removal and proper management of the waste generated. The use of the electrocoagulator in these scenarios not only facilitates sulfate removal but also improves the overall quality of the treated water by stabilizing pH and reducing the nutrient load that contributes to eutrophication. Treatment IIIa and IIIb represent an advanced stage of treatment, incorporating electrochemical methods to build on the biological and physical processes used in Treatment II. This integrated co-treatment approach aims to maximize process sustainability while addressing the specific challenges posed by different wastewater sources, highlighting a progressive improvement from the previous treatment schemes.

2.4. Estimation of Sustainability Indexes of Emergy

Emergy is a methodology developed to quantify the total energy used, directly or indirectly, in the production of a good or service, expressed in terms of solar equivalent energy (sei). This approach provides a comprehensive and holistic view of the environmental performance and sustainability of complex systems, integrating various natural resources, energies, and materials within a unified reference framework. Emergy allows for the evaluation of the solar energy required to produce resources and services, regardless of their origin. This includes not only the energy inherent in natural resources such as water, minerals, and fossil fuels but also human services, such as labor. Using indicators (Table 3) like the Net Emergy Yield Ratio (EYR), which measures the efficiency of transforming inputs into products; the Emergy Investment Ratio (EIR), which reflects the dependency on external inputs; the Environmental Loading Ratio (ELR), which compares the use of renewable resources versus non-renewable ones; and the Sustainability Index (SI), which measures the relationship between efficiency and environmental impact; emergy provides a comprehensive evaluation of the sustainability of a system. These indices enable an in-depth analysis of the balance between efficiency, sustainability, and environmental pressure, allowing for the comparison and optimization of treatment and production processes in terms of sustainability.
The calculation of sustainability indices within the theory of emergy is based on quantifying all energy flows involved in a system, expressed in terms of solar energy equivalents [34]. To calculate the Net Emergy Yield Ratio (EYR), the total emergy produced by the system is divided by the emergy invested to obtain it, reflecting the system’s efficiency in transforming inputs into useful products [38]. The Emergy Investment Ratio (EIR), on the other hand, is calculated by dividing the total emergy invested in external inputs by the emergy generated internally. A high EIR value indicates a strong dependence on external resources, which may compromise the long-term sustainability of the system [35]. The Environmental Loading Ratio (ELR) compares the emergy of non-renewable resources and services with the emergy of renewable resources, providing a measure of the environmental burden on the ecosystem. The Sustainability Index (SI) is calculated as the ratio between EYR and ELR, offering an overall perspective on the ability of a system to be both sustainable and efficient [39]. These calculations allow for a quantitative assessment that facilitates comparison and decision-making to enhance the sustainability of water treatment processes and other productive systems.

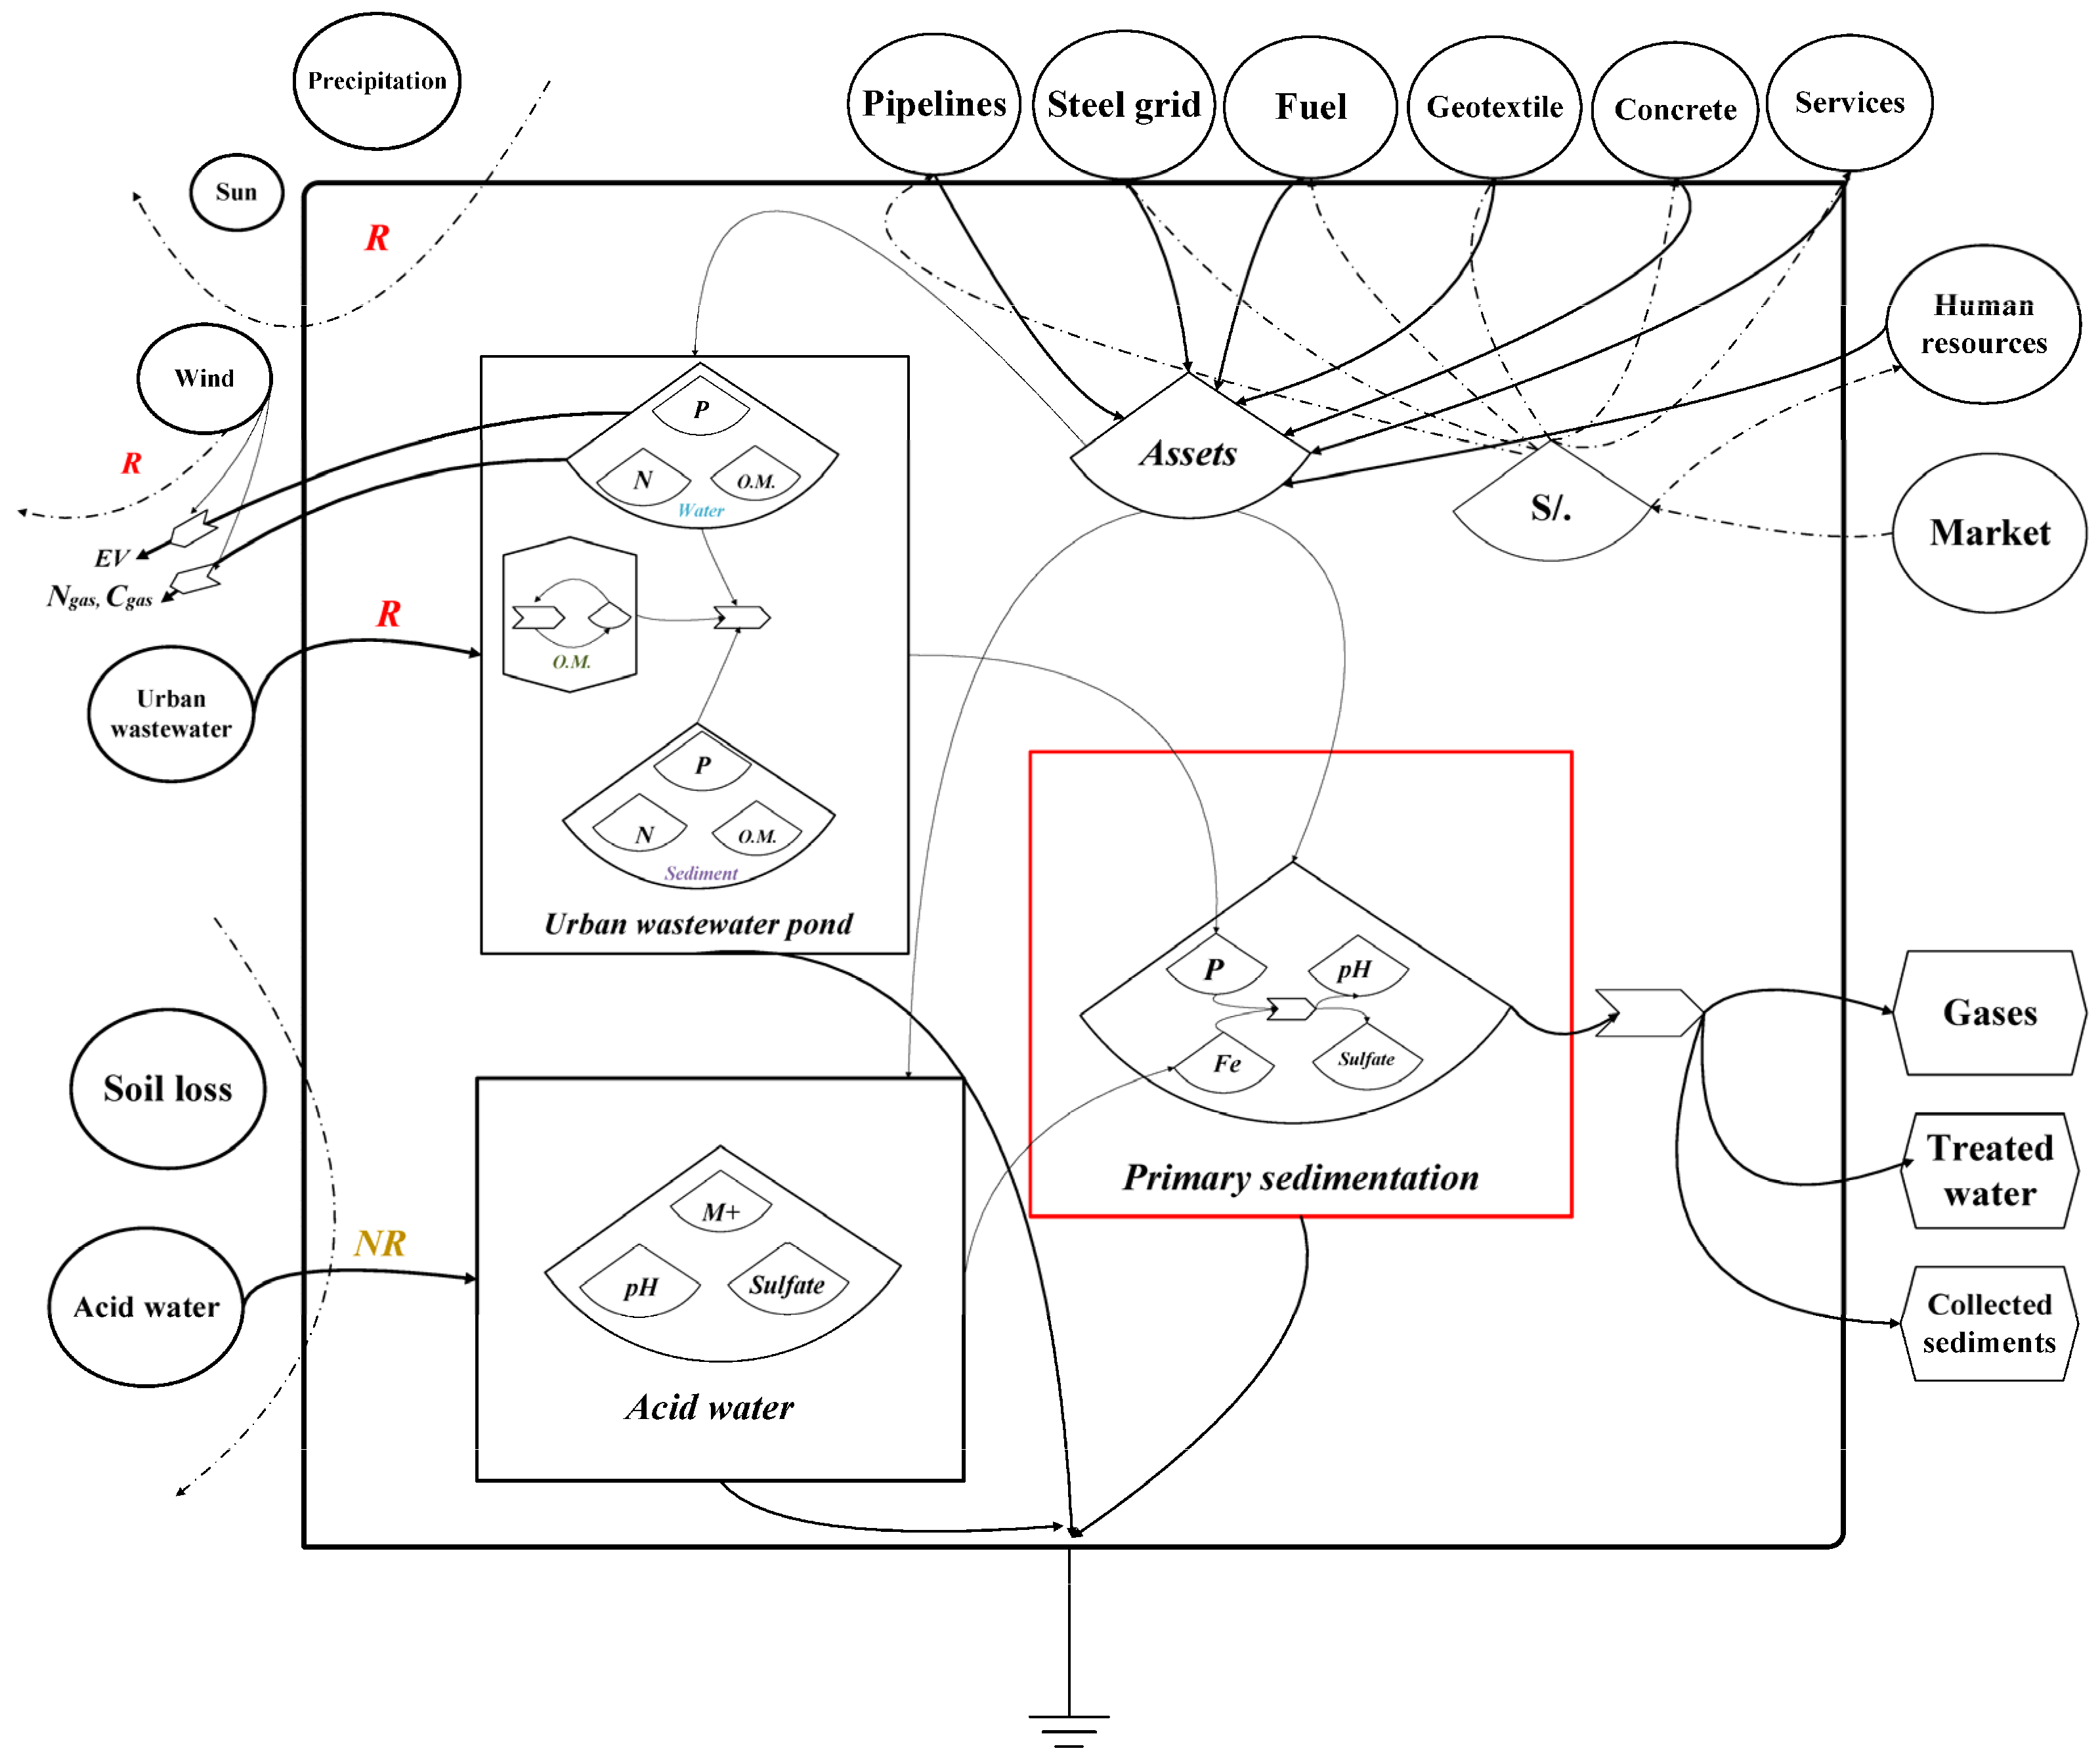
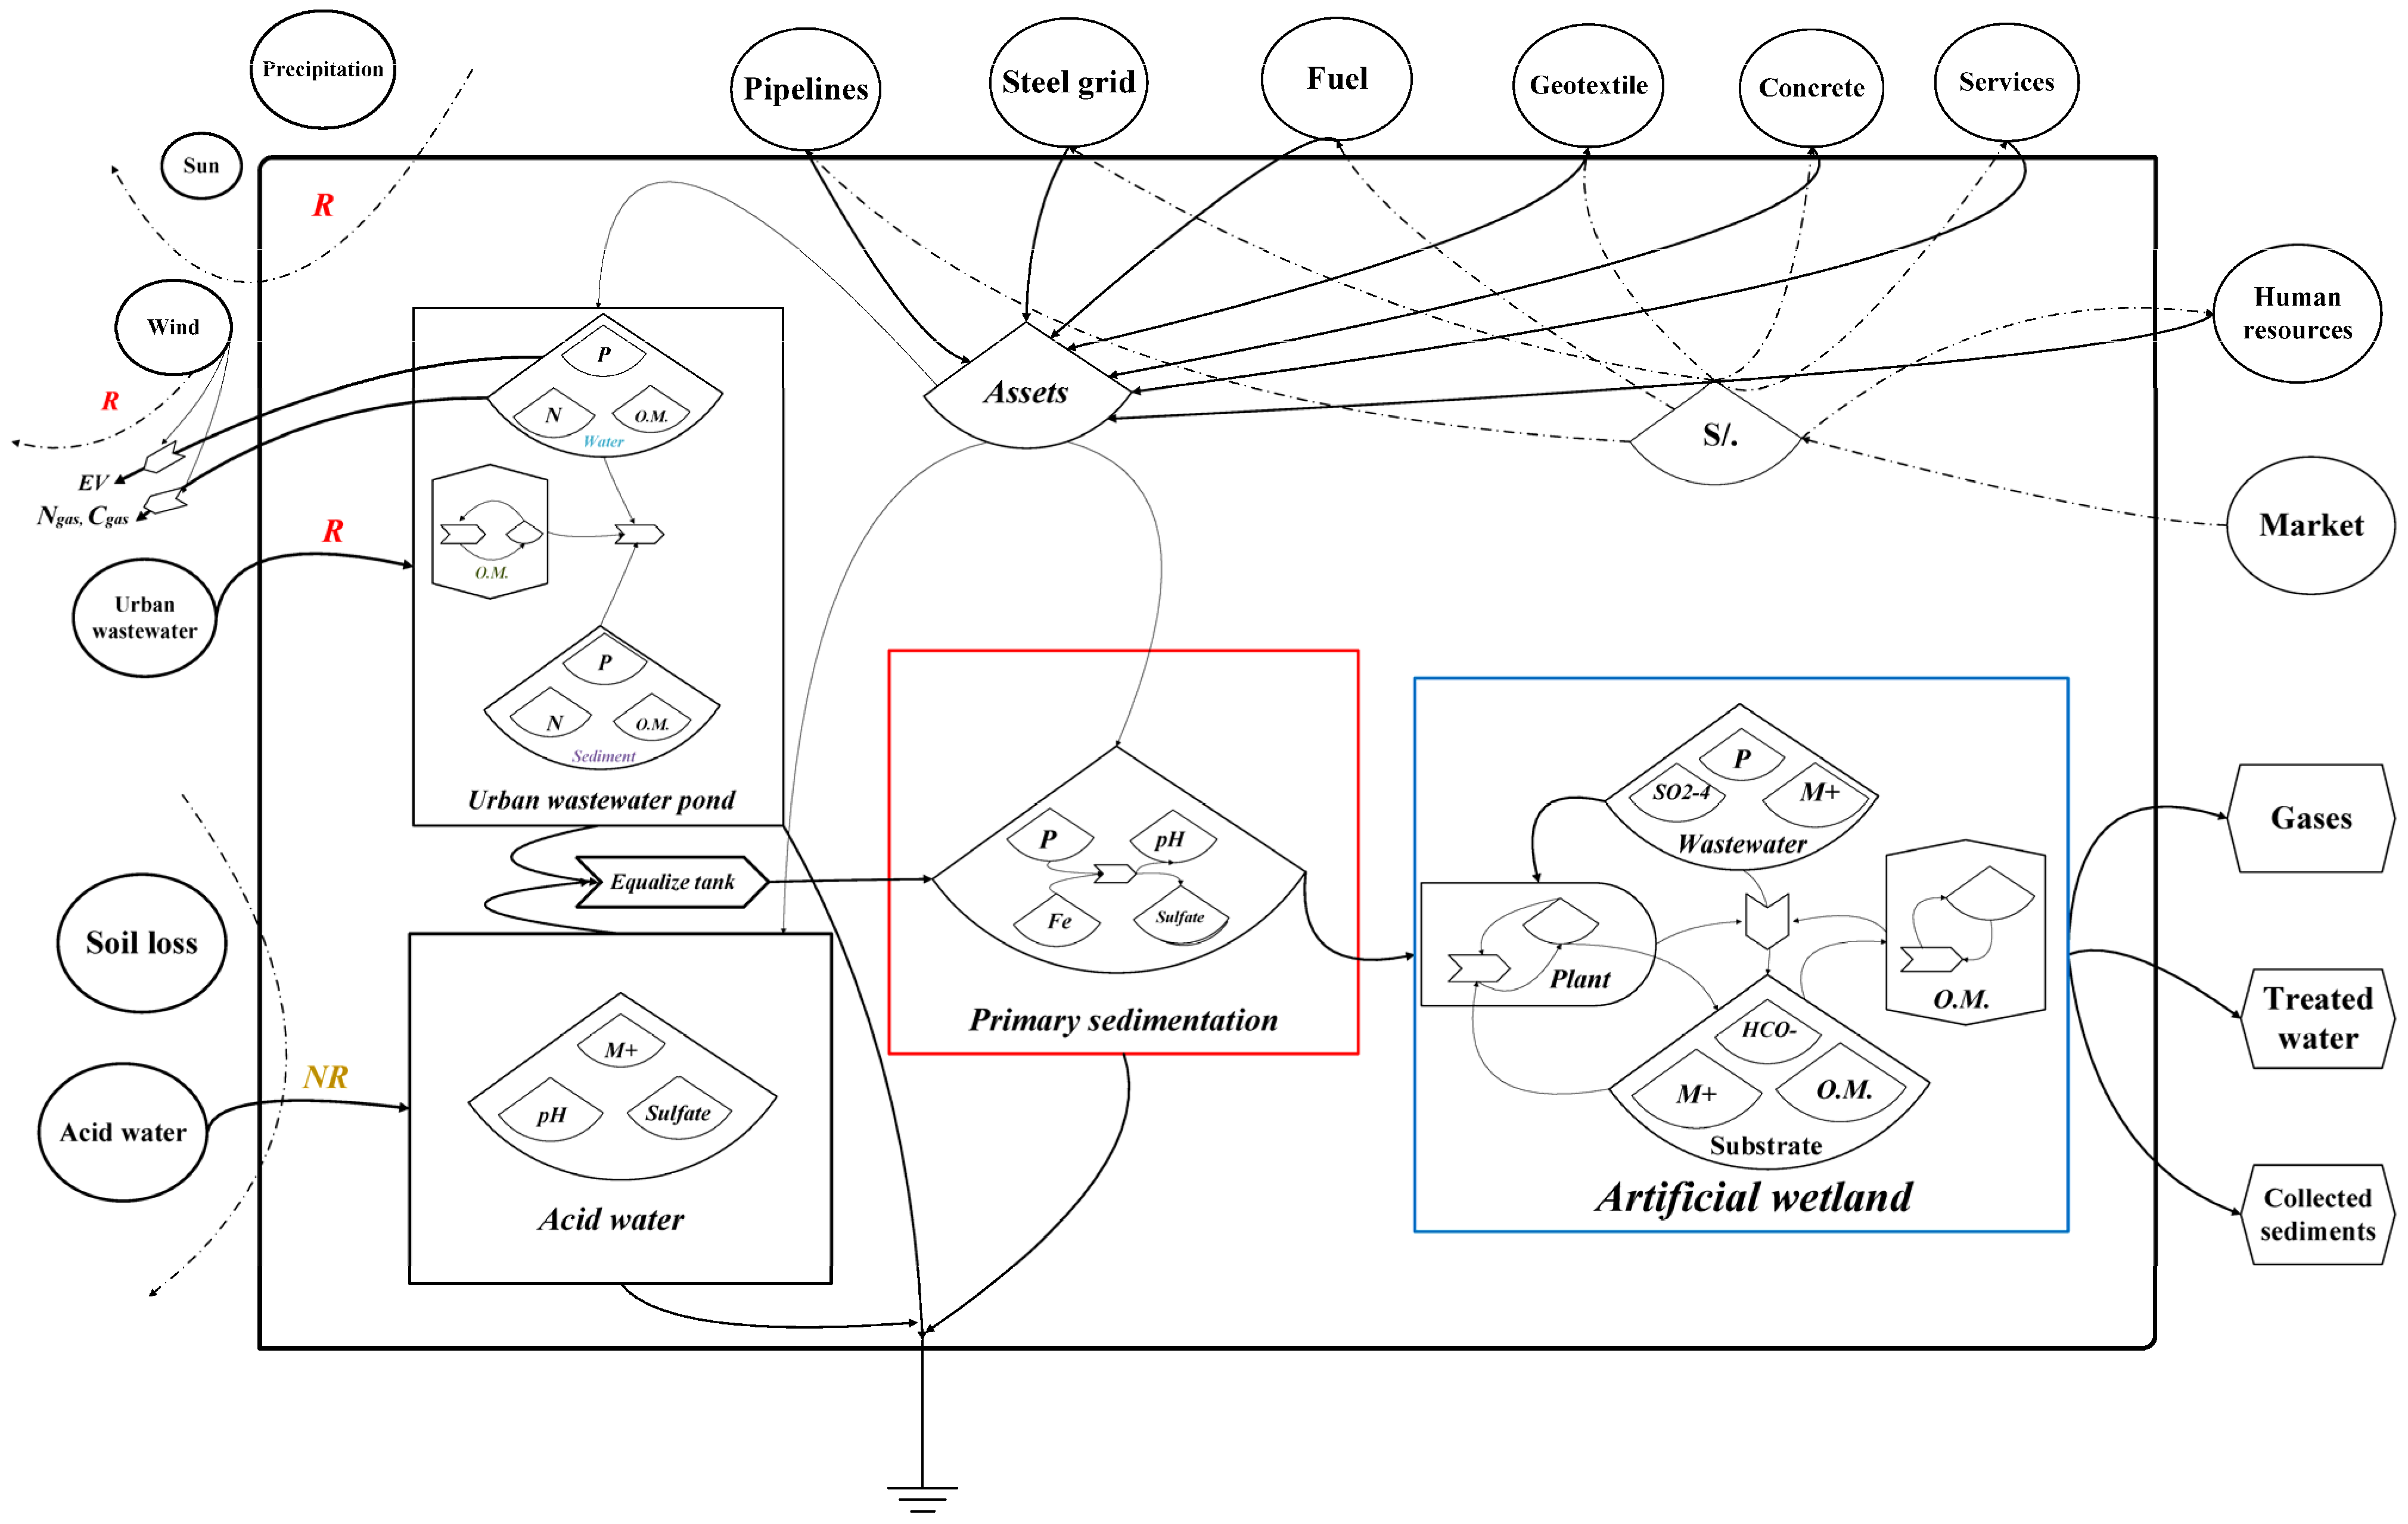
2.5. Process Flow Diagrams

Figure 5 shows the emergy flow diagram of Treatment I, a scenario specifically designed for the co-treatment of AMD and MW through a primary sedimentation process. This integrated approach is essential to simultaneously address the complex characteristics of both types of wastewater, optimizing resources and improving treatment efficiency. The emergy diagram of Treatment I reveals that this co-treatment process does not significantly rely on imported emergy flows, meaning that the system operates without the need for large external energy inputs, which could be an advantage from a sustainability perspective. However, the scheme highlights an active consumption of resources during the construction and installation of the primary sedimentation tank and storage ponds, reflecting the initial emergy investment associated with the system’s infrastructure. These elements include construction materials, energy used in the installation, and other resources required to start up the system.
In terms of sustainability, this co-treatment approach in Treatment I demonstrates a model that, although simple, focuses on efficiency by minimizing dependence on external energy inputs. However, a full assessment of its performance requires considering not only the contaminant removal capacity but also the initial emergy impact and the potential to integrate additional processes that improve the quality of treated water. This analysis underscores the importance of primary sedimentation as a viable strategy in the co-treatment of AMD and MW, providing a foundation for improving and optimizing more complex treatment systems.
Figure 6 illustrates the emergy flow diagrams of Treatment II, a co-treatment system that combines primary sedimentation with a passive secondary treatment via a subsurface flow constructed wetland. This approach integrates the contaminant removal capacity of sedimentation with the ecological benefits of a wetland, thus optimizing the treatment process for mixed water sources from urban and acidic origins. In Treatment II, urban wastewater and AMD are stored in separate ponds before being mixed in the primary sedimentation tank. In this initial process, the sedimentation of solids occurs, contributing to the partial removal of nutrients, heavy metals, and other contaminants. From an emergy perspective, the main internal flows at this stage include natural emergy inputs, such as solar and wind energy, which indirectly influence the biogeochemical processes within the ponds and sedimentation. Once water passes through primary sedimentation, it flows into the subsurface flow constructed wetland, where secondary treatment takes place. The wetland functions as a passive system that harnesses the natural water purification processes facilitated by the interaction between vegetation, substrates, and organic matter. From an emergy standpoint, the wetland introduces new inputs of renewable emergy, primarily from solar energy captured by the plants and the biological processes occurring in the substrate [23]. Although there is no significant imported emergy during the daily operation of wetlands, the initial construction costs of the artificial wetlands are substantial. These costs include the emergy embedded in the construction materials, energy used during installation, and the resources required to establish the substrate and vegetation.
Figure 7 presents the emergy flow diagrams for Treatments IIIa and IIIb, which focus on the co-treatment of AMD together with MW and eutrophic lake water, respectively. Both treatments combine primary sedimentation, electrocoagulation, and secondary sedimentation, but they differ in the wastewater source used. This comparison allows for evaluating how the specific characteristics of the water resources impact the treatment efficiency and the system’s emergy balance. In Treatment IIIa, the process begins with mixing AMD and urban wastewater in a primary sedimentation tank. This initial phase allows for the sedimentation of suspended solids and the partial reduction in contaminants such as nutrients and heavy metals. From an emergy perspective, key inputs include natural emergy (sun, wind, precipitation) that indirectly contributes to the physical and biogeochemical processes within the system, along with the emergy contained in the constructed infrastructures, such as the sedimentation tank and storage ponds.
The next step is electrocoagulation, a central process in this treatment, which specializes in sulfate removal and pH regulation. Electrocoagulation is energy-intensive as it requires direct energy consumption to operate cylindrical electrodes. This energy input is one of the main contributions to the system’s emergy balance, significantly increasing the imported emergy required for the continuous operation of the treatment. After electrocoagulation, water passes to a secondary sedimentation tank, where dissolved sulfates and foam generated during electrocoagulation are collected. This process ensures that the treated water meets quality standards before discharge or reuse. In terms of outputs, the system produces treated water, gases (due to chemical reactions), and collected sediments that must be appropriately managed.
Treatment IIIb introduces a significant change by replacing urban wastewater with eutrophic lake water. This change is based on the synergistic properties of eutrophic water, which is rich in organic phosphorus and has a high pH, favoring neutralization reactions and the formation of precipitates when mixed with acid mine drainage. Primary sedimentation in this scenario follows a similar process to IIIa, but the input of renewable emergy associated with the use of eutrophic water favorably alters the emergy balance.
The electrocoagulation process in Treatment IIIb plays a critical role in sulfate removal and pH regulation. Its efficiency, however, is notably enhanced by the presence of phosphorus in eutrophic water, which reacts with iron in acid mine drainage. This interaction facilitates more effective contaminant removal while reducing the demand for imported emergy. The emergy flow diagram for Treatment IIIb highlights greater efficiency in utilizing natural resources and a reduction in dependence on external energy, thereby improving the sustainability of the process.
In comparing Treatments IIIa and IIIb, significant differences emerge in their emergy balances. Treatment IIIa requires a considerable input of imported emergy to operate the electrocoagulation system, increasing both energy costs and environmental impact. Although it effectively removes sulfate and regulates pH, its long-term sustainability is compromised by its high energy demands. Conversely, Treatment IIIb, which incorporates eutrophic lake water, demonstrates a substantial improvement in emergy efficiency. The high phosphorus content and alkaline pH of the eutrophic water reduce the need for external energy inputs, making the electrocoagulation process more efficient. Additionally, phosphorus forms precipitates with the iron from acid mine drainage, further optimizing contaminant removal and enhancing water quality.
Emergy analysis of both treatments underscores the importance of selecting water resources based on their chemical composition and their interactions within the treatment system. The synergy observed in Treatment IIIb offers a more sustainable and cost-effective solution, particularly in scenarios where energy efficiency and environmental impact reduction are paramount. While both treatments show promising results in sulfate removal and pH regulation, Treatment IIIb’s use of eutrophic lake water presents a clear emergy advantage. This highlights the critical role of integrating natural and renewable resources into the design of more sustainable water treatment systems.

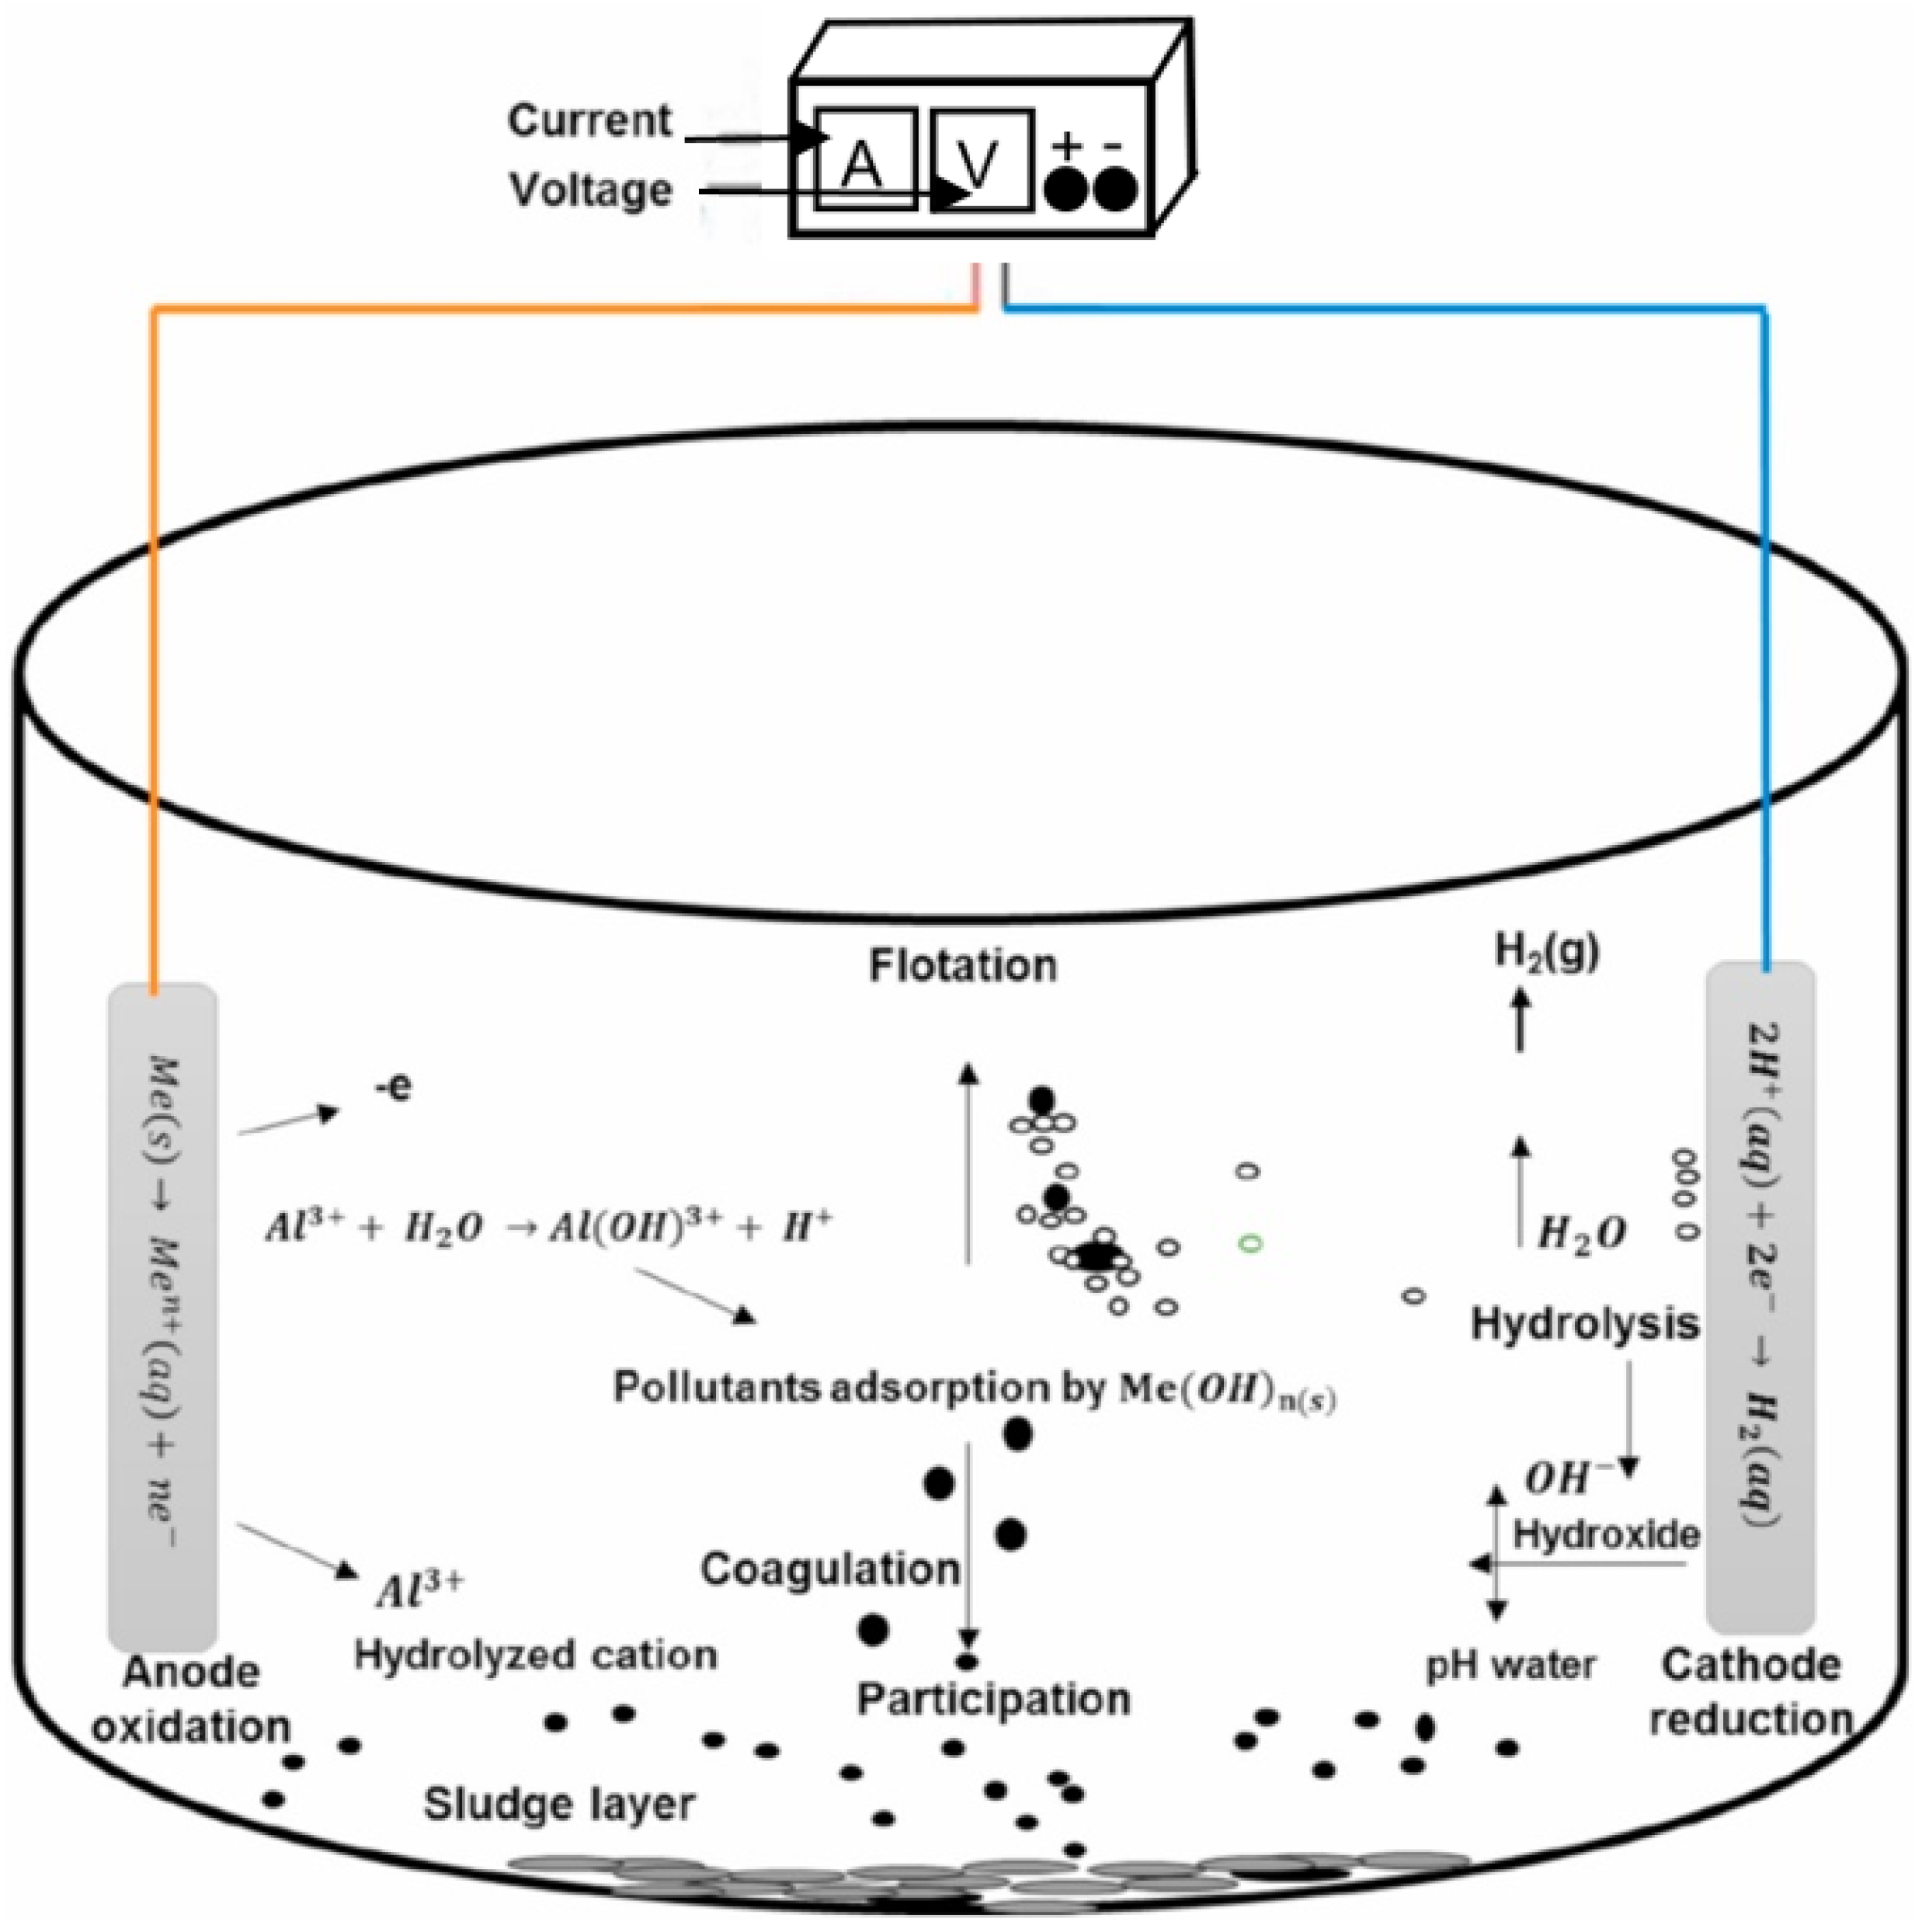
2.6. Intermittent Flow Electrocoagulation

Electrocoagulation is a physicochemical process that utilizes electric current to coagulate particles in colloidal systems, facilitating phase separation in wastewater [32]. During this process, electrolysis with sacrificial iron or aluminum anodes generates cations that act as coagulants, promoting the adhesion and coalescence of contaminant particles [27]. This method offers significant advantages over traditional coagulation, as it does not require the addition of chemical products, thereby reducing costs. Additionally, the formation of hydrogen bubbles at the cathode promotes electroflotation, which, combined with sedimentation, maximizes efficiency in the separation and removal of waterborne contaminants. Together, these techniques enable the effective removal of a wide range of contaminants, making electrocoagulation a sustainable and efficient option for wastewater treatment [28].
The electrocoagulation method incorporates various processes such as electrical, chemical, and physical mechanisms to produce coagulants. Flocs are formed in the solution phase in situ through the electrooxidation of the reducing agent. This method is closely related to the traditional coagulation mechanism for water treatment. Coagulation is the conventional physicochemical approach that adds chemicals such as alum to differentiate the phases between contaminants and wastewater before discharge into the environment. However, electrocoagulation is an electrochemical procedure that uses minimal electrical charge to remove contaminants from the aqueous phase without adding chemicals. The charged particles and ions are neutralized by ions with opposite electrical charges, resulting in precipitation as shown in Figure 8 [42].
For the design of scenario IIIa and scenario IIIb, which includes the integration of an electrocoagulation system, this research illustrates in Figure 9 an intermittent upflow electrocoagulation system composed of several interconnected parts. According to Figure 9a, at the top, component 1 is the foam–liquid separator chamber, which allows the removal of foam generated during the process. Component 2 is the tube containing the foam–liquid mixture, facilitating the separation of contaminants. Inside this system is the electrolysis chamber (component 3), where the electrochemical process occurs, destabilizing the contaminant particles. The liquid flow is regulated by a ball valve (component 5), while the reducer (component 4) adjusts the diameter to facilitate the transition between sections of the system. The system also includes a foam expulsion component (6), which removes the foam generated during the reaction, and an electro-regulator support (7), which holds the entire system and regulates the operation of the electrochemical process. Overall, this system optimizes the separation of contaminants using electrocoagulation. Figure 9b shows the real pilot-scale electrocoagulation system (red box).

3. Results

Table 4 delineates the emergy calculations for various co-treatment scenarios of AW and MW, encompassing diverse resource categories (renewable, non-renewable, imports, and exports) across scenarios, I, II, IIIa, and IIIb. A comprehensive analysis reveals significant disparities in energy efficiency and system complexity, particularly in the more advanced scenarios (IIIa and IIIb).
For renewable resources, emergy values for solar energy and wind remain constant across all scenarios (5.64 × 10¹² sej for solar energy and between 3.40 × 10¹⁰ to 4.98 × 10¹⁰ sej for wind). These findings indicate that these natural energy inputs are uniformly captured and utilized across all processes, irrespective of the technological sophistication of the methodologies employed.
However, the emergy associated with geopotential and chemical rain exhibits a marked increase in scenarios IIIa and IIIb, with values ranging from 1.33 x 10¹⁴ to 1.96 x 10¹⁴ sej for geopotential rain and from 2.51 × 10¹⁴ to 3.67 × 10¹⁴ sej for chemical rain. This observation suggests that the more advanced scenarios, which incorporate technologies such as electrocoagulation and the utilization of eutrophic water, demonstrate enhanced interaction with natural hydrological cycles, thereby augmenting synergy with water resources.
In the context of non-renewable resources, soil loss emerges as a critical indicator across these scenarios, exhibiting an increase from 1.39 × 10¹⁴ sej in scenario I to 1.92 × 10¹⁴ sej in scenario IIIb. This escalation is indicative of the expanded infrastructure and intensified land intervention necessitated by more complex scenarios incorporating technologies such as electrocoagulation and artificial wetlands.
Conversely, the emergy associated with AW treatment remains constant (9.79 × 10 18 sej), suggesting that the volume of AW processed is invariant across different methodologies.
Imported resources encompass critical materials such as polyvinyl chloride (PVC) for piping, geotextiles, and concrete, all of which demonstrate significant increases in scenarios IIIa and IIIb. The emergy associated with PVC pipes rises from 8.01 × 10¹⁶ sej in scenario I to 1.97 × 10¹⁷ sej in scenario IIIb, reflecting the requisite robust infrastructure to support advanced technologies like electrocoagulation. Similarly, concrete exhibits an increase from 3.62 × 10¹⁷ sej in scenario I to 4.69 × 10¹⁷ sej in scenario IIIb, underscoring the need for more sophisticated infrastructure to accommodate these processes.
The utilization of metals, particularly aluminum, also intensifies (1.32 × 10¹⁴ sej in scenario IIIb), indicative of the heightened complexity inherent in electrochemical treatment. Concomitantly, the energy flow in the electrodes, integral to electrocoagulation, increases markedly, especially in scenario IIIb, highlighting the substantial energy demands of this technology. Regarding system exports, the emergy associated with treated water remains constant across all scenarios, with a value of 2.97 × 10¹⁹ sej. This finding suggests that despite variations in treatment method complexity and resource consumption, all scenarios achieve comparable water processing volumes, albeit with variable efficiencies.
The more advanced scenarios (IIIa and IIIb) exhibit higher emergy requirements for both renewable and non-renewable resources, as well as for imports necessary for system construction and operation. However, scenario IIIb, which incorporates eutrophic water, distinguishes itself through enhanced efficiency in renewable resource utilization and a reduction in imported emergy compared to IIIa. This observation implies that the integration of synergistic resources, such as eutrophic water, can augment the sustainability and energy efficiency of the co-treatment system, thereby minimizing environmental burden and optimizing renewable energy utilization.
In the Supplementary Material (Table S2), the calculations developed to determine the different sustainability indicators are shown. According to Table S2, Table 5 provides a comprehensive comparison of emergy indicators across the different wastewater treatment scenarios (I, II, IIIa, and IIIb). The Net Yield Ratio (EYR) is a key indicator that measures the efficiency of resources used to generate a net energy yield. In scenario I, the EYR is the highest (15.26), reflecting that this simplest treatment achieves the greatest energy benefit with the least investment. As we move toward more complex technologies, such as in scenarios IIIa (5.09) and IIIb (2.82), the EYR decreases significantly. This indicates that the more advanced scenarios, like those involving electrocoagulation, require a higher investment of energy resources to operate, thus reducing their net efficiency. The Energy Inversion Ratio (EIR), which quantifies the dependence on external energy resources (imports), follows an upward trend. In scenario I, with a value of 0.05, the dependence on external resources is low, but it increases significantly in scenario IIIb (0.55). This indicates that while more advanced treatments require a greater amount of energy and external resources, they also become less energy-self-sufficient. The Environmental Loading Ratio (ELR) also shows a progressive increase as more complex scenarios are adopted, increasing from 0.45 in scenario I to 1.22 in scenario IIIb. The ELR reflects the pressure a system exerts on the environment by comparing non-renewable resources used against renewable ones. The increase in the ELR suggests that more advanced treatments, while more effective, have a greater environmental impact due to their higher reliance on non-renewable resources, thus generating a greater ecological load. Finally, the Sustainability Index (SI), which combines energy efficiency with environmental impact, decreases drastically as the treatments become more sophisticated. In scenario I, the SI is 33.99, suggesting that this treatment is highly sustainable. However, in scenario IIIb, the SI drops to 2.31, indicating that while advanced technologies achieve more efficient water treatment, they do so at the cost of the system’s sustainability. This decline in the SI highlights the need to balance technological effectiveness with long-term environmental sustainability. These results suggest that simpler treatment scenarios (I and II) are more sustainable and less reliant on external inputs, while advanced scenarios (IIIa and IIIb), although more effective in terms of treatment, present a higher energy cost and significant environmental burden, raising questions about their long-term viability from a sustainability perspective.

4. Discussion

The co-treatment of AW and MW, integrating both renewable and non-renewable emergy, can be critically analyzed by comparing the results of different treatment scenarios (I, II, IIIa, and IIIb) with previous studies. Scenario I, which utilizes renewable resources (2.59 × 10¹⁹ sej/year), reflects a system primarily dependent on natural flows such as sunlight and wind. This aligns with findings by Grönlund [51], who pointed out that wastewater treatment systems leveraging renewable resources can reduce carbon footprint and enhance long-term sustainability.
However, this value decreases in scenario IIIb to 1.12 × 10¹⁹ sej/year, attributed to the incorporation of more advanced technologies such as electrocoagulation and the integration of eutrophic lake water, which optimizes the emergy balance without heavily relying on external renewable sources. Arden [31] supported this by highlighting that treatment configurations integrating energy feedback and reuse, as seen in scenario IIIb, promote sustainability by reducing the need for external emergy inputs. Similarly, Chen [52] argued that renewable sources should be maximized when integrating energy-intensive technologies such as electrocoagulation, to mitigate the increased demand for non-renewable energy. In scenario IIIb, the significant reduction in non-renewable resources to 4.90 × 10¹⁸ sej/year underscores the efficiency of this treatment, consistent with Giannetti [53] who suggested that integrating efficient technologies reduces reliance on non-renewable inputs, generating a positive impact on system sustainability.
On the other hand, the dependence on non-renewable resources is more evident in simpler scenarios, such as in Treatments I and II, with constant non-renewable emergy use of 9.79 × 10¹⁸ sej/year. This aligns with Cano [54], who found that treatment processes heavily dependent on non-renewable resources tend to be less sustainable in the long term, particularly when they fail to incorporate advanced technologies that optimize the use of natural resources. Emergy imports, mainly in the form of materials such as PVC pipes and concrete, significantly increase in scenarios IIIa and IIIb, reaching up to 8.85 × 10¹⁸ sej/year in scenario IIIb, which is related to the technological complexity of processes like electrocoagulation. This trend is also reported in studies such as Shao [55], which highlighted that adopting more advanced technologies, although more efficient in contaminant removal, requires a greater investment in material and energy inputs. Zhang [56] emphasized that advanced treatment systems like electrocoagulation demand more material inputs, increasing the system’s energy demand and environmental impact. This is particularly relevant in scenario IIIa, where operating the cylindrical electrodes creates a considerable energy demand, raising operational costs and affecting the emergy balance. Moss [57] also stressed the need to continuously evaluate the cost-effectiveness and sustainability of these processes, considering their high energy costs.
Furthermore, the use of electrocoagulation in scenario IIIa, which proves to be energy-intensive, shows greater demand for imported energy. However, the use of eutrophic water in scenario IIIb significantly improves the system’s energy efficiency. Theregowda [58] highlighted that processes like struvite recovery and integrating natural nutrients can significantly improve the emergy balance, reducing the demand for non-renewable resources and making the system more sustainable.
For greater detail, the inclusion of electrocoagulation in the advanced scenarios (IIIa and IIIb) introduces a highly effective technology for the removal of specific contaminants such as heavy metals and sulfates while regulating the pH of treated water. However, electrocoagulation is an energy-intensive technology, reflected in the significant increase in imported emergy in these scenarios. In scenario IIIa, the imported emergy needed to maintain the electrocoagulation system operation is 6.32 × 10¹⁸ sej/year, while in scenario IIIb, with the addition of eutrophic water, this demand slightly decreases to 8.85 × 10¹⁸ sej/year. This suggests that although electrocoagulation is an efficient process for contaminant removal, its implementation largely depends on external energy inputs. Wang [59] confirmed that electrocoagulation, though effective, entails a high energy cost compared to other treatment alternatives such as artificial wetlands or passive biological systems. For instance, in scenario II, which uses a subsurface flow artificial wetland for secondary treatment, the emergy balance is more favorable. Here, imported emergy is considerably lower, with a value of 2.14 × 10⁶ sej/year, highlighting the advantage of using passive technologies in terms of energy demand. Polyakova [34] also emphasized that while artificial wetlands are less effective at removing specific contaminants such as heavy metals, their low energy cost and capacity to integrate renewable emergy make them a more sustainable long-term option.
The comparison between electrocoagulation and technologies such as biological filters is also pertinent. Geber [60] argued that biological treatment systems, while less effective at removing complex contaminants, require less investment in energy resources. In their study, biological systems reported significantly lower imported emergy consumption than systems based on electrocoagulation, reducing pressure on non-renewable resources. However, these systems face limitations in removing specific contaminants such as sulfates, where electrocoagulation offers notable advantages due to its ability to generate direct chemical reactions with iron and other metals in the water. Regarding the comparison between electrocoagulation and the use of artificial wetlands. Polyakova [34] further supported that passive systems, such as wetlands require less energy for operation, improving the overall emergy balance, although their capacity to efficiently treat specific contaminants such as heavy metals is limited. This is consistent with the results obtained in Treatment II, where the use of an artificial wetland reduces the need for external energy, though its capacity to treat large volumes of AW is less efficient compared to technologies like electrocoagulation.
Regarding performance indicators, scenario I shows the highest Net Emergy Yield Ratio (EYR) with a value of 15.26, indicating that although it is a simpler process, it is highly efficient in terms of emergy conversion. However, its Sustainability Index (SI) is lower compared to scenarios that incorporate more advanced technologies such as electrocoagulation. Chen [33] argued that simpler treatment processes may be more energy-efficient but lack the long-term sustainability provided by more complex systems.
The analysis of sustainability indices shows that scenario I has a high SI (33.99), indicating a simple but energy-efficient system. However, as Winfrey [40] discussed, simpler systems, although efficient in terms of energy conversion, often lack the capacity to handle more complex contaminants. On the other hand, scenario IIIb, with an SI of 2.31, is less energy-efficient, but as Wang [47] pointed out, the integration of synergistic resources like eutrophic water can offset the high energy demand by significantly reducing non-renewable energy inputs, improving the overall sustainability balance of the system. Conversely, technologies like biological filtration systems and treatments with wetlands have a higher SI due to their ability to integrate natural processes, minimizing dependency on external inputs. Winfrey [40] supported this conclusion, arguing that passive systems, although less effective at removing difficult contaminants like heavy metals, offer greater sustainability in terms of their low energy demand.
The Environmental Loading Ratio (ELR) also reveals important differences in environmental pressure between scenarios. In scenario I, the ELR of 0.45 indicates low environmental pressure, consistent with Tilley [61], who suggested that systems with lower demand for external inputs tend to be more sustainable in terms of environmental impact. However, this value increases considerably in scenarios IIIa and IIIb, reflecting the higher environmental pressure generated by technological complexity and the need for imported materials. Geber [60] highlighted that although advanced processes are effective for contaminant removal, they tend to generate a higher ecological load due to intensive energy and material use. The use of eutrophic water in scenario IIIb considerably improves the system’s emergy balance, as demonstrated by studies such as Qi [62], which noted that incorporating synergistic resources like phosphorus present in eutrophic water favors chemical reactions in the electrocoagulation process, reducing the demand for imported energy. Lv [38] also supported this idea, stressing that integrating natural resources and synergistic processes in treatment systems can optimize both energy efficiency and long-term sustainability. In terms of renewable emergy, technologies based on natural processes such as artificial wetlands or biological filtration systems more effectively harness natural energy flows. For example, scenario II, which includes an artificial wetland, shows a greater capacity to capture solar and wind emergy without needing to increase external energy use. This is reflected in a lower Environmental Loading Ratio (ELR) of 0.45, compared to scenario IIIa, where the ELR is 1.22, due to the high demand for non-renewable resources in operating the electrocoagulation system.
Giannetti [37] noted that treatment systems using advanced technologies such as electrocoagulation tend to generate higher environmental pressure due to their high demand for energy and imported materials. For this, the Net Emergy Yield Ratio (EYR) is a key indicator to compare the efficiency of different treatment technologies. In the case of electrocoagulation, the EYR is relatively low compared to simpler technologies such as artificial wetlands. However, by integrating synergistic resources such as eutrophic water in scenario IIIb, the system’s emergy balance can be improved, reducing external energy demand and enhancing the sustainability of the process. This is reflected in the Emergy Yield Ratio (EYR) of scenario IIIb, which is 2.82, significantly lower than in scenario I (15.26), but better than other systems based solely on electrocoagulation without synergistic resources.

5. Conclusions

The results show that scenarios I and II demonstrate a consistent and efficient use of renewable resources, maintaining similar values in the emergy calculations. However, as the analysis progresses toward more complex scenarios such as IIIa and IIIb, a reduction in the use of renewable resources is observed, particularly in scenario IIIb. This reduction in renewable resource usage in scenario IIIb, despite the integration of advanced technologies, suggests that the utilization of eutrophic water can optimize the process by reducing the need for external resources. The implementation of advanced technologies like electrocoagulation in scenarios IIIa and IIIb significantly increases reliance on non-renewable resources and energy imports. This is reflected in a rise in imported emergy values and the greater operational complexity of these scenarios. Nevertheless, the comparison between IIIa and IIIb indicates that the incorporation of eutrophic water in IIIb can mitigate some of these negative effects by improving system efficiency and reducing environmental impact.
The analysis of indicators such as the Environmental Loading Ratio (ELR) and the Emergy Inversion Ratio (EIR) reveals that the more advanced scenarios tend to increase environmental burdens and reduce system sustainability. The higher ELR in scenario IIIa highlights the greater environmental pressure associated with technological complexity and the intensive use of non-renewable resources. However, scenario IIIb, which reduces both the ELR and the EIR, demonstrates that resource optimization through the use of eutrophic water can enhance sustainability, achieving a more favorable balance between efficiency and environmental burden. The Sustainability Index (SI) is a key indicator that summarizes the overall sustainability of the system. The significant decrease in the SI in scenario IIIa compared to scenarios I and II reflects the challenges associated with integrating complex and energy-intensive technologies. Nevertheless, the increase in the SI in scenario IIIb underscores the advantage of incorporating eutrophic water, which not only improves treatment efficiency but also contributes to the greater overall sustainability of the co-treatment system.
The research concludes that, although advanced scenarios such as IIIa may offer improvements in contaminant removal, it is scenario IIIb that presents the best balance between efficiency and sustainability. The synergy created by the use of eutrophic water allows for a reduction in the reliance on non-renewable and energy resources while maintaining high efficiency in contaminant removal. This suggests that the optimization of co-treatment for acid and MW should focus on the integration of synergistic natural resources that can enhance both environmental performance and long-term sustainability. It highlights the importance of selecting and integrating technologies and resources that not only achieve treatment goals but also optimize emergy use and minimize environmental burden, contributing to more sustainable and efficient water treatment systems.

Supplementary Materials

The following supporting information can be downloaded at https://www.mdpi.com/article/10.3390/w16213081/s1, Figure S1: Scale plan of stabilization lake. Figure S2: Scaled plan of equalization tank and main cut primary sedimenter. Figure S3: Sludge drying bed and artificial wetland. Figure S4: Scaled plan scenario I. Figure S5: Scaled plan scenario II. Figure S6: Scaled plan scenario III. Table S1: Renewable emergy flows. Table S2: Emergy indicators for different co-treatment scenarios. Table S3: Imported and exported emergy flows. Table S4: Emergy indicators for different co-treatment scenarios. References [63,64,65,66,67,68,69,70,71,72] are cited in the Supplementary Materials.

Author Contributions

Conceptualization, L.B.-T.; methodology, P.V.-V. and R.R.-F.; software, L.S.-F. and C.R.-V.d.O.; investigation, A.P.-N. and F.T.-C.; resources, R.P.-V. and J.F.-S.; writing—original draft preparation, L.B.-T. and C.M.-S.; writing—review and editing, C.M.-S., P.V.-V. and J.F.-S.; visualization, L.B.-T. and A.P.-N.; supervision, A.P.-N. All authors have read and agreed to the published version of the manuscript.

Funding

This research received no external funding.

Data Availability Statement

The original contributions presented in the study are included in the article/Supplementary Material, further in-quiries can be directed to the corresponding authors.

Conflicts of Interest

The authors declare no conflicts of interest.

References

  1. Nepfumbada, C.; Tavengwa, N.T.; Masindi, V.; Foteinis, S.; Chatzisymeon, E. Recovery of phosphate from municipal wastewater as calcium phosphate and its subsequent application for the treatment of acid mine drainage. Resour. Conserv. Recycl. 2023, 190, 106779. [Google Scholar] [CrossRef]
  2. Strosnider, W.H.J.; Nairn, R.W. Effective passive treatment of high-strength acid mine drainage and raw municipal wastewater in Potosí, Bolivia using simple mutual incubations and limestone. J. Geochem. Explor. 2010, 105, 34–42. [Google Scholar] [CrossRef]
  3. Suxo, R.L. Evaluación Integral de la Infraestructura Sanitaria (Agua y Alcantarillado) de las Comunidades Amachuma Grande, Palca, Pacuani, Cebolullo, Tahuapalca y Cohoni del Municipio de Palca. 2022. Available online: https://repositorio.umsa.bo/handle/123456789/30800 (accessed on 19 October 2024).
  4. Chávez, R. Evaluación Geoquímica e Identificación de Drenaje Ácido de Roca de los Desmontes, Mineral y Pared de Tajo de la UEA-Cerro de Pasco Compañía Volcán. Bachelor’s Thesis, Universidad Nacional de Cajamarca, Cajamarca, Peru, 2018. [Google Scholar]
  5. Custodio, M.; Álvarez, D.; Cuadrado, W.; Montalvo, R.; Ochoa, S. Potentially toxic metals and metalloids in surface water intended for human consumption and other uses in the Mantaro River watershed, Peru. Soil Water Res. 2020, 15, 237–245. [Google Scholar] [CrossRef]
  6. Kaur, G.; Couperthwaite, S.J.; Hatton-Jones, B.W.; Millar, G.J. Alternative neutralisation materials for acid mine drainage treatment. J. Water Process Eng. 2018, 22, 46–58. [Google Scholar] [CrossRef]
  7. Tolonen, E.-T.; Sarpola, A.; Hu, T.; Rämö, J.; Lassi, U. Acid mine drainage treatment using by-products from quicklime manufacturing as neutralization chemicals. Chemosphere 2014, 117, 419–424. [Google Scholar] [CrossRef]
  8. Mokgehle, T.M.; Tavengwa, N.T. Recent developments in materials used for the removal of metal ions from acid mine drainage. Appl. Water Sci. 2021, 11, 42. [Google Scholar] [CrossRef]
  9. Hairuddin, M.N.; Mubarak, N.M.; Khalid, M.; Abdullah, E.C.; Walvekar, R.; Karri, R.R. Magnetic palm kernel biochar potential route for phenol removal from wastewater. Environ. Sci. Pollut. Res. 2019, 26, 35183–35197. [Google Scholar] [CrossRef]
  10. Buzzi, D.C.; Viegas, L.S.; Rodrigues, M.A.; Bernardes, A.M.; Tenório, J.A.S. Water recovery from acid mine drainage by electrodialysis. Miner. Eng. 2013, 40, 82–89. [Google Scholar] [CrossRef]
  11. Gervais, M.; Dubuc, J.; Paquin, M.; Gonzalez-Merchan, C.; Genty, T.; Neculita, C.M. Comparative efficiency of three advanced oxidation processes for thiosalts oxidation in mine-impacted water. Miner. Eng. 2020, 152, 106349. [Google Scholar] [CrossRef]
  12. Skousen, J.; Ziemkiewicz, P. Performance of 116 passive treatment systems for acid mine drainage. Am. Soc. Min. Reclam. 2005, 2005, 1100–1133. [Google Scholar]
  13. Ferraz, R.M.; Costa, J.M.; Verola, L.M.; Sancinetti, G.P.; Rodriguez, R.P. Effects of the inoculum source, electron donor, and immobilization on the microbial community of sulfidogenic bioreactors. Chem. Eng. J. 2021, 404, 126549. [Google Scholar] [CrossRef]
  14. Han, L.J.; Li, J.S.; Xue, Q.; Guo, M.Z.; Wang, P.; Poon, C.S. Enzymatically induced phosphate precipitation (EIPP) for stabilization/solidification (S/S) treatment of heavy metal tailings. Constr. Build Mater. 2022, 314, 125577. [Google Scholar] [CrossRef]
  15. Hameed, B.H.; Rahman, A.A. Removal of phenol from aqueous solutions by adsorption onto activated carbon prepared from biomass material. J. Hazard Mater. 2008, 160, 576–581. [Google Scholar] [CrossRef]
  16. Isik, O.; Erbil, M.C.; Abdelrahman, A.M.; Ersahin, M.E.; Koyuncu, I.; Ozgun, H.; Demir, I. Removal of micropollutants from municipal wastewater by membrane bioreactors: Conventional membrane versus dynamic membrane. J. Environ. Manag. 2022, 303, 114233. [Google Scholar] [CrossRef]
  17. Yang, Y.; Li, Y.; Mao, R.; Shi, Y.; Lin, S.; Qiao, M.; Zhao, X. Removal of phosphate in secondary effluent from municipal wastewater treatment plant by iron and aluminum electrocoagulation: Efficiency and mechanism. Sep. Purif. Technol. 2022, 286, 120439. [Google Scholar] [CrossRef]
  18. Aslam, A.; Khan, S.J.; Shahzad, H.M.A. Anaerobic membrane bioreactors (AnMBRs) for municipal wastewater treatment-potential benefits, constraints, and future perspectives: An updated review. Sci. Total Environ. 2022, 802, 149612. [Google Scholar] [CrossRef]
  19. Hossain, M.Z. Water: The Most Precious Resource of Our Life. Glob. J. Adv. Res. 2015, 2, 1436–1445. [Google Scholar]
  20. Wang, K.; Chen, X.; Yan, D.; Xu, Z.; Hu, P.; Li, H. Petrochemical and municipal wastewater treatment plants activated sludge each own distinct core bacteria driven by their specific incoming wastewater. Sci. Total Environ. 2022, 826, 153962. [Google Scholar] [CrossRef]
  21. Wang, Y.; Wang, W.; Wang, L. Understanding the relationships between rheology and chemistry of asphalt binders: A review. Constr. Build. Mater. 2022, 329, 127161. [Google Scholar] [CrossRef]
  22. Jia, Y.; Li, Z.; Jin, S.; Xu, C.; Deng, H.; Zhang, M. Runoff Changes from Urumqi Glacier No. 1 over the Past 60 Years, Eastern Tianshan, Central Asia. Water 2020, 12, 1286. [Google Scholar] [CrossRef]
  23. Johnson, K.L.; Younger, P.L. The co-treatment of sewage and mine waters in aerobic wetlands. Eng. Geol. 2006, 85, 53–61. [Google Scholar] [CrossRef]
  24. Younger, P.L.; Henderson, R. Synergistic wetland treatment of sewage and mine water: Pollutant removal performance of the first full-scale system. Water Res. 2014, 55, 74–82. [Google Scholar] [CrossRef]
  25. Mamelkina, M.A.; Tuunila, R.; Sillänpää, M.; Häkkinen, A. Systematic study on sulfate removal from mining waters by electrocoagulation. Sep. Purif. Technol. 2019, 216, 43–50. [Google Scholar] [CrossRef]
  26. Mickova, I. Advanced electrochemical technologies in wastewater treatment part I: Electrocoagulation. Am. Sci. Res. J. Eng. Technol. Sci. 2015, 14, 233–257. [Google Scholar]
  27. Mousazadeh, M.; Naghdali, Z.; Al-Qodah, Z.; Alizadeh, S.M.; Karamati Niaragh, E.; Malekmohammadi, S.; Nidheesh, P.V.; Roberts, E.P.L.; Sillanpää, M.; Emamjomeh, M.M. A systematic diagnosis of state of the art in the use of electrocoagulation as a sustainable technology for pollutant treatment: An updated review. Sustain. Energy Technol. Assess. 2021, 47, 101353. [Google Scholar] [CrossRef]
  28. Mayta Lovaton, J.Y. Análisis del Método de Electrocoagulación en la Eliminación de Microplásticos en Aguas Residuales a Nivel de Laboratorio. Master’s Thesis, Universidad Nacional del Centro del Perú, Huancayo, Peru, 2023. [Google Scholar]
  29. Ensano, B.M.B.; Borea, L.; Naddeo, V.; Belgiorno, V.; De Luna, M.D.G.; Ballesteros, F.C., Jr. Removal of pharmaceuticals from wastewater by intermittent electrocoagulation. Water 2017, 9, 85. [Google Scholar] [CrossRef]
  30. Hughes, T.A.; Gray, N.F. Co-treatment of acid mine drainage with municipal wastewater: Performance evaluation. Environ. Sci. Pollut. Res. 2013, 20, 7863–7877. [Google Scholar] [CrossRef]
  31. Arden, S.; Ma, X.; Brown, M. Holistic analysis of urban water systems in the Greater Cincinnati region: (2) resource use profiles by emergy accounting approach. Water Res. X 2019, 2, 100012. [Google Scholar] [CrossRef]
  32. Pan, H.; Geng, Y.; Tian, X.; Wilson, J.; Chen, W.; Zhong, S.; Song, X. Emergy-based environmental accounting of one mining system. Environ. Sci. Pollut. Res. 2019, 26, 14598–14615. [Google Scholar] [CrossRef]
  33. Chen, B.; Chen, Z.M.; Zhou, Y.; Zhou, J.B.; Chen, G.Q. Emergy as embodied energy based assessment for local sustainability of a constructed wetland in Beijing. Commun. Nonlinear Sci. Numer. Simul. 2009, 14, 622–635. [Google Scholar] [CrossRef]
  34. Polyakova, O.S.; Semenov, S.Y. Emergy analysis of wastewater treatment technology. Eur. Proc. Soc. Behav. Sci. 2017, 26, 784–791. [Google Scholar]
  35. Londoño, N.A.C.; Suárez, D.G.; Velásquez, H.I.; Ruiz-Mercado, G.J. Emergy analysis for the sustainable utilization of biosolids generated in a municipal wastewater treatment plant. J. Clean. Prod. 2017, 141, 182–193. [Google Scholar] [CrossRef]
  36. Arguello Delago, J.G.; Gonzales Aguinaca, P.J. Evaluación de Emergía de Medio Ambiente y la Económia de Nicaragua (1995–1999); Universidad Nacional Agraria: Managua, Nicaragua, 1999. [Google Scholar]
  37. Giannetti, B.F.; Silva, C.C.; Agostinho, F.; Almeida, C. Emergy evaluation of Domestic Wastewater Treatments: The role of Energy and Materials Consumption and Carbon Emissions. J. Environ. Account. Manag. 2016, 4, 317–338. [Google Scholar] [CrossRef]
  38. Lv, C.; He, Y.; Zhang, W.; Gu, C.; Li, Y.; Yan, D. Quantitative analysis of eco-economic benefits of urban reclaimed water greening based on emergy theory. Water Resour. Manag. 2021, 35, 5029–5047. [Google Scholar] [CrossRef]
  39. Zhang, J.; Ma, L.; Yan, Y. A Dynamic comparison sustainability study of standard wastewater treatment system in the straw pulp papermaking process and printing & dyeing papermaking process based on the hybrid neural network and emergy framework. Water 2020, 12, 1781. [Google Scholar] [CrossRef]
  40. Winfrey, B.K.; Tilley, D.R. An emergy-based treatment sustainability index for evaluating waste treatment systems. J. Clean. Prod. 2016, 112, 4485–4496. [Google Scholar] [CrossRef]
  41. Grönlund, E.; Billgren, C.; Tonderski, K.; Raburu, P.O. Emergy assessment of a wastewater treatment pond system in the Lake Victoria Basin. J. Environ. Account. Manag. 2017, 5, 11–26. [Google Scholar] [CrossRef]
  42. Al-Raad, A.A.; Hanafiah, M.M. Removal of inorganic pollutants using electrocoagulation technology: A review of emerging applications and mechanisms. J. Environ. Manag. 2021, 300, 113696. [Google Scholar] [CrossRef]
  43. Odum, H.T. Environmental Accounting: Emergy and Environmental Decision Making; Wiley: New York, NY, USA, 1996; Volume 707. [Google Scholar]
  44. Björklund, J.; Geber, U.; Rydberg, T. Emergy analysis of municipal wastewater treatment and generation of electricity by digestion of sewage sludge. Resour. Conserv. Recycl. 2001, 31, 293–316. [Google Scholar] [CrossRef]
  45. Agostinho, F.; Diniz, G.; Siche, R.; Ortega, E. The use of emergy assessment and the Geographical Information System in the diagnosis of small family farms in Brazil. Ecol. Model. 2008, 210, 37–57. [Google Scholar] [CrossRef]
  46. Zhou, J.B.; Jiang, M.M.; Chen, B.; Chen, G.Q. Emergy evaluations for constructed wetland and conventional wastewater treatments. Commun. Nonlinear Sci. Numer. Simul. 2009, 14, 1781–1789. [Google Scholar] [CrossRef]
  47. Wang, L.K.; Hung, Y.-T.; Lo, H.H.; Yapijakis, C. Hazardous Industrial Waste Treatment; CRC Press: Boca Raton, FL, USA, 2006. [Google Scholar]
  48. Brown, M.T.; McClanahan, T.R. Emergy analysis perspectives of Thailand and Mekong River dam proposals. Ecol. Model. 1996, 91, 105–130. [Google Scholar] [CrossRef]
  49. Zhang, X.; Deng, S.; Wu, J.; Jiang, W. A sustainability analysis of a municipal sewage treatment ecosystem based on emergy. Ecol. Eng. 2010, 36, 685–696. [Google Scholar] [CrossRef]
  50. Chen, B.; Chen, G.Q.; Hao, F.H.; Yang, Z.F. The water resources assessment based on resource exergy for the mainstream Yellow River. Commun. Nonlinear Sci. Numer. Simul. 2009, 14, 331–344. [Google Scholar] [CrossRef]
  51. Grönlund, S.E. Indicators and methods to assess sustainability of wastewater sludge management in the perspective of two systems ecology models. Ecol. Indic. 2019, 100, 45–54. [Google Scholar] [CrossRef]
  52. Chen, D.; Luo, Z.; Webber, M.; Chen, J.; Wang, W. Emergy evaluation of the contribution of irrigation water, and its utilization, in three agricultural systems in China. Front. Earth Sci. 2014, 8, 325–337. [Google Scholar] [CrossRef]
  53. Giannetti, B.F.; Barrella, F.A.; Almeida, C.A. Combined tool for environmental scientists and decision makers: Ternary diagrams and emergy accounting. J. Clean. Prod. 2006, 14, 201–210. [Google Scholar] [CrossRef]
  54. Cano, N.A.; Céspedes-Zuluaga, S.; Guerrero-Martin, C.; Gallego, D. Exergy and emergy: Complementary tools for assessing the environmental sustainability use of biosolids generated in wastewater-treatment plant for energy-production. Quim. Nova. 2022, 45, 4–15. [Google Scholar] [CrossRef]
  55. Shao, S.; Mu, H.; Yang, F.; Zhang, Y.; Li, J. Application of emergy analysis to the sustainability evaluation of municipal wastewater treatment plants. Sustainability 2016, 9, 8. [Google Scholar] [CrossRef]
  56. Zhang, X.; Wei, Y.; Li, M.; Deng, S.; Wu, J.; Zhang, Y.; Xiao, H. Emergy evaluation of an integrated livestock wastewater treatment system. Resour. Conserv. Recycl. 2014, 92, 95–107. [Google Scholar] [CrossRef]
  57. Moss, A.R.; Lansing, S.A.; Tilley, D.R.; Klavon, K.H. Assessing the sustainability of small-scale anaerobic digestion systems with the introduction of the emergy efficiency index (EEI) and adjusted yield ratio (AYR). Ecol. Eng. 2014, 64, 391–407. [Google Scholar] [CrossRef]
  58. Theregowda, R.B.; González-Mejía, A.M.; Ma, X.; Garland, J. Nutrient recovery from municipal wastewater for sustainable food production systems: An alternative to traditional fertilizers. Environ. Eng. Sci. 2019, 36, 833–842. [Google Scholar] [CrossRef] [PubMed]
  59. Wang, C.; Liu, C.; Si, X.; Zhang, C.; Liu, F.; Yu, L.; Chen, G. Study on the choice of wastewater treatment process based on the emergy theory. Processes 2021, 9, 1648. [Google Scholar] [CrossRef]
  60. Geber, U.; Björklund, J. The relationship between ecosystem services and purchased input in Swedish wastewater treatment systems—A case study. Ecol. Eng. 2002, 19, 97–117. [Google Scholar] [CrossRef]
  61. Tilley, D.R.; Brown, M.T. Dynamic emergy accounting for assessing the environmental benefits of subtropical wetland stormwater management systems. Ecol. Model. 2006, 192, 327–361. [Google Scholar] [CrossRef]
  62. Qi, Y.; Zhang, X.; Yang, X.; Lv, Y.; Wu, J.; Lin, L.; Xiao, Y.; Qi, H.; Yu, X.; Zhang, Y. The environmental sustainability evaluation of an urban tap water treatment plant based on emergy. Ecol. Indic. 2018, 94, 28–38. [Google Scholar] [CrossRef]
  63. Sulca, L.; Paulino, C. Estimación de la Radiación Solar Global Mediante Temperaturas Extremas, Aplicando el Modelo Bristow–Campbell en la Región Pasco; Universidad Nacional Daniel Alcides Carrión: Cerro De Pasco, Peru, 2019. [Google Scholar]
  64. SENHAMI. Pronóstico de Cobertura Nacional del Indice de Radiación Solar Ultravioleta. 2016. Available online: https://www.senamhi.gob.pe/pdf/estudios/meteo_2016_pro_cob_nac_ind_rad_sol_ult.pdf (accessed on 19 October 2024).
  65. Mendoza Artica, E.Y. Potencial de la Energía Eólica para la Generación de Electricidad y su Relación con el Cambio Climático, en la Comunidad Campesina de Huaraucaca, Distrito de Tinyahuarco, Provincia de Pasco-2017; Daniel Alcides Carrión National University: Cerro de Pasco, Peru, 2018. [Google Scholar]
  66. MEM. Estudio de Impacto Ambiental del Proyecto “Línea de Transmisión 220 kV C.H. Chancay 2—C.H. Rucuy—S.E. Francoise. 2014. Available online: http://www.minem.gob.pe/minem/archivos/4_4_1ClimayMetRev0.pdf (accessed on 19 October 2024).
  67. Alania, V.; Orializ, Y. Caracterización Ambiental de Los Ecosistemas, Zonas de Vida y Vegetación Natural de la Provincia de Pasco; Universidad Nacional Daniel Alcides Carrión: Cerro De Pasco, Peru, 2019. [Google Scholar]
  68. Huiza, W.; Quispe, J. Evaluación de las Propiedades Físicas y Químicas del Suelo de los Tipos de Pastizal del Centro de Investigación de Camélidos Sudamericanos-LACHOCC. Tesis de Grado; Universidad Nacional de Huancavelica: Huancavelica, Peru, 2017. [Google Scholar]
  69. Bezuijen, A.; Pilarczyk, K.W. Geosintéticos en ingeniería hidráulica y costera: Filtros, revestimientos y estructuras llenas de arena. Ing. Civ. 2013, 171, 39–56. [Google Scholar]
  70. INGEMECANICA. Tablas de Pesos Específicos y Densidades de Materiales. 2020. Available online: https://ingemecanica.com/tutoriales/pesos.html#concreto (accessed on 19 October 2024).
  71. Wang, L.; Ni, W.; Li, Z. Emergy evaluation of combined heat and power plant eco-industrial park (CHP plant EIP). Resour. Conserv. Recycl. 2006, 48, 56–70. [Google Scholar] [CrossRef]
  72. Aceros Valval. Caracteristicas de Planchas de Aluminio. 2018. Available online: https://acerosvalval.cl/plancha-de-aluminio/ (accessed on 8 November 2020).
Figure 1. Location map of the study area.
Water 16 03081 g001
Figure 2. General scheme of Treatment I.
Water 16 03081 g002
Figure 3. General scheme of Treatment II.
Water 16 03081 g003
Figure 4. General scheme of Treatment IIIa (Lake Patarcocha) and Treatment IIIb (urban wastewater).
Water 16 03081 g004
Figure 5. Emergetic flowchart of Treatment I scenario.
Water 16 03081 g005
Figure 6. Emergetic flowchart of Treatment II scenario.
Water 16 03081 g006
Figure 7. Emergetic flowchart of Treatment IIIa and IIIb scenario.
Water 16 03081 g007
Figure 8. Scheme of electrocoagulation.
Water 16 03081 g008
Figure 9. Model of intermittent electrocoagulation system used in the research scenarios (a,b).
Water 16 03081 g009
Table 1. Characterization of urban wastewater and eutrophic Lake Patarcocha.
ParameterConcentration (mg/L)
Urban WastewaterEutrophic Lake Patarcocha
N: 8820489.96
E: 361900.75
N: 8818441.49
E: 363081.15
1BOD5151.2066.50
2COD255.50111.30
4Total phosphorus8.505.46
5Sulfates1542.8-
6pH5.78.81
7Nitrate20.951.66
8Turbidez3.6-
9Ammonia nitrogen-1.30
10
11
Notes: N and E: Universal Transverse Mercator coordinates, north and east, respectively; N°: parameter number.
Table 2. Characterization of AW of Lake Quiulacocha.
N: 8820489.96
E: 361900.75
AW from the Contaminated Lake Quiulacocha
Parameter Concentration (mg/L)Parameter Concentration (mg/L)Parameter Concentration (mg/L)
1Sulfate 6000.0013Total cadmium0.000124Total nickel0.001
2pH1.8014Total calcium284.8125Total silver0.005
4Total iron1316.6515Total cesium 0.0226Total potassium8.19
5Total zinc1.0216Total cobalt0.00227Total selenium0.001
6Total copper2.6917Total chromium0.000328Total silica22
7Total lead335.8718Total phosphorus4.629Total sodium20.39
8Total arsenic0.00219Total lithium0.1230Total titanium0.0007
9Total aluminum19.5920Total magnesium1023.7231Total uranium0.005
10Total barium0.000221Total manganese498.9432Total vanadium0.0002
11Total bismuth0.00922Total mercury0.001
12Total boron0.00223Total molybdenum0.001
Notes: N and E: Universal Transverse Mercator coordinates, north and east, respectively; N°: parameter number.
Table 3. Emergy Sustainability Index: description, functionality, and associated formulas.
IndexDescriptionFormulaAcceptability RangeReferences
Net Emergy Yield Ratio (EYR)Measures the efficiency with which the system transforms inputs into outputs. A higher value indicates that the system produces significantly more emergy than it invests, which is desirable in sustainable processes.EYR = (Total Emergy Used)/(Imported Emergy)>1 is acceptable. Higher values indicate a more efficient system.[35,37]
Emergy Investment Ratio (EIR)This index measures the system’s dependence on imported emergy compared to local emergy. A high value indicates greater dependence on external inputs, while a low value suggests a self-sufficient or efficient system in using local resources.EIR = (Imported Emergy)/(Local Emergy)A low value is favorable, preferably close to 1. A high EIR reflects a high dependence on external inputs.[34]
Environmental Loading Ratio (ELR)Compares the use of renewable resources with non-renewable and imported ones. A low value indicates that the system is more environmentally friendly, relying primarily on renewable resources, while a high value suggests greater environmental pressure due to reliance on non-renewable or imported inputs.ELR = (Non-renewable Emergy + Imported Emergy)/(Renewable Emergy)A low value (<2) is ideal, reflecting lower environmental pressure. High values (>5) indicate high dependence on non-renewable resources.[40]
Sustainability Index (SI)The sustainability index is a ratio between the system’s efficiency (EYR) and its environmental impact (ELR). A high value indicates that the system is both efficient and sustainable, while a low value reflects unsustainability due to high environmental impact compared to emergy production efficiency.SI = EYR/ELRValues above 1 indicate a sustainable system. Low values (<1) indicate unsustainable processes.[41]
Table 4. Emergy analysis of the different treatment scenarios.
ItemDescriptionQuantitiesUnitsSolar Transfomicity (sej/year)ReferencesEmergy
Scenario IScenario IIScenario IIIaScenario IIIbScenario IScenario IIScenario IIIaScenario IIIb
Renewable resources
Construction and operation stage
1Sunlight5.64 × 10127.52 × 10128.27 × 10128.27 × 1012J1[43]5.64 × 10127.52 × 10128.27 × 10128.27 × 1012
2Wind, kinetic5.45 × 1077.27 × 1078.00 × 1078.00 × 107J6.23 × 102[43]3.40 × 10104.53 × 10104.98 × 10104.98 × 1010
3Rainfall, geopotential 1.50 × 10102.00 × 10102.20 × 10102.20 × 1010J8.89 × 103[43]1.33 × 10141.78 × 10141.96 × 10141.96 × 1014
4Chemical rain 1.62 × 10102.16 × 10102.38 × 10102.38 × 1010J1.54 × 104[43]2.51 × 10143.34 × 10143.67 × 10143.67 × 1014
5Earth cycle 8.25 × 1081.10 × 1091.21 × 1091.21 × 109J5.80 × 104[43]4.79 × 10136.38 × 10137.02 × 10137.02 × 1013
6Urban wastewater (eutrophic)6.88 × 10126.88 × 10126.88 × 10122.99 × 1012J3.76 × 106[44]2.59 × 10192.59 × 10192.59 × 10191.12 × 1019
Non-renewable system resources
Construction and operation stage
7Loss of soil1.12 × 1091.29 × 1091.55 × 1091.55 × 109g1.24 × 105[45]1.39 × 10141.59 × 10141.92 × 10141.92 × 1014
8AW2.60 × 10122.60 × 10122.60 × 10121.30 × 1012J3.76 × 106[44]9.79 × 10189.79 × 10189.79 × 10184.90 × 1018
Imports
Construction stage operation and maintenance
9PVC pipes for wastewater1.37 × 1071.72 × 1073.00 × 1073.35 × 107g5.87 × 109[44]8.01 × 10161.01 × 10171.76 × 10171.97 × 1017
10Geotextile1.93 × 1012.78 × 1013.42 × 1013.42 × 101J1.11 × 105[46]2.14 × 1063.09 × 1063.80 × 1063.80 × 106
11Concrete5.14 × 1075.57 × 1076.22 × 1076.22 × 107g7.05 × 109[47]3.62 × 10173.93 × 10174.39 × 10174.39 × 1017
12Fuel2.85 × 10105.87 × 10107.65 × 10107.65 × 1010J1.11 × 105[46]3.16 × 10156.52 × 10158.49 × 10158.49 × 1015
13Steel grids3.30 × 1034.40 × 1034.84 × 1034.84 × 103g4.13 × 109[48]1.36 × 10131.82 × 10132.00 × 10132.00 × 1013
14Metals (Aluminum) 1.32 × 1051.32 × 105g1.00 × 109[43] 1.32 × 10141.32 × 1014
15Gravel (Zeolite) 9.88 × 10⁵ g1.00 × 109[46] 9.88 × 10¹⁴
16Phytoremediation 8.65 × 10⁵ $8.70 × 101[36] 7.53 × 10⁷
17Machinery rental service 9.56 × 1042.58 × 1054.65 × 1054.65 × 105$3.38 × 10¹²[49]3.23 × 10178.72 × 10171.57 × 10181.57 × 1018
18Material rental service1.45 × 1053.93 × 1057.07 × 1057.07 × 105$3.30 × 10¹²[50]4.80 × 10171.30 × 10182.33 × 10182.33 × 1018
19Construction labor service3.45 × 1046.21 × 1041.12 × 1051.12 × 105$3.38 × 10¹²[49]1.17 × 10172.10 × 10173.78 × 10173.78 × 1017
20Labor service for operation1.12 × 1052.02 × 1053.64 × 1053.64 × 105$3.38 × 10¹²[51]3.79 × 10176.83 × 10171.23 × 10181.23 × 1018
21Maintenance and operation service 2.03 × 1043.65 × 1055.47 × 1045.47 × 104$3.46 × 10¹²[47]7.01 × 10161.26 × 10171.89 × 10171.89 × 1017
22Energy flow in the electrodes 1.13 × 10131.13 × 1013J1.11 × 105[46] 1.25 × 10181.25 × 1018
Exports+
23Treated wastewater1.55 × 10121.55 × 10121.55 × 10121.55 × 1012J1.92 × 107[50]2.97 × 10192.97 × 10192.97 × 10192.97 × 1019
Table 5. Emergy indicators.
Study ScenariosNet Yield Ratio
(EYR)
Emergy Inversion Ratio
(EIR)
Environmental Loading Ratio (ELR)Sustainability Index
(SI)
Treatment I15.260.050.4533.99
Treatment II10.670.100.5220.48
Treatment IIIa5.090.180.628.17
Treatment IIIb2.820.551.222.31
Disclaimer/Publisher’s Note: The statements, opinions and data contained in all publications are solely those of the individual author(s) and contributor(s) and not of MDPI and/or the editor(s). MDPI and/or the editor(s) disclaim responsibility for any injury to people or property resulting from any ideas, methods, instructions or products referred to in the content.

