Article

Variability of Dry Days and Sequences of Dry Days in the Polish Carpathians in the Period 1986–2020

1
Faculty of Environmental and Power Engineering, Cracow University of Technology, ul. Warszawska 24, 31-155 Kraków, Poland
2
Faculty of Geography and Geology, Jagiellonian University, ul. Gronostajowa 7, 30-387 Kraków, Poland
*
Author to whom correspondence should be addressed.
Water 2024, 16(20), 2982; https://doi.org/10.3390/w16202982
Submission received: 19 July 2024 / Revised: 9 September 2024 / Accepted: 17 October 2024 / Published: 19 October 2024

Abstract

:
This study provides a climatological analysis of annual and long-term variability of dry days and sequences of dry days in the Polish Carpathians between 1986 and 2020. The input data for the research was compiled from the daily precipitation totals from 17 meteorological stations and the T. Niedźwiedź catalogue of circulation types over southern Poland. The frequency of sequences of dry days of different duration has been presented. The incidence of long-term periods has been related to the atmospheric circulation. The number of dry days and the averages of both the number and of the duration of sequences of dry days were analysed for the study period. This yielded an average annual number of dry days ranging from 142 to 195 (39–53% of days in a year), depending on the altitude above sea level and longitude. A general pattern emerged in which the number of dry days increased from west to east. At most stations, there were no statistically significant trends with respect to the dry day characteristics analysed. This is an obvious result of high year-to-year variability, which means that only large changes can achieve statistical significance. Dry days have been evidenced to relate to circulation types. The vast majority of dry days are related to anticyclonic systems, particularly the anticyclonic wedge (Ka) and western anticyclonic (Wa) situations. On the other hand, no clear-cut relationship was established between an increase in air temperature and the occurrence of dry days.

Graphical Abstract

1. Introduction

Precipitation plays an important role in the environmental water circulation system. In natural conditions, it can cause extreme phenomena: drought in the event of absence of precipitation, or flood in the case of excessive amounts. As rightly pointed out by Şen [1], water management depends on the occurrence of wet and dry periods in an alternating manner. Therefore, information about the statistical characteristics of their incidence, as underscored by the abovementioned author, provides the data most needed for optimal and sustainable work oriented at water demand.
Differently from days with precipitation, days with no precipitation constitute an inherent characteristic of the climate in many areas. In the temperate climate zone where Poland is located, such days show high variability both in the annual cycle and on a year-to-year basis (e.g., [2]), which is an obvious consequence of the high variability of atmospheric circulation [3]. Polar, arctic, and tropical air masses flowing over the area, extremely different in both their thermal and humidity characteristics and either maritime or continental properties, may cause long-term conditions with an absence of precipitation, causing acute droughts [4,5,6,7].
The occurrence of periods with no precipitation has many harmful effects on the population, including on water security and agriculture. As evidenced by many researchers [8,9,10], an understanding of changes in their duration and in the annual cycle is necessary to control droughts, a phenomenon that may pose a threat to food production and increase the risk of fires. Long-lasting shortage of precipitation may cause the development of atmospheric (meteorological) drought that negatively affects vegetation, both in its quantity and the quality of the harvest [11,12]. Periods with no precipitation or periods with poor rain with a rainfall total significantly lower than standard, often contribute to the development of further phases of drought, including soil drought or even hydrological drought, resulting in a water deficit in rivers [13].
The incidence of periods with no precipitation and dry spells in large areas correlates well with the macro-scale circulation [14,15,16], whereas in smaller areas, it depends on local conditions [17]. The vast number of studies conducted worldwide on the frequency and trends related to changes in dry periods in areas of various spatial and time scales testifies to the im-portance of this research. Such research also examines many areas in Europe [18,19], particularly in the Mediterranean zone [20], including Italy [21], the Iberian Peninsula [22,23] and Croatia [24,25].
The authors of these studies focus primarily on the occurrence of dry spells in different climatic zones. On the other hand, dry days, and especially sequences of such days and their dependency on atmospheric circulation, are seldom the topic of research. This classic approach allows one to obtain a preliminary understanding of the kinds of conditions that lead to atmospheric droughts, the study of which requires the adoption of a strict set of criteria.
This study aims at a climatologic analysis of the frequency of dry days and sequences of dry days and their long-term variability in the Polish Carpathians across the 35-year period between 1986 and 2020. The incidence of dry days and long-term periods with no precipitation over southern Poland has been related to atmospheric circulation types by Niedźwiedź [26]. This study focuses on analysing days with no precipitation since the mid-1980s, namely in the period with a strong increase in air temperature [27]. The study comprises three parts. The starting point of the research is provided by the characteristics of the dry days (Section 3.1). Next, the analysis covers sequences of dry days (Section 3.2). The last part (Section 3.3) presents the correlation between the incidence of dry days and circulation conditions.

2. Data and Methods

The input material for the research involved daily totals of atmospheric precipita-tion from 17 meteorological stations located in the Polish Carpathians over the period 1986–2020 (Figure 1). These stations provided measurements of precipitation that were entirely complete and coherent in the aspects of the instrument, place and time of observation. The data have been acquired from the Polish meteorological service, i.e., the Institute of Meteorology and Water Management—National Research Institute (IMGW-PIB).
The Polish Carpathians form an area of varied orography, with differences in landforms over an altitude range of approximately 2000 m. The lowest measurement point included in the study is Skoczów: 286 m a.s.l., while the highest is Kasprowy Wierch: 1991 m a.s.l. The area is located within the range of the mountain climate regime, with annual precipitation of over 900 mm [28]. This is the origin of many mountain creeks and rivers which, downstream, feed the largest river in Poland, the Vistula, and provide the main source of water supply not only to the local community, but even more significantly to the population in the vicinity of the Carpathians.
In the first phase of the study, all dry days were identified on the basis of the da-tabase of daily precipitation totals, as well as sequences of dry days in each year of the 35-year period. A dry sequence means here a sequence of days (at least 2 days) without any precipitation. In the Polish meteorological service, a day with precipitation is a day where the total rainfall amounts to at least 0.1 mm. A sequence of dry days begins and ends on the day with no precipitation. Such climatologic approach to the analyse periods with no precipitation has already been applied by many authors (e.g., [2,24]).
The basic statistical characteristics of dry days and sequences have been described and presented graphically using box and whisker plots as well as mean and standard error of the mean (SEM) diagrams. Later, the frequency of sequences of dry days of various duration has been presented, including the longest periods at particular stations. In the analysis of long-term changes, two characteristics of dry sequences have been considered, namely their quantity and average length. The analyses of trends regarding changes to the dry days, the number of dry day sequences, and the mean length of the sequences with no precipitation in the 35-year period between 1986 and 2020, have been conducted using the non-parametric Mann–Kendall (MK) test [29,30,31,32]. The statistics of the Mann–Kendall test are calculated as follows:
S = k = 1 n - 1 j = k + 1 n sign   ( x j   x k )
where: n—number of data entries.
s i g n x j   x k = 1   dla   x j   x k > 0 0   dla   x j   x k = 0 1   dla   x j   x k < 0
The standardized MK test statistics (Z) can be estimated as follows:
Z = S 1 V S   i f   S > 0 0             i f   S = 0 S + 1 V S     i f   S < 0
where: V(S)—the variance of S:
V S = n n 1 2 n + 5 t = 1 p t i t i 1 2 t i + 5 18
where: n is the number of data points
The statistic S is closely related to Kendall’s as given by:
τ = S D
D = 0.5 n n 1 0.5 j = 1 p t j t j 1 1 / 2 · 0.5 n n 1 1 / 2
where: p is the number of the tied groups in the data set and tj is the number of data points in the jth tied group. A positive value of S indicates an ‘upward trend’ and a negative value indicates a ‘downward trend’. S = 0 indicates no trend.
Linear regression analysis was used to compute the coefficient of determination (R2) and the coefficient of linear regression (slope). The analysis of atmospheric circulation occurring during dry days was performed using the calendar of atmospheric circulation types over southern Poland assembled by Niedźwiedź [26,33]. The choice of a right classification of atmospheric circulation tends to be crucial in synoptic climatological research. Meso-scale classifications, produced for small areas, are the most useful in explaining the reasons for the variability of the various climate components at a local scale. Indeed, with the same circulation type the weather in small areas can be influenced by different meso-scale circulation processes. With this approach, the kinds of relationships between circulation and given climate components are exposed more clearly [34]. This was very convincingly demonstrated by the research on the relationship between the occurrence of dry days in Kraków with such circulation types in 1874–1993 [2]. Major elements of circulation types isolated by Niedźwiedź [26,33] include the direction of advection or absence thereof, and the type of the baric system. In total, Niedźwiedź classified 20 circulation types. To make the distinction easy, the universally applied lettermarks were introduced to determine the direction of advection with the index “a” for anticyclonic, and “c” for cyclonic types:
Na, Nc—Types with an advection of air masses from the north;
NEa, NEc —Types with an advection of air masses from the northeast;
Ea, Ec—Types with an advection of air masses from the east;
SEa, SEc—Types with an advection of air masses from the southeast;
Sa, Sc—Types with an advection of air masses from the south;
SWa, SWc—Types with an advection of air masses from the southwest;
Wa, Wc—Types with an advection of air masses from the west;
NWa, NWc—Types with an advection of air masses from the northwest;
Ca —Central anticyclonic situation;
Ka —Anticyclonic wedge;
Cc —Central cyclonic situation;
Bc—Cyclonic trough;
X—Marks those situations which cannot be classified.

3. Results

3.1. Annual Total of Dry Days

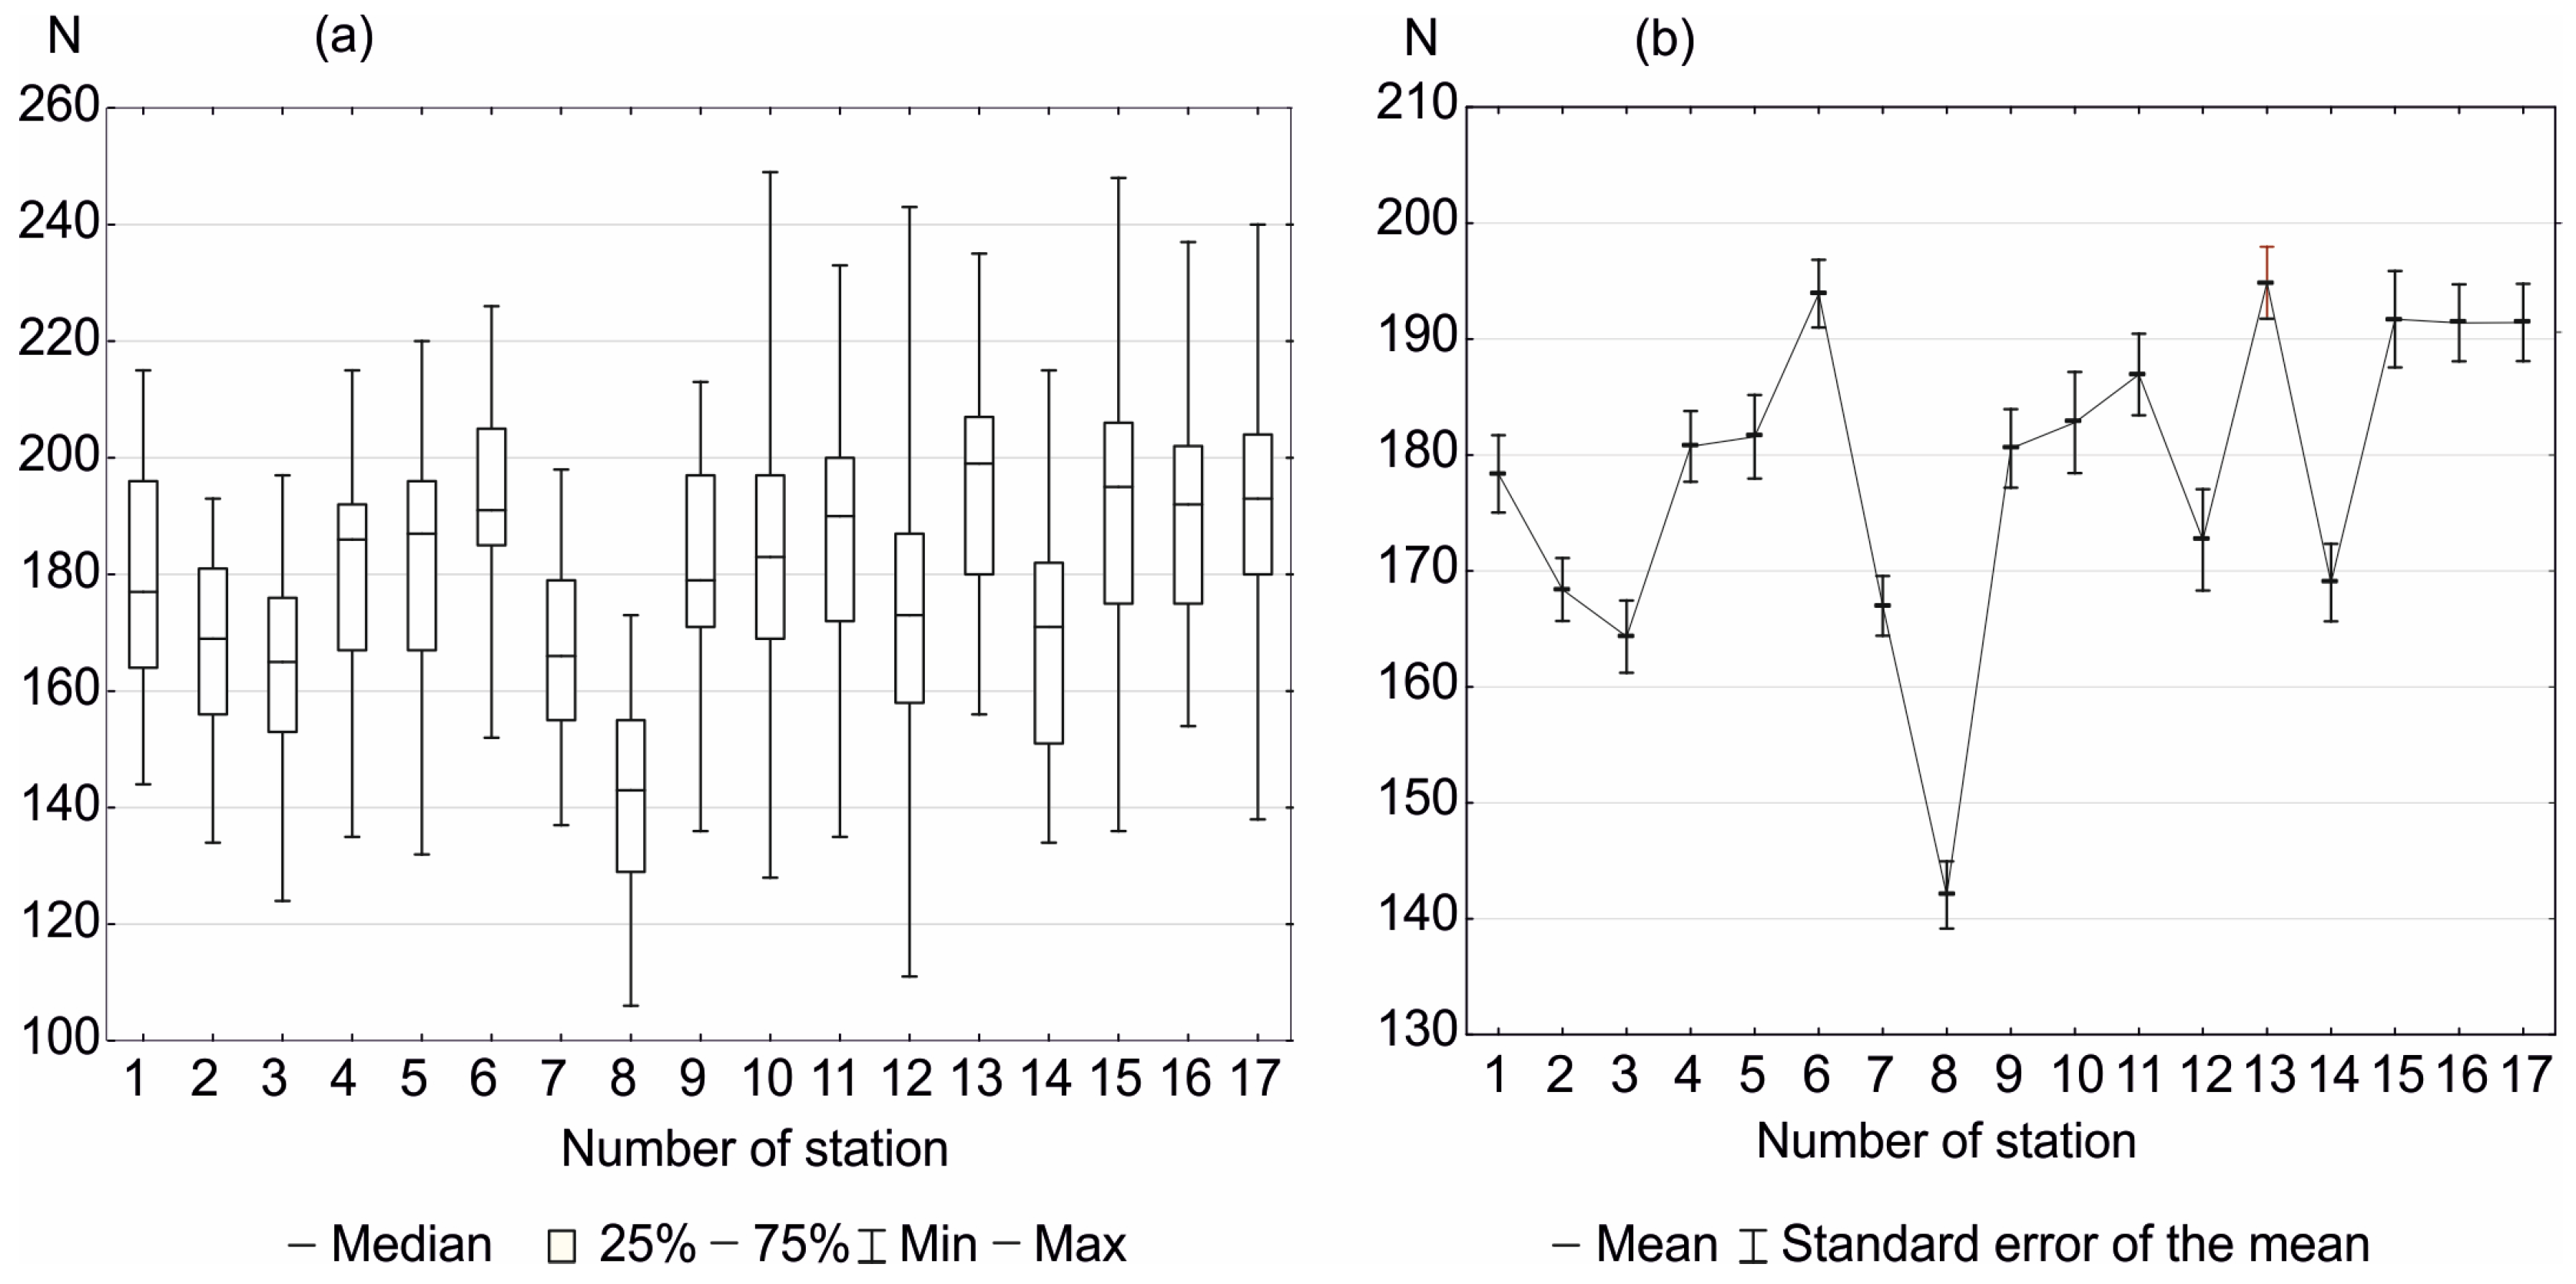
The annual total of dry days in the 35-year period from 1986 to 2020 analysed shows great variability at individual stations due to various statistical characteristics (Figure 2). The average number of dry days ranges from 142 at Kasprowy Wierch to 195 days in Gorlice, which corresponds to 39% and 53% days per year, respectively (Figure 2a). One can observe general regularity in the increase in the total number of dry days from the west towards the east, which is an obvious consequence of the increasing degree of climate continentalisation. The exception is formed exclusively by the high-mountain station on Kasprowy Wierch [8], where—due to its situation at an altitude of 1991 m a.s.l.—there are the fewest days with no precipitation. In the western part of the Polish Carpathians, the observed lower total of dry days is a result of the impact of moisture-carrying western winds causing an increase in precipitation frequency as well as quantity compared with the eastern part [28]. This is an obvious consequence of the prevalence of western circulation in the temperate zone bringing in humid air from the Atlantic.
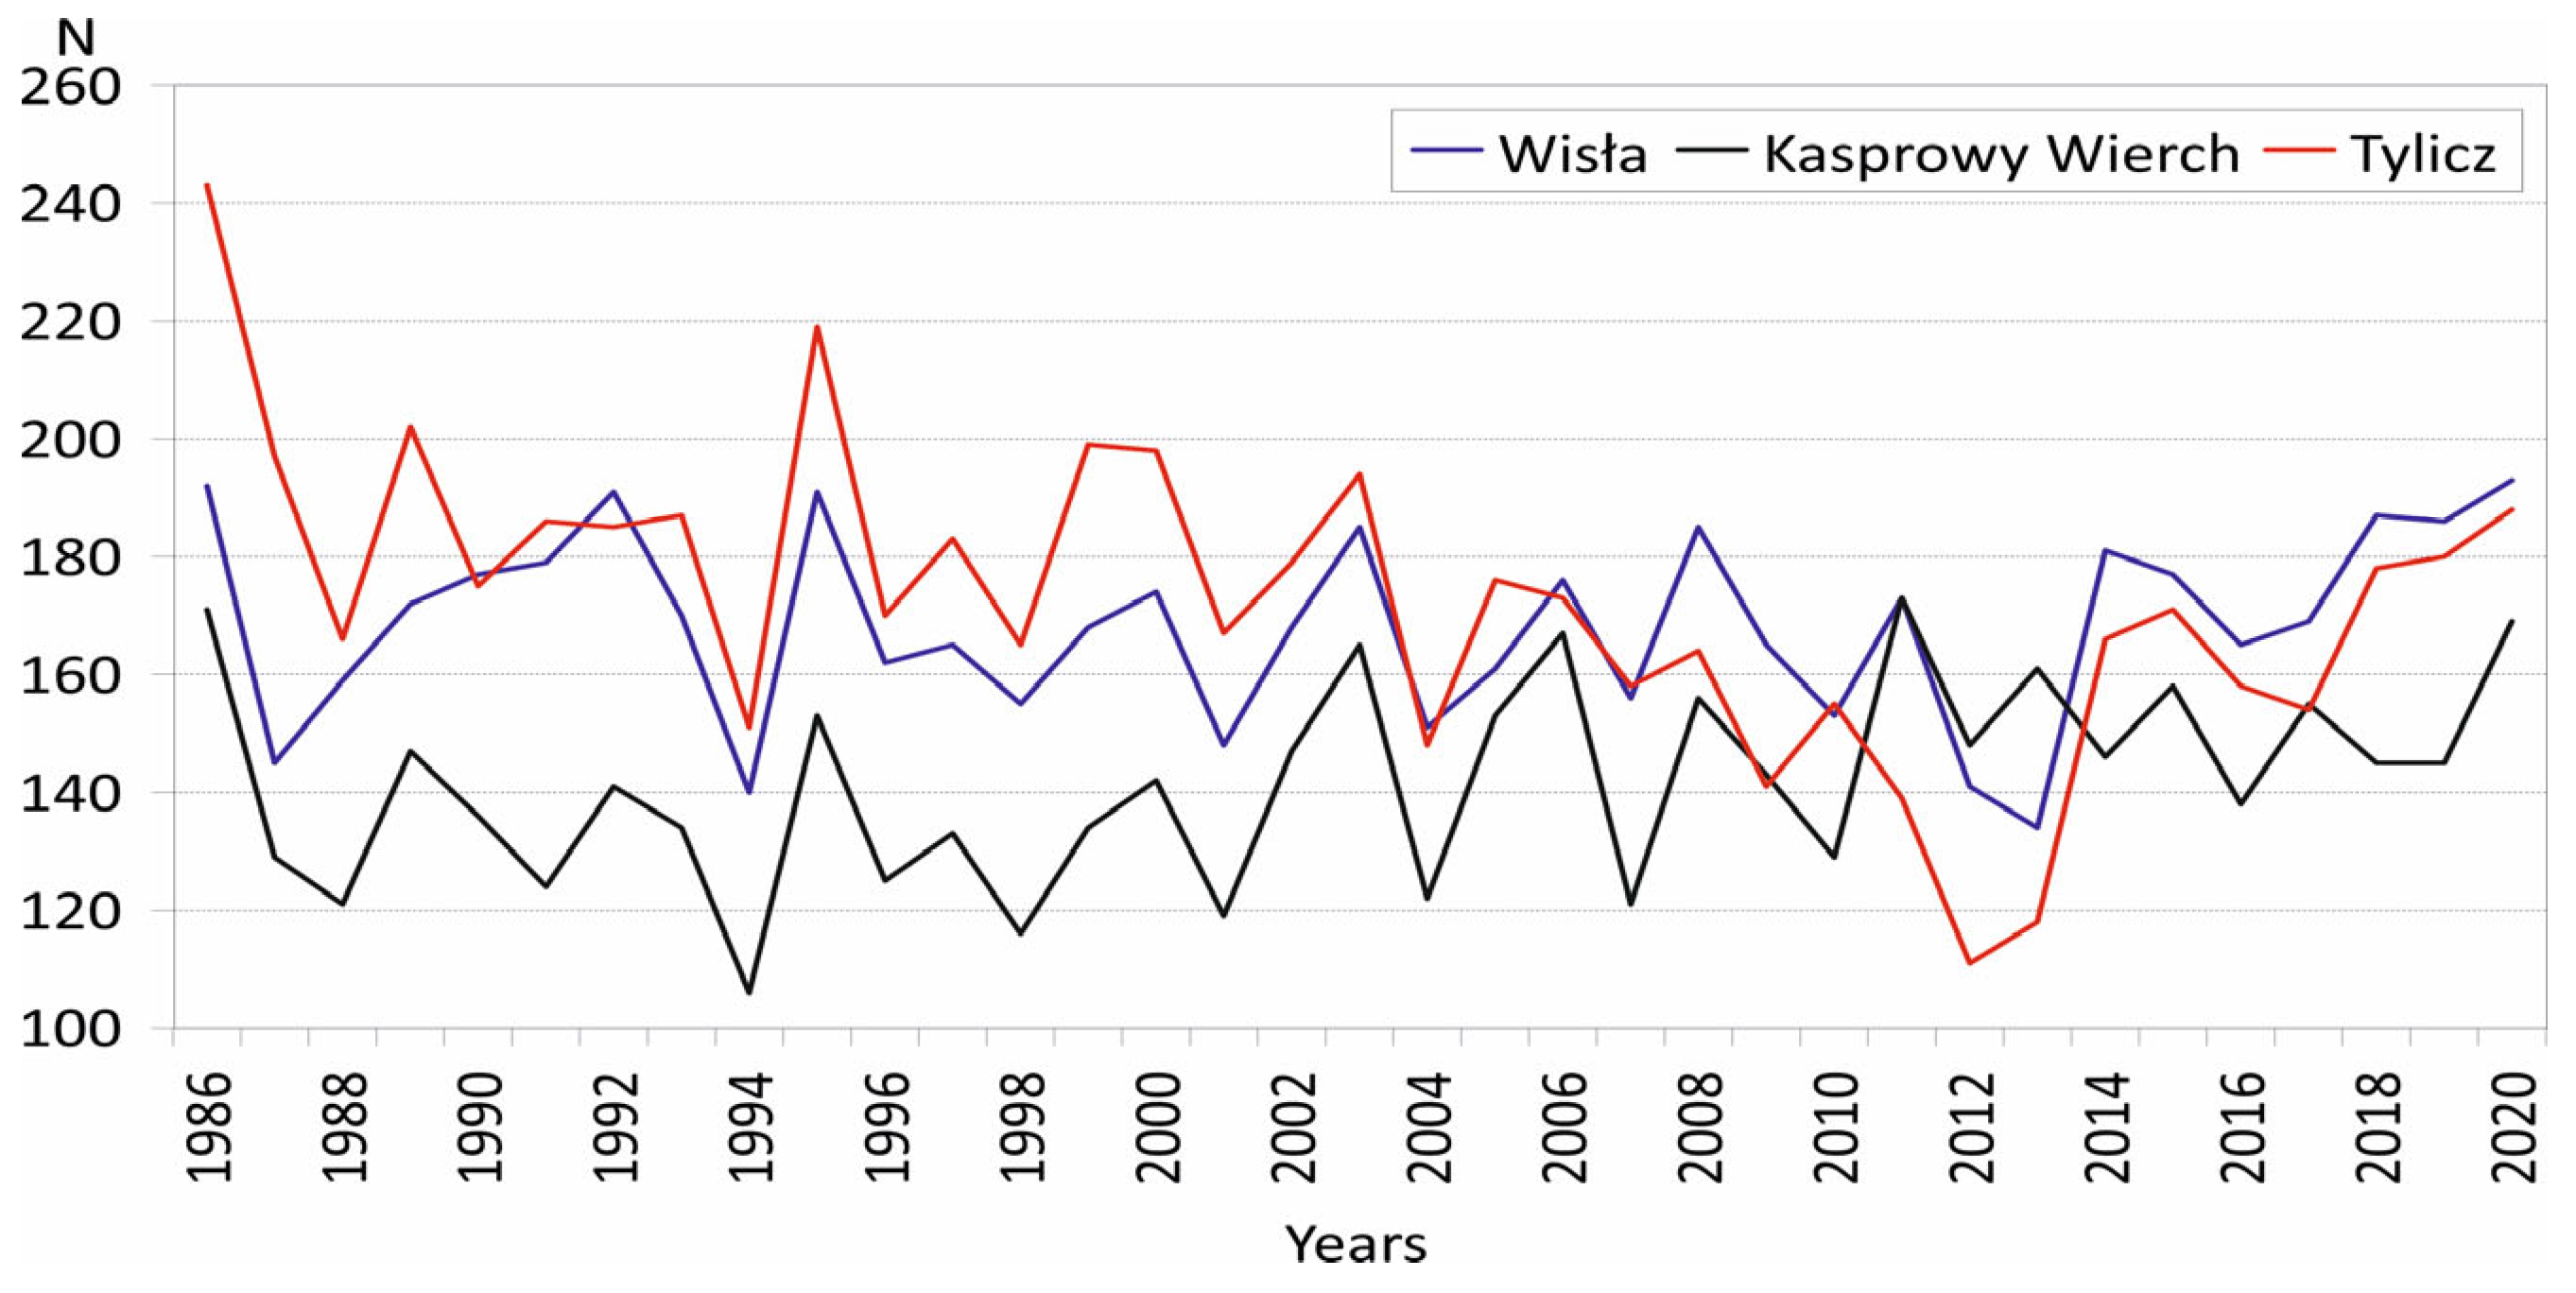
From analysis of the box and whisker plot (Figure 2b), one can state that the range of annual variability in the annual total of dry days, namely the difference between the maximum and minimum annual total, falls between 60 in Wisła (from 135 days in 2013 to 193 in 2020) and 132 days in Tylicz (from 111 in 2012 to 243 in 1986). The year-to-year variability in the annual total of dry days was illustrated for the stations in Wisła and Tylicz, and the high-mountain station at Kasprowy Wierch (Figure 3). This confirms their great variability over the 35-year period. A record number of dry days occurred at all stations in 1986: from 171 at Kasprowy Wierch to 243 days in Tylicz. Slightly fewer were recorded in 1995: from 153 at Kasprowy Wierch to 219 in Tylicz. Such a conformity regarding the incidence of the greatest number of dry days testifies to similar circulatory conditions over the entire area of the Polish Carpathians. The lowest number of dry days occurred at various times at individual stations, e.g., this was 106 days at Kasprowy Wierch in 1994, 111 days in Tylicz in 2012, and 134 days in Wisła in 2013 (Figure 3). This is manifested as a different degree of consistency in the long-term course of dry days. So, for example, the correlation coefficient of such values totalled from 0.145 (Wisła-Kasprowy Wierch) to 0.628 (Wisła-Tylicz), which means just 2% common variance in the earlier case, and as much as 40% in the latter case. Such a result may testify to the impact of geographic factors on the occurrence of dry days.
There were significant statistical trends regarding changes to the total number of dry days at fewer than half the stations. This is an obvious result of the high year-to-year variability, which means that only large changes can achieve statistical significance. At five stations, a statistically significant trend (at various levels) was identified regarding the annual total number of dry days (Table 1). At four stations, the trend was negative, while at one station (Kasprowy Wierch) it was positive. An increase in the dry day total at Kasprowy Wierch began starting from 1994 (Figure 3), whereas at the remaining stations, it remains visible in the last decade.

3.2. Sequences of Dry Days

In the 35-year study period, dry days occurred both on individual days and in se-quences, namely consecutive days without precipitation, at all stations (Figure 4). The share of single dry days in the total number of dry days at all stations is small, which is due to a higher frequency of precipitation in the mountainous area; from 10.7% in Szczawne to 17.8% at Kasprowy Wierch. Thus, dry days occur more frequently in sequences (Figure 4): from 82% at Kasprowy Wierch to 89% in Szczawne.
Dry sequences of 2–7 days clearly stand out. At almost every station, over 1000 of these sequences were recorded in the period 1986–2020, whereas at two stations (Raba Wyżna, Gorlice)—over 1200 dry day sequences (Table 2) were noted. At most stations, the dry day total in such sequences exceeded 60%. Among the sequences of 2–7 dry days, the most frequent were the sequences of 2 days: from 778 in Wisłok Wielki to 964 in Tylicz. Only three stations, namely Bogdanówka, Węglówka, and Półrzeczki, had a number of 3-day sequences with no precipitation exceeding the quantity of 2-day sequences. Their total at individual stations decreases together with sequence length. Sequences with no precipitation lasting from 8 to 14 days occur, on average, with 10-fold lower frequency (Table 2). Longer sequences of dry days (15–21 days) are very rare: from 7 cases at stations in the westernmost part of the Polish Carpathians to 25 cases in the southeastern part thereof (Table 2), and they usually cover the entire area, which is an obvious con-sequence of stable circulation conditions affected by anticyclonic systems over Central and Eastern Europe. Special attention must be given to sequences of dry days lasting for at least 3 weeks due to the risk of drought, not only meteorological drought, but also agricultural, and even hydrological drought. In the period of 35 years analysed, such extreme weather conditions occurred four times in the study area, most frequently in the eastern part, thus in the more continental area. Among such long dry sequences, the one occurring in November 2011, which covered almost the entire area, stands out. It first appeared at some stations as early as on 21 October and ended at the latest on 4 December. Such long sequences with no precipitation do not occur at stations located above 1000 m a.s.l., as also pointed out by Obrębska-Starkel et al. [28].
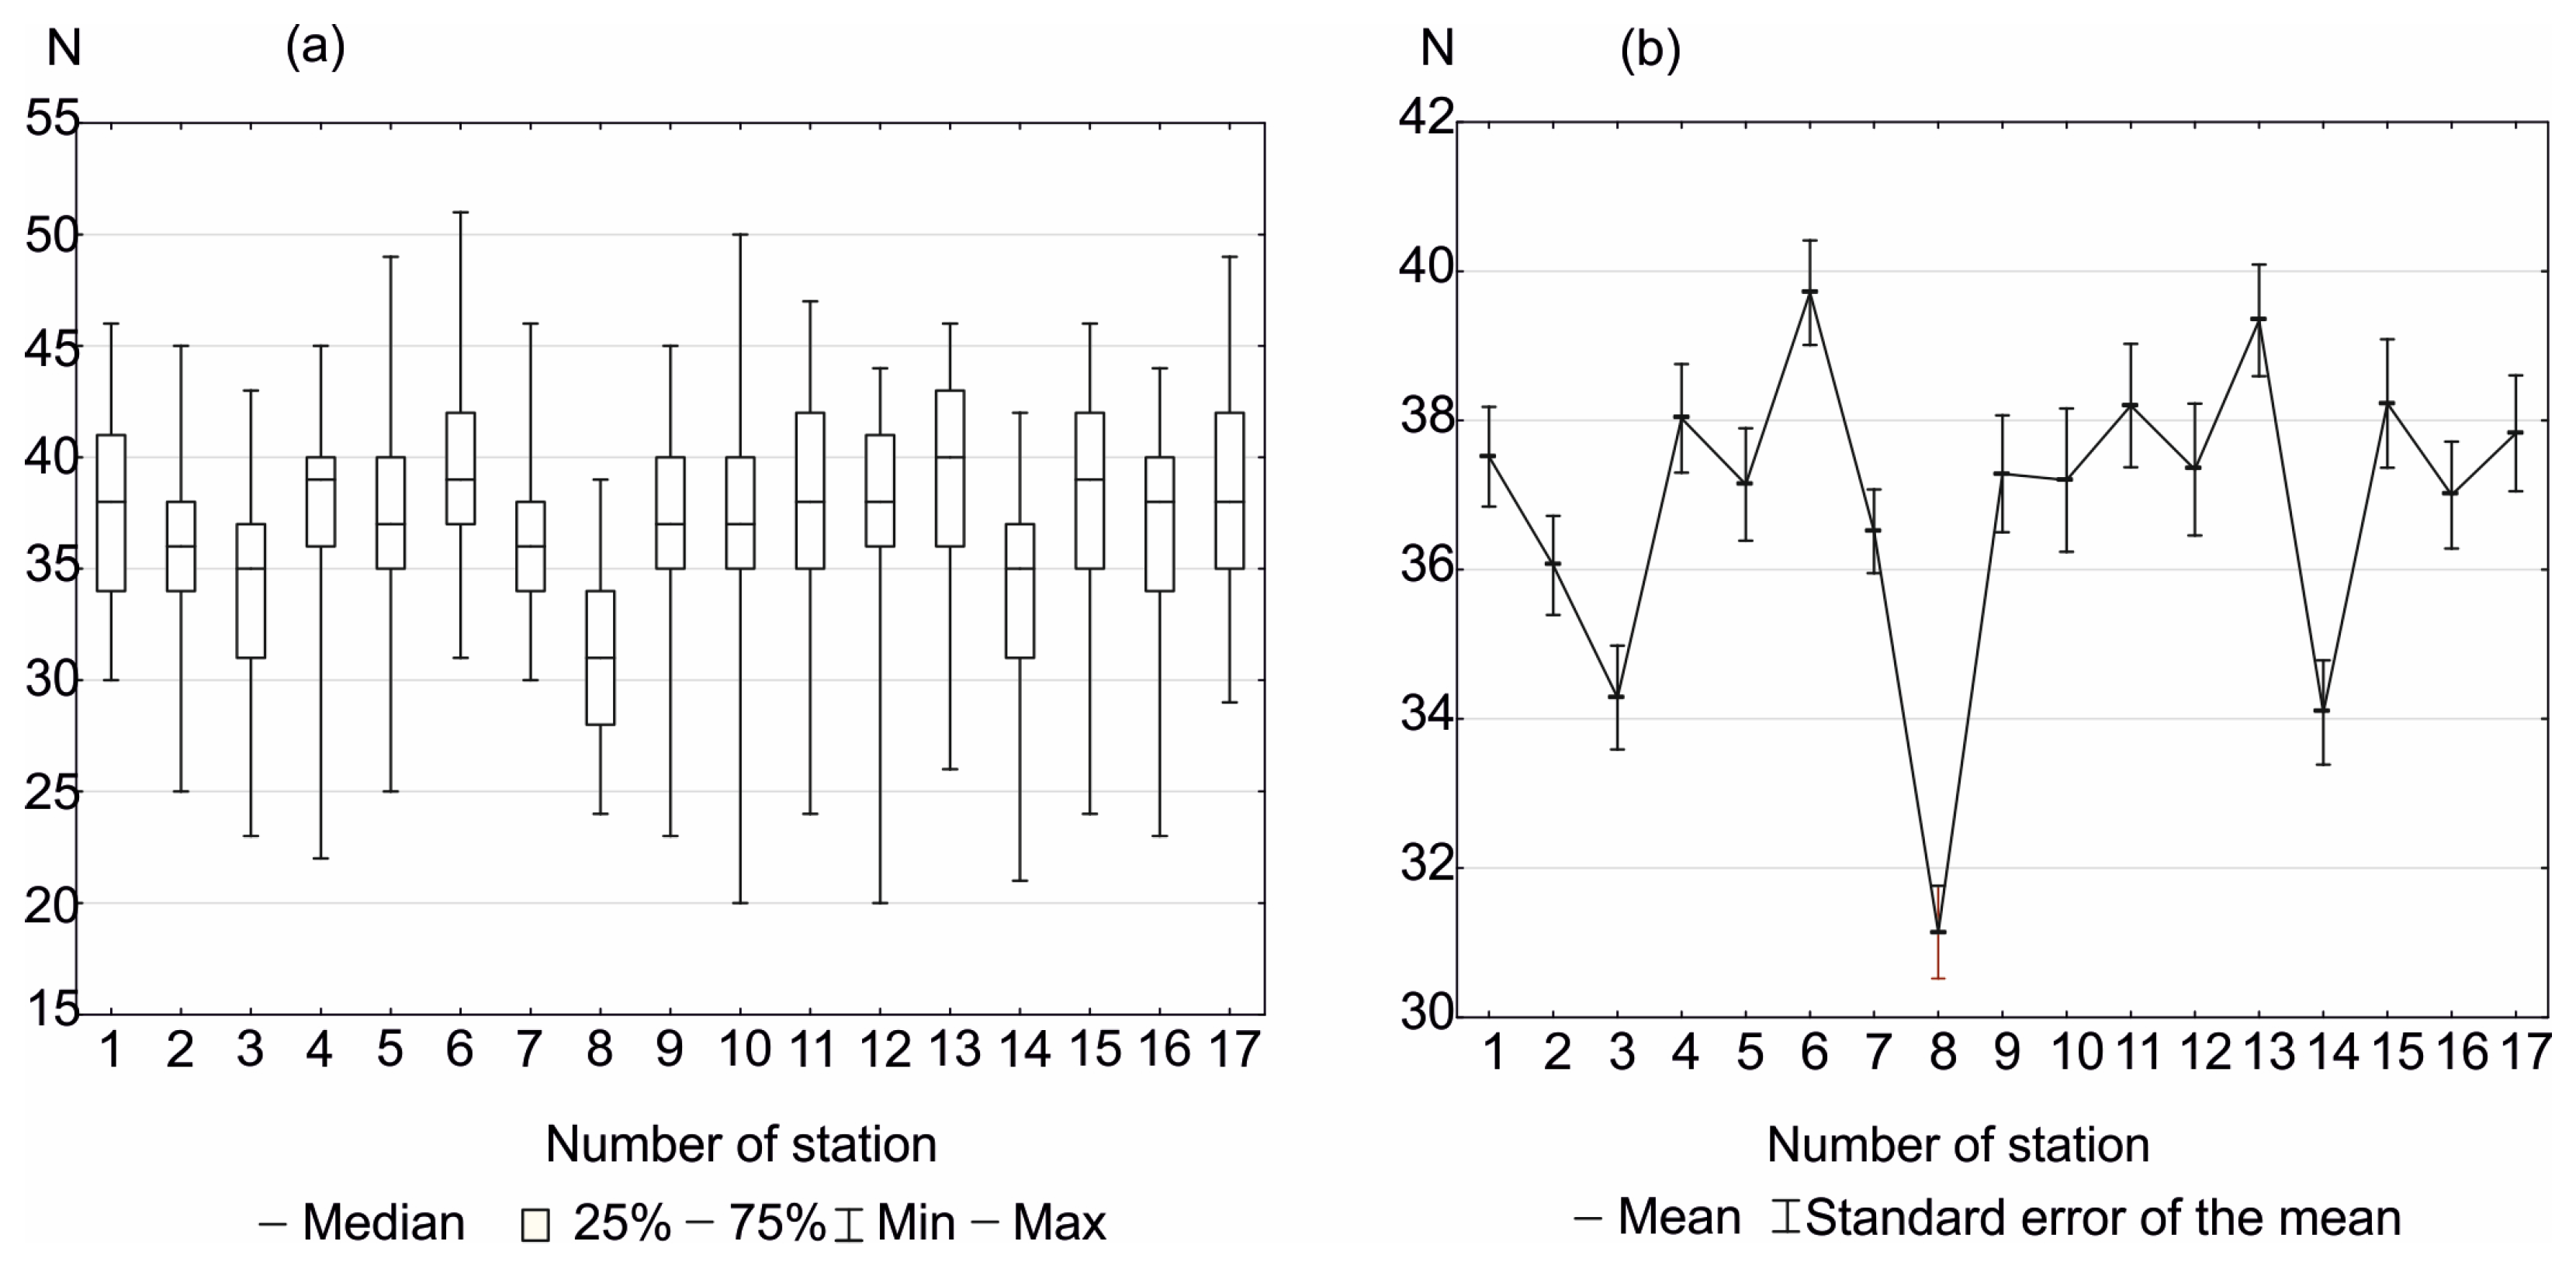
The annual total of sequences of days with no precipitation (Figure 5a) at individual stations shows high variability, similar to the total number of dry days (Figure 2). Their number at the stations varies from 20 sequences in 2013 in Białka Tatrzańska and Tylicz to 51 sequences in 1986 in Raba Wyżna (Figure 5a). The average numbers of such sequences range from 31 at Kasprowy Wierch to 39.7 per year at Raba Wyżna (Figure 5b).
As illustrated in Figure 6, the annual average length of dry day sequences in particular years varies significantly at individual stations. The lowest average length of the se-quence was 3 days in Tylicz (2004) and Kasprowy Wierch (1991), whereas the highest was 6–7 days in Białka Tatrzańska in 2013 (Figure 6a). In general, it can be stated that the average length of a dry sequence increases from the west towards the east and thus in line with the increasingly continental character of the climate (Figure 6b).
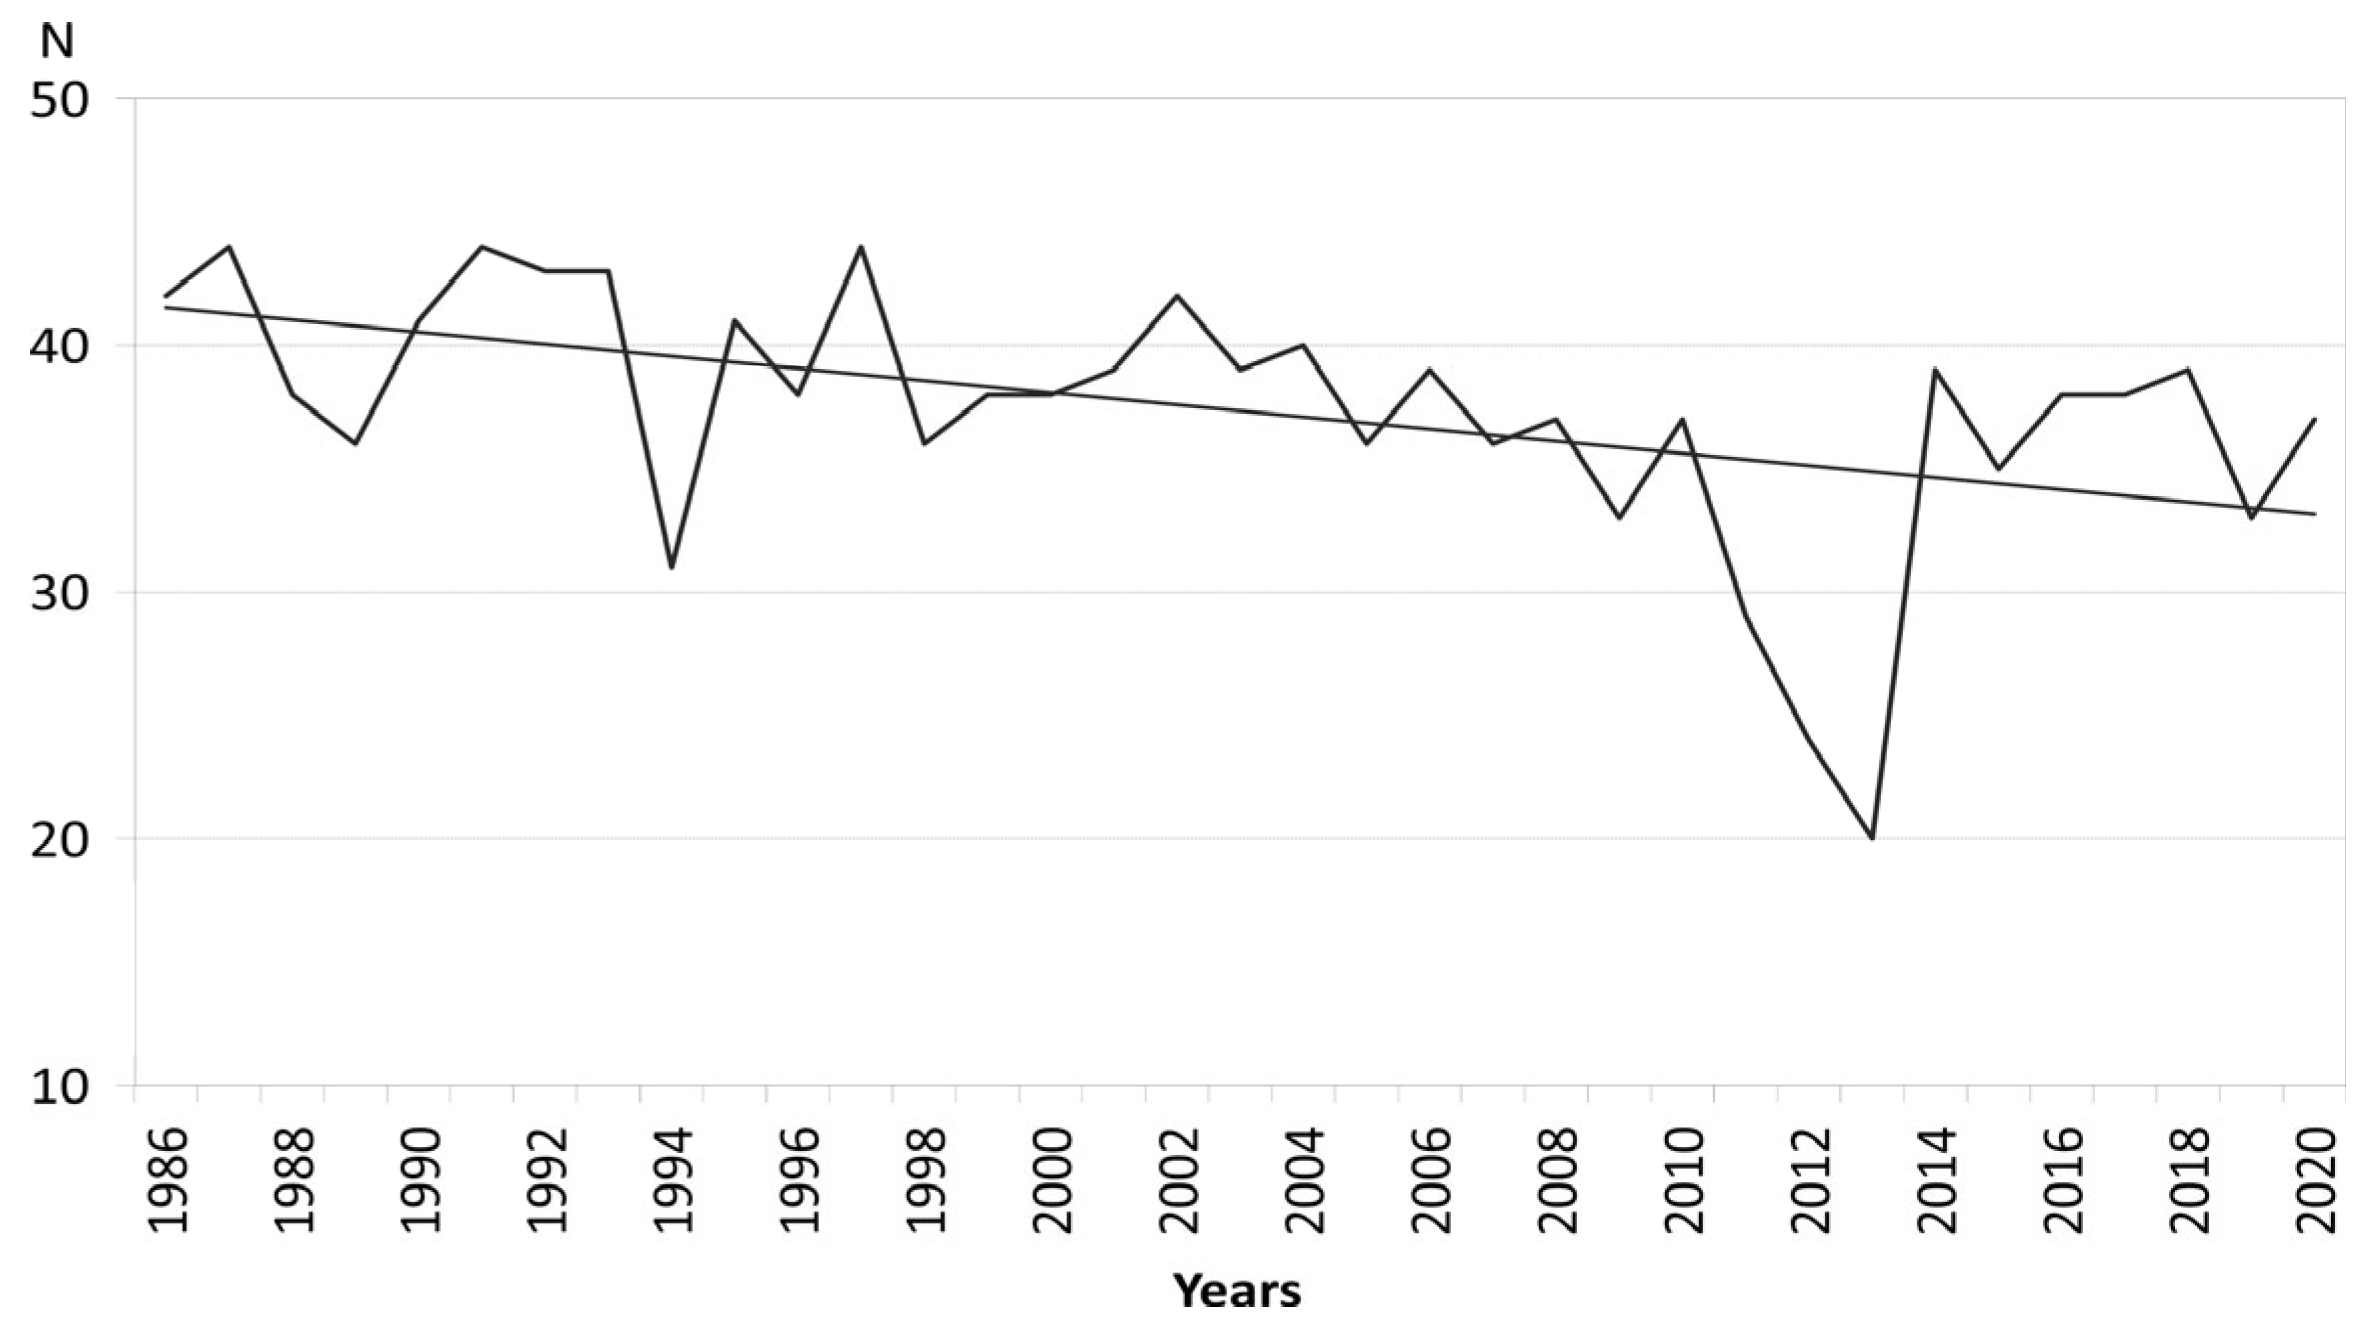
At six stations (Table 3), there was a statistically significant negative trend in the changes in relation to the total number of dry day sequences. This is caused by a very low number of sequences in the period 2012–2013, which is well illustrated in the example of Tylicz (Figure 7).
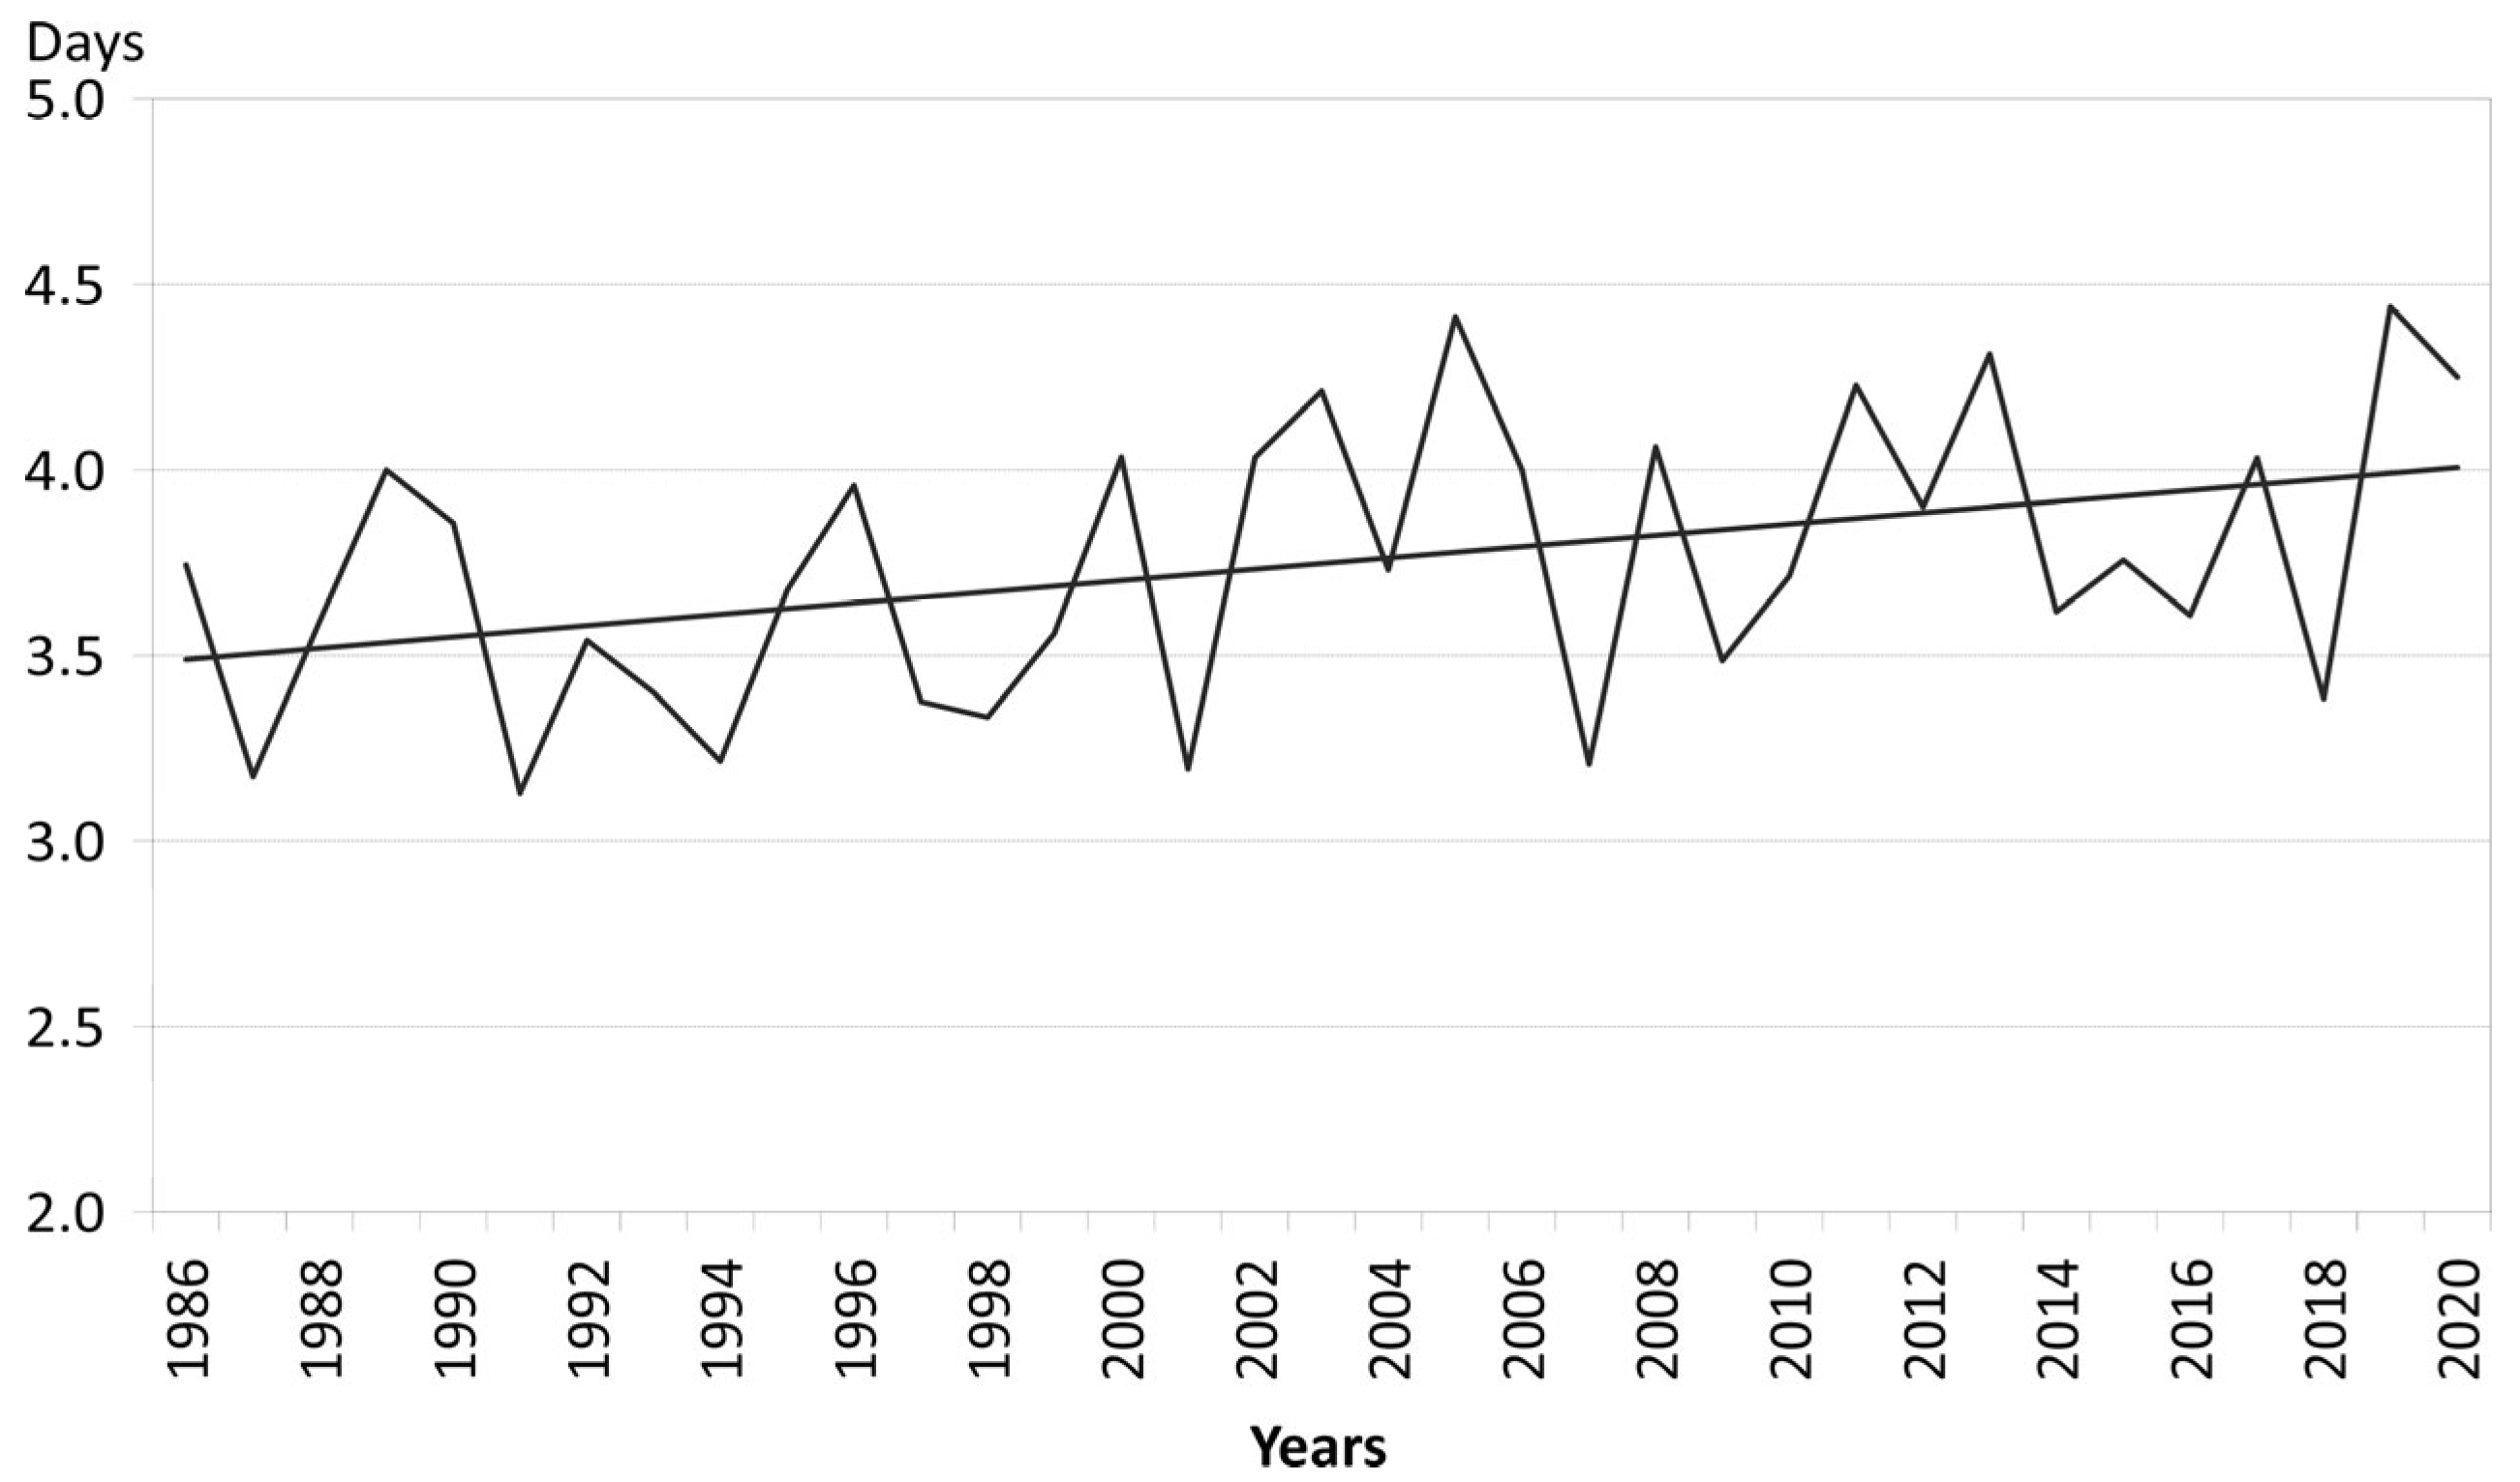
In the case of the average length of the dry day sequences, a statistically significant trend to an increase has only been observed at 2 stations (Table 4). At Kasprowy Wierch, this is a trend significant at the level of p < 0.05, while in the case of Węglówka—at the level of p < 0.1. The long-term course of the average length of the sequences at Kasprowy Wierch is presented in Figure 8.

3.3. Links Between Dry Days and Circulation Types

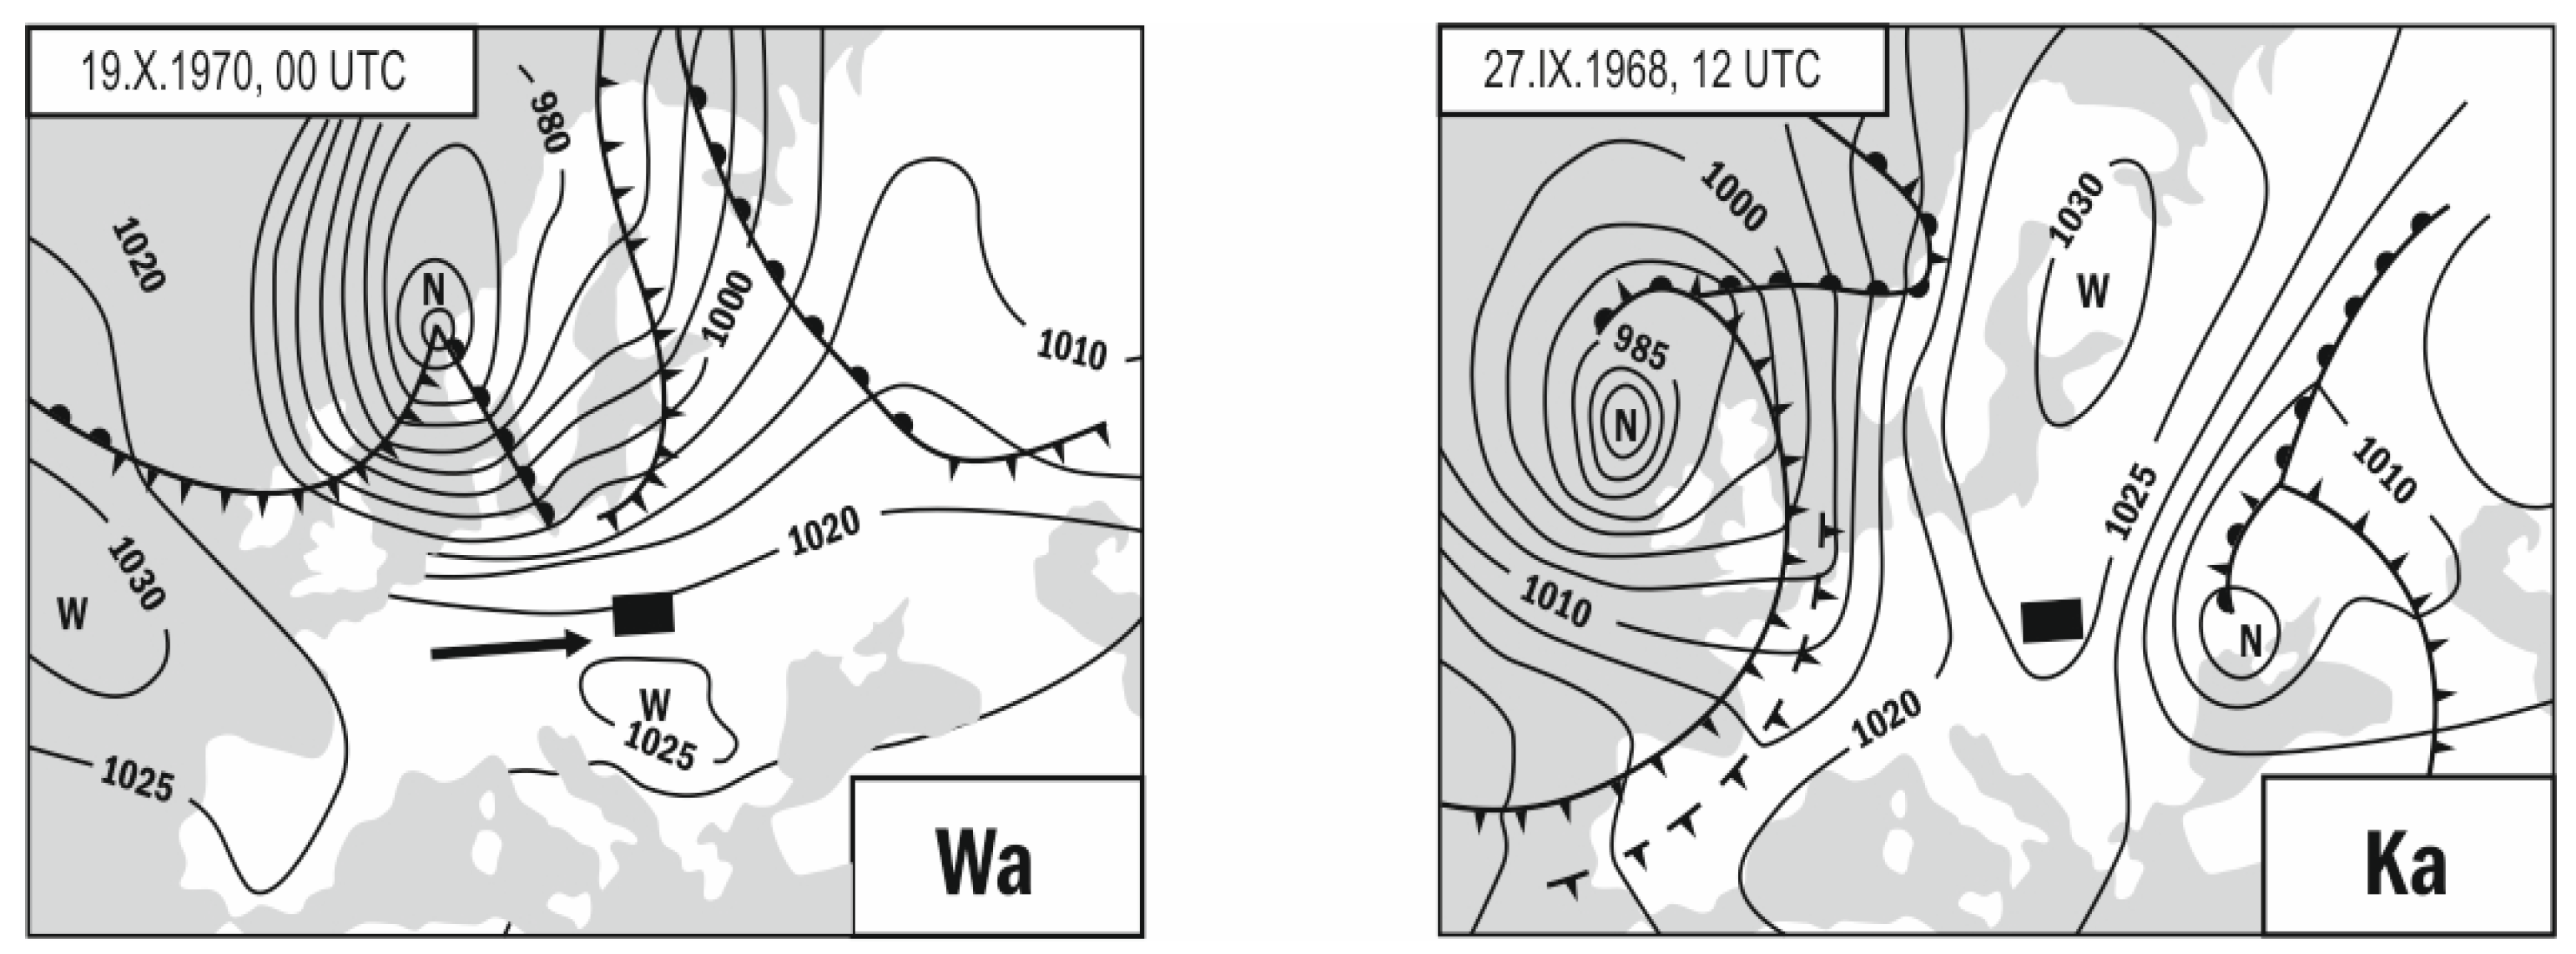
In the temperate zone, atmospheric precipitation or the absence thereof is largely affected by atmospheric circulation. The cyclonic or anticyclonic nature of such circulation, as well as the direction of air mass flow determine the thermal and humidity characteristics in a given area. From Niedźwiedź’s calendar of circulation types, it seems that in the 35-year period between 1985 and 2020, southern Poland more often recorded anticyclonic (56% of days) than cyclonic types (44% of days; Figure 9). Among the 20 types, the most frequently recorded was the situation of an anticyclonic wedge Ka (12.3%). A similar frequency was observed for type Bc—cyclonic trough (11.9%). The third was the anticyclonic circulation type from the west Wa with a frequency of 9.2% of days. In total, these three types occur for one third of days in a year, so they clearly dominated in comparison with the remaining 17 circulation types, which are observed noticeably more rarely, usually at a rate of 2–4%. The allocation of respective circulation types to each day with no precipitation revealed that, on average, 74% of such days at each meteorological station are related to anticyclonic types, and 25% to cyclonic types (Figure 9). Most dry days occur with one circulation type, namely anticyclonic wedge Ka: 19%. Many such days also occur with western anticyclonic circulation Wa: 11.3%. Therefore 30% of dry days are associated with these two circulation types. The source study of the author of this classification [33] provided examples of circulation types classified as Ka and Wa on the synoptic maps of Europe (Figure 10). An arrow marks the direction of air mass advection over the Polish Carpathians. A major impact on the incidence of dry days is also from circulation types coming from the southern sector, where the Foehn effect occurs.
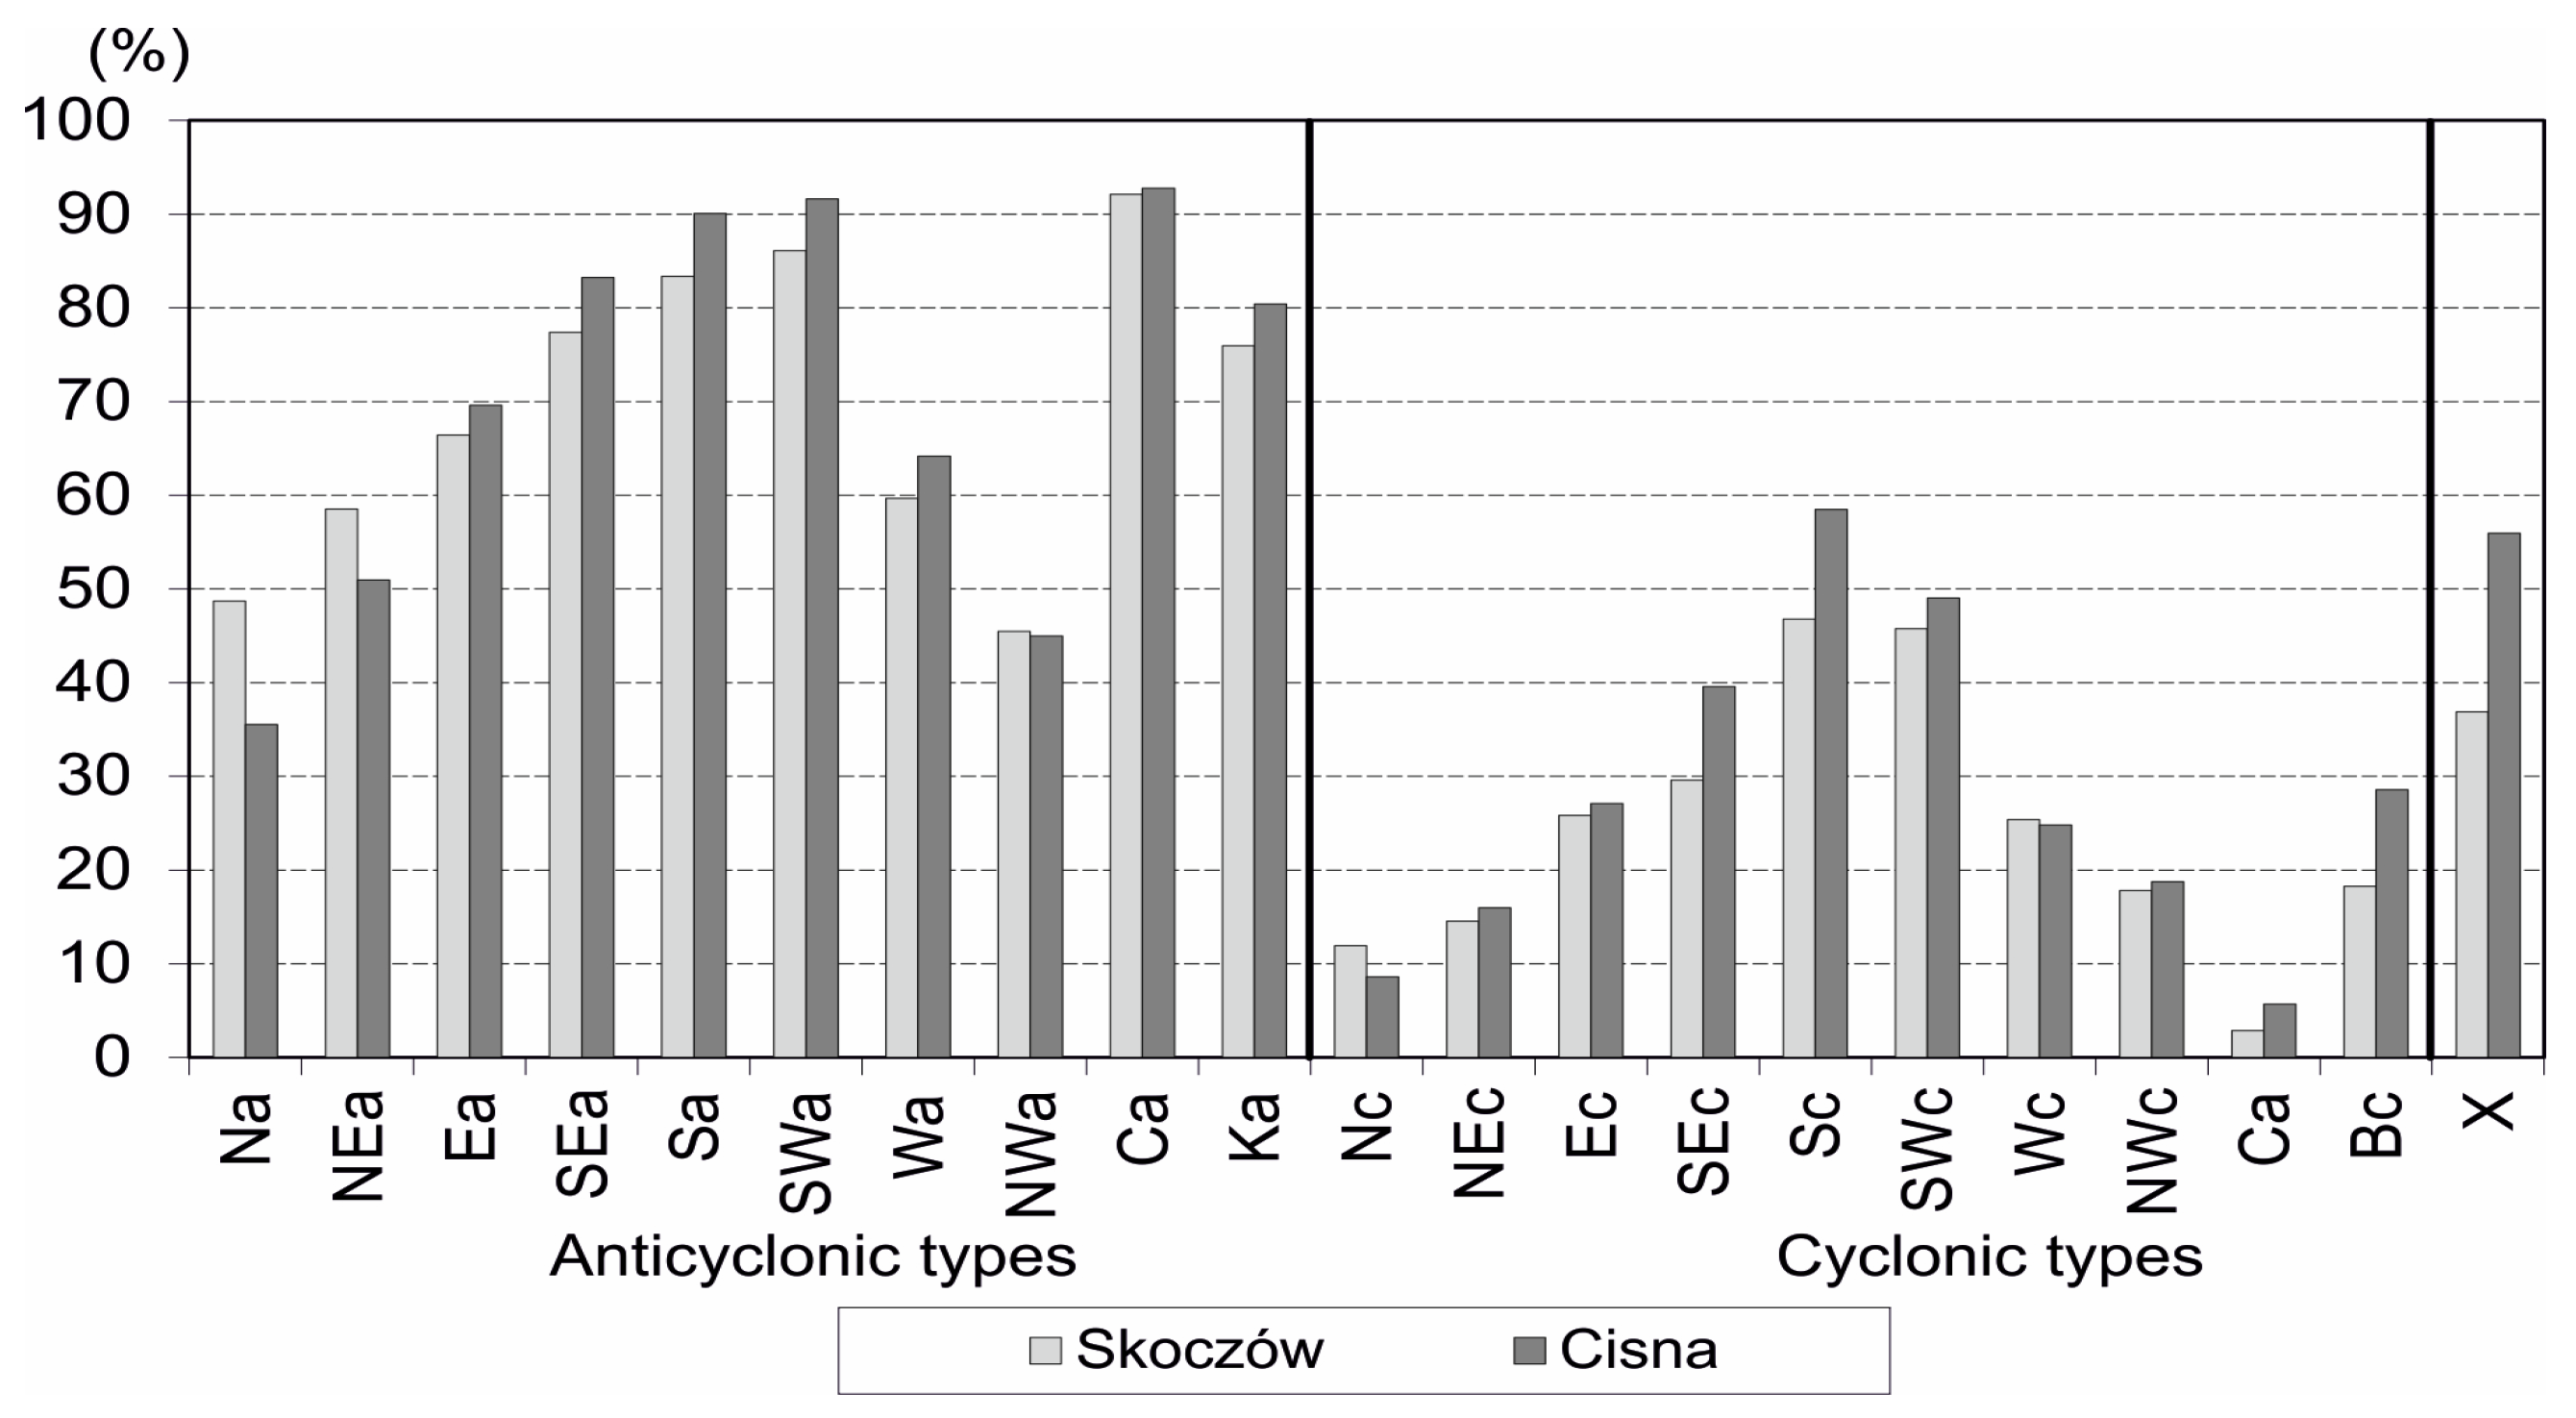
The relationship between the occurrence of dry days and circulation types was also determined using conditional probability, which is the ratio of such days with a given circulation type and total days with such a circulation type. The analysis of this probability at individual stations revealed that the values do not significantly differ. This is well illustrated in Figure 11, which presents the distribution of probability values using the example of two stations located in the western and eastern part of the study area. In total, in the anticyclonic circulation types, the probability is over 75%. Among anticyclonic types, the most favourable is the high-pressure system centre (Ca), where the conditional probability exceeds 90% at each station. In the case of circulation types from the southern sector, the probability of dry days is slightly lower (usually over 80%, depending on the meteorological station). The circulation types that are the least favourable to rain-free days over the Polish Carpathians include the types from the northern sector, for which most precipitation is recorded [35].
Further analysis involved circulation types occurring during the longest sequence of dry days, which occurred in November 2011. This was observed at all stations, but with varying lengths. The sequence lasted for the longest time (40 days) in Raba Wyżna, from 26 October to 4 December 2011 (Table 2). In that period, only anticyclonic circulation types were recorded (8 out of 10). Most were recorded in the Sa (10 days) and Wa and Ka (7 days each) types. Two types: Na and NEa did not occur at all.

4. Discussion and Conclusions

At the time of contemporary global warming, research of dry days and sequences of dry days is becoming increasingly important. This is because in many areas, e.g., in Canada, a trend towards an increase in the number and duration of dry periods is observed [15]. Their more frequent incidence is considered as an evident manifestation of climate change [36] because drought periods often coincide with heat waves that cause an intensification of dryness [37]. Forecasts have related increasingly long drought periods with a long-term negative effect on vegetation [38,39,40].
In relation to global warming that causes, inter alia, a shortening of the snow cover period, there is already a lower water supply at the onset of the vegetation period [41]. The same effect is also present in the Polish Carpathian Mountains [42]. Water deficit at abnormally high temperatures significantly affects agriculture and natural ecosystems. We have experienced that in vast areas of Europe, particularly during the extremely dry and hot spring months of 2018 [6]. Similarly unfavourable conditions for natural ecosystems—namely very low precipitation, including, as shown by our research, a completely dry November—occurred in the Polish Carpathians in the autumn of 2011.
In the Polish part of the Carpathians, like the rest of Poland [43], no trends to a change in the volume of atmospheric precipitation are observed [35,44], which is a consequence of its cyclical fluctuation. Nevertheless, with the growing temperature, water deficit becomes tangible in the economy and may become severe in the future. That risk has been confirmed by our research which has shown no significant change in the number of dry days. Even in this aspect, the research conducted is important. Recent analyses on this subject refer to a previous period and a short series of data from the period 1956–1965 [28].
This research was conducted with reference to a period of 35 years between 1986 and 2020, which is a period of major increase in air temperature. The analysis of periods with no precipitation in the Polish Carpathians has revealed significant variation in their annual course and over the long-term period for all the characteristics investigated, namely the total of rain-free days, total of sequences of days with no precipitation and the average length of such sequences. A general pattern has been observed of an increase in the dry days from the west towards the east. The largest of these numbers, i.e., 243 dry days in a year, testifies to the prevalence of similar circulation conditions over the entire area of the Polish Carpathians. At most stations, there were no statistically significant trends to the characteristics of days with no precipitation investigated. Our results, therefore, corroborate other studies of dry spell in both Central Europe and in other parts of the continent [45]. This would suggest that the nature of dry days variability patterns in mountainous and non-mountainous regions do not differ. This is an obvious result of the high year-to-year variability, which means that only major changes can achieve statistical significance. However, an increase in dry days is observed during the last decade of the study period and at the high-mountain station of Kasprowy Wierch, the pattern started already at the end of the 20th century.
By far the greatest number of dry days (more than 80% of their overall number) across the entire sample of weather stations occurred as part of sequences of dry days. Such periods tend to be short and those ranging from 2 to 7 days account for more than 60% of the overall number of dry days. As the number of days in each period increases beyond that range, their frequency of occurrence rapidly decreases. Indeed, periods numbering 8 to 14 days are 10 times less frequent and longer periods are only sporadic. The most dangerous effects can be caused by long-lasting sequences of dry days (of over a month) which occur in the Polish Carpathians. Such long periods of drought, lasting 4–5 weeks, slow down agricultural production. These longest sequences of dry days, typically encompassing the whole area, are most frequent in autumn. An example is a record-long dry day sequences that occurred in autumn of 2011 and—at one station, Raba Wyżna—went on for 40 days. Their occurrence, combined with the shortening of the duration and thinning of the snow cover may even lead to a hydrological drought the following spring.
Therefore, the results considerably expand the existing knowledge on the variability of dry days and even more of dry days sequences in mountainous areas of southern Poland during the latest 35-year period, a period of intensive climate warming. The analysis of the frequency of dry days for individual circulation types revealed a connection between the incidence of such days and the type of baric system and direction of advection. The vast majority of dry days are related to anticyclonic systems. Most dry days correspond to the anticyclonic wedge (Ka) and western anticyclonic situation (Wa). Another significant influence is exerted by southern circulation types, which are responsible for the foehn effect. The most favourable circulation type for dry days is the central anticyclonic situation type (Ca) of high-pressure system, for which the conditional probability amounts to at least 90%. Long dry spells in the Polish Carpathians and elsewhere in Europe [46] are produced by stable high-pressure systems occurring over eastern Europe that bring in dry continental air masses.
Further research seems necessary into dry days, sequences of them, and dry spells, especially breaking them down into the seasons of the plant growth period when water scarcity is the most dangerous. It should be borne in mind that circulation-related pro-cesses also display seasonality. Such research would need to employ carefully selected methods, especially for dry spells, due to the mountainous nature of the study area with its varied land relief including steep slopes that cause rapid water flows. Another worthy avenue would be to probe for any relationships between long dry spells and macro-scale circulation, e.g., the North-Atlantic Oscillation (NAO).

Author Contributions

Conceptualization, R.T. and M.C.; methodology R.T. and M.C.; software, R.T. and M.C.; validation, R.T. and M.C.; formal analysis, R.T. and M.C.; investigation, R.T. and M.C.; resources, R.T. and M.C.; data curation, R.T. and M.C.; writing—original draft preparation, R.T. and M.C.; writing—review and editing, R.T. and M.C.; visualization, R.T. and M.C.; supervision, R.T. and M.C.; project administration, R.T. and M.C. All authors have read and agreed to the published version of the manuscript.

Funding

This research received no external funding.

Data Availability Statement

Publicly available datasets were analyzed in this study. This data can be found here: [https://danepubliczne.imgw.pl/], accessed on 1 May 2024.

Acknowledgments

We thank Paweł Pilch and Martin Cahn for reviewing the English.

Conflicts of Interest

The authors declare no conflicts of interest.

References

  1. Şen, Z.; Şişman, E.; Dabanli, I. Wet and dry spell feature charts for practical uses. Nat. Hazards 2020, 104, 1975–1986. [Google Scholar] [CrossRef]
  2. Twardosz, R. Charakterystyka okresów bezopadowych w Krakowie, 1863–1995. Przegląd Geogr. 1999, 71, 435–446. [Google Scholar]
  3. Niedźwiedź, T.; Ustrnul, Z. Change of Atmospheric Circulation. In Climate Change in Poland: Past, Present, Future; Falarz, M., Ed.; Springer Climate: Cham, Switzerland, 2021; pp. 123–150. [Google Scholar]
  4. Farat, R.; Kępińska-Kasprzak, M.; Kowalczyk, P.; Mager, P. Susza na obszarze Polski w latach 1951–1990. In Materiały Badawcze, Seria: Gospodarka Wodna i Ochrona Wód—16; Instytut Meteorologii i Gospodarki Wodnej: Warszawa, Poland, 1995; Volume 16. [Google Scholar]
  5. Cebulska, M. Okresy bez opadów i ze słabymi opadami w polskich Karpatach (1984–2013). Pol. J. Agron. 2018, 34, 52–61. [Google Scholar]
  6. Twardosz, R. Anomalously warm months in 2018 in Poland in relation to airflow circulation patterns. Weather 2019, 74, 374–382. [Google Scholar] [CrossRef]
  7. Radzka, E. Ciągi dni bezopadowych w okresie wegetacyjnym w środkowo-wschodniej Polsce (1971–2005). Acta Agrophysica 2014, 21, 483–491. [Google Scholar]
  8. Bako, M.M.; Mashi, S.A.; Bello, A.A.; Adamu, J.I. Spatiotemporal analysis of dry spells for support to agriculture adaptation efforts in the Sudano-Sahelian region of Nigeria. SN Appl Sci. 2020, 2, 1–11. [Google Scholar] [CrossRef]
  9. Breinl, K.; Baldassarre, G.; Mazzoleni, M.; Lun, D.; Vico, G. Extreme dry and wet spells face changes in their duration and timing. Environ. Res. Lett. 2020, 15, 074040. [Google Scholar] [CrossRef]
  10. Chimimba, E.G.; Ngongondo, C.; Li, C.; Minoungou, B.; Monjerezi, M.; Eneya, L. Characterisation of dry spells for agricultural applications in Malawi. SN Appl. Sci. 2023, 5, 199. [Google Scholar] [CrossRef]
  11. Koźmiński, C.Z. Przestrzenny i czasowy rozkład okresów bezopadowych trwających ponad 15 dni na terenie Polski. Zesz. Probl. Postępów Nauk. Rol. 1986, 268, 17–36. [Google Scholar]
  12. Kundzewicz, Z.W.; Kozyra, J. Ograniczenie wpływu zagrożeń klimatycznych w odniesieniu do rolnictwa i obszarów wiejskich. Pol. J. Agron. 2011, 7, 68–81. [Google Scholar]
  13. Łabędzki, L. Susze rolnicze, zarys problematyki oraz metody monitorowania i klasyfikacji. In Woda, Środowisko, Obszary Wiejskie; Wydawnictwo IMUZ: Falenty, Poland, 2006. [Google Scholar]
  14. Usman, M.T.; Reason, C.J.C. Dry spell frequencies and their variability over southern Africa. Clim. Res. 2004, 26, 199–211. [Google Scholar] [CrossRef]
  15. Yang, Y.; Gan, T.Y.; Tan, X. Recent changing characteristics of dry and wet spells in Canada. Clim. Chang. 2021, 165, 42. [Google Scholar] [CrossRef]
  16. Thoithi, W.; Blamey, R.C.; Reason, C.J.C. Dry spells, wet days, and their trends across Southern Africa during the summer rainy season. Geophys. Res. Lett. 2021, 48, e2020GL091041. [Google Scholar] [CrossRef]
  17. Zhi, L.; Yanping, L.; Xiaoping, S.; Jingjing, L. The characteristics of wet and dry spells for the diverse climate in China. Glob. Planet. Chang. 2017, 149, 14–19. [Google Scholar] [CrossRef]
  18. Zolina, O.; Simmer, C.; Belyaev, K.; Gulev, S.K.; Koltermann, P. Changes in the duration of European wet and dry spells during the last 60 years. J. Clim. 2013, 26, 2022–2047. [Google Scholar] [CrossRef]
  19. Ye, H. Changes in duration of dry and wet spells associated with air temperatures in Russia. Environ. Res. Lett. 2018, 13, 034036. [Google Scholar] [CrossRef]
  20. Caloiero, T.; Coscarelli, R. Analysis of the characteristics of dry and wet spells in a Mediterranean region. Environ. Process. 2020, 7, 691–701. [Google Scholar] [CrossRef]
  21. Bartolini, G.; Betti, G.; Gozzini, B.; Iannuccilli, M.; Magno, R.; Messeri, G.; Spolverini, N.; Torrigiani, T.; Vallorani, R.; Grifoni, D. Spatial and temporal changes in dry spells in a Mediterranean area: Tuscany (central Italy), 1955–2017. Int. J. Climatol. 2022, 42, 1670–1691. [Google Scholar] [CrossRef]
  22. Lana, X.; Martínez, M.D.; Burgueño, A.; Serra, C.; Martín-Vide, J.; Gómez, L. Distributions of long dry spells in the Iberian Peninsula, years 1951–1990. Int. J. Climatol. 2006, 26, 1999–2021. [Google Scholar] [CrossRef]
  23. Serra, C.; Burgueño, A.; Martínez, M.D.; Lana, X. Trends in Dry Spells across Catalonia (NE Spain) during the Second Half of the 20th Century. Theor. Appl. Climatol. 2006, 85, 165–183. [Google Scholar] [CrossRef]
  24. Cindrić, K.; Pasarić, Z.; Gajić-Čapka, M. Spatial and Temporal Analysis of Dry Spells in Croatia. Theor. Appl. Climatol. 2010, 102, 171–184. [Google Scholar] [CrossRef]
  25. Marinović, I.; Cindrić Kalin, K.; Güttler, I.; Pasarić, Z. Dry Spells in Croatia: Observed Climate Change and Climate Projections. Atmosphere 2021, 12, 652. [Google Scholar] [CrossRef]
  26. Niedźwiedź, T. Catalogue of Synoptic Situations and Circulation Indices in the Upper Vistula River Basin (1873–2007). Computer File Available at Department of Climatology, University of Silesia, ul. Będzińska 60, PL 41-200 Sosnowiec, Poland. 2024. Available online: https://klimat.wnoz.us.edu.pl/ (accessed on 1 May 2024).
  27. Twardosz, R.; Walanus, A.; Guzik, I. Warming in Europe: Recent Trends in Annual and Seasonal Temperatures. Pure Appl. Geophys. 2021, 178, 4021–4032. [Google Scholar] [CrossRef]
  28. Obrębska-Starklowa, B.; Hess, M.; Olecki, Z.; Trepińska, J.; Kowanetz, L. Klimat. In Karpaty Polskie, Przyroda, Człowiek i Jego Działalność; Warszyńska, J., Ed.; Wydawnictwo Uniwersytet Jagielloński: Kraków, Poland, 1995. [Google Scholar]
  29. Mann, H.B. Nonparametric tests against trend. Econometrica 1945, 13, 245–259. [Google Scholar] [CrossRef]
  30. Kendall, M.G. Rank Correlation Methods, 4th ed.; Charles Griffin: London, UK, 1975. [Google Scholar]
  31. Jeneiová, K.; Kohnová, S.; Sabo, M. Detecting trends in the annual maximum discharges in the Vah River Basin, Slovakia. Acta Silv. Lign. Hung. 2014, 10, 133–144. [Google Scholar] [CrossRef]
  32. Blain, G.C. The influence of nonlinear trends on the power of the trend-free pre-whitening approach. Acta Sci. Agron. 2015, 37, 21–28. [Google Scholar] [CrossRef]
  33. Niedźwiedź, T. Sytuacje Synoptyczne i Ich Wpływ na Zróżnicowanie Przestrzenne Wybranych Elementów Klimatu w Dorzeczu Górnej Wisły; Rozprawy Habilitacyjne UJ: Kraków, Poland, 1981; Volume 58, p. 165. [Google Scholar]
  34. Kaszewski, B.M. Typy cyrkulacji a typy pogody w Polsce. In Rozprawy Habilitacyjne Wydal; UMCS: Lublin, France, 1992; Volume 220. [Google Scholar]
  35. Walanus, A.; Cebulska, M.; Twardosz, R. Long-term variability pattern of monthly and annual atmospheric precipitation in the Polish Carpathian Mountains and their foreland (1881–2018). Pure Appl. Geophys. 2021, 178, 633–650. [Google Scholar] [CrossRef]
  36. Jarrett, U.; Miller, S.; Mohtadi, H. Dry spells and global crop production: A multi-stressor and multi-timescale analysis. Ecol. Econ. 2023, 203, 107627. [Google Scholar] [CrossRef]
  37. Hoy, A.; Hansel, S.; Skalak, P.; Ustrnul, Z.; Bochnicek, O. The extreme European summer of 2015 in a long term perspective. Int. J. Climatol. 2016, 37, 943–962. [Google Scholar] [CrossRef]
  38. Groisman, P.Y.; Knight, R.W. Prolonged dry episodes over the conterminous United States: New tendencies emerging during the last 40 years. J. Clim. 2008, 21, 1850–1862. [Google Scholar] [CrossRef]
  39. Wainwright, C.M.; Allan, R.P.; Black, E. Consistent trends in dry spell length in recent observations and future projections. Geophys. Res. Lett. 2022, 49, e2021GL097231. [Google Scholar] [CrossRef]
  40. Motamedi, A.; Gohari, A.; Haghighi, A.T. Three-decade assessment of dry and wet spells change across Iran, a fingerprint of climate change. Sci. Rep. 2023, 13, 2888. [Google Scholar] [CrossRef] [PubMed]
  41. Wibig, J. Dry spells and droughts in Poland, 1951–2006 Extended Abstracts, In Proceedings of the Ninth European Conference on Applied Meteorology, Toulouse, France, 28 September–2 October 2009; European Meteorological Society, EMS2009-141; Volume 6.
  42. Falarz, M.; Bednorz, E. Snow Cover Change. In Climate Change in Poland: Past, Present, Future; Falarz, M., Ed.; Springer Climate: Cham, Switzerland, 2021; pp. 375–390. [Google Scholar]
  43. Łupikasza, E.; Małarzewski, Ł. Precipitation Change. In Climate Change in Poland: Past, Present, Future; Falarz, M., Ed.; Springer Climate: Cham, Switzerland, 2021; pp. 349–373. [Google Scholar]
  44. Walanus, A.; Twardosz, R.; Cebulska, M.; Płachta, A. In search of periodicity in the annual precipitation in Europe (1881–2020). Water 2022, 14, 2026. [Google Scholar] [CrossRef]
  45. Serra, C.; Martínez, M.D.; Lana, X.; Burgueño, A. European dry spell regimes (1951–2000): Clustering process and time trends. Atmos. Res. 2014, 144, 151–174. [Google Scholar] [CrossRef]
  46. Herrera-Lormendez, P.; Douville, H.; Matschullat, J. European summer synoptic circulations and their observed 2022 and projected influence on hot extremes and dry spells. Geophys. Res. Lett. 2023, 50, e2023GL104580. [Google Scholar] [CrossRef]
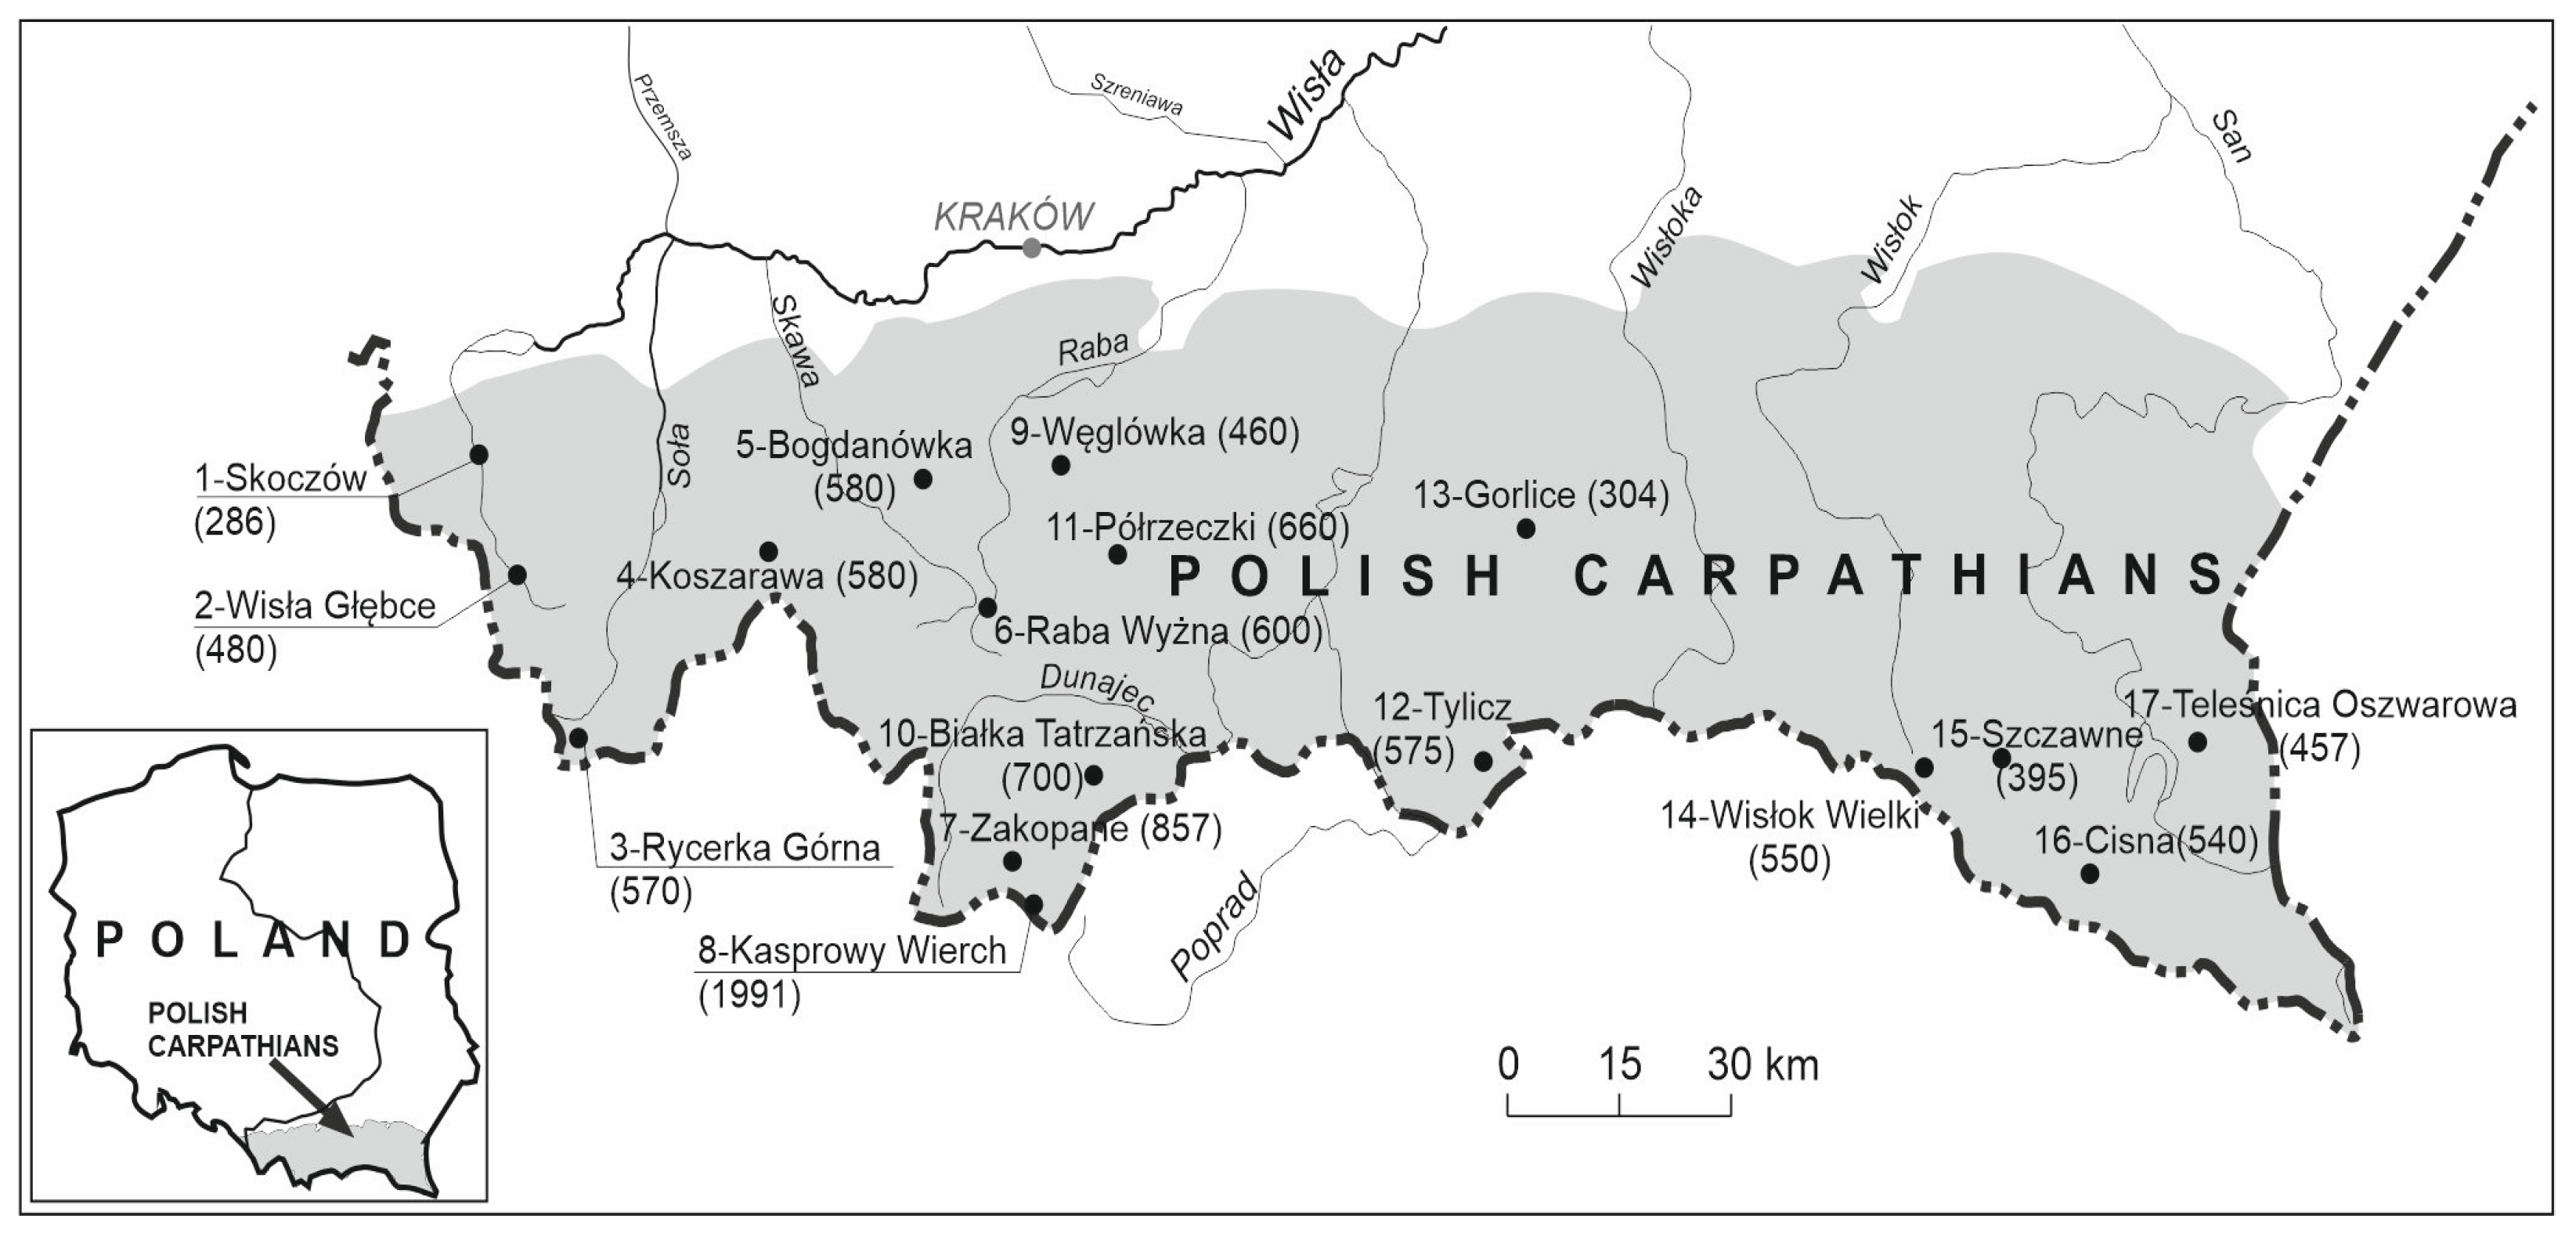
Figure 1. Location of the meteorological stations; by the station name, there is a reference number starting from the west; in brackets, the stations’ altitudes have been provided (in m a.s.l.).
Water 16 02982 g001
Figure 2. Statistical characteristics of the annual number (N) of dry days at 17 stations in the Polish Carpathians (1986–2020); station numbers, see Figure 1.
Water 16 02982 g002
Figure 3. Long-term variation of the number of dry days (N) at 3 meteorological stations.
Water 16 02982 g003
Figure 4. Share (%) of individual dry days (A) and dry day sequences (B).
Water 16 02982 g004
Figure 5. Statistical characteristics of the number (N) of dry day sequences at 17 stations in the Polish Carpathians (1986–2020); station numbers, see Figure 1.
Water 16 02982 g005
Figure 6. Statistical characteristics of the average length (N) of dry day sequences at 17 stations in the Polish Carpathians (1986–2020); station numbers, see Figure 1.
Water 16 02982 g006
Figure 7. Long-term variation in the total number of dry day sequences (N) with the trend line in Tylicz.
Water 16 02982 g007
Figure 8. Long-term variation in the average length of the sequences of dry days with the trend line at Kasprowy Wierch.
Water 16 02982 g008
Figure 9. Frequency (%) of circulation types over southern Poland (A) and dry days in circulation types over southern Poland (B) (1986–2020).
Water 16 02982 g009
Figure 10. Examples of defined anticyclonic circulation types on synoptic maps of Europe [33]: W—High, N—Low.
Water 16 02982 g010
Figure 11. Conditional probability (%) of dry day occurrence in the circulation types identified.
Water 16 02982 g011
Table 1. Mann–Kendall Statistic and coefficient of linear regression (slope) of number of dry days; the slope uncertainty is the standard deviation (1σ).
Meteorological StationMann–Kendall Statistic (Z)p-ValueR2Slope (Number of Days/Year)
NumberName
8Kasprowy Wierch2.286 ***0.0220.15360.657 ± 0.268
12Tylicz−2.911 ***0.0040.2624−1.292 ± 0.371
17Teleśnica−3.139 ***0.0020.2876−1.033 ± 0.283
Oszwarowa
13Gorlice−1.676 **0.0940.095−0.552 ± 0.297
16Cisna−3.139 **0.0520.111−0.639 ± 0.315
Notes: Symbols: trend significant at the level of 0.05 ***, 0.1 **, R2—Coefficient of determination.
Table 2. Total sequences of days with no precipitation (A) and percentage share of days in sequences (B).
No of Station2–7 Days 8–14 Days 15–21 Days>21 DaysMax Length of the Sequence (Days)Date of Occurrence
ABABABAB
1118466.412019.172.020.83026.10–24.11.2011
2114266.211218.372.010.63427.10–29.11.2011
3108465.110518.0102.710.52626.10–20.11.2011
4118964.713020.492.331.33521.10–24.11.2011
5115563.612620.0194.9--2010.11–29.11.2011
6122562.014220.575.031.34026.10–4.12.2011
7117066.410016.672.010.42526.10–19.11.2011
8101366.37214.251.7--206.11–25.11.2011
9115062.314021.9143.610.43521.10–24.11.2011
10114060.914422.2154.031.12326.10–17.11.2011
11117662.914722.6123.120.83126.10–25.11.2011
12119266.410316.9113.010.4233.10–25.10.2000
13120561.515322.3153.741.53323.09–25.10.2000
14105561.512019.7175.010.63323.09–25.10.2000
15117061.314822.2164.141.63323.09–25.10.2000
16110557.016123.9256.241.94024.04–7.06.1991
17113058.217525.6174.320.83323.09–25.10.2000
Table 3. Mann–Kendall Statistic and coefficient of linear regression (slope) of the total of dry day sequences; the slope uncertainty is standard deviation (1σ).
Meteorological StationMann–Kendall Statistic (Z)p-ValueR2Slope (Number of Days/Year)
NumberName
10Białka Tatrzańska−3.423 ***0.0010.341−0.3241 ± 0.078
11 Półrzeczki−2.798 ***0.0050.263−0.2448 ± 0.071
12 Tylicz−3.096 ***0.0020.2327−0.2462 ± 0.078
13Gorlice−2.159 ***0.0310.1259−0.1532 ± 0.070
15Szczawne−3.238 ***0.0010.3025−0.2734 ± 0.072
17Teleśnica Oszwarowa−2.272 ***0.0230.1621−0.1827 ± 0.070
Notes: Symbols: trend significant at the level of 0.05 ***; R2—Coefficient of determination.
Table 4. Mann–Kendall Statistic and coefficient of linear regression (slope) of the average length of the dry day sequences; the slope uncertainty is standard deviation (1σ).
Meteorological StationMann–Kendall Statistic (Z)p-ValueR2Slope (Number of Days/Year)
NumberName
8Kasprowy Wierch2.386 ***0.0170.16940.0152 ± 0.006
9Węglówka1.676 **0.0940.09790.0151 ± 0.008
Notes: Symbols: trend significant at the level of 0.05 ***, 0.1 **; R2—Coefficient of determination.
Disclaimer/Publisher’s Note: The statements, opinions and data contained in all publications are solely those of the individual author(s) and contributor(s) and not of MDPI and/or the editor(s). MDPI and/or the editor(s) disclaim responsibility for any injury to people or property resulting from any ideas, methods, instructions or products referred to in the content.