Abstract
River sediment load estimation poses a critical challenge for water engineers due to its complex and nonlinear hydrological processes. This study assessed the amount of suspended sediment at the Bagh-e-Kalayeh hydrometric station on the Alamut River in the Qazvin province of Iran using two hydrological and meteorological variables, including discharge and rainfall, by considering three scenarios (discharge, discharge + monthly rainfall, and discharge + monthly rainfall + daily rainfall). For modeling, kernel-based data-driven methods, including Gaussian process regression (GPR) and support vector regression (SVR), and tree models, including the M5 tree, random forest (RF), random tree (RT), extra trees, reduced error pruning tree (REPT), and multi-search methods, were used. The results showed that the best performance was achieved by the SVR, with r = 0.948, Wilmot index = 0.965, and RMSE = 0.011 in the first scenario (only discharge). Discharge had the most significant impact on sediment estimation compared to rainfall. It was determined that the suspended sediment load in the Alamut River can be successfully estimated by the SVR method, where only the discharge was used as the input parameter. Additionally, the results indicated that given its characteristics and inherent features, the multi-search method can be used as a complementary approach in sediment modeling, especially in situations where the data volume is not extensive.
1. Introduction
The amount of suspended sediment load (SSL) in rivers is crucial to management of water resources. It plays a key role in the design and construction of water structure systems, such as dead volumes of dams, channels, and riverbed cover, as well as the relevant data concerning the erodibility of the basin and sediment caused by scouring [1]. Estimating the amount of suspended sediment (SS) is a significant challenge in countries with low rainfall and poor vegetation [2]. In general, Asian countries, such as Iran, are susceptible to flooding, which can carry a high SSL and may lead to economic and social damage. SS destroys structures, including treatment stations. Among other SS problems is the reduced quality of drinking water. In such circumstances, human intervention and climate change intensify this process [3,4]. Water quality control and increasing the efficiency of hydropower facilities are additional benefits of predicting SS. Frings and Kleinhans [5] concluded that despite the importance of SSL, its evaluation process is complex and nonlinear due to various hydrological, meteorological, and hydraulic variables. A direct measurement of SS is costly and sometimes impossible, and any measurement error affects the modeling results, so the need for indirect methods with a high processing speed, good accuracy, and at low cost is essential.
Data-driven methods include various aspects and disciplines, such as statistics, artificial intelligence (AI), and machine learning [6,7]. Due to the complexity, dynamics, and nonlinearity of sediment at spatial and temporal scales, the use of AI methods often leads to reliable results [8]. A great deal of research has been conducted in this field, and various solutions have been proposed. Cigizoglu [9] developed a multilayer perceptron (MLP) network for daily SSL and showed that MLPs depict the complex nonlinear behaviors of the SSL series far more effectively than empirical models. Francke et al. [10] calculated the concentration of SS with generalized linear models, random forest (RF), and quantitative regression forest models. The results showed the low performance of generalized linear models and the optimal performance of RF and quantitative regression forests in predicting SS. Azamathulla et al. [11] used the machine learning method to predict sediment load in Malaysia and found that the support vector machine (SVM) method, with an R2 of 0.958 and an MSE of 0.0698, performed better than traditional methods. Senthil Kumar et al. [12] modeled the SS concentrations in India and found that the M5 model outperformed other soft computing techniques, such as artificial neural network (ANN), fuzzy logic, radial base function, and reduced REP tree pruning (REPTree), and simulated the entire range of sediment concentration values in a balanced way. Kumar [13] predicted the sediment in India using the M5 tree algorithm (M5) and wavelet regression model and then evaluated the performance of each. His results suggested that M5 and wavelet regression estimate the sediment load rate with greater accuracy than ANN.
Yadav et al. [14], Choubin et al. [15], and Roushangar and Shahnazi [16] all explored various methods for predicting suspended sediment load (SSL) and sediment transport rates. Their collective findings highlighted the superior performance of advanced models, such as artificial neural networks (ANN), classification and regression trees (CART), and Gaussian process regression (GPR), over traditional methods, such as multiple linear regression (MLR) and the sediment rating curve (SRC). These advanced models are particularly effective in basins with available meteorological data, offering more accurate and reliable predictions. Zounemat-Kermani et al. [17] evaluated the potential of regular machine learning (ML) models, including ANFIS, support vector regression (SVR), and their integrated version with an evolutionary optimization algorithm, called the genetic algorithm (GA). ANFIS and GA-SVR are also the two traditional methods of the sediment rating curve and MLR for predicting the SS of the Loíza River in Puerto Rico. The results demonstrated that integrated ML models (GA-SVR and GA-ANFIS) were superior predictors compared to to ANFIS, SVR, and traditional models alone. Hazarika et al. [18] modeled the SSL using extreme learning machine and twin SVR and compared them with wavelet-based extreme learning machine and twin SVR models. They found that the wavelet-based hybrid models performed better than the sole models. Asadi et al. [6] predicted SSL in the Gilan and Lorestan Provinces in Iran using machine learning models and geographical parameters, and their results showed that the optimal models for predicting the average sediment load and minimum sediment load were Gaussian process (GP) and evolutionary SVM. Nourani et al. [19] used AI-based methods with two single-station and multi-station scenarios to model the SSL, and the results obtained from both scenarios showed the superiority of AI models. Doroudi et al. [20] predicted the daily SSL in Kohkilouyeh and Boyer Ahmad Province in Iran with hybrid SVR models. They concluded that the SVR model integrated with the learner-based optimization method, SVR observer teacher-based optimization, with Pearson correlation (R = 0.97) and Wilmot index (WI = 0.98), offered a higher predictive performance than other models.
Cakmak et al. [21] studied the effects of precipitation and streamflow characteristics on SS transfer in the Mediterranean climate in Turkey and found a strong correlation between streamflow and SS (R2 = 0.97). Their findings showed that the amount of SS transferred during periods of increased flow increased significantly. Hanoon et al. [22] utilized four machine learning techniques: gradient boost regression, stochastic forest, SVM, and ANN, for SSL prediction at the Rantau Panjang Station. They used data from Johor River and recommended the best-performing model, the ANN method, with r = 0.989, RMSE = 0.011, and NSE = 0.979, as the most accurate model for SSL prediction.
The sediment rating curve is one of the classic experimental methods in studies related to sedimentation. However, due to the nonlinear behavior of hydrological variables, this method is not sufficient. For this reason, intelligent methods are preferred to model variables [23]. The reason for using the above-mentioned data-based methods is the convenience of using these methods and their acceptable levels of accuracy in most studies concerning water engineering. The high cost of sampling devices and facilities for measuring SSLs has also led to these methods.
This study aims to predict the amount of SS in the Bagh-e-Kalayeh hydrometric station in the semi-arid climate of Iran’s Qazvin Province over a 19-year statistical period (2002–2020) using 2 groups of kernel-based data-mining methods, including GPR and vector regression methods. For modeling, kernel-based data-driven methods are considered, including GPR and SVR, and tree models, including M5P, RF, random tree, extra trees, and reduced error pruning tree. Multi-search methods as well as MLP are used. This is the first study to apply the extra trees and multiple search methods to SS estimation. In addition, according to the climatic conditions of the study area, the impact of total daily rainfall up to the day of sediment data measurement, and the effect of monthly rainfall related to the month of sediment load measurement on the accuracy of SS, are investigated.
2. Materials and Methods
2.1. Study Area and Data Used
The province of Qazvin is located in northwestern Iran and is made up of both mountains and plains. The vast, fertile plain of Qazvin, with an area of 13,000 square kilometers, is one of the most important agricultural regions in the country [24]. This plain is located on the central plateau of Iran and has a semi-arid climate, with hot summers and relatively cold winters. In terms of climate, there is not much variation among regions of Qazvin Province because of the latitude. As the altitude increases, the temperature decreases. As a result, the climate in the mountains and highlands of the region is colder than that of the low plains and valleys [25].
The annual temperature varies from a maximum of 42 °C to a minimum of −24 °C. According to the statistics of Qazvin Synoptic Station, the average annual relative humidity is 52.9%, and the total number of hours of daylight is 2896 h per year [26]. The village of Bagh-e-Kalayeh is located in the Rudbar-e-Almut district of Qazvin Province, and its hydrometric station is situated on the Alamut River at latitude 36°23′38″, longitude 50°29′51″, and 1287 m above sea level. The results of the study by Pasban et al. [27] showed that the amount of SSL has increased in the Bagh-e-Kalayeh Station. The reason for the increase in the suspended load was identified as the entry of the branches of Etanroud, Dehak, and Malakalaye, which originated from the early erosional layers of the Miocene. According to the results of their research and the importance of sediment load in the Alamut River, this station was selected as a case study. The location of the study station is shown in Figure 1.
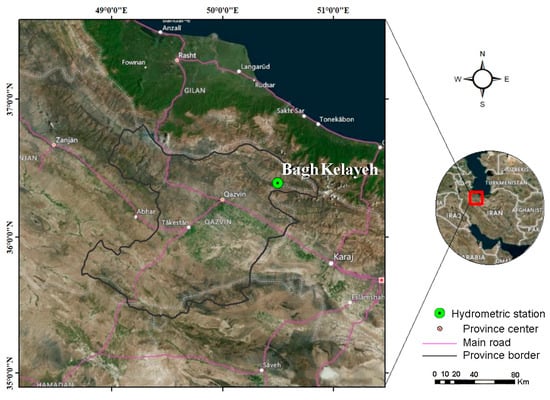
Figure 1.
The study area location.
The elevations in the upstream catchment of the hydrometric station vary between 1287 and 3902 m, the average elevation is 2472, and the standard deviation is 616 m. The area is 695 km2. The main streamflow length is 42.6 km, and the average slope is 6%. The basin contains 57.9% Entisols, 29% Inceptisols, and 13.1% Mollisols soils. The land use in the region includes agriculture (1.46%), bare land (4.57%), rangeland (87.25), rock (0.59%), fruit (5.69%), and woodland (0.44).
In this study, measurements of sediment (tons/day) and flow (m3/s) were performed on different days of every month in non-uniform periods. The variables used in this research were as follows: (1) 417 recorded data points related to the SSL measured on the chosen day, (2) the flow rate measured on the chosen day, (3) the total daily rainfall up to the date of recording the sediment data (Rain2), and (4) the monthly rainfall related to the month in which the sediment load was measured (Rain1). The statistical period in the current research was 19 years (2002–2020). The data used in this research were obtained from the website: www.qazmet.ir, belonging to the Iran Meteorological Organization—Qazvin Province, as well as the website of the Regional Water Company of Qazvin: www.qzrw.ir.
Monthly and annual sediment values are shown in Figure 2. The highest amount of sediment (619,162 tons) occurred in April, as one of the rainy months, and the lowest amount (2193 tons) occurred in September. Over the 19 years, the highest amount of sediment occurred in 2017 (4,955,748 tons), with the lowest in 2008 (41,622 tons).
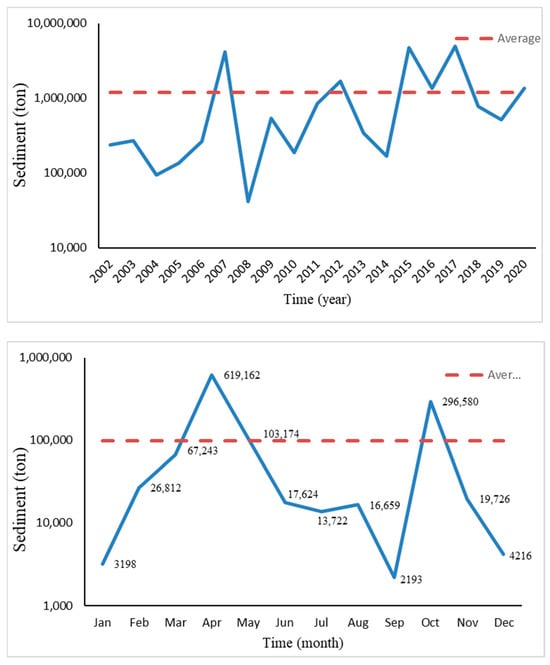
Figure 2.
The annual and monthly average sediment plots.
To facilitate the training phase and increase the accuracy of the models, all data were normalized using Equation (1):
In the above Snorm equation, the normalized values of S(t), Smax(t), and Smin(t) are the maximum and minimum values of the observational data, respectively.
Figure 3 shows the heat map of the studied parameters. The sediment was correlated with discharge, Rain1, and Rain2, respectively. Based on this correlation, the studied scenarios were obtained and can be seen in Table 1.
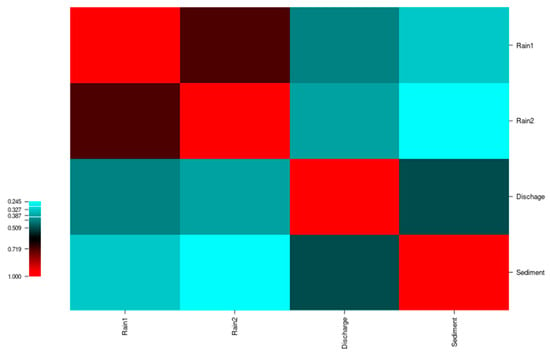
Figure 3.
Heat map diagram of the studied parameters.

Table 1.
The input parameters in each scenario.
The histogram of the variables is shown in Figure 4 and the linear diagram in Figure 5. It can be inferred from Figure 4 that the variables used in the modeling had the same pattern. However, as shown in Figure 5, the points in the center had a higher density, and there was a minimum density on the sediment–Rain2 axis. Typically, in field studies, 2/3 of the data was used for training, with the other 1/3 was reserved for testing [28,29]. In this research, after trial and error, it was determined that the model used provided the best results in the case where 70% of the data was dedicated to training. As a result, among the available data, 70% (292 samples) was considered for training and 30% (125 samples) for testing. All modeling procedures were performed in the Weka software (v 3.8.5) environment developed by Witten in 1993 at the University of Waikato, New Zealand. This software is a collection of machine learning algorithms and data preprocessing tools. Its name is inspired by the name of a flightless bird with an inquisitive nature [30].
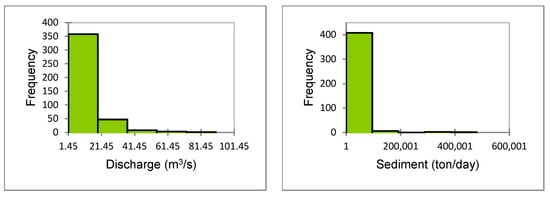
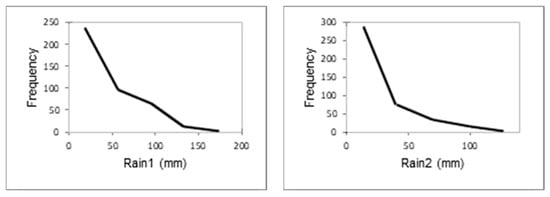
Figure 4.
The histograms of selected variables.
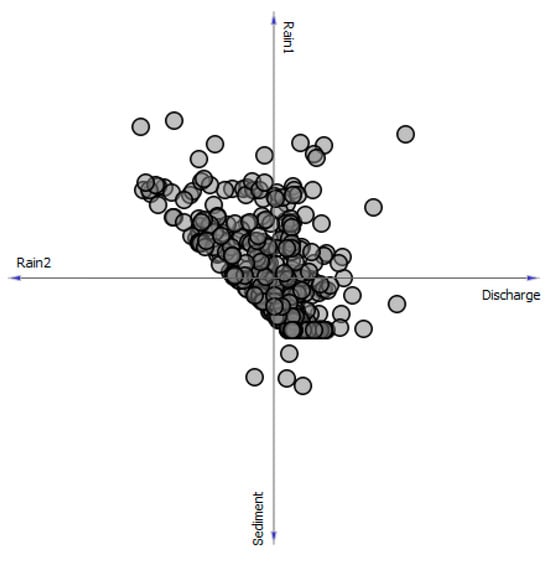
Figure 5.
The linear projection diagram of selected parameters.
2.2. Used Models
The methods used in this study and their key qualifications are presented in Table 2.

Table 2.
The methods used in the study.
2.2.1. Gaussian Process Regression
GPR is a complete Bayesian learning algorithm used practically in model training, parameter estimation, and uncertainty estimation [31]. One of the essential features of the GP is the various structures of covariance functions, which lead to the creation of tasks with different degrees of continuity and allow researchers to make appropriate solutions [32]. The covariance function can be expressed with varying functions of the kernel. The GP allows Bayesian inference on σ2 variance and Kernel parameters [33]. This method is a generalized Gaussian distribution between random variables and a GP, expressing the distribution between functions [34]. The GP f(x) is defined by the mean functions, m(x), and covariance, as follows:
In the above relations, k(x, x)′ is a function of covariance, which is calculated at the points x and (x). The GP f(x) can be expressed as follows [31]:
2.2.2. Support Vector Regression
SVM is one of the learning methods introduced by Boser et al. [35], based on statistical learning theory. In later years, they introduced the approach of optimal super-planes as linear classifiers and introduced nonlinear classifiers using kernel functions. Its basic tenets, now known as backup vector machines, are the result of Boser et al. [35] and, eventually, the expansion of backup vector machines based on the regression that was concluded by Vapnik [36]. One common way to solve nonlinear problems is to use kernel functions, which are defined based on the internal multiplication of the data [37].
SVM is based on statistical learning theory and is primarily used to best distinguish between two data classes. SVM models are divided into two main parts: (1) SVM classification models and (2) SVR models. An SVM model is used to solve data classification in different classes, and the SVR model is used for forecasting [38].
The main equation of the method is as follows:
where f(x) is the function between the target and input variables, WT is the m-dimensional weight vector, φ is the mapping function that maps x to the m-dimensional property vector, and b is the expression bias.
2.2.3. M5 Tree
The M5P algorithm is a logical and extended reconstruction of the M5 introduced by Wang and Witten in 1997 [39]. The constructed tree is called a regression tree when a decision tree (DT) is used to predict (continuous) numerical variables. In some cases, the regression tree, instead of predicting a number in the leaf node, presents linear models that include various variables, in which case the tree-like structure produced is called a tree model [40]. The criterion of division in a node is based on the selection of the standard deviation of the output values that reach that node as a measure of error. By testing each attribute (parameter) in the node, the expected reduction in error is calculated. The reduction in standard deviation (SDR) is calculated using Equation (6):
In the equation above, SDR decreases the standard deviation, T represents the series of samples that are tied to the node, m is the number of models that do not have missing values for this attribute, and β(i) is a correction factor [39]. Finally, a smoothing method is performed to adapt to the sharp divergences typically cut between adjacent linear models on tree leaves, especially for special models created from a smaller number of composite specimens [41].
2.2.4. Random Forest
The RF model performs high-speed categorization for big data, and unlike classical models, such as regression, which rely on only one model, it uses hundreds and thousands of trees to use more information in the data for better inference in input variables. This algorithm contains several DTs, whose output is derived from the output of individual trees. Each tree is randomly involved in constructing several input variables and is considered an efficient forecasting method when the number of observations is relatively less than the number of forecasters [42]. It is commonly used in ecology, genetics, and bioinformatics, where high-dimensional data occur, and can perform supervised or unsupervised learning [43]. The RF can analyze large non-parametric datasets with high multilinear and nonlinear relationships [44]. Each tree is grown with an autonomous sample of the original data, and the number of m variables randomly selected from the variables is searched for the best space division. The user must determine and optimize the number of trees (mtry) and the value of m (ntree). The higher the number of RF trees, the higher the prediction accuracy [42]. Therefore, the ntree parameter should be large enough, and the mtry parameter may result as √P, which is the P number of variables [45].
2.2.5. Multilayer Perceptron
Linear and nonlinear processes can be simulated using a suitable ANN and the correct choice of weights and activator functions. The neural network processes the input variables in parallel and transfers information from one layer to another in series. Each network consists of three layers including, input, hidden, and output layers. One of the most common types of neural networks is MLP, also known as diffusion [46]. The number of input- and output-layer neurons should be the same as the input and target parameters. The number of hidden-layer neurons is determined by neural network error statistics [47]. The hidden layer is used only to prevent the network complexity from increasing [48].
The output of the previous-layer neuron is the input of the next-layer neuron: the nerve nodes in each layer only receive the output signals of the previous-layer neuron node, and each node has a neuron with a nonlinear activation function [49]. During the MLP model training process, algorithms such as AdaGrad, RMSProp, and Adam [50] may be used. One of these algorithms, Adam, is a slope-based optimization algorithm. The advantages of the AdaGrad and RMSProp algorithms are high computational efficiency and low memory usage/requirements in applications [51].
The MLP method can be described as follows [52]:
In the above equation, Wkj is the weight between hidden layers and output layers, Wji is the weight between hidden layers and input layers, Xi are the input variables, m is the number of hidden-layer neurons, n is the number of input-layer neurons, Bj is the neuron bias in the hidden layer, Bk is the amount of neuron bias in the output layer, F is the transfer function, and Y is the output function.
2.2.6. Extra Trees
Extra tree forests, such as RBFs, are group classifiers based on earlier weaker classifiers. DTs are a common method and are faster than other classifiers, easier to understand and interpret, and easier to use than the white-box model. In addition, they are statistically robust [53].
Several DTs are used to control performance consistency, although collection algorithms, such as extra trees, are somewhat immune to over-adequacy training datasets, so increasing the number of DTs is likely to lead to overfitting [54]. The extraordinary random tree algorithm (or extra trees) is a relatively new machine learning technique developed as an RF algorithm format and less likely to use datasets [55]. The extra tree uses the same RF principle and a random subset of features to train each baseline estimator. The extra tree uses the entire training dataset to train each regression tree. RF, on the other hand, uses a bootstrap mock-up for model training [56].
2.2.7. Multi-Search
Multiple searches, unlike grid search (GridSearch), which always requires optimization of two parameters, can be used to optimize the desired number of parameters. However, it does not offer automated search space plugins, as GridSearch does. It searches several arbitrary parameters of the classifier and selects the best available pair for actual filtering and training.
After calling the built classifier, the best classifier settings can be accessed via the “get best classifier method”. The effects of the evaluated settings can also be accessed after the classifier call [57]. Similar to other methods, multi-search uses internal validation to minimize the root mean square error (RMSE) [58].
2.2.8. Reduced Error Pruning Tree (REPTree)
REPTree uses regression tree logic to create multiple trees in different iterations. It then selects the best tree from the trees produced and considers it a representative. In tree pruning, the measurement used is the mean square error of the predictions made by the tree. Tree pruning error reduction is the rapid learning of a DT and decision based on information acquisition or variance reduction. REP only sorts numerical attribute values once [59]. In this method, the DT is used to simplify the modeling process using the training dataset when the output of the DT is significant, and REP is used to reduce participation in the tree structure [60]. In general, there are two ways to prune DT: before pruning and after pruning [61].
2.2.9. Random Tree
The RF is a supervised classifier and uses a collection idea to generate a random dataset to construct the DT. Random trees are a combination of two existing machine learning algorithms: single-model trees are combined with RF ideas. Sample trees are DTs in which each leaf has a linear model that is optimized for the local subspace described by that leaf. Stochastic forests have been shown to significantly improve the yield of single DTs [59]. Trees are unstable, meaning that small changes in training data can lead to the construction of very different structures. Although this may cause a problem for a single tree, it can be used in a group [62]. Random tree algorithms can deal with classification and regression problems [63].
2.3. Evaluation Metrics
The evaluation of the models’ performance and accuracy was evaluated by the indices of correlation coefficient (r), RMSE, mean absolute error (MAE), and Willmott’s index of agreement (WI [64]), for which the formulas are presented in Equations (8)–(11), respectively:
In these equations, xi is the observational value, yi is the modeled value, is the mean of the observational value, is the mean of the modeled value, and N is the amount of data.
3. Results and Discussion
The parameters of discharge (m3/s), sediment (tons/day), and rainfall (mm) of the Bagh-e-Kalayeh hydrometric station in different combinations were used to estimate the amount of SS and modeled based on the GPR-based data, SVR, M5P tree model, RF, MLP, additional trees, tree pruning error reduction, and random tree methods. A large number of models were used to compare their performance and introduce the best model for further studies. All kernel functions were tested during the GPR and SVR modeling processes. In the GPR method, the performance of the poly kernel was optimal, and in the SVR method, the Puk and RBF kernels resulted optimally. The results of the metrics are presented in Table 3. In the table, the r and WI evaluation criteria indicate the accuracy, and the RMSE and MAE criteria indicate the errors of the models. As a result, the closer the values of r and WI were to one and RMSE and MAE were to zero, the closer the model results were to reality.

Table 3.
Statistical criteria of the given methods based on the three scenarios introduced in the testing section.
According to the results in Table 3, considering all four evaluation statistics, it can be concluded that the SVR, M5P, MLP, REPTree, and multi-search methods in the first scenario had a correlation coefficient between 0.744 and 0.948, RMSE between 0.011 and 0.029, mean absolute error between 0.003 and 0.014, and WI between 0.827 and 0.965. In the second scenario, for the GPR and extra trees methods, r was equal to 0.802 and 0.945, RMSE to 0.034 and 0.046, MAE to 0.030 and 0.011, and WI to 0.745 and 0.815. On the other hand, in the third scenario, for the RF and random tree methods, r was equal to 0.866 and 0.921, RMSE to 0.0727 and 0.104, MAE to 0.020 and 0.023, and WI to 0.676 and 0.596, which were more accurate than the other scenarios of each method. In most cases, the first scenario had a good performance and was considered an ideal scenario, so the discharge had the most significant impact on the amount of SS, and only with the discharge can acceptable results be achieved. Among the first scenario, the SVR model, the second scenario, the extra trees model, and the third scenario, the random tree model had the highest accuracy due to the correlation. The two new methods used in the present study, the extra trees method based on the discharge and monthly precipitation and the multi-search method based on the discharge, had a good performance among other scenarios of these methods.
This study showed that rainfall, as a meteorological variable, naturally and evidently affected river discharge. Therefore, Scenario 1 was defined based on this premise. The evaluation results indicated that Scenario 1 could be selected as the superior scenario, considering the overall numerical criteria for model evaluation and the important criterion of the number of variables in each scenario. Although in some cases, the correlation coefficient values in Scenarios 2 and 3 were high, these scenarios were not considered superior due to the large number of variables.
It appears that in Scenario 1 with extra trees or Scenario 3 with multilayer perceptron CS, the weak results were due to the number of data points used in this study. Essentially, these two methods are sensitive to the amount of data, and short-term data can lead to poor results. This is because a small number of data points prevents the model from being well trained, resulting in weak outcomes.
Scatter and Taylor plots with the best scenario selection for each method (with normalized data) are plotted in Figure 6 and Figure 7. The closer the points to the bisector line in the scatter diagram, the closer the optimum performance of the model. According to Figure 6, with the exception of the RF, random tree, and extra tree methods, the other models had an acceptable sediment estimate, since the majority of the data were close to the bisector line, and only in a few limited cases could they be underestimated or overestimated. As can be understood from Figure 6, the two kernel-based methods, including SVR and GPR in close competition, were more consistent in predicting the amount of sediment with considerable accuracy. From the two new methods introduced in this study, the multi-search method was shown to be more accurate than the extra trees method.
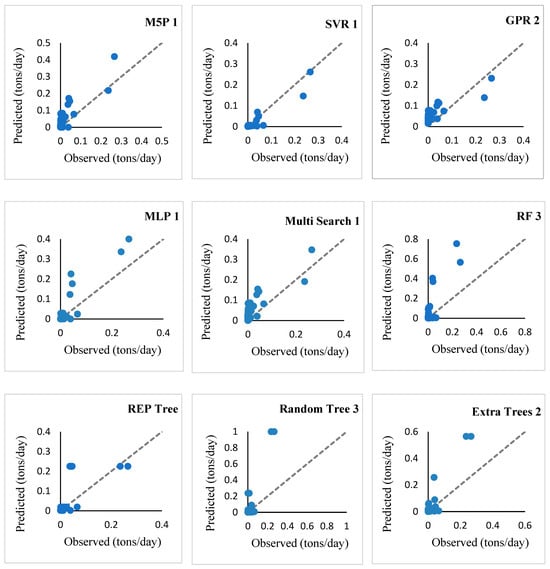
Figure 6.
Scatter plot of the best scenarios of the studied methods for the test data.
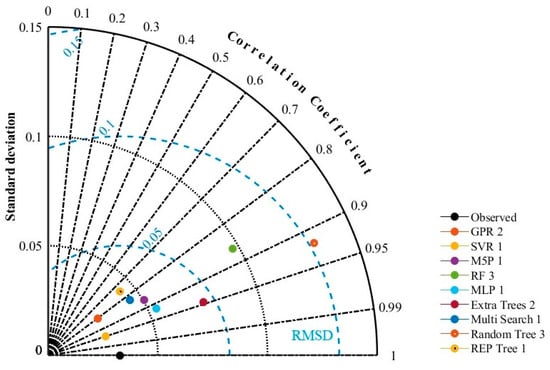
Figure 7.
Taylor diagram for excellent scenarios and models in the test section.
To better understand the results, the Taylor diagram is presented in Figure 7. The Taylor diagram is a two-dimensional graph with three statistics on it. This diagram can provide a brief statistical summary of how the models correspond in correlation, root-mean-square difference, and ratio. Charts are especially useful in assessing different aspects of complex models or measuring the relative proficiency of many other models [65].
According to Figure 7, the standard deviation values of the observed sediment data and the estimated standard sediment deviation of all methods were close to each other, except for the three mentioned methods. This suggests that the results of these methods were more reliable, as shown in the distribution diagram results.
According to Table 3, despite the acceptable correlation of RF Scenario 3 and extra trees Scenario 2 methods, what can be seen from Figure 6 and Figure 7 is the low accuracy of these methods in estimating the amount of SS.
In general, it can be concluded that among the studied scenarios, the first scenario showed the best performance considering the streamflow, and among the researched methods, the SVR method performed best. In other words, kernel data-driven methods had better performance than tree methods. The results of Sattari et al. [66] indicated that the SSL had the most significant effect on the river’s discharge rate. Additionally, accurate flow information is crucial for effectively estimating the amount of SSL. Bagh-e-Kalayeh is located in a part of Qazvin Province that has rich pastures. This is one reason for the lower impact of rainfall than discharge on sedimentation. In other words, rainfall affects SSLs indirectly through discharge.
The values of the statistical sediment characteristics of the test phase for the observational data and data-based methods are presented in Table 4.

Table 4.
Statistical characteristics of the test phase for the observational data and data-based methods (tons/day).
Based on the results of Table 4, the superiority of the SVR-1 method is apparent. Although the SVR-1 method estimated an average of 667 tons per day less than the observed amount of sediment, considering the wide range of numbers, this amount is a reasonable number.
4. Conclusions
The estimation of SSL is essential in water resource engineering and hydrological modeling. The surface water quality is affected by the sediment load. Due to the time-consuming and costly direct methods for estimating the suspended load, artificially intelligent and data-driven approaches can be used. Increasing the amount of SSL reduces the useful volume of the dam reservoir, falsely increasing the water level in the reservoir and reducing the quality of drinking water. For this reason, determining this parameter is very important. In the present study, sediment data, streamflow, and rainfall data from the Bagh-e-Kalayeh hydrometric station from 2002 to 2020 were used to estimate the amount of SS. Modeling using GPR, SVR, M5P tree model, RF, MLP, extra trees, random tree, reduction of pruning error (REPTree), and multi-search (multi-search) methods was used. Three different combinations (scenarios) and some statistical criteria were used to compare the performance of these methods, such as r, RMSE, MAE, and WI. The results showed that, with the exception of the RF-3, random tree-3, and extra trees methods, all other methods had acceptable levels of accuracy when estimating the amount of SS.
A closer look at the results also showed that, despite the good performance of all methods, the SVR-1 method, as an essential data-driven method, was more accurate. Kernel functions appeared to have considerable capability for classifying and separating data, which increased the accuracy of kernel-based methods. Although, in general, the performance of data-driven methods has been higher than that of tree methods, tree methods are more practical and more straightforward for engineers to work with. In this study, the first scenario saw better performances than other scenarios in relation to the river discharge parameter. That is, the effect of discharge on the amount of SS was greater. According to the existing vegetation, precipitation showed its effect on sediment indirectly through runoff. The influence of the regional conditions and the watershed under study affected the accuracy of the models used. By testing the models used in this research in different regions, it is possible to gain a better understanding of the impact of the physical parameters of the watershed on the amount of SS.
The results obtained from this research, when compared with similar studies, such as those by Yadav et al. [14], Choubin et al. [15], and Roushangar and Shahnazi [16], demonstrate that data-driven methods exhibited a high capability in sediment modeling. These methods can be utilized with a high degree of accuracy.
Furthermore, the comparative analysis highlighted the robustness and reliability of data-driven approaches in capturing the complexities of sediment dynamics. This was particularly evident in their ability to handle diverse datasets and produce consistent results across different scenarios. The findings underscore the potential of these methods to enhance predictive accuracy and inform better decision-making in sediment management practices.
One of the main limitations of kernel-based methods is their high complexity and the need for specialized staff. Typically, water managers are reluctant to use such non-practical methods. It should be noted that the results of this study cannot be applied to different climates and different catchments. It is suggested that the methods introduced in this research be measured and evaluated in a variety of dry-to-humid climates and catchments with poor-to-good vegetation. A number of models were used to comprehensively investigate the sedimentary conditions of the region, which led to the study of one station. Therefore, by applying the results of this study to nearby stations, it would be possible to investigate the conditions of the region more precisely. It is suggested that the methods used in this study be carried out in other climates and stations to check their accuracy and efficiency.
In addition, a number of data-driven models were performed to investigate and predict sedimentation at a hydrometric station. The results of this study can be applied to nearby stations in the region. In other words, the basic weakness of this study is that only one hydrometric station was investigated, so the results cannot be generalized to other stations and other regions. It is suggested that the methods used in this study be reproduced in different climates and stations in future studies.
Author Contributions
M.T.S. performed the conceptualization, methodology, validation, writing—original draft preparation, supervision, data curation, software, validation, formal analysis and visualization stages; H.A. and A.M. performed the conceptualization, writing—review and editing, visualization and supervision phases. All authors have read and agreed to the published version of the manuscript.
Funding
This research received no external funding.
Data Availability Statement
The data presented in this study are available on request from the corresponding author due to local restriction.
Conflicts of Interest
The authors declare no conflicts of interest.
Nomenclature
| AI: artificial intelligence | r: Correlation coefficient |
| ANFIS: Adaptive Neuro-Fuzzy Inference System | REPT: reduced error pruning tree |
| ANN: artificial neural network | REPTree: reduced REP tree pruning |
| DT: decision tree | RF: random forest |
| GA: genetic algorithm | RMSE: root mean square error |
| GP: Gaussian process | RT: random tree |
| GPR: Gaussian process regression | SS: suspended sediment |
| MAE: mean absolute error | SSL: suspended sediment load |
| ML: machine learning | SVM: support vector machine |
| MLP: multilayer perceptron network | SVR: support vector regression |
| MLR: multiple linear regression | WI: Wilmot index |
References
- Pandey, M.; Azamathulla, H.M.; Chaudhuri, S.; Pu, J.H.; Pourshahbaz, H. Reduction of time-dependent scour around piers using collars. Ocean Eng. 2020, 213, 107692. [Google Scholar] [CrossRef]
- Tsegaye, L.; Bharti, R. Soil erosion and sediment yield assessment using RUSLE and GIS-based approach in Anjeb watershed, Northwest Ethiopia. SN Appl. Sci. 2021, 3, 582. [Google Scholar] [CrossRef]
- Das, B.; Pal, S.C.; Malik, S. Assessment of flood hazard in a riverine tract between Damodar and Dwarkeswar River, Hugli District, West Bengal. Spat. Inf. Res. 2018, 26, 91–101. [Google Scholar] [CrossRef]
- Sahour, H.; Gholami, V.; Vazifedan, M.; Saeedi, S. Machine learning applications for water-induced soil erosion modeling and mapping. Soil Tillage Res. 2021, 211, 105032. [Google Scholar] [CrossRef]
- Frings, R.M.; Kleinhans, M.G. Complex variations in sediment transport at three large river bifurcations during discharge waves in the river Rhine. Sedimentology 2008, 55, 1145–1171. [Google Scholar] [CrossRef]
- Asadi, M.; Fathzadeh, A.; Kerry, R.; Ebrahimi-Khusfi, Z.; Taghizadeh-Mehrjardi, R. Prediction of river suspended sediment load using machine learning models and geo-morphometric parameters. Arab. J. Geosci. 2021, 14, 1926. [Google Scholar] [CrossRef]
- Varol, İ.S.; Çetin, N.; Kırnak, H. Evaluation of Image Processing Technique on Quality Properties of Chickpea Seeds (Cicer arietinum L.) Using Machine Learning Algorithms. J. Agric. Sci. 2023, 29, 427–442. [Google Scholar] [CrossRef]
- Kisi, O.; Yuksel, I.; Dogan, E. Modelling daily suspended sediment of rivers in Turkey using several data-driven techniques. Hydrol. Sci. J. 2008, 53, 1270–1285. [Google Scholar] [CrossRef]
- Cigizoglu, H.K. Estimation and forecasting of daily suspended sediment data by multilayer perceptrons. Adv. Water Resour. 2004, 27, 185–195. [Google Scholar] [CrossRef]
- Francke, T.; Lopez-Tarazon, J.A.; Schroder, B. Estimation of suspended sediment concentration and yield using linear models, random forests and quantile regression forests. Hydrol. Process. 2008, 22, 4892–4904. [Google Scholar] [CrossRef]
- Azamathulla, H.M.; Ghani, A.A.; Chang, C.K.; Hasan, Z.A.; Zakaria, N.A. Machine learning approach to predict sedimentload—A case study. Clean—Soil Air Water 2010, 38, 969–976. [Google Scholar] [CrossRef]
- Senthil Kumar, A.; Kumar Goyal, M.; Ojha, C.; Swamee, P. Modeling of Suspended Sediment Concentration at Kasol in India Using ANN, Fuzzy Logic, and Decision Tree Algorithms. Expert. Syst. Appl. 2012, 41, 5267–5276. [Google Scholar] [CrossRef]
- Kumar Goyal, M. Modeling of Sediment Yield Prediction Using M5 Model Tree Algorithm and Wavelet Regression. J. Water Resour. Manag. 2014, 28, 1991–2003. [Google Scholar] [CrossRef]
- Yadav, A.; Chatterjee, S.; Equeenuddin, S.M. Prediction of suspended sediment yield by artificial neural network and traditional mathematical model in Mahanadi river basin, India. Sustain. Water Resour. Manag. 2018, 4, 745–759. [Google Scholar] [CrossRef]
- Choubin, B.; Darabi, H.; Rahmati, O.; Sajedi-Hosseini, F.; Kløve, B. River suspended sediment modelling using the CART model: A comparative study of machine learning techniques. Sci. Total Environ. 2018, 615, 272–281. [Google Scholar] [CrossRef]
- Roushangar, K.; Shahnazi, S. Prediction of sediment transport rates in gravel-bed rivers using Gaussian process regression. J. Hydroinformatics 2020, 22, 249–262. [Google Scholar] [CrossRef]
- Zounemat-Kermani, M.; Mahdavi-Meymand, A.; Alizamir, M.; Adarsh, S.; Yaseen, Z. On the complexities of sediment load modeling using integrative machine learning: Application of the great river of Loíza in Puerto Rico. J. Hydrol. 2020, 585, 124759. [Google Scholar] [CrossRef]
- Hazarika, B.; Gupta, D.; Berlin, M. Modeling suspended sediment load in a river using extreme learning machine and twin support vector regression with wavelet conjunction. Env. Earth Sci. 2020, 79, 234. [Google Scholar] [CrossRef]
- Nourani, V.; Kheiri, A.; Behfar, N. Multi-station artificial intelligence based ensemble modeling of suspended sediment load. Water Supply 2022, 22, 707–733. [Google Scholar] [CrossRef]
- Doroudi, S.; Sharafati, A.; Mohajeri, H. Estimation of Daily Suspended Sediment Load Using a Novel Hybrid Support Vector Regression Model Incorporated with Observer-Teacher-Learner-Based Optimization Method. Complex. Hindawi. 2021, 2021, 5540284. [Google Scholar] [CrossRef]
- Cakmak, S.; Demir, T.; Canpolat, E.; Serdar Aytac, A. Evaluation of the effects of precipitation and flow characteristics on suspended sediment transport in mountain-type Mediterranean climate; Korkuteli Stream sample, Antalya, Turkey. Arab. J. Geosci. 2021, 14, 2053. [Google Scholar] [CrossRef]
- Hanoon, M.; Abdullatif, B.; Ahmed, A.; Rezzaq, A.; Birima, A.; El-shafie, A. A comparison of various machine learning approaches performance for prediction suspended sediment load of river systems: A case study in Malaysia. Earth Sci. Inform. 2021, 15, 91–104. [Google Scholar] [CrossRef]
- Dehghani, N.; Vafakhah, M.; Bahremand, A.R. Simulation of streamflow using a hydrological model-distributed wetspa in Kasilian watershed. J. Water Soil. Conserv. 2013, 20, 253–261. [Google Scholar]
- Etedali, H.; Ahmadi, M. Evaluation of various meteorological datasets in estimation yield and actual evapotranspiration of wheat and maize (case study: Qazvin plain). Agric. Water Manag. 2021, 256, 107080. [Google Scholar] [CrossRef]
- Hosseinzadeh, H.; Safarzadeh, D.; Ahmadi, E.; Nabavi, A. Optimization of energy consumption of dairly farms using data envelopment analysis—A case study: Qazvin city of Iran. J. Saudi Soc. Agric. Sci. 2018, 21, 7–228. [Google Scholar]
- Ahmadi, M.; Etedali, H.; Elbeltagi, A. Evaluation of the effect of climate change on maize water footprint under RCPs scenarios in Qazvin plain, Iran. Agric. Water Manag. 2021, 254, 106969. [Google Scholar] [CrossRef]
- Pasban, A. Integrating Terrain and Vegetation Indices for Soil Erosion Estimation in the Amoughin Watershed Using RUSLE Model. Ph.D. Thesis, University of Mohaghegh Ardabili, Ardabil, Iran, 2020. [Google Scholar]
- Raza, A.; Fahmeed, R.; Syed, N.R.; Katipoğlu, O.M.; Zubair, M.; Alshehri, F.; Elbeltagi, A. Performance Evaluation of Five Machine Learning Algorithms for Estimating Reference Evapotranspiration in an Arid Climate. Water 2023, 15, 3822. [Google Scholar] [CrossRef]
- Ramıah Subburaj, S.D.; Vaıthyam Rengarajan, V.; Palanıswamy, S. Transfer Learning based Image Classification of Diseased Tomato Leaves with Optimal Fine-Tuning combined with Heat Map Visualization. J. Agric. Sci. 2023, 29, 1003–1017. [Google Scholar] [CrossRef]
- Dhakate, P.P.; Patil, S.; Rajeswari, K.; Abin, D. Preprocessing and Classification in WEKA Using Different Classifier. Int. J. Eng. Res. Appl. 2014, 4, 91–93. [Google Scholar]
- Rasmussen, C.E.; Williams, C.K., I. Gaussian Processes for Machine Learning (Adaptive Computation and Machine Learning Series); MIT Press: Cambridge, MA, USA, 2005. [Google Scholar]
- Neal, R.M. Monte Carlo implementation of Gaussian process models for Bayesian regression and classification. arXiv 1997, arXiv:physics/9701026. [Google Scholar]
- Kuss, M. Gaussian Process Models for Robust Regression, Classification, and Reinforcement Learning. Ph.D. Thesis, Technischen Universität, Darmstadt, Germany, 2006. [Google Scholar]
- Pal, M.; Deswal, S. Modelling pile capacity using Gaussian process regression. Comput. Geotech. 2010, 37, 942–947. [Google Scholar] [CrossRef]
- Boser, B.E.; Guyon, I.M.; Vapnik, V.N. A training algorithm for optimal margin classifiers. In Proceedings of the 5th Annual ACM Workshop on COLT, Pittsburgh, PA, USA, 27–29 July 1992; Haussler, D., Ed.; pp. 144–152. [Google Scholar]
- Vapnik, V.N. The Nature of Statistical Learning Theory; Springer: New York, NY, USA, 1995; 314p. [Google Scholar]
- Pal, M. M5 model tree for land cover classification. Int. J. Remote Sens. 2006, 27, 825–831. [Google Scholar] [CrossRef]
- Demirci, M. Prediction of Precipitation Flow Relationship Using Support Vector Machines and M5 Decision Tree Methods. DUMF Muhendis. Derg. 2019, 10, 1113–1124. [Google Scholar]
- Wang, Y.; Witten, I.H. Inducing model trees for continuous classes. In Proceedings of the Ninth European Conference on Machine Learning, Prague, Czech Republic, 23–25 April 1997; Springer: Berlin/Heidelberg, Germany, 1997. [Google Scholar]
- Larose, D.T. Discovering Knowledge in Data: An Introduction to Data Mining; John Wiley & Sons: Hoboken, NJ, USA, 2005. [Google Scholar]
- Quinlan, J.R. Learning with Continuous Classes. In Proceedings of the 5th Australian Joint Conference on Artificial Intelligence, Hobart, Tasmania, 16–18 November 1992; World Scientific: Singapore, 1992. [Google Scholar]
- Breiman, L. Application and analysis of random forests and machine learning. J. Water Manag. 2001, 15, 5–32. [Google Scholar]
- Özen, H.; Bal, C. A study on missing data problem in random Forest. Osman. J. Med. 2020, 42, 103–109. [Google Scholar] [CrossRef]
- Evans, J.S.; Cushman, S.A. Gradient modeling of conifer species using random forests. Landsc. Ecol. 2009, 24, 673–683. [Google Scholar] [CrossRef]
- Verikas, A.; Gelzinis, A.; Bacauskiene, M. Mining data with random forests: A survey and results of new tests. Pattern Recognit. 2011, 44, 330–349. [Google Scholar] [CrossRef]
- Beale, R.; Jackson, T. Neural Computing; Adam Hilger: Cape Cod, MA, USA, 1990. [Google Scholar]
- Cybenko, G. Approximation by superpositions of a sigmoidal function. Math Control Signal 1989, 2, 303–314. [Google Scholar] [CrossRef]
- Tang, Z.; De Almeida, C.; Fishwick, P.A. Time series forecasting using neural networks vs Box–Jenkins methodology. Simulation 1991, 57, 303–310. [Google Scholar] [CrossRef]
- Hornik, K.; Stinchcombe, M.; White, H. Multilayer feedforward networks are universal approximators. Neural Netw. 1989, 2, 359–366. [Google Scholar] [CrossRef]
- Ruder, S. An overview of gradient descent optimization algorithms. arXiv 2016, arXiv:1609.04747. [Google Scholar]
- Kingma, D.P.; Ba, J. Adam: A method for stochastic optimization. arXiv 2014, arXiv:1412.6980. [Google Scholar]
- Shadkani, S.; Abbaspour, A.; Samadianfard, S.; Hashemi, S.; Mosavi, A.; Band, S.S. Comparative study of multilayer perceptron-stochastic gradient descent and gradient boosted trees for predicting daily suspended sediment load: The case study of the Mississippi River U.S. Int. J. Sediment Res. 2021, 36, 512–523. [Google Scholar] [CrossRef]
- Breiman, L.; Friedman, J.; Stone, C.J.; Olshen, R. Classification and Regression Trees (Wadsworth Statistics/Probability); Chapman and Hall/CRC: Boca Raton, FL, USA, 1984. [Google Scholar]
- Okoro, E.E.; Obomanu, T.; Sanni, S.E.; Olatunji, D.; Igbinedion, P. Application of artificial intelligence in predicting the dynamics of bottom hole pressure for under-balanced drilling: Extra tree compared with feed forward neural network model. Petroleum 2022, 8, 227–236. [Google Scholar] [CrossRef]
- Geurts, P.; Ernst, D.; Wehenkel, L. Extremely randomized trees. Mach. Learn. 2006, 63, 3–42. [Google Scholar] [CrossRef]
- John, V.; Liu, Z.; Guo, C.; Mita, S.; Kidono, K. Real-Time Lane Estimation Using Deep Features and Extra Trees Regression; Springer International Publishing: Cham, Switzerland, 2016; pp. 721–733. [Google Scholar] [CrossRef]
- Reutemann, P.; Rijn, J.; Frank, E. 2016. Available online: https://github.com/fracpete/multisearch-weka-package (accessed on 15 May 2024).
- Chang, C.-C.; Lin, C.-J. LIBSVM: A library for support vector machines. ACM Trans. Intell. Syst. Technol. 2011, 2, 1–27. [Google Scholar] [CrossRef]
- Kalmegh, S. Analysis of WEKA Data Mining Algorithm REPTree, Simple Cart and RandomTree for Classification of Indian News. Int. J. Innov. Sci. Eng. Technol. 2015, 2, 438–446. [Google Scholar]
- Mohamed, W.; Salleh, M.; Omar, A. A comparative study of reduced error pruning method in decision tree algorithms, control systems, computing and engineering (ICCSCE). In Proceedings of the 2012 IEEE International Conference on Control System, Computing and Engineering, Penang, Malaysia, 23–25 November 2012; pp. 392–397. [Google Scholar]
- Chen, W.; Hong, H.; Li, S.; Shahabi, H.; Wang, Y.; Wang, W. Flood susceptibility modelling using novel hybrid approach of reduced-error pruning trees with bagging and random subspace ensembles. J. Hydrol. 2019, 575, 864–873. [Google Scholar] [CrossRef]
- Pfahringer, B. Random Model Trees: An Effective and Scalable Regression Method; Working Paper Series; University of Waikato: Hamilton, New Zealand, 2010. [Google Scholar]
- Ajayram, K.A.; Jegadeeshwaran, R.; Sakthivel, G.; Sivakumar, R.; Patange, A.D. Condition monitoring of carbide and non-carbide coated tool insert using decision tree and random tree—A statistical learning. Mater. Today Proc. 2021, 46, 1201–1209. [Google Scholar] [CrossRef]
- Willmott, C.J. On the validation of models. Phys. Geogr. 1981, 2, 184–194. [Google Scholar] [CrossRef]
- Taylor, K. Summarizing multiple aspects of model performance in a single diagram. J. Geophys. Res. 2001, 106, 7183–7192. [Google Scholar] [CrossRef]
- Sattari, M.T.; Rezazadeh, J.A.; Safdari, F.; Ghahramanian, F. Performance evaluation of m5 tree model and support vector regression methods in suspended sediment load modeling. J. Water Soil Resour. Conserv. 2016, 6, 109–124. [Google Scholar]
Disclaimer/Publisher’s Note: The statements, opinions and data contained in all publications are solely those of the individual author(s) and contributor(s) and not of MDPI and/or the editor(s). MDPI and/or the editor(s) disclaim responsibility for any injury to people or property resulting from any ideas, methods, instructions or products referred to in the content. |
© 2024 by the authors. Licensee MDPI, Basel, Switzerland. This article is an open access article distributed under the terms and conditions of the Creative Commons Attribution (CC BY) license (https://creativecommons.org/licenses/by/4.0/).