Abstract
The formation of layering during the sedimentation process of tailings makes it of great significance to investigate tailings and to analyze their susceptibility to flow liquefaction. In this study, homogeneous iron ore tailings (IOTs) specimens were reconstituted with pure coarser grains and pure finer grains sampled from a typical tailings storage facility. Additionally, an improved sample preparation method was developed to create heterogeneous IOTs samples containing a fine-grained interlayer with different thicknesses and dip angles using the above two materials. A series of standard drained and undrained triaxial compression tests were conducted to investigate the effects of the presence of a layered structure and its geometry on the stress–strain responses, and the properties of the IOTs under the critical state soil mechanics framework, which has been widely adopted in the analysis of liquefaction in mine tailings. The results showed that for the two homogeneous specimens, unique critical state lines (CSLs) can be identified, but they have different degrees of curvature in the e-ln p′ plane, causing a decrease in the susceptibility to liquefaction with increasing fines content. With increasing fine-grained interlayer thickness (FGLT) within 0–40 mm, the critical state friction angle (φcs) decreased steadily, while the CSLs in the e-ln p′ plane translated upward. This may be because the morphology of the microstructure within the fine-grained interlayer restricted the compression of the intergranular pores. With increasing fine-grained interlayer dip angle (FGLA) within the range 0–30°, φcs decreased until a discontinuity occurred at a dip angle of 15°, while the CSLs in the e-ln p′ plane rotated clockwise through a pivot point. Different FGLAs could change the contact area between the different layers and the axial distribution of the fine-grained interlayer and thus may further contribute to the rotation of the CSLs.
1. Introduction
Tailings are man-made geo-materials formed during ore extraction and beneficiation. They are considered to be geologically young materials with angular-shaped grains and intermediate gradings, and they are often classified as sandy silts or silts [1]. The most common method of disposing of tailings is to construct a tailings storage facility (TSF), in which a mixture of crushed rock fines and processed water is deposited in tailings impoundments behind tailings dams [2]. Tailings often have a higher risk of failure than other natural granular soils due to their small particle size and high water content [3]. One of the most common causes of the failure of tailings dams is liquefaction induced by monotonous loading, which may also aggravate the initial failure of the TSF caused by other factors such as heavy rainfall [4]. The static liquefaction of mine tailings has caused numerous TSF failures during the last 40 years, for instance, the 1985 Stava TSF failure in Italy [5], the 1998 Aznalcóllar TSF failure in Spain [6], the 2001 Merriespruit TSF failure in South Africa [7], the 2014 Mount Polley TSF failure in Canada [8,9], the 2015 Fundao TSF failure in Brazil [10], the 2018 Cadia TSF failure in Australia [11,12], and the most recent Brumadinho TSF failure in Brazil in 2019 [13]. The consequences of these accidents were fatal and environmentally devastating. The 2015 Fundao TSF failure and the 2014 Mount Polley TSF failure in Brazil and Canada, respectively, are considered to be unprecedented environmental disasters. In this context, experts have highlighted the importance of understanding the mechanical behavior of tailings to advance the design and condition assessment of TSFs [14].
The layered structures or lenticles, usually consisting of finer tailings grains, are formed during the sedimentation processes and may change the normal sedimentation pattern of tailings impoundments [15,16]. Høeg et al. [17] obtained obvious visual evidence of layering within intact silty sand tailings specimens after oven drying. The block gold tailings specimens did not appear to be entirely homogenous in the photographs presented by Chang et al. [18]. More recently, a variation in the gradation from the top to the low portion of high-quality block iron ore tailings (IOTs) samples was reported by Reid and Fanni [19], although the blocks were determined to be fairly uniform through visual estimation compared with the layering observed in other tailings [20]. These layered structures with poor mechanical properties may contribute to the anisotropy of tailings [21,22]. Chen et al. [23] developed a modified direct shear apparatus and showed that anisotropy has a substantial effect on the peak shearing strength of tailings sand, leading to a variation in the peak friction angle of within 10°. Chen et al. [24] reported that the undrained shearing strength, internal friction angle, and cohesion decreased with increasing dip angles for copper tailings specimens containing fine-grained interlayers with dip angles in the range of 0–60°. Thus, it seems clear that the existence of layering in tailings materials cannot be excluded from the analysis of the mechanics of tailings and their fabric.
By introducing the critical state soil mechanics (CSSM) framework, the mechanical responses of tailings under monotonic loading conditions and their susceptibility to liquefaction have been intensively investigated [4,25,26,27,28,29,30,31,32,33,34,35,36,37,38]. Reconstituted specimens have often been used as intact specimens in previous studies since most tailings are impossible to obtain as they may collapse under small disturbances as a result of the inflow of water during excavation and their high porosity. Additionally, the preservation of processed water is hard to achieve [39]. However, a potential limitation of the cited studies is the lack of detailed consideration of layering, especially the geometry properties of the interlayered structures. Baziar and Dobry [40] found that different unique critical state lines (CSLs) can be defined for layered and homogenous reconstituted silty sand specimens. In addition, the layered reconstituted specimens exhibited behaviors more similar to that of a layered intact specimen in situ. Similar findings have been reported for tailings specimens. Høeg et al. [17] compared the mechanical responses of layered tube tailings samples with those of tailings reconstituted using moist tamping (MT), water pluviation (WP), and slurry deposition (SD) methods. It was found that the tube specimens exhibited a much dilative response, while the reconstituted specimens exhibited different stress–strain values and shearing strengths. Chang et al. [18] discovered that tailings reconstituted using the MT and SD methods resulted in specimens that tended toward a different CSL compared with tailings trimmed from layered block samples. In a recent study, Reid and Fanni [19] reported that the CSLs for intact block silty IOTs samples fell into the similar shape and location towards that for a sample created using the MT method. However, greater scatter in CSLs was observed for intact specimens in their final states, which is thought to result from the presence of layering. The CSSM framework based on the CSL derived through reconstitution (for instance, the MT sample preparation method) has been extensively adopted in practical TSFs failure investigations [8,12,41]. Thus, addressing the roles of a layered structure and its geometry pattern during the reconstitution processes of tailings is of great significance. The lack of published evidence of the influence of fine-grained interlayers on the mechanics and critical states of tailings grains may cause uncertainty in the assessment of static liquefaction in TSFs.
In this study, a series of standard drained and undrained triaxial compression tests were conducted to investigate the influence of a fine-grained interlayer on the mechanical behavior of the IOTs under the CSSM framework. In the first stage, the mechanics of samples consisting of pure coarser tailings grains and pure finer tailings grains were analyzed. An improved sample preparation method was then used to create IOTs specimens containing a fine-grained interlayer with different thicknesses and dip angles. Comparisons were made between homogeneous and heterogeneous specimens. We focused on the stress–strain behavior, the critical states, and the potential to flow liquefaction under monotonous loading conditions. Additionally, the possible underlying mechanism driving the influence of the fine-grained interlayers on the critical state properties of the IOTs samples was analyzed.
2. Materials and Testing Procedures
2.1. Materials Tested
The IOTs used in this study were collected from the beach (approximately 150 m from the tailings dam) of a typical TSF in Panzhihua City, Sichuan Province, China (Figure 1a). Detailed fieldwork before testing revealed that fine-grained layered structures or tailings lenticles with different thicknesses and dip angles were present within the depth range of 30 cm to 2 m from the surface (Figure 1b–d), which reflected the sedimentary state and the anisotropy of the in situ IOTs. Coarser tailings particles (denoted as IOT-C) and finer tailings particles (denoted as IOT-F) were collected from two adjacent layers within the 50 cm to 1.5 m depth range in a bore pit to represent the physical properties of the coarse-grained tailings particles and the fine-grained tailings interlayer.
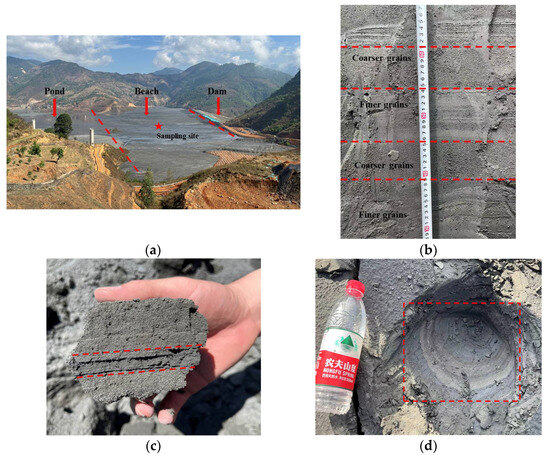
Figure 1.
Tailings storage facility in Panzhihua City: (a) view of the sampling site, and (b–d) fine-grained interlayered structures with different geometries in the sampling site.
The index properties for the two types of tailings are presented in Table 1. The particle size distributions (PSDs) of the IOTs were analyzed using the standard sieving test and the hydrometer test (Figure 2). The term fines denotes tailings particles with sizes of <0.075 mm, and the term fines content denotes the percentage of the total dry mass of the tailings accounted for by the fines. It should be noted that the PSD of the IOT-C is similar to that of the tailings sampled from the upper beach, while the soil grading of the IOT-F is similar to that of the tailings sampled near the pond. Table 2 and Table 3 present the mineralogies and chemical composition of both tailings. The predominant minerals in the IOT-C and IOT-F were plagioclase, chlorite, pyroxene, and quartz. A small quantity of iron oxide minerals was also present, and the iron oxide mineral contents for IOT-F were slightly higher. The quantities of quartz, chlorite, and plagioclase contents decreased slightly with increasing fines content. The particle shape characteristics of the two IOTs samples were qualitatively and quantitatively investigated using scanning electron microscopy (SEM) and the QICPIC apparatus. The SEM images presented in Figure 3 show that the IOTs particles are granules. The ridge corners of some of the particles are sharp. These particles were determined to be sub-angular to angular. The mean aspect ratio, mean sphericity, and mean convexity of the IOT-C and IOT-F are quite similar despite their different grading characteristics and mineralogies. The evolution of the particle morphology indicates that IOT-F particles that constitute the fine-grained interlayer are more spherical and regularly shaped, while the IOT-C particles that constitute the adjacent layers are more angular.

Table 1.
Index properties of the IOT-C and IOT-F.
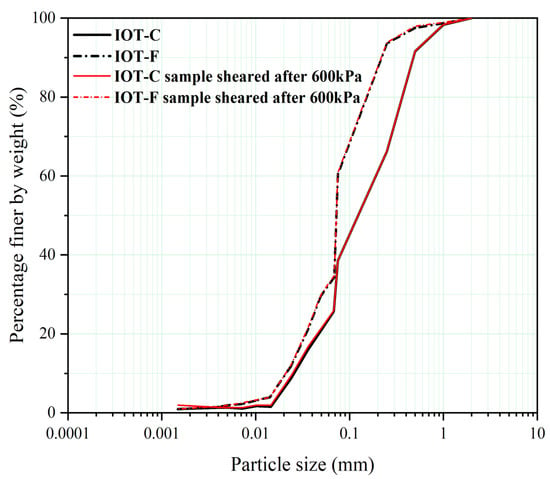
Figure 2.
Particle size distribution curves of the tested tailings.

Table 2.
X-ray diffraction analysis results for the IOT-C and IOT-F.

Table 3.
X-ray fluorescence analysis results for the IOT-C and IOT-F.
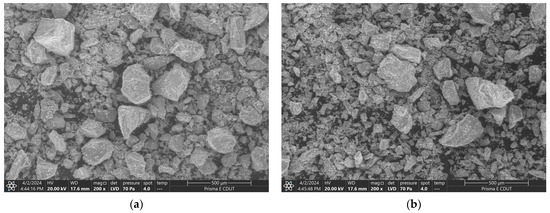
Figure 3.
SEM images of the untested IOTs particles (200×): (a) IOT-C and (b) IOT-F.
2.2. Standard Triaxial Compression Test
The required dimensions of all of the triaxial specimens were a diameter of 39.1 mm and a height of 80 mm. Since in situ intact specimens were difficult to obtain, all of the samples were prepared using the wet compaction method. Although WP and SD can simulate the initial state of tailings during the water sedimentation process in a more reasonable way, the wet compaction method can create specimens varying from very loose states to extremely dense states, which allows the loosest samples to be created to investigate their liquefaction potential (Figure 4). Additionally, the wet compaction technique is recommended to enable reliable measurement of the critical states of granular soils [42]. In this paper, the water content is the water content by mass. Additionally, mineral processing activities rarely use distilled water during processing. Most tailings slurries contain quantities of dissolved solids, such as salt. However, the preservation of processed water in tailings slurries is hard to achieve in laboratories. As a consequence, de-aired and de-ionized distilled water was used throughout the experimental program. It should be noted that the geo-chemical processes in mine tailings have a great influence on their geo-mechanical behaviors [43,44,45]. However, due to the long-term effects of the geo-chemical process, it is difficult to reproduce such processes in laboratories.
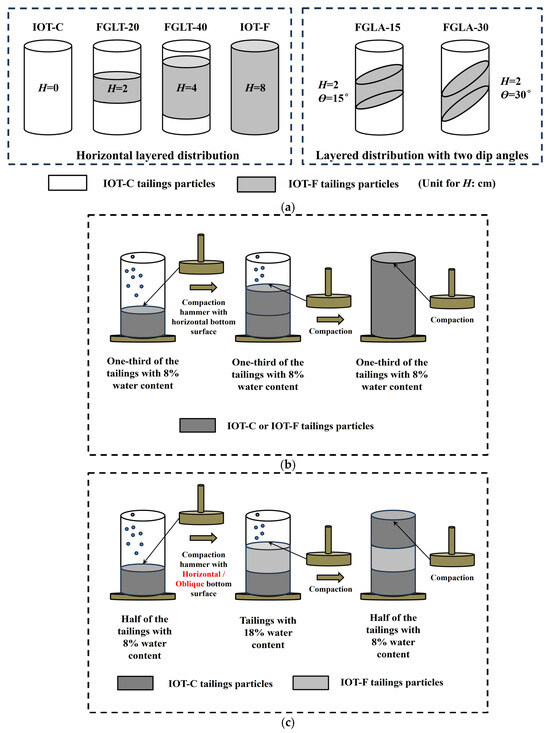
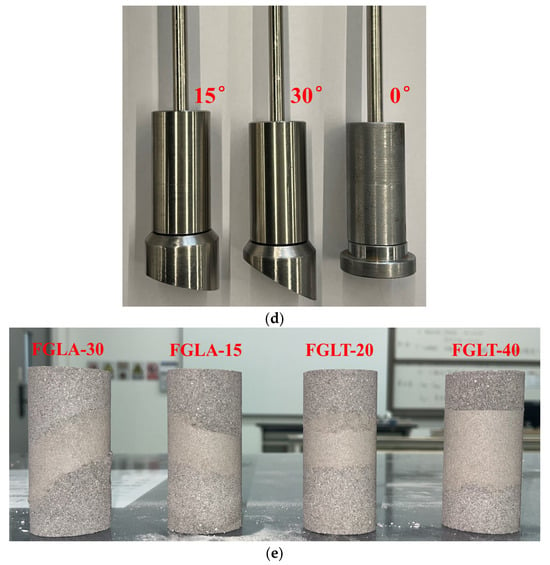
Figure 4.
Sample preparation procedures for the IOTs specimens: (a) target distribution of a fine-grained interlayer; (b) preparation procedure for the IOT-C and IOT-F; (c) preparation procedure for the FGLT-20, FGLT-40, FGLA-15, and FGLA-30 (only the horizontal layered distribution is presented for simplification); (d) traditional and improved tamping rods with different angled oblique surfaces; and (e) specimens containing interlayers after preparation.
The initial void ratios (e0) of homogeneous specimens without layered structures (created using pure IOT-C particles or pure IOT-F particles) were set to approximately 0.78–0.93 (Table 4), and the initial water content was set to approximately 8%. This was consistent with the in situ porosity (e = 0.7–1.1) and the in situ water content (7–30%) of the IOTs and was designed to avoid possible strain localization. The accuracy of the initial void ratios was ascertained using Equations (1) and (2). The test results for which the two void ratio values had a difference of greater than 0.02 were discarded as advocated by Li and Coop [27]. The average values of e0 are reported in Table 4.
where e0 is the initial void ratio, Gs is the specific gravity, γw is the unit weight of water, γi is the initial bulk unit weight, wi is the initial water content, wf is the final water content, and εv is the volumetric strain during the triaxial tests.

Table 4.
Summary of triaxial test results for the homogeneous IOTs specimens.
For the specimens with a fine-grained interlayered structure, the details of the sample preparation procedures are presented in Figure 4a,c. Fine-grained interlayers with varying dip angles ranging from 0° to 15° were discovered from in situ IOTs. However, some quite sharp dip angles (over 15°) were also found inside the tailings impoundment, which was mainly due to the asynchronous discharge of tailings slurries from different pipe lines during the spigot deposition. As a consequence, a traditional tamping rod and two newly designed tamping rods with angles between the oblique faces of 15° and 30° were used (Figure 4d). The finer particles (IOT-F) inside the interlayer were compacted to an initial void ratio of around 0.9 using a higher moisture content of 18%. Under the condition of such a high water content of around 18%, the particle skeleton of the fine-grained interlayer maintained a non-free flow pattern. The artificial errors caused by the gravity-induced moisture content changes were reduced. However, the saturation state was not reached. When it comes to the preparation of adjacent layers, it should be noted that minor changes in the moisture content was inevitable, which is one of the experimental errors. The coarser tailings particles (IOT-C) outside the interlayer were created with an initial void ratio of around 0.9 and a lower moisture content of 8%. Each layer was compacted, and the upper surface was scraped with a knife before the formation of the next layer. It should be noted that the determination of the initial void ratios of the heterogeneous specimens (i.e., the tailings specimens with a fine-grained interlayered structure) was difficult. The calculations were also conducted using Equations (1) and (2). In this study, if the difference in the initial void ratio values within the interlayer and the coarser particles outside the interlayer was greater than 0.02, the specimen was discarded. The average initial void ratios of the coarser particles and the interlayer were taken as the final result (Table 5). The terms FGLT-20 and FGLT-40 in Table 5 denote specimens with a fine-grained interlayer with thicknesses of 20 mm and 40 mm, respectively. The dip angles of the FGLT-20 and FGLT-40 remained at 0°. The terms FGLA-15 and FGLA-30 denote specimens with a fine-grained interlayer with a thickness of 20 mm and dip angles of 15° and 30°, respectively.

Table 5.
Summary of triaxial test results for the IOTs specimens containing a fine-grained interlayer.
For all of the triaxial tests, the specimens were flushed with CO2 and de-aired distilled water first. Then, they were saturated under a back pressure of 300–500 kPa until a B value of at least 0.98 was achieved. During the consolidation stage, the samples were all isotopically compressed to 100–600 kPa, and then sheared under drained or undrained conditions at an axial strain rate of 0.1% per minute. After the triaxial compression tests, the end-of-test soil freezing technique [46] was applied to the specimens to determine the final water contents by mass (wf values in Equation (2)) to increase the accuracy of the initial void ratio measurement.
3. Shearing Behavior of Iron Ore Tailings without a Fine-Grained Interlayer
3.1. Stress–Strain Responses
The stress–strain data for the IOT-C and IOT-F under undrained conditions are presented in Figure 5a,b. As the initial void ratios of the specimens were around 0.78–0.93 in the loose state, which were quite close to the maximum void ratios, nearly all of the stress–strain curves had similar shapes. The initial deviatoric stresses reached the peak points at 1–2.5% of the axial strain, and subsequently, strain-softening behaviors were observed, indicating the potential for static liquefaction. All of the samples were sheared to 18–20% axial strain to reach their critical states. However, a constant deviatoric stress was still not reached in some of the tests. Figure 5c,d presents the pore water pressure change responses. All of the specimens contracted at the start of shearing, and there was a sharp increase in the pore water pressure, causing a decrease in the deviatoric stresses. With increasing axial strain, the pore water pressure reached the peak point and remained constant, indicating that these samples had reached critical states (CS) at around 20% strain. The brittle index (IB) [47] was used to quantify the reduction in the undrained shearing strength of the IOTs with strain-softening behavior:
where qp and qcs are the deviatoric stresses at the peak points and critical states, respectively. As can be seen from Figure 9b, the IB value decreased with increasing effective confining pressure, indicating that larger and faster deformation often occurred after the initiation of flow instability under lower confining stresses. The IOT-F with a higher fines content had higher IB values than the coarser tailings at similar initial densities and stress levels. For the drained tests, the stress–strain curves of both tailings exhibited a ductile response accompanied by contractive behavior, and the peak stresses occurred at approximately 15–20% axial strain (Figure 5e,f). The volumetric strains were initially contractive, and with increasing axial strain, all of the loose specimens tended to be stable. This was considered in the critical state analysis (Figure 5g,h).
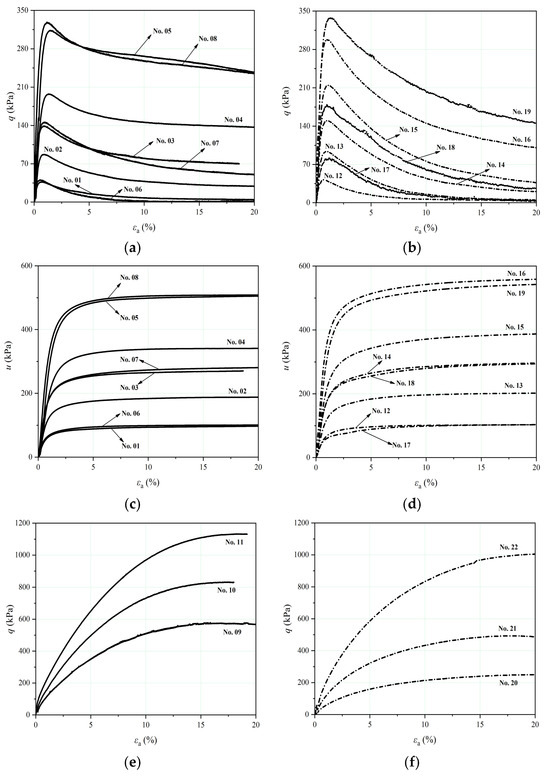
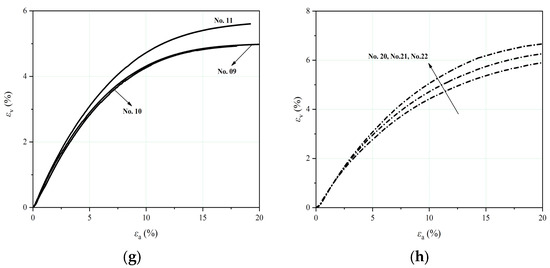
Figure 5.
Triaxial test data for the IOTs without a fine-grained interlayer: (a,b) undrained stress–strain curves for the IOT-C and IOT-F, (c,d) pore water pressure responses for the IOT-C and IOT-F, (e,f) drained stress–strain curves for the IOT-C and IOT-F, and (g,h) volumetric strain responses for the IOT-C and IOT-F.
3.2. Stress Paths and Critical States
The stress paths for the IOT-C and IOT-F in the q-p’ plane are shown in Figure 6a,b. The end points for the IOT-C define a unique CSL with a gradient (Mc) of 1.431, so the angle of the shearing resistance in the critical state (φcs) is 35.29°. For the IOT-F, a unique CSL with a gradient of 1.343 (φcs = 33.28°) can still be identified. The φcs value of the IOT-C is slightly higher than that of the IOT-F. This may be due to the lower fines content, sphericity, and aspect ratio and higher convexity of the IOT-C. Since the critical state friction angles are principally controlled by soil grading, particle morphologies, and inter-particle sliding friction, the φcs values of both materials are quite close overall, which is probably due to the similar mineralogies and similar angular to sub-angular tailings particle shapes of all of the particle sizes. This is similar to the findings of Li and Coop [27] on the critical states of Panzhihua IOTs with natural gradings.
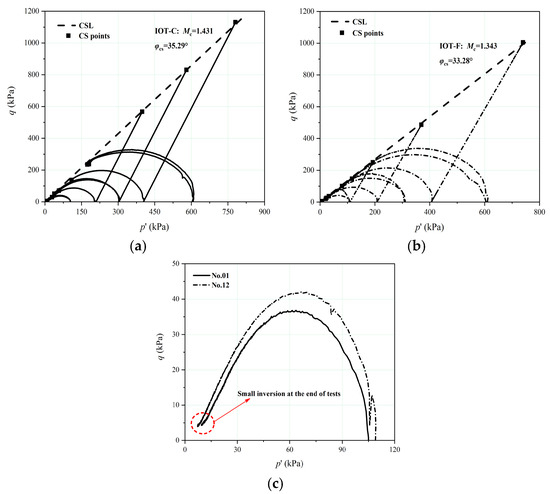
Figure 6.
Stress paths and critical state lines for the IOTs without a fine-grained interlayer in the q-p′ plane: (a) all tests for the IOT-C, (b) all tests for the IOT-F, and (c) the stress paths of test sample nos. 01 and 12.
As can be seen from Figure 6a,b, the shapes of the undrained stress paths of both IOTs specimens are quite similar (C-shaped), indicating that contraction occurred at all of the stress levels. Severe strain-softening behavior and liquefaction behavior were observed in the loosest samples (Nos. 01 and 12) when they were sheared at 100 kPa, and q and p′ at the end of the tests were quite close to the origin of coordinates. Their stress paths tended to exhibit a small amount of inversion at the end of the tests (Figure 6c), which was probably due to the lateral restraint of the rubber membrane at axial strain of around 20%. Carrera et al. [5] determined that true liquefaction occurred in Stava tailings when the confining stresses were equal to the pore pressures, which approaches to the definitions reported by different researchers [48,49]. Similar patterns of liquefaction behavior were also observed by Li and Coop [27] for the loosest IOTs from the upper beach when sheared at 50 kPa.
The undrained and drained shearing stress paths and the CSLs in the e-ln p′ plane for the IOT-C and IOT-F are shown in Figure 7a,b. The CSLs obtained were fitted based on a power law function (Equation (4)) as suggested by Been and Jefferies [42]:
where a is the intercept of the CSL, b is the initial slope, and c is the exponent that controls the curvature. p′ref was set to 100 kPa. Among the three parameters, b and c controls the curvature of the CSLs. When the initial state (e0, p′0) lies above the CSL, the IOTs are more prone to flow liquefaction and strain-softening behaviors may occur. However, if the initial state lies on the dry side of the CSL, the IOTs are less likely to liquefy and strain-hardening behaviors may occur. The end points of the tests defined a unique CSL for both materials, despite some scatter, which means that residual differences in the initial void ratios after isotropic compression can be erased by triaxial shearing. Curved CSLs were identified. For IOT-C and IOT-F, the b values were 0.06 and 0.223, respectively. So, the initial slope for IOT-C was less curved at low p′ values. However, the c value for IOT-C (c = 0.45) was much larger than that for IOT-F (c = 0.17), which means that the CSL for IOT-C became more curved than IOT-F in higher stress levels. The evolution of the shapes of the CSLs is similar to the findings of Li and Coop [27]. The PSDs of the IOTs before and after triaxial shearing (Figure 2) demonstrated that no particle breakage occurred. This proves that particle crushing is not a necessary feature of a curved CSL for tailings materials, which has also been reported by Carrera et al. [5]. However, the gold tailings investigated by Bedin et al. [26] underwent substantial breakage during triaxial shearing.
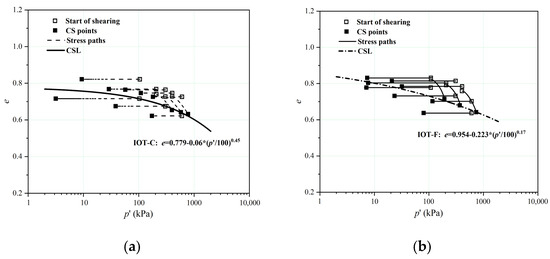
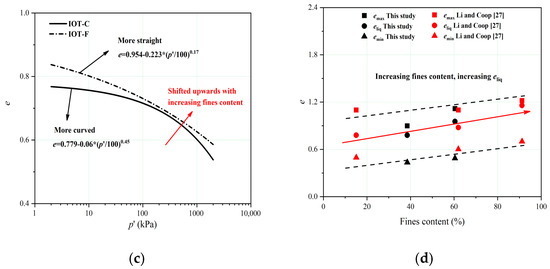
Figure 7.
CSLs for the IOTs without a fine-grained interlayer in the e-ln p′ plane: (a) all tests for the IOT-C, (b) all tests for the IOT-F, (c) relative locations of the CSLs, and (d) void ratios of the samples for different states.
The location of the CSL controls the susceptibility of the IOTs to liquefaction. The relative positions of the CSLs for the IOTs in this study only shifted slightly upward as the fines content increased (Figure 7c). This is similar to the findings of Li and Coop [27]. However, the evolution of the location of the CSLs in the volumetric space contradicts the results of some recent studies on Brazilian IOTs [50,51] and copper tailings [52], in which the CSLs shifted downward with increasing fines content. This may be the result of differences in the PSDs, mineralogies, and grain morphologies of the tested soils. Previous researchers have reported that the relative location of the CSLs is controlled by the fines content. The CSLs of sand–silt mixtures are located below those of clean sand when fines were added until a reverse trend was observed [53]. The grading that produced the lowest CSL location was defined as the transitional fines content (TFC) [54]. The TFC for sand–silt mixtures analyzed by Thevanayagam et al. [54] was 40%, and the TFC for fluorite ore tailings reported by Carrera et al. [5] was 50%. Fourie and Papageorgiou [55] did not observe a change in the downward movement of the CSLs of gold tailings even for a fines content of 60%. The major change in the CSL in this study was the change in its shape from curved to more straight with increasing fines content. Since the natural gradings of the IOT-C and IOT-F were original and tended to translate, the application of a framework based on the TFC may not be appropriate in this study.
It is generally accepted that soils with in situ states located above the CSL in the e-ln p’ plane, i.e., with positive state parameters, are more prone to static liquefaction [56]. However, the CSLs for sandy soils and tailings often tend to be non-linear at lower stresses [57,58], which may create problems in applying the state parameter [5]. The curved CSLs may give rise to a change in the susceptibility to liquefaction as the stress level increases [26]. The void ratio at the horizontal asymptote of the CSL (eliq) is a limit above which true liquefaction must occur [5]. Figure 7d illustrates the relationships between the eliq, emax, emin, and fines content for the IOT-C and IOT-F, as well as another finding for the IOTs in the same region. The susceptibility to liquefaction of Panzhihua IOTs decreased with increasing fines content. The low final p′ value of test sample no. 01 is because the end state is located above eliq. Since the initial states of nearly all of the specimens in this study were located on the wet side of the CSL and below the horizontal asymptote, significant strain-softening behavior was observed, which is often referred to as flow instability or flow failure. To summarize, the susceptibility to liquefaction of Panzhihua IOTs decreased steadily with increasing fines content. While for the Brazilian IOTs [50,51] and copper tailings [52] in the previous analysis, the potential to liquefaction seemed to increase with increasing fines content. This opposite trend may be the result of the different origins of the tailings grains. Another important finding was reported in the critical state analysis of fluorite tailings [5] and gold tailings [55] with artificial gradings, where the susceptibility to liquefaction firstly increased with increasing fines content until a fines content of 50% to 60% was reached, then the susceptibility to liquefaction started to decrease with increasing fines content.
4. Shearing Behavior of Iron Ore Tailings Containing a Fine-Grained Interlayer
4.1. Effect of the Layer Thickness
Figure 8 presents the stress–strain data for the IOTs specimens containing a fine-grained interlayer with two different thicknesses (FGLT-20 and FGLT-40). Some of the triaxial test results for the homogeneous samples are also listed for comparison. IOT-C denotes the specimens with an interlayer thickness of 0 mm, and IOT-F denotes the specimens with an interlayer thickness of 80 mm. For the undrained tests, strain-softening behavior and a corresponding sharp increase in the pore water pressure were observed in all of the tests (Figure 8a,b), which is similar to the findings for the IOT-C and IOT-F. The peak undrained deviatoric stresses for the IOTs containing an interlayer with different thicknesses remained roughly unchanged despite some fluctuations (Figure 9a). Nevertheless, the IB values increased steadily with increasing layer thickness for similar soil densities and stress levels (Figure 9b), indicating that the presence of a fine-grained interlayer may deteriorate the stability of loose tailings and may contribute to the flow instability and the larger deformation under undrained states. This trend intensified with increasing layer thickness. For the drained tests, the stress–strain curves for the FGLT-20 and FGLT-40 exhibited a ductile response accompanied by contractive behavior (Figure 8c). The volumetric strains reached stability at the end of the tests, while εv in the critical states increased with increasing layer thickness under the same effective confining stress (Figure 8d).
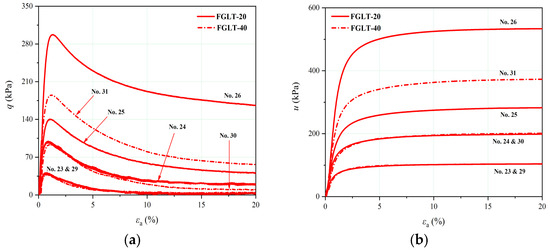
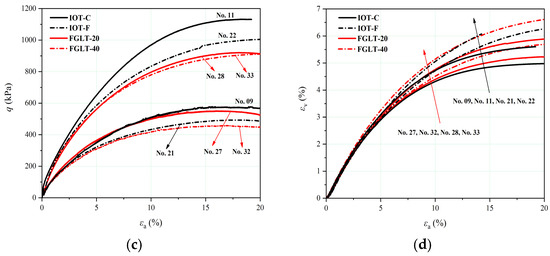
Figure 8.
Triaxial test data for the IOTs containing a fine-grained interlayer with different thicknesses: (a) undrained stress–strain curves, (b) pore water pressure responses, (c) drained stress–strain curves, and (d) volumetric strain responses.
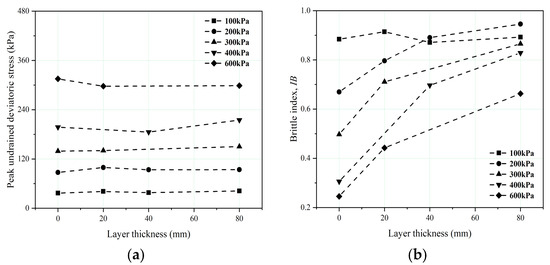
Figure 9.
(a) Peak undrained deviatoric stresses for the IOTs with respect to the thickness of the fine-grained interlayer (test sample nos. 01–05, 12–16, 23–26, and 29–31); (b) relationship between the brittleness index, layer thickness, and confining pressures of IOTs at similar initial densities (test sample nos. 01–05, 12–16, 23–26, and 29–31).
The stress paths and CSLs in the q-p′ plane are shown in Figure 10. The end points defined unique CSLs with gradients of 1.307 (φcs = 32.45°) and 1.278 (φcs = 31.79°) for the FGLT-20 and FGLT-40, respectively. The φcs values of the IOTs with different layer thicknesses were close. Nevertheless, the φcs values of the IOTs with heterogeneous structures were lower than those of the homogeneous specimens overall. With increasing layer thickness (0–40 mm), the φcs values decreased slightly (Figure 10c). C-shaped undrained shearing stress paths were identified for both types of tailings. Additionally, liquefaction occurred at 20% axial strain in test sample nos. 23 and 29, while in the other undrained tests, significant strain-softening occurred since their initial states were located below the horizontal asymptote of the CSL in the e-ln p’ plane with positive state parameters (Figure 11a,b). The unique curved-shaped CSLs of the FGLT-20 and FGLT-40 had shapes similar to that of the IOT-C. For FGLT-20 and FGLT-40, the b values were 0.05 and 0.08, respectively. The b values were quite close to that for IOT-C (b = 0.06). As a consequence, the curvatures and shapes of the CSLs at lower stresses for IOT with a fine-grained interlayer of different thicknesses were similar to the CSL for IOT-C. Moreover, the c values were 0.58 and 0.41, respectively. As a consequence, the CSLs at higher stresses for FGLT-20 and FGLT-40 tended to intersect, but this trend was not obvious. The CSLs tended to translate upward with increasing layer thicknesses until a reverse shift of the shape and location of the CSL occurred at a thickness of 80 mm (Figure 11c). Given a certain initial soil state (e0, p0′), the state parameter for homogeneous specimens will be higher than that for FGLT-20 and FGLT-40. Consequently, the susceptibility of the IOTs to liquefaction tended to decrease with increasing layer thickness within the range of 0–40 mm. Based on the calculation of the mass of the dry solids and distilled water during the sample preparation procedure, the fines contents for the FGLT-20, FGLT-40, FGLA-15, and FGLA-30 were 44.3%, 49.8%, 44.3%, and 44.3%, respectively. The CSLs for IOTs with different FGLTs shifted upward in the e-ln p′ plane with increasing fines content until the fines content reached 60.4% for the IOT-F. This seems to be opposite to the findings of Vergaray et al. [52]. However, the definition of the TFC may also not apply to the heterogeneous IOTs in this study. Previous studies that have focused on the TFC were conducted on homogenous samples created by completely mixing the coarser grains and fines. The soil deformation and the volumetric strain responses during triaxial shearing of homogenous specimens are usually taken as a whole, while the mechanical responses inside and outside the interlayer in heterogeneous specimens are different. The presence of an interlayer and the increase in its thickness not only lead to an increase in the fines content but also contribute to the anisotropy of the triaxial specimen.
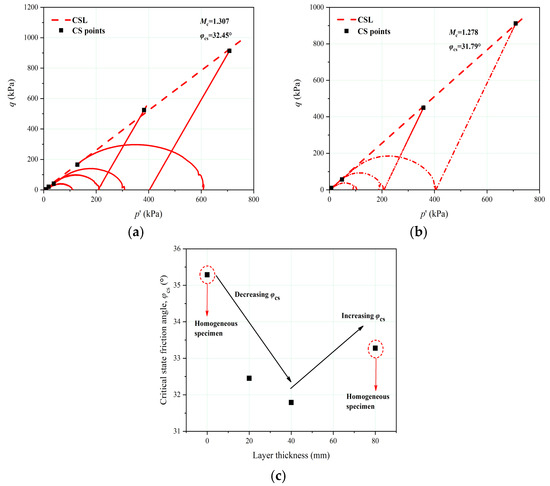
Figure 10.
Stress paths and critical state lines for the IOTs containing a fine-grained interlayer with two different thicknesses in the q-p′ plane: (a) all tests for the FGLT-20, (b) all tests for the FGLT-40, and (c) evolution of the critical state friction angle (φcs) with layer thickness.
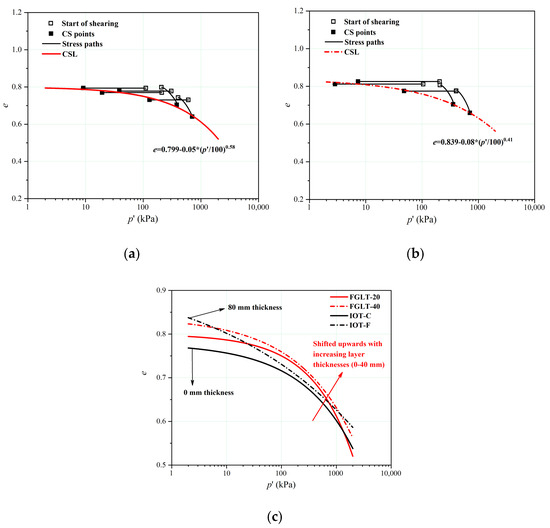
Figure 11.
CSLs for the IOTs containing a fine-grained interlayer with different thicknesses in the e-ln p′ plane: (a) all tests for the FGLT-20, (b) all tests for the FGLT-40, and (c) relative locations of the CSLs of the IOT-C, FGLT-20, FGLT-40, and IOT-F.
The displacement and morphology of the pores and skeleton particles in both the coarser tailings grains outside the interlayer and the fine-grained interlayered structures during the triaxial tests are illustrated in Figure 12. Under a small FGLT and lower effective confining stresses, the tailings deformation in their loose state was primarily controlled by the compression of the intergranular pore spaces. With increasing stress levels, the skeleton of the coarser tailings particles rotated and slipped, and the pore spaces were sufficiently compressed. The microstructure of the coarser tailings outside the interlayer was primarily dominated by the coarse grains in contact, while the finer tailings grains inside the interlayer actively participated in the internal force chain by partially separating the coarser grains and supporting the coarse-grained skeleton. Since the stress levels in this study were not high enough to initiate particle crushing, the finer tailings grains inside the interlayer sustained the stresses and hindered the compression of the intergranular pores, resulting in higher void ratios after compression. With increasing layer thickness, the fines content inside the interlayer increased, and the quantity of coarser grains outside the layer decreased, leading to an upward shift of the CSLs in the volumetric space. In the subsequent shearing process, the finer tailings grains served as lubrication, resulting in a reduction in the frictional resistance and lower friction angles at critical states.

Figure 12.
Fabric model proposed for the loose IOTs specimens containing a fine-grained interlayer during the triaxial tests.
4.2. Effect of the Dip Angle
The stress–strain curves, pore water pressure responses, and volumetric strain responses for the IOTs containing fine-grained interlayers with two different dip angles (FGLA-15 and FGLA-30) and a thickness of 20 mm are shown in Figure 13. The test results for the IOTs with a layer thickness of 20 mm and a dip angle of 0° (FGLT-20) are also listed for comparison. For the undrained tests, minor changes occurred in the peak deviatoric stresses (Figure 13a and Figure 14a). The pore water pressures at the critical states for the FGLA-15 and FGLA-30 were in close proximity (Figure 13b). To clearly distinguish the influence of the dip angle, the x-axis values for the IOT-C and IOT-F are set to −10° and 40° in Figure 14 for comparison. It should be noted that for similar initial densities and effective stresses, the IB values of the IOTs with horizontal and dipping interlayers were larger than that of the IOT-C, while they were much lower than that of the IOT-F. The relationship between IB values and increasing dip angle (0–30°) seemed to be opposite at lower stress levels (100–200 kPa) and higher stresses (600 kPa), despite fluctuations occurred at 15° (Figure 14b). For the drained tests, εv at the critical states increased with increasing dip angle at the same effective confining stress (Figure 13d), while the peak deviatoric stresses decreased with increasing dip angle (Figure 13c).
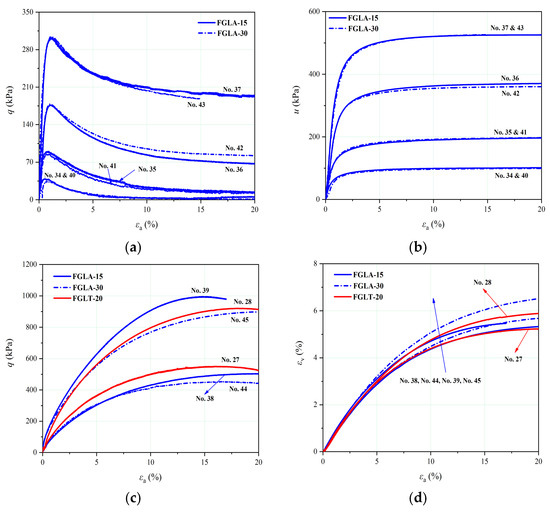
Figure 13.
Triaxial test data for the IOTs containing a fine-grained interlayer with different dip angles: (a) undrained stress–strain curves, (b) pore water pressure responses, (c) drained stress–strain curves, and (d) volumetric strain responses.
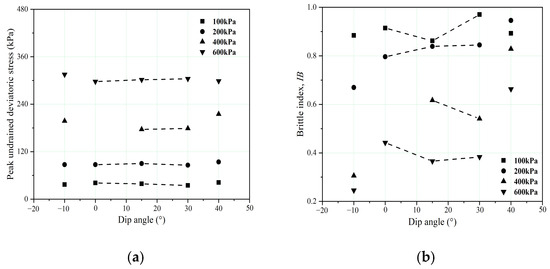
Figure 14.
(a) Peak undrained deviatoric stresses for the IOTs with respect to the dip angles of the fine-grained interlayer (test sample nos. 01–02, 04–05, 12–13, 15–16, 23–24, 26, 34–37, and 40–43); (b) relationship between the brittleness index, dip angle, confining pressure, and initial soil density (test sample nos. 01–02, 04–05, 12–13, 15–16, 23–24, 26, 34–37, and 40–43).
The stress paths and CSLs in the q-p′ and e-ln p′ planes are illustrated in Figure 15 and Figure 16. The end points defined unique CSLs with gradients of 1.344 (φcs = 33.3°) and 1.269 (φcs = 31.58°) for the FGLA-15 and FGLA-30, respectively. The evolution of φcs with increasing dip angle was non-monotonous within the range of 0–30° (Figure 15c). The friction angle in previous studies was calculated from the strength envelope that passed through the tangent points on the Mohr circles [23,24]. However, the friction angle in this study denoted the friction angle at critical states, which was calculated from the end states of each triaxial test and the slope of the critical lines in the q-p′ plane. Moreover, nearly all of the samples in this study were prepared in their loose state and sheared under saturated states. As a consequence, the overall friction angle was not significantly affected by an increase in the fine-grained interlayer thickness or dip angle. C-shaped undrained stress paths were identified for both types of tailings. The unique CSLs in the e-ln p′ plane had curve shapes similar to those of the IOT-C and FGLT-20. For FGLA-15 and FGLA-30, the b values were 0.081 and 0.111, respectively. So, the initial slope for FGLT-20, FGLA-15, and FGLA-30 increases from 0.05 to 0.111. The CSLs became more curved at low p′ values. However, the c values for FGLT-20, FGLA-15, and FGLA-30 decreases from 0.58 to 0.35, which means the CSLs became more straight at higher p′ values. As the dip angle of the fine-grained interlayer increased from 0° to 30°, the CSLs rotated clockwise around a pivot point. However, none of the CSLs tended toward the CSLs of the IOT-C or IOT-F. Although the fines content of the FGLT-20, FGLA-15, and FGLA-30 remained unchanged at around 44.3%, the evolution of the relative location of the CSLs for the tailings with different dip angles was similar to the findings of Bouckovalas et al. [59] on the effect of the fines content on the critical states of silty sands with a fines content range of 0–30%.
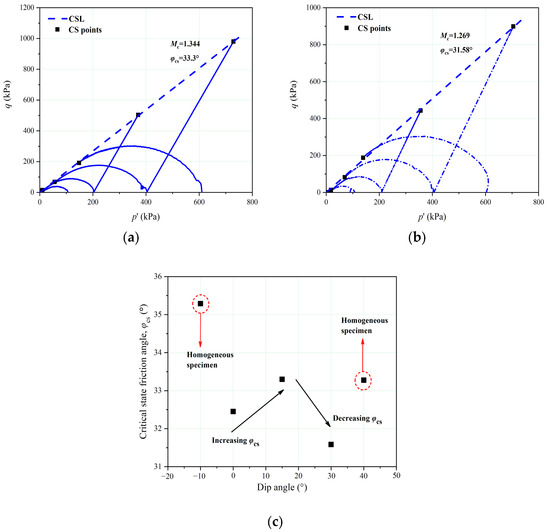
Figure 15.
Stress paths and critical state lines for the IOTs containing a fine-grained interlayer with two different dip angles in the q-p′ plane: (a) all tests for the FGLA-15, (b) all tests for the FGLA-30, and (c) evolution of critical state friction angle (φcs) with dip angle.
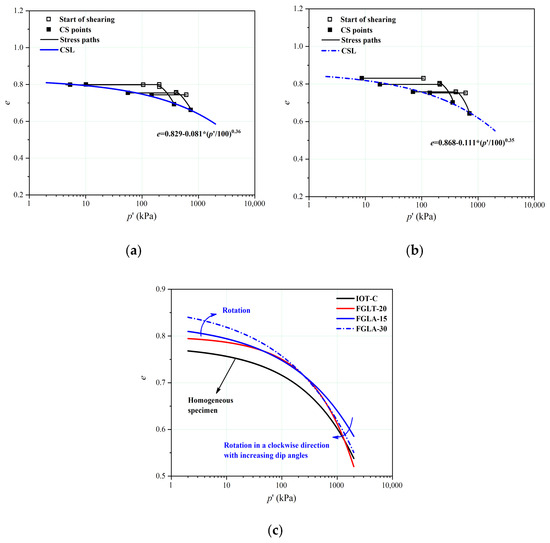
Figure 16.
CSLs for the IOTs containing a fine-grained interlayer with different dip angles in the e-ln p′ plane: (a) all tests for the FGLA-15, (b) all tests for the FGLA-30, and (c) relative locations of the CSLs for the IOT-C, FGLT-20, FGLA-15, and FGLA-30.
Figure 17 shows the changes in the contact area between the coarser and finer tailings grains. The axial distribution range of the fine-grained interlayer with a thickness of 20 mm and dip angles of 0° and 30° are shown for comparison. The initial void ratios, fines contents, and saturation states of the FGLT-20, FGLA-15, and FGLA-30, which had a fixed layer thickness of 20 mm, remained constant, resulting in equivalent cementation and support of the finer tailings particles on the coarser tailings particles of the skeleton. As a consequence, the stress–strain responses and the peak undrained and drained shearing stresses remained largely unchanged. Additionally, the soil deformation induced by the compression of the intergranular pores may have been quite identical. Thus, the relative locations of the CSLs for these three materials were located within a narrow range, and the CSLs did not shift. However, an increase in the dip angle led to an increase in the contact area between the fine-grained interlayered structures and the adjacent layers (Figure 17). This may have enhanced the inter-particle cohesion and interlocking through adhesion, thus enhancing the integrity and stability of the tailings structure. Moreover, a larger dip angle resulted in an increased height distribution of the fine-grained interlayer along the axial direction of the specimen, causing it to bear external loads over a wider range. This may have contributed to the rotation of the CSLs in the e-ln p′ plane.
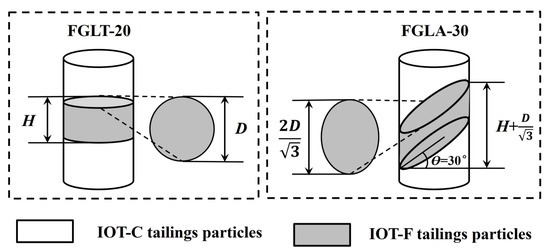
Figure 17.
Effects of dip angle on the interlayer contact area and the axial distribution range of the interlayered structure in the IOTs specimens.
5. Conclusions
In this study, a series of standard triaxial compression tests were conducted on homogeneous and heterogeneous specimens to explore the influence of a fine-grained interlayered structure on the mechanics of the IOTs under the CSSM framework. The effects of the FGLT and FGLA on the stress–strain responses and the critical state properties were studied under similar initial densities and effective stress levels. Furthermore, the underlying mechanisms were investigated. The main conclusions are summarized below.
For the homogeneous specimens in their loose states, undrained strain-softening shearing responses and a sharp increase in the pore water pressures occurred at all stress levels. The contractive volumetric responses and ductile stress–strain curves were identified in the drained tests. The unique CSLs were identified in the q-p′ space for both types of tailings, and the slope of φcs for the IOT-C (35.39°) was slightly higher than that for the IOT-F (33.28°), which may have resulted from the lower sphericity and aspect ratio and higher convexity of the coarser tailings. The unique CSLs were also identified at all stress levels in the e-ln p′ plane. The CSL for the IOT-F remained straight even at low stress levels. With increasing fines content, the CSLs tended to be less curved and shifted upward. The liquefaction resistance tended to decrease with increasing particle size based on the relative locations of the CSLs in the volumetric plane.
For the heterogeneous specimens in their loose states, the stress–strain responses remained roughly unchanged with increases in both the FGLT and FGLA and exhibited patterns similar to those of the homogeneous specimens, even though some fluctuations occurred when the dip angle reached 15°. The unique CSLs were identified in the q-p′ space for the tailings with different FGLTs and FGLAs, and the slopes of the CSLs remained quite close to each other, indicating that the layer thickness and dip angle did not significantly affect the friction angle in the critical states. However, the φcs values of the heterogeneous tailings samples (31°–33°) were lower than those of the homogenous samples (33°–35°) overall. As the layer thickness increased from 0 mm to 40 mm, the CSLs in the e-ln p′ space with shapes similar to that of the IOT-C occurred. Additionally, the CSLs shifted upward continuously. Since the stress levels in this study were not high enough to initiate particle crushing, the finer tailings grains inside the interlayer sustained the stresses and hindered the compression of the intergranular pores, resulting in higher void ratios after compression and an upward translation of the CSLs. As the dip angle increased from 0° to 30°, the CSLs in the e-ln p′ plane rotated clockwise through a pivot point. An increase in the dip angle led to an increase in the contact area between the fine-grained interlayered structures and the adjacent layers, as well as an increase in the distribution height of the fine-grained interlayer along the axial direction of the triaxial specimen, which may have resulted in the rotation of the CSLs.
Comparisons of the stress–strain behaviors and the critical state properties of intact IOTs block samples with inherent variability should be made with these heterogeneous IOTs specimens created using the wet compaction method. Moreover, there is also some debate about whether the initial fabric from sample preparation has a significant effect on the susceptibility to liquefaction. Thus, in future work, it is also of great significance to analyze the effects of fabric on the critical states of IOTs with a fine-grained interlayer reconstituted with different preparation methods.
Author Contributions
X.J.: Conceptualization, Methodology, Formal analysis, Investigation, Data curation, Writing—Original Draft, Writing—Review and Editing, Visualization. Q.X.: Supervision, Resources, Funding acquisition, Project administration. K.R.: Investigation. L.W.: Formal analysis, Writing—Review and Editing, Validation, Visualization. W.W.: Formal analysis, Validation. All authors have read and agreed to the published version of the manuscript.
Funding
This research was funded by the National Natural Science Foundation of China grant numbers (41630640, 41790445), and the National Key Research and Development Program of China grant number (2022YFC3003205).
Data Availability Statement
Data available on request due to restrictions privacy or ethical. The data presented in this study are available on request from the corresponding author.
Conflicts of Interest
The authors declare that they have no known competing financial interests or personal relationships that could have appeared to influence the work reported in this paper.
References
- Wang, C.; Harbottle, D.; Liu, Q.; Xu, Z. Current state of fine mineral tailings treatment: A critical review on theory and practice. Miner. Eng. 2014, 58, 113–131. [Google Scholar] [CrossRef]
- Kossoff, D.; Dubbin, W.E.; Alfredsson, M.; Edwards, S.J.; Macklin, M.G.; Hudson-Edwards, K.A. Mine tailings dams: Characteristics, failure, environmental impacts, and remediation. Appl. Geochem. 2014, 51, 229–245. [Google Scholar] [CrossRef]
- Santamarina, J.C.; Torres-Cruz, L.A.; Bachus, R.C. Why coal ash and tailings dam disasters occur. Science 2019, 364, 526–528. [Google Scholar] [CrossRef]
- Li, W.; Coop, M.R.; Senetakis, K.; Schnaid, F. The mechanics of a silt-sized gold tailing. Eng. Geol. 2018, 241, 97–108. [Google Scholar] [CrossRef]
- Carrera, A.; Coop, M.; Lancellotta, R. Influence of grading on the mechanical behaviour of Stava tailings. Géotechnique 2011, 61, 935–946. [Google Scholar] [CrossRef]
- Gens, A.; Alonso, E.E. Aznalcóllar dam failure. Part 2: Stability conditions and failure mechanism. Géotechnique 2006, 56, 185–201. [Google Scholar] [CrossRef]
- Fourie, A.; Blight, G.; Papageorgiou, G. Static liquefaction as a possible explanation for the Merriespruit tailings dam failure. Can. Geotech. J. 2001, 38, 707–719. [Google Scholar] [CrossRef]
- Morgenstern, N.R.; Vick, S.G.; Van Zyl, D. Report on Mount Polley Tailings Storage Facility Breach, Report of Independent Expert Engineering Investigation and Review Panel to Province of British Columbia; Mount Polley Independent Expert Engineering Investigation and Review Panel: Victoria, BC, Canada, 30 January 2015. [Google Scholar]
- Zabolotnii, E.; Morgenstern, N.R.; Wilson, G.W. Mechanism of failure of the Mount Polley Tailings Storage Facility. Can. Geotech. J. 2022, 59, 1503–1518. [Google Scholar] [CrossRef]
- Reid, D. Additional Analyses of the Fundão Tailings Storage Facility: In Situ State and Triggering Conditions. J. Geotech. Geoenviron. Eng. 2019, 145, 04019088. [Google Scholar] [CrossRef]
- Bayaraa, M.; Sheil, B.; Rossi, C. InSAR and numerical modelling for tailings dam monitoring—The Cadia failure case study. Géotechnique 2024, 74, 985–1003. [Google Scholar] [CrossRef]
- Jefferies, M.; Morgenstern, N.; Van Zyl, D.; Wates, J. Report on NTSF Embankment Failure, Cadia Valley Operations, for Ashurst Australia; Newcrest: Melbourne, Australia, 2019. [Google Scholar]
- Rana, N.M.; Ghahramani, N.; Evans, S.G.; McDougall, S.; Small, A.; Take, W.A. Catastrophic mass flows resulting from tailings impoundment failures. Eng. Geol. 2021, 292, 106262. [Google Scholar] [CrossRef]
- Fourie, A.; Verdugo, R.; Bjelkevik, A.; Torres-Cruz, L.; Znidarcic, D. Geotechnics of mine tailings: A 2022 state of the art. In Proceedings of the 20th International Conference on Soil Mechanics and Geotechnical Engineering, Sydney, Australia, 1–5 May 2022. [Google Scholar]
- Goñi, C.; Celi, D.; Concha, F. Determination of the volumetric solids fraction of saturated polydisperse ore tailing sediments. Powder Technol. 2017, 305, 528–537. [Google Scholar] [CrossRef]
- Liu, Y.; Lv, C.; Ding, J.; Qian, P.; Yu, Y.; Ye, S.; Chen, Y. Characterization of a hybrid polyacrylamide and its flocculation properties in cyanide tailing suspensions. Water Sci. Technol. 2017, 76, 2482–2493. [Google Scholar] [CrossRef]
- Høeg, K.; Dyvik, R.; Sandbækken, G. Strength of Undisturbed versus Reconstituted Silt and Silty Sand Specimens. J. Geotech. Geoenviron. Eng. 2000, 126, 606–617. [Google Scholar] [CrossRef]
- Chang, N.; Heymann, G.; Clayton, C. The effect of fabric on the behaviour of gold tailings. Géotechnique 2011, 61, 187–197. [Google Scholar] [CrossRef]
- Reid, D.; Fanni, R. A comparison of intact and reconstituted samples of a silt tailings. Géotechnique 2022, 72, 176–188. [Google Scholar] [CrossRef]
- Reid, D.; Fanni, R.; Koh, K.; Orea, I. Characterisation of a subaqueously deposited silt iron ore tailings. Géotechnique Lett. 2018, 8, 278–283. [Google Scholar] [CrossRef]
- Oda, M.; Nemat-Nasser, S.; Konishi, J. Stress-Induced Anisotropy in Granular Masses. Soils Found. 1985, 25, 85–97. [Google Scholar] [CrossRef]
- Zhang, Q.; Yin, G.; Wei, Z.; Fan, X.; Wang, W.; Nie, W. An experimental study of the mechanical features of layered structures in dam tailings from macroscopic and microscopic points of view. Eng. Geol. 2015, 195, 142–154. [Google Scholar] [CrossRef]
- Chen, R.; Lei, W.; Li, Z. Anisotropic shear strength characteristics of a tailings sand. Environ. Earth Sci. 2014, 71, 5165–5172. [Google Scholar] [CrossRef]
- Chen, Q.; Zhang, C.; Yang, C.; Ma, C.; Pan, Z.; Daemen, J.J.K. Strength and deformation of tailings with fine-grained interlayers. Eng. Geol. 2019, 256, 110–120. [Google Scholar] [CrossRef]
- Fourie, A.B.; Tshabalala, L. Initiation of static liquefaction and the role of K0 consolidation. Can. Geotech. J. 2005, 42, 892–906. [Google Scholar] [CrossRef]
- Bedin, J.; Schnaid, F.; Fonseca, A.V.D.; Filho, L.D.M.C. Gold tailings liquefaction under critical state soil mechanics. Géotechnique 2012, 62, 263–267. [Google Scholar] [CrossRef]
- Li, W.; Coop, M.R. Mechanical behaviour of Panzhihua iron tailings. Can. Geotech. J. 2019, 56, 420–435. [Google Scholar] [CrossRef]
- Torres-Cruz, L.A.; Santamarina, J.C. The critical state line of nonplastic tailings. Can. Geotech. J. 2020, 57, 1508–1517. [Google Scholar] [CrossRef]
- Reid, D.; Fourie, A.; Ayala, J.L.; Dickinson, S.; Ochoa-Cornejo, F.; Fanni, R.; Garfias, J.; Fonseca, A.V.D.; Ghafghazi, M.; Ovalle, C.; et al. Results of a critical state line testing round robin programme. Géotechnique 2021, 71, 616–630. [Google Scholar] [CrossRef]
- Riveros, G.A.; Sadrekarimi, A. Static liquefaction behaviour of gold mine tailings. Can. Geotech. J. 2021, 58, 889–901. [Google Scholar] [CrossRef]
- Fotovvat, A.R.; Sadrekarimi, A. Instability of a Gold Mine Tailings Subjected to Different Stress Paths. J. Geotech. Geoenviron. Eng. 2022, 148, 04022020. [Google Scholar] [CrossRef]
- Karim, M.E.; Rahman, M.M.; Karim, M.R.; Fourie, A.B.; Reid, D. Characteristics of Copper Tailings in Direct Simple Shearing: A Critical State Approach. J. Geotech. Geoenviron. Eng. 2023, 149, 04023018. [Google Scholar] [CrossRef]
- Macedo, J.; Vergaray, L. Properties of mine tailings for static liquefaction assessment. Can. Geotech. J. 2022, 59, 667–687. [Google Scholar] [CrossRef]
- Ng, C.W.W.; Crous, P.A.; Jacobsz, S.W. Centrifuge and Numerical Modeling of Liquefied Flow and Nonliquefied Slide Failures of Tailings Dams. J. Geotech. Geoenviron. Eng. 2023, 149, 04023075. [Google Scholar] [CrossRef]
- Silva, J.P.S.; Rissoli, A.L.C.; Cacciari, P.P.; da Fonseca, A.J.P.V.; Filho, H.C.S.; Wagner, A.C.; Carvalho, J.V.D.A.; Festugato, L.; Consoli, N.C. Triaxial testing response of compacted iron ore tailings considering a broad spectrum of confining pressures. Soils Found. 2024, 64, 101438. [Google Scholar] [CrossRef]
- Fotovvat, A.; Sadrekarimi, A.; Etezad, M. Instability of gold mine tailings subjected to undrained and drained unloading stress paths. Géotechnique 2024, 74, 174–192. [Google Scholar] [CrossRef]
- Sarkar, G.; Sadrekarimi, A. Undrained shearing behaviour of oil sands tailings. Soil Dyn. Earthq. Eng. 2022, 161, 107410. [Google Scholar] [CrossRef]
- Verdugo, R. Static liquefaction in the context of steady state/critical state and its application in the stability of tailings dams. Soil Dyn. Earthq. Eng. 2024, 176, 108270. [Google Scholar] [CrossRef]
- Reid, D.; Fourie, A.; Moggach, S. Characterization of a gold tailings with hypersaline pore fluid. Can. Geotech. J. 2020, 57, 482–496. [Google Scholar] [CrossRef]
- Baziar, M.H.; Dobry, R. Residual Strength and Large-Deformation Potential of Loose Silty Sands. J. Geotech. Eng. 1995, 121, 896–906. [Google Scholar] [CrossRef]
- Morgenstern, N.; Vick, S.; Viotti, C.; Watts, B. Fundão Tailings Dam Review Panel Report on the Immediate Causes of the Failure of the Fundão Dam; Cleary Gottlieb Steen & Hamilton LLP: New York, NY, USA, 2016. [Google Scholar]
- Jefferies, M.; Been, K. Soil Liquefaction: A Critical State Approach; CRC Press: Boca Raton, FL, USA, 2015. [Google Scholar]
- Yao, G.; Liu, Q.; Wang, J.; Wu, P.; Lyu, X. Effect of mechanical grinding on pozzolanic activity and hydration properties of siliceous gold ore tailings. J. Clean. Prod. 2019, 217, 12–21. [Google Scholar] [CrossRef]
- Zhao, X.; Fourie, A.; Qi, C.-C. Mechanics and safety issues in tailing-based backfill: A review. Int. J. Miner. Metall. Mater. 2020, 27, 1165–1178. [Google Scholar] [CrossRef]
- Chen, B.; Pang, L.; Zhou, Z.; Chang, Q.; Fu, P. Study on the activation mechanism and hydration properties of gold tailings activated by mechanical-chemical-thermal coupling. J. Build. Eng. 2022, 48, 104014. [Google Scholar] [CrossRef]
- Sladen, J.A.; Handford, G. A potential systematic error in laboratory testing of very loose sands. Can. Geotech. J. 1987, 24, 462–466. [Google Scholar] [CrossRef]
- Bishop, A. Progressive failure-with special reference to the mechanism causing it. Proc. Geotech. Conf. 1967, 2, 142–150. [Google Scholar]
- Poulos, S.J.; Castro, G.; France, J.W. Liquefaction evaluation procedure. J. Geotech. Eng. 1985, 111, 772–792. [Google Scholar] [CrossRef]
- Yamamuro, J.A.; Covert, K.M. Monotonic and cyclic liquefaction of very loose sands with high silt content. J. Geotech. Geoenviron. Eng. 2001, 127, 314–324. [Google Scholar] [CrossRef]
- Wagner, A.C.; de Sousa Silva, J.P.; de Azambuja Carvalho, J.V.; Rissoli, A.L.C.; Cacciari, P.P.; Chaves, H.M.; Filho, H.C.S.; Consoli, N.C. Mechanical behavior of iron ore tailings under standard compression and extension triaxial stress paths. J. Rock Mech. Geotech. Eng. 2023, 15, 1883–1894. [Google Scholar] [CrossRef]
- Consoli, N.C.; Silva, J.P.S.; Wagner, A.C.; Carvalho, J.V.D.A.; Baudet, B.A.; Coop, M.R.; Filho, H.C.S.; Carvalho, I.; de Sousa, G.M.; Cacciari, P.P. Critical state analysis of two compacted filtered iron ore tailings with different gradings and mineralogy at different stages of treatment. Acta Geotech. 2024, 19, 881–898. [Google Scholar] [CrossRef]
- Vergaray, L.; Macedo, J.; Arnold, C. Static and Cyclic Liquefaction of Copper Mine Tailings. J. Geotech. Geoenviron. Eng. 2023, 149, 04023021. [Google Scholar] [CrossRef]
- Yang, S.L.; Sandven, R.; Grande, L. Steady-state lines of sand–silt mixtures. Can. Geotech. J. 2006, 43, 1213–1219. [Google Scholar] [CrossRef]
- Thevanayagam, S.; Shenthan, T.; Mohan, S.; Liang, J. Undrained Fragility of Clean Sands, Silty Sands, and Sandy Silts. J. Geotech. Geoenviron. Eng. 2002, 128, 849–859. [Google Scholar] [CrossRef]
- Fourie, A.B.; Papageorgiou, G. Defining an appropriate steady state line for Merriespruit gold tailings. Can. Geotech. J. 2001, 38, 695–706. [Google Scholar] [CrossRef]
- Been, K.; Jefferies, M.G. A state parameter for sands. Géotechnique 1985, 35, 99–112. [Google Scholar] [CrossRef]
- Been, K.; Jefferies, M.G.; Hachey, J. The critical state of sands. Géotechnique 1991, 41, 365–381. [Google Scholar] [CrossRef]
- Verdugo, R.; Ishihara, K. The Steady State of Sandy Soils. Soils Found. 1996, 36, 81–91. [Google Scholar] [CrossRef]
- Bouckovalas, G.D.; Andrianopoulos, K.I.; Papadimitriou, A.G. A critical state interpretation for the cyclic liquefaction resistance of silty sands. Soil Dyn. Earthq. Eng. 2003, 23, 115–125. [Google Scholar] [CrossRef]
Disclaimer/Publisher’s Note: The statements, opinions and data contained in all publications are solely those of the individual author(s) and contributor(s) and not of MDPI and/or the editor(s). MDPI and/or the editor(s) disclaim responsibility for any injury to people or property resulting from any ideas, methods, instructions or products referred to in the content. |
© 2024 by the authors. Licensee MDPI, Basel, Switzerland. This article is an open access article distributed under the terms and conditions of the Creative Commons Attribution (CC BY) license (https://creativecommons.org/licenses/by/4.0/).