Article

Biodegradation of Cyanide Using Soda Lake-Derived Alkaliphilic Microbial Consortia

1
Institute of Biotechnology, Addis Ababa University, Addis Ababa P.O. Box 1176, Ethiopia
2
Division of Applied Microbiology, Department of Chemistry, Faculty of Engineering, Lund University, P.O. Box 124, SE-221 00 Lund, Sweden
3
Institute of Biotechnology, University of Gondar, Gondar P.O. Box 196, Ethiopia
4
Division of Water Resources Engineering, Department of Building and Environmental Technology, Faculty of Engineering, Lund University, P.O. Box 118, SE-221 00 Lund, Sweden
*
Author to whom correspondence should be addressed.
Water 2024, 16(20), 2956; https://doi.org/10.3390/w16202956
Submission received: 19 September 2024 / Revised: 15 October 2024 / Accepted: 16 October 2024 / Published: 17 October 2024
(This article belongs to the Section Wastewater Treatment and Reuse)

Abstract

:
Biological treatment processes at low or neutral pH are ineffective for gold mine wastewater treatment. The aim of this study was to develop a new cyanide-rich gold mine wastewater treatment system using alkaliphilic microbial consortia from the Ethiopian Rift Valley soda lake, Lake Chitu. The treatment setup incorporates aerobic and anoxic reactors connected in series and operated for about 200 treatment days. Simulated gold mine wastewater was formulated in the laboratory. Colorimetry was used to measure residual cyanide and reactive nitrogen molecules derived from cyanide biodegradation. Flocks and biofilms developed in the reactors during the acclimatization process. Using sodium cyanide at 200 mg/L as an initial concentration, the consortia degraded to 99.74 ± 0.08% of cyanide, with no significant variation (p > 0.05) occurring when the dose was increased to 800 mg/L. However, changes were observed (p < 0.05) at 1000 mg/L. Acetate was the preferred carbon source for the consortia. The established consortia effectively degraded cyanide to levels below the permissible discharge limit set by the International Cyanide Management Institute (ICMI). This study provides insights into the effectiveness of alkaliphilic microbial consortia derived from soda lakes for treating cyanide-polluted wastewater.

1. Introduction

Cyanide is commonly used in the gold mining industry to extract gold from ore [1]. Roughly 1 kg of cyanide (NaCN or KCN) is needed to recover 1.5 g of gold [2]. About 90% of gold around the globe is produced using cyanide as a leaching agent [3,4] which results in the release of 18 billion liters of cyanide-rich effluent annually [5]. The major chemical constituents in the effluents are free cyanide, thiocyanate, and metal-complexed cyanides [6]. The concentration of cyanide in the effluent is in the range of 10 mg/L to 100 mg/L [7,8].
Once gold is separated from the ore, the effluent is usually stored in an artificial dam called a tailing dam. However, the cyanide-rich effluent can leach out from the dam and cause serious human and animal health risks as cyanide is a highly toxic chemical [9,10]. As a result, living organisms around gold mining areas are at risk, sometimes reaching a critical stage. Cyanide can also be released from a collapsed dam, contaminating the environment. For example, the collapse of the Los Frails tailing dam in Spain in 1998 released 35 million metric cubes of cyanide-polluted waste into the Guadiamar River [11]. Similarly, in 2010, the failure of the Ajka tailings storage facility in Hungary released approximately 700,000 cubic meters of cyanide-contaminated water into the Marcal and Torna rivers, polluting 800 hectares of land [12]. Tailing dam collapses were also reported in South Africa [13], Burkina Faso [14], Peru [15], and Ghana [16], which created a huge problem in ecology.
Strict environmental regulations are applied to waters that contain free cyanide and metal cyanide complexes [17]. Therefore, any cyanide-contaminated water must be treated before disposal. Conventional cyanide waste treatment methods, such as alkaline chlorination, hydrogen peroxide, and sulfur dioxide processes, are used to remove cyanide from industrial effluent [18]. However, these methods have technical, economic, and environmental concerns [10] and are not chosen by gold mine industries [19]. There are different types of biological cyanide degradation methods. Microbial cyanide biodegradation is one of these methods [19]. Microorganisms can degrade cyanide into unstable, simple organic or inorganic molecules, such as ammonia and formamidines, along with nitrite and other byproducts. These degradation products can vary depending on the specific microbial pathways and conditions present in the treatment process [10]. This leads to the possibility of using microbes for cyanide-polluted wastewater treatment. Various lab-scale studies from different laboratories have demonstrated the effectiveness of microbial cyanide degradation [20].
Most cyanide-degrading microbes are neutrophilic and acidophilic [1]. In acidic or neutral pH, cyanide volatilizes in the form of hydrocyanic gas and escapes into the environment [21]. To minimize cyanide volatilization, the pH should be maintained above 9.3, the pKa of HCN [10,21]. This shows that the biological treatment of cyanide is effective only in alkaline conditions. Some studies carried out in different laboratories showed the feasibility of the biological treatment of cyanide wastewater at a high pH [22,23]. However, many of these studies were limited to a single isolate with batch treatment or in a semi-continuous treatment setup. On the other hand, cyanide biodegradation is a multiple metabolic process that requires the synergistic action of microorganisms, and therefore, to achieve the maximum removal of cyanide, there is a need to use alkaliphilic microbial consortia with an appropriate treatment setup. The novelty of the present study lies in the use of integrated aerobic and anoxic reactors, along with alkaliphilic microbial consortia sourced from soda lakes. Alkaliphiles from alkaline habitats offer attractive potential to develop an effective cyanide treatment consortium [24]. Soda lakes, which are found in different parts of the world [25], are examples of naturally occurring stable alkaline habitats. The East African Rift Valley soda lakes are highly productive habitats that harbor a diverse group of alkaliphilic microorganisms [26,27]. Recent studies in the Ethiopian Rift Valley soda lakes showed a diverse group of alkaliphilic microbial communities [27,28]. The aim of this study was to establish cyanide-degrading alkaliphilic consortia from an alkaline soda lake, Lake Chitu, for the treatment of gold mining wastewater with a new treatment setup at a lab scale and optimize the treatment process.

2. Materials and Methods

2.1. Description of the Sample Site and Sample Collection

Surface water and sediment samples were collected from Lake Chitu, a soda lake found in the central Rift Valley of Ethiopia about 287 km South of Addis Ababa (07°24′354″ N and 038°25′550″ E) and at an altitude of about 1578 m (Figure 1), from 5 sampling points. It is a small crater lake with a surface area of approximately 800 m2 and a maximum depth of 17 m [29]. The lake is a closed basin with no outflow or inflow. However, there are a few hot springs that emerge from the shore and drain into the lake. Geographical coordinates, pH, and salinity were measured using a GPS, pH meter (OAKTON-pH110: Oakton Instruments, Vernon Hills, IL, USA), and refractometer (HHTEC), respectively. Samples were collected using sterile bottles and transported to the laboratory using an ice box and kept at 4 °C for 24 h until use.

2.2. Experimental Setup and Formulation of Synthetic Wastewater

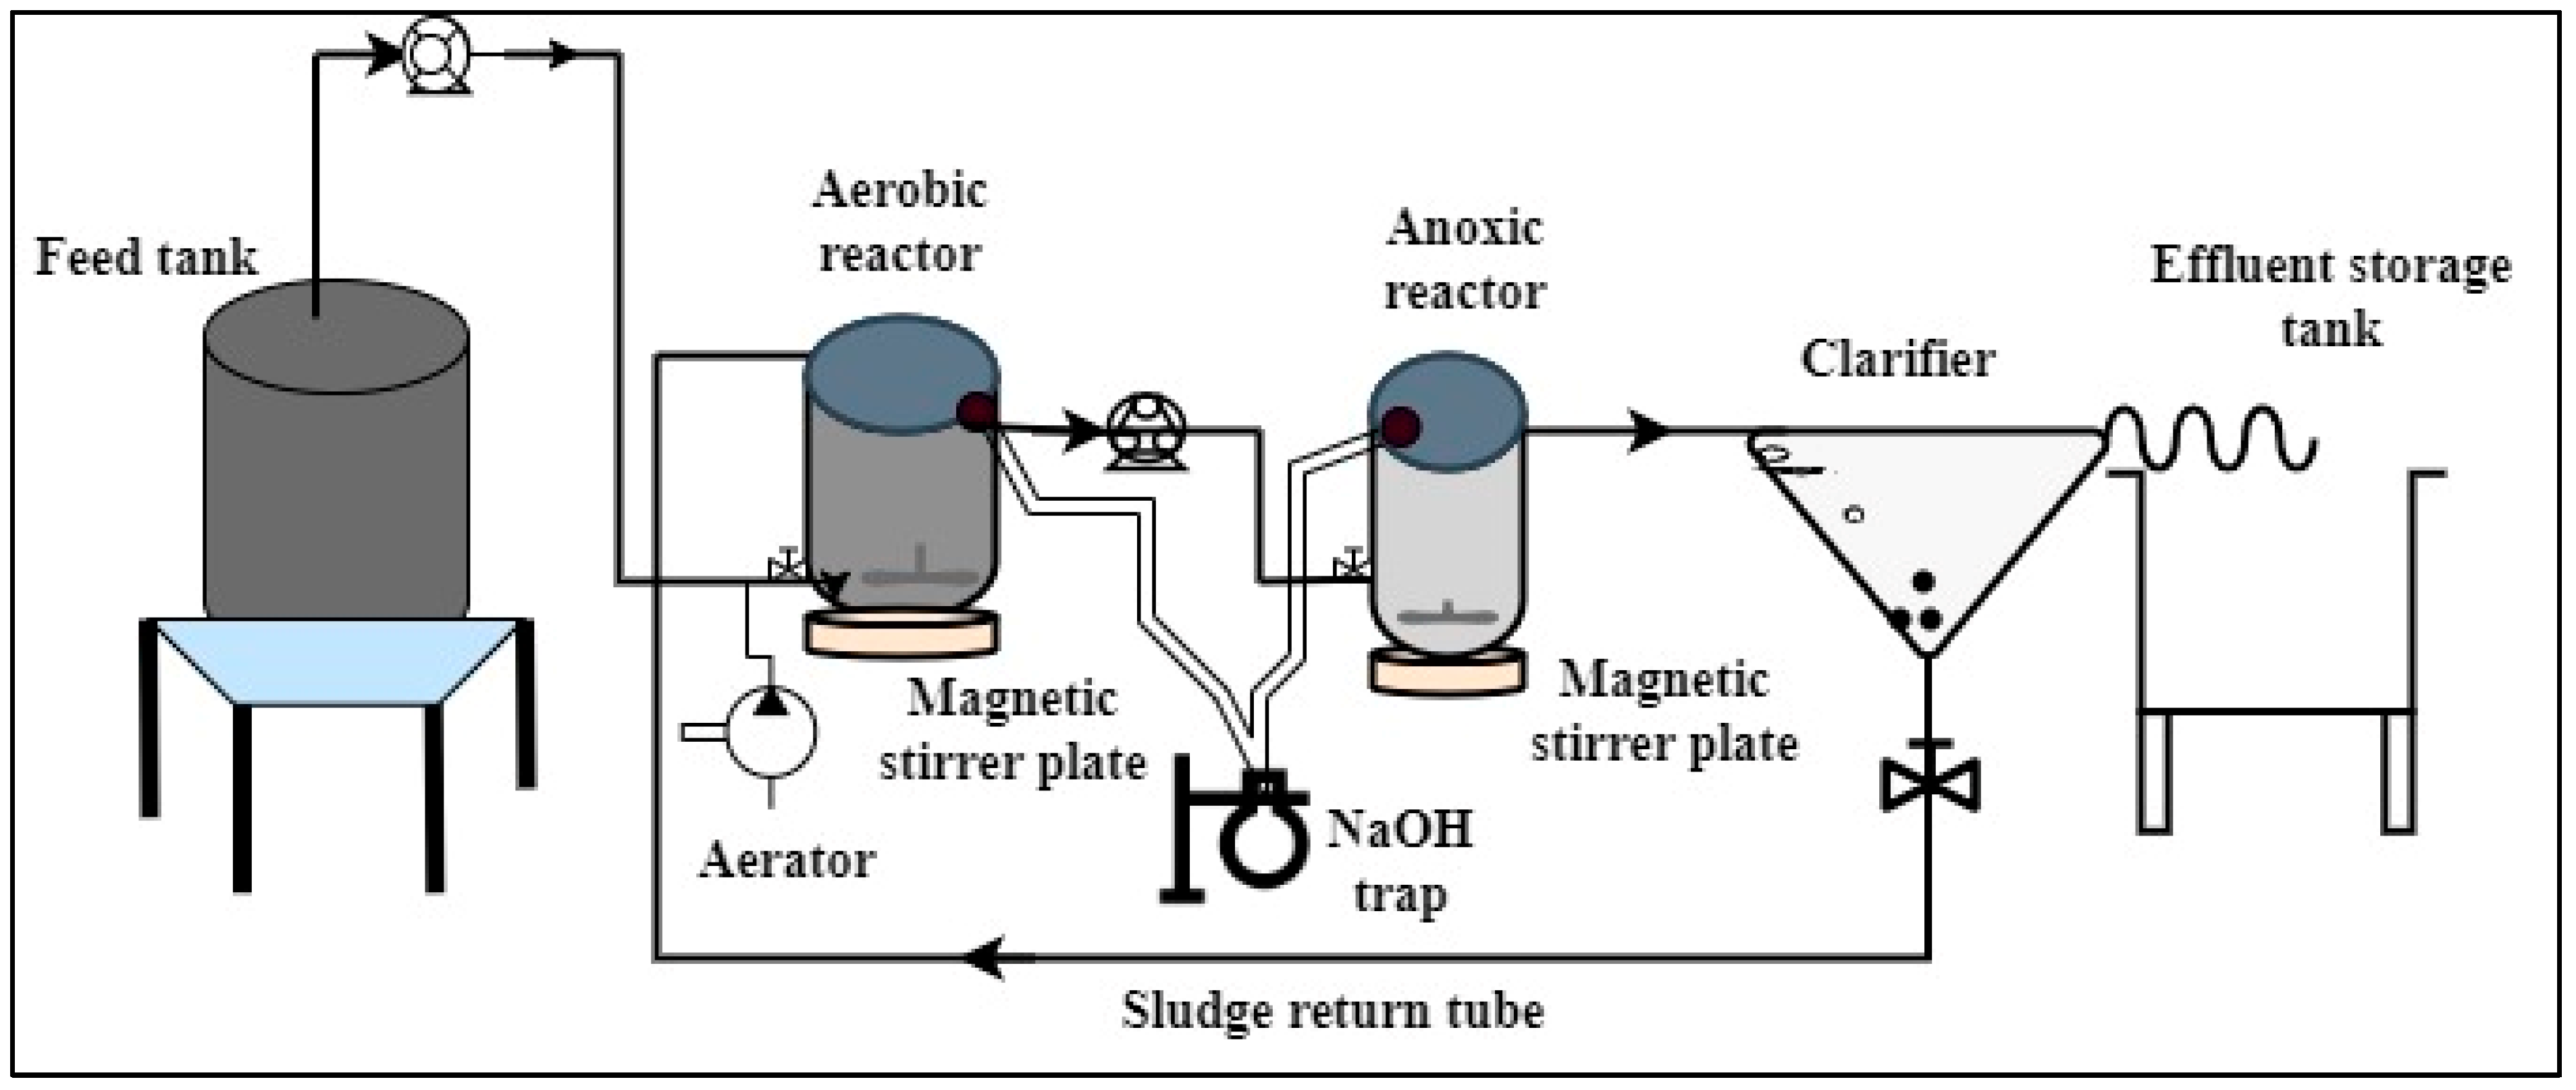
The treatment system consists of a feed tank, an aerobic reactor (2 L), an anoxic reactor (1 L), and a clarifier, all operated and sequentially connected using appropriate pipes (Figure 2). Both aerobic and anoxic reactors were continuously mixed using a magnetic stirring bar. In addition, the aerobic reactor was continuously aerated using an adjustable silent air pump (ACO-6603: Hailea Group Co., Ltd., Chaozhou, Guangdong, China). The system was operated at ambient temperature (20 to 25 °C) in the laboratory. To trap HCN, a 1 N NaOH alkaline mixture-filled flask was connected to the two reactors.
The synthetic gold mine wastewater was prepared following the method by Shine et al. 2020 [30] with slight modifications. The chemical formulation of the simulated waste is indicated in Table 1. All the feed components, except sodium carbonate and cyanide, were autoclaved together. Sodium cyanide was mixed in the feed after being filtered by filter sterilization (0.2 µm pore size filter paper). Similarly, sodium carbonate was autoclaved separately and mixed later in a cooling mixture of the feed. Sodium acetate was the only external carbon source. It was only replaced by glycerol in a carbon source optimization study.

2.3. Inoculum Preparation and Operation of Reactors

Sediment (250 g) and water (2.5 L) samples collected from Lake Chitu were thoroughly mixed and stirred, allowing larger particles to settle. After thorough mixing, approximately 50 g of sediment (mud) and 1.4 L of lake water were allowed to settle for 24 h to remove solid particles. The supernatant suspension was then used as inoculum. A one-to-one mixture of the prepared inoculum and simulated wastewater was added to both the aerobic and anoxic reactors, 1.8 L and 0.8 L, respectively, below the holding capacities of the reactors. After 24 h in the reactors, the wastewater treatment began, and the simulated wastewater continuously flowed with a 0. 8 mL/min flow rate from the feed. The aerobic reactor had a working volume of 2 L, and the average Hydraulic Retention Time (HRT) was 41.67 h. The partially treated waste continuously flowed into the anoxic reactor with the same flow rate and an average HRT of 20.84 h. The total average HRT of the waste in the reactors was 62.51 h. For the first 85 days, the cyanide concentration was 200 mg/L, the threshold level of most cyanide-degrading microbes [31].
After a steady state was achieved with an initial amount of 200 mg/L of cyanide, the different operation parameters (cyanide concentration, flow rate, carbon source) varied, and their effect on the cyanide removal efficiency of the consortia was determined. Sodium cyanide varied from 200 mg/L to 400 mg/L, 600 mg/L, 800 mg/L, and 1000 mg/L. The flow rate was changed from 0.8 mL/min to 1 mL/min and 1.2 mL/min. The carbon sources used for the optimization study were sodium acetate and glycerol.
During the treatment period, 15–20 mL of sludge from the clarifier was returned to the aerobic reactor at 3-day intervals manually. Samples from the reactors and the final effluent were collected every 5 days to measure residual cyanide concentration, ammonia-nitrogen, nitrite-nitrogen, and nitrate-nitrogen. The pH values of the solution in the reactors, the influent, and the effluent were continuously measured using a portable (Orion 5-Star pH meter: Thermo Fisher Scientific is in Waltham, MA, USA) to ensure high alkalinity by collecting samples from the reactors. The pH of the influent wastewater (feed) was maintained at 10.7. The pH and alkalinity of the inoculum were 10.7 and 7.7%, respectively. The experimental conditions during the operation period are summarized in Table 2.

2.4. Measurement of Residual Cyanide Concentration

Residual cyanide was determined using the picric acid method, colorimetrically [32]. Samples collected from the effluent were centrifuged at 6000 rpm for 10 min to separate biomass. The supernatant was then diluted with alkaline water (pH, 10.8) to bring the cyanide concentration in the range of 1–5 mg/L. On 7 mL of diluted supernatant, a 2.5 mL alkaline picrate solution was added, mixed well, and incubated at 90 °C for 15 min in a boiling water bath. After cooling, absorbance was measured at 520 nm in triplicate using a spectrophotometer (JANEWAY 6300; Richmond Scientific, Chorley, UK). Cyanide concentration was determined from a standard curve prepared using a known concentration of sodium cyanide from 0.5 mg/L to 5 mg/L. Percent cyanide removal (PR) was calculated based on Equation (1).
P R = I C R C I C 100
where IC = initial cyanide (mg/L) and RC = cyanide concentration (mg/L).

2.5. Measurement of Other Nitrogenous Compounds

The concentration of ammonia-N, ammonium-N, nitrite-N, and nitrate-N was determined by the (Palintest photometer 7500; Palintest Ltd., Gateshead, UK) an advanced digital colorimeter. The samples from the reactors and effluent were collected using a 50 mL sterilized Falcon tube and centrifuged at 6000 rpm/15 min. Then, 10 mL of the cell-free filtrate was taken and dissolved with a specific tablet and measured according to the company’s instructions. The summation of ammonia-N and ammonium-N is considered Total Ammonium-Nitrogen (TAN), and the summation of TAN, nitrite-N, and nitrate-N is considered Total Inorganic Nitrogen (TIN).

2.6. Statistical Analysis

The cyanide percent removal and nitrogenous waste concentration data for this study were analyzed using SPSS Version 23.0 software. Mean values and standard deviations were calculated for triplicate measurements of cyanide and nitrogenous waste concentration using analysis of variance (ANOVA). A significant level of p < 0.05 was used to determine the statistical significance between different data groups.

3. Results

3.1. Establishment of Cyanide-Degrading Alkaliphilic Microbial Consortia

During the first 85 days of treatment, the inoculum seeded in the reactor was acclimatized with simulated gold mine wastewater holding 200 mg/L of sodium cyanide. In the acclimatization process, flocks and biofilm were formed on the walls of the reactor (Figure 3A,B). Biofilm development in the reactor indicated the natural inoculum was adopting the new treatment condition and cyanide-degrading consortia were established.

3.2. Cyanide Degradation Performance of the Treatment System

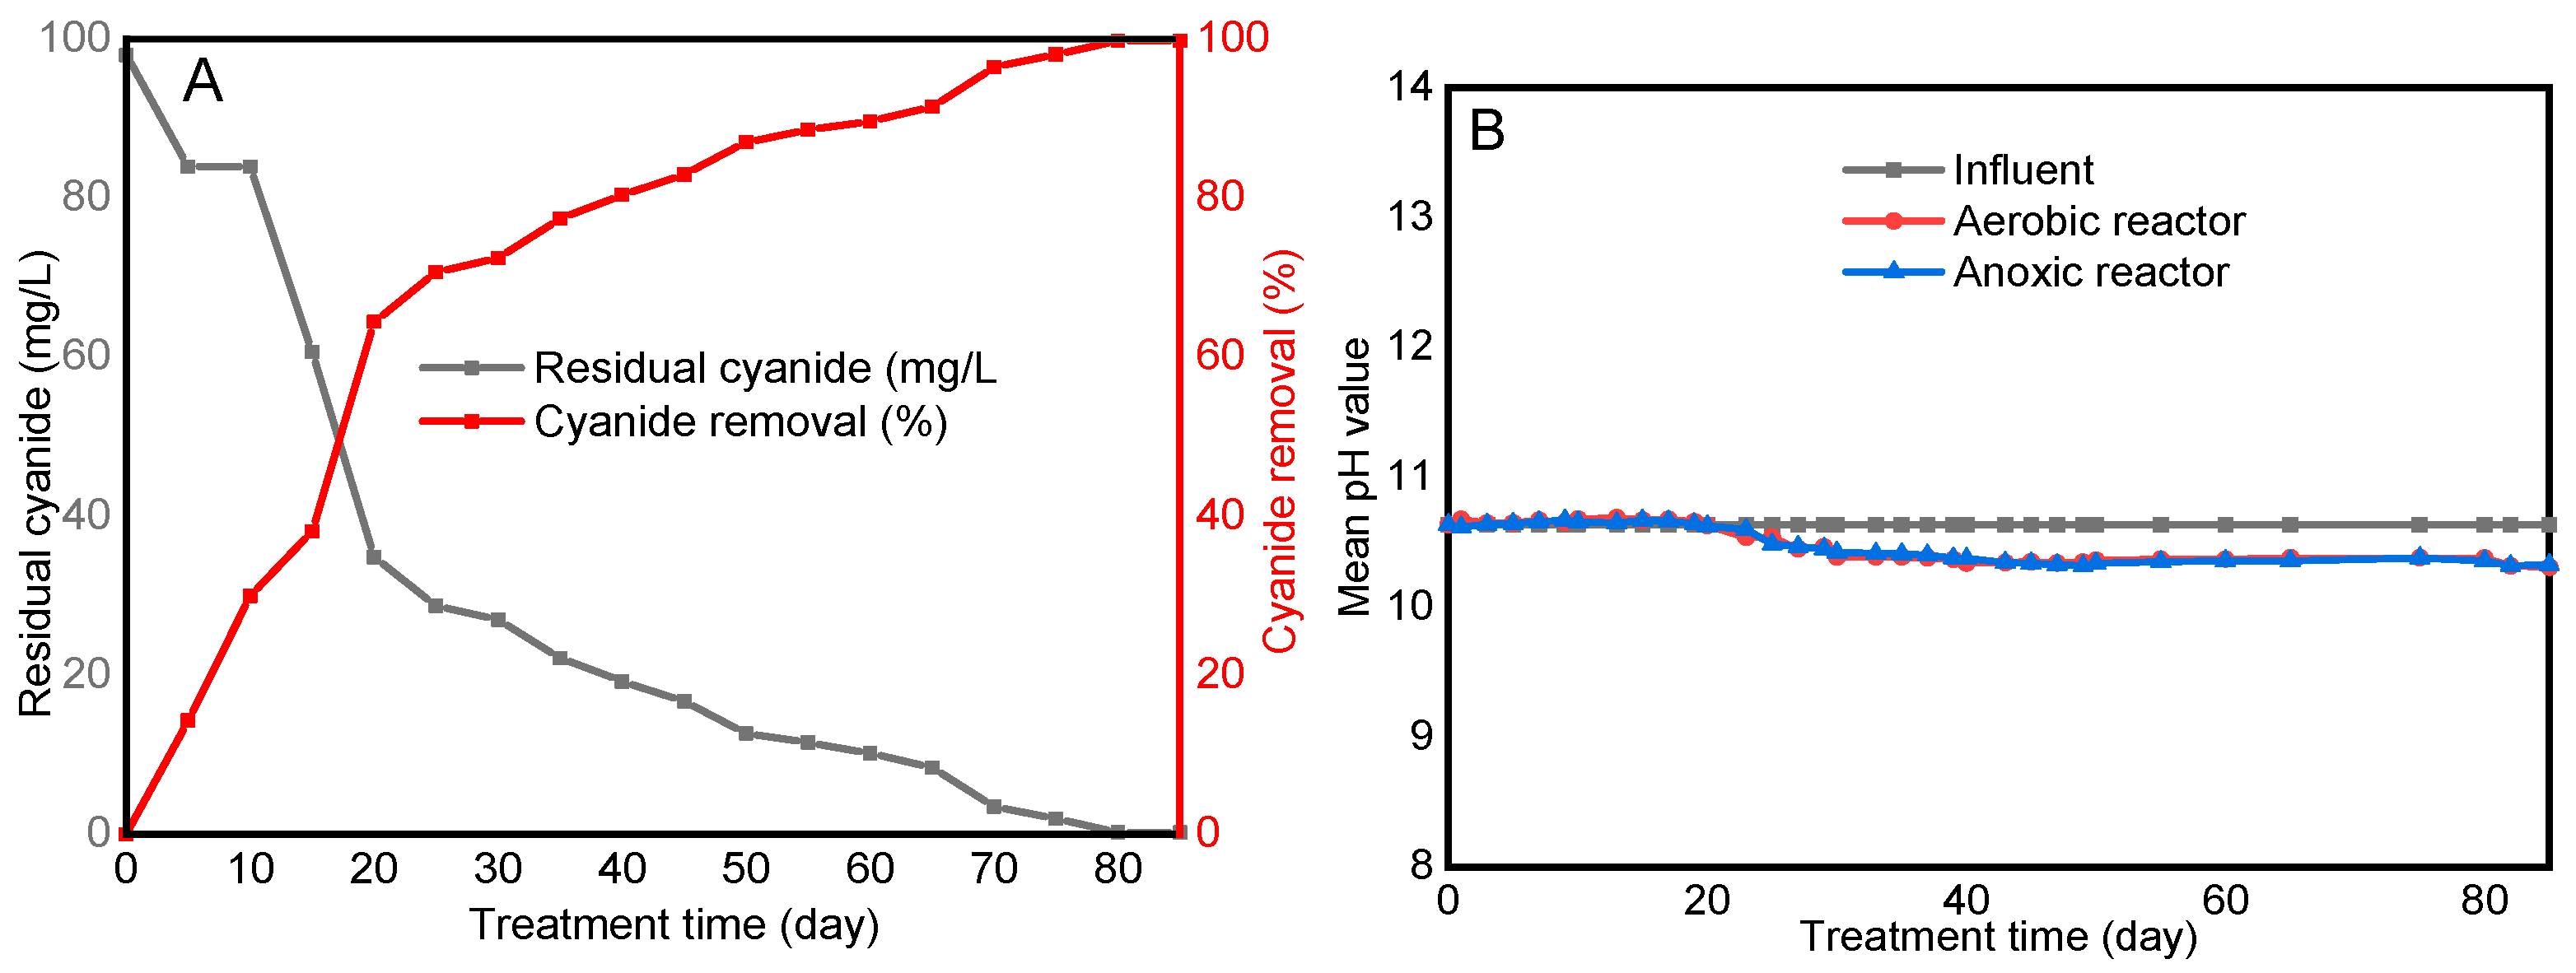
During the consortia establishment process, the cyanide removal potential of the consortia was also evaluated. Cyanide degradation was observed after 5 days of treatment (Figure 4A). Cyanide removal was at its maximum between days 15 and 25. After the treatment system was run for 80 days, 99.74 ± 0.08% of cyanide was removed from the simulated waste. Residual cyanide remained unchanged after day 80, indicating that the consortia reached a steady state. At the time of the steady state, the residual cyanide concentration in the final effluent was 0.253 ± 0.08 mg/L.

3.3. The pH of the Solution and the Feed

In the present study, pH was critically considered and continuously monitored throughout the whole operation period. At the time of sampling, the pH of the lake water was 10.76. The pH of the feed was adjusted to 10.7 and conserved until the end of the treatment (Figure 4B). Consortia survived under this high pH. The sodium carbonate (10%) used for simulated waste formulation enabled the pH of the solution to be stabilized during the treatment process. However, a slight pH decrease was observed after day 20 (Figure 4B). This slight pH variation noticed during the treatment period, however, did not affect the cyanide biodegradation potential of the consortia.

3.4. Production of Nitrogenous Compounds from Cyanide Biodegradation

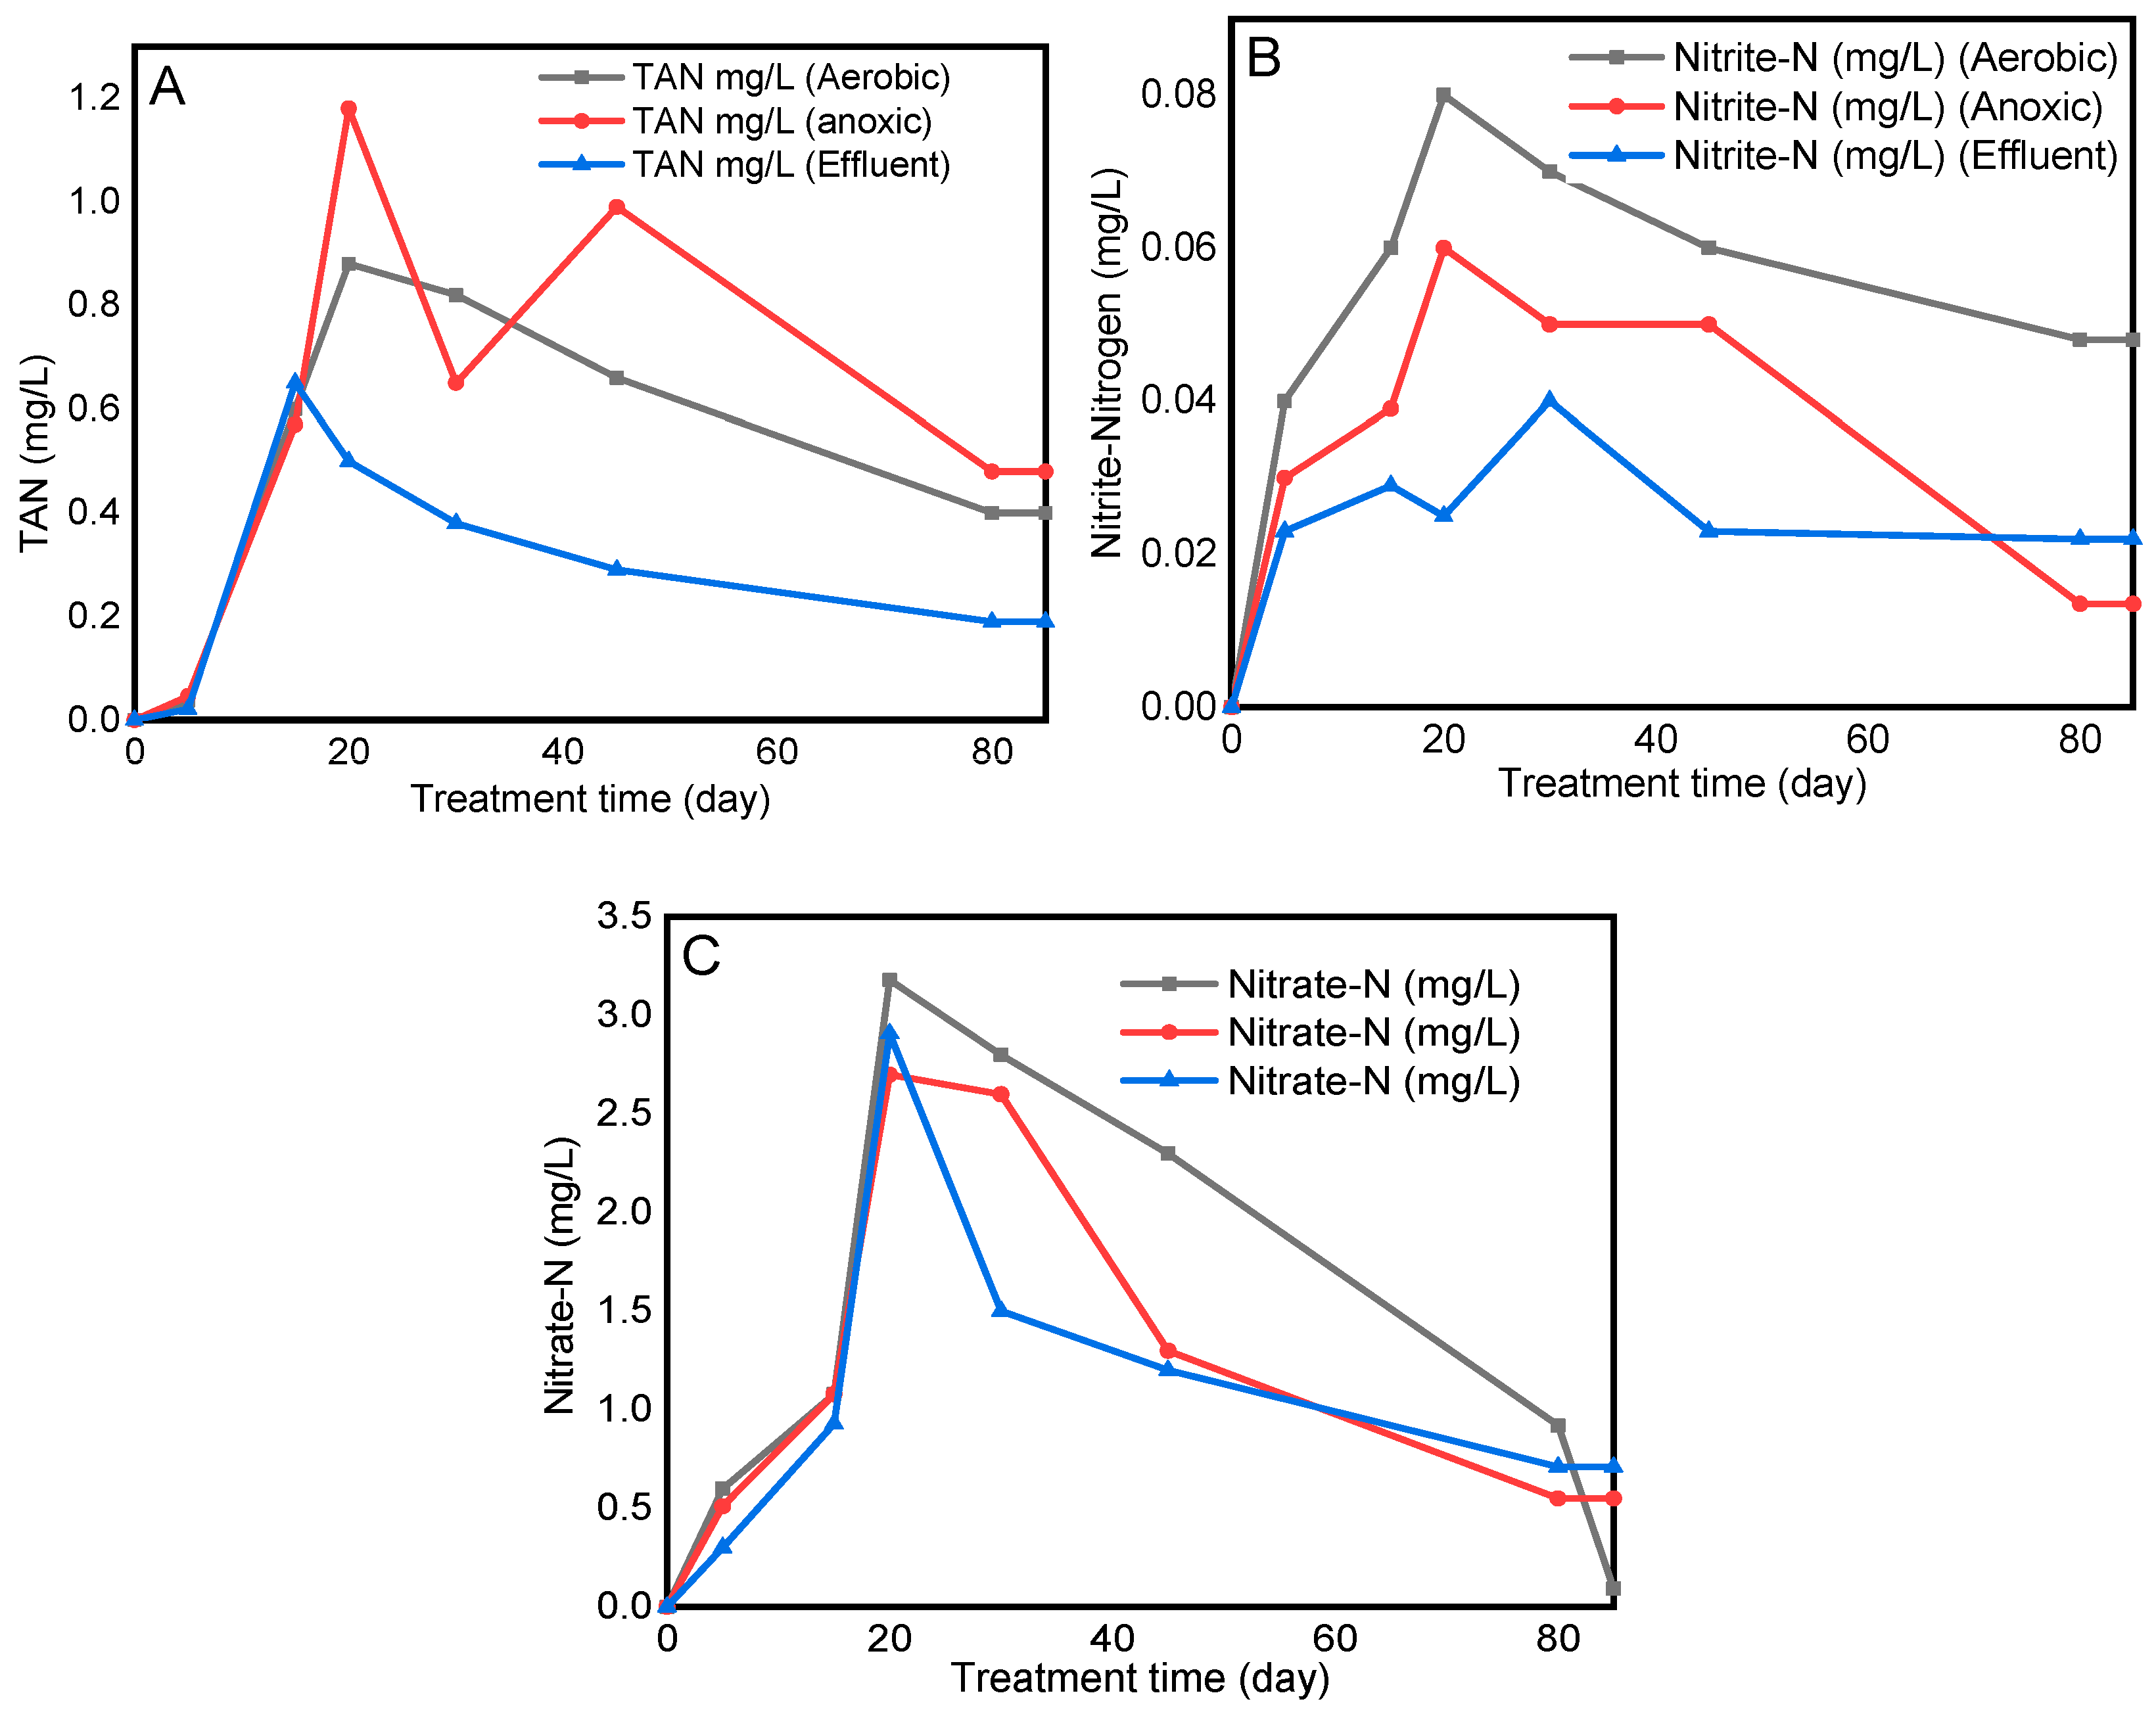
Ammonium-N, nitrite-N, and nitrate-N were below the instrument’s detection limit for the first five treatment days, with sodium cyanide used as the sole nitrogen source. The maximum TAN level was measured on day 20, with concentrations of 0.88 mg/L in the aerobic reactor, 1.18 mg/L in the anoxic reactor, and 0.65 mg/L in the final effluent (Figure 5A). Throughout the treatment period, the concentration of TAN remained very low. The TAN was detected even after the system reached a steady state, with 99.74 ± 0.08% of cyanide removed. Once the system reached a steady state, the TAN concentration in the effluent was 0.2 mg/L. A clear correlation between cyanide degradation and TAN production was observed in the reactors. The reactor profiles indicated that the rapid degradation of cyanide coincided with an increase in TAN levels. Notably, no alternative nitrogen sources were present in either the reactor or the initial feed, suggesting that the observed TAN production is directly linked to the breakdown of cyanide.
As TAN concentrations declined in the treatment days, the concentration of nitrite-N and nitrate-N also decreased (Figure 5B,C), indicating the presence of simultaneous nitrification and denitrification. Nitrite-N and nitrate-N levels were slightly higher in the aerobic reactor compared to the anoxic reactor. Nitrite-N concentrations throughout the operation ranged between 0.02 and 0.04 mg/L, and nitrate concentrations were between 0.71 and 12.6 mg/L.

3.5. Optimization of the Integrated System and the Established Consortia

3.5.1. The Degradation Efficiency of the Consortia for Different Cyanide Loads

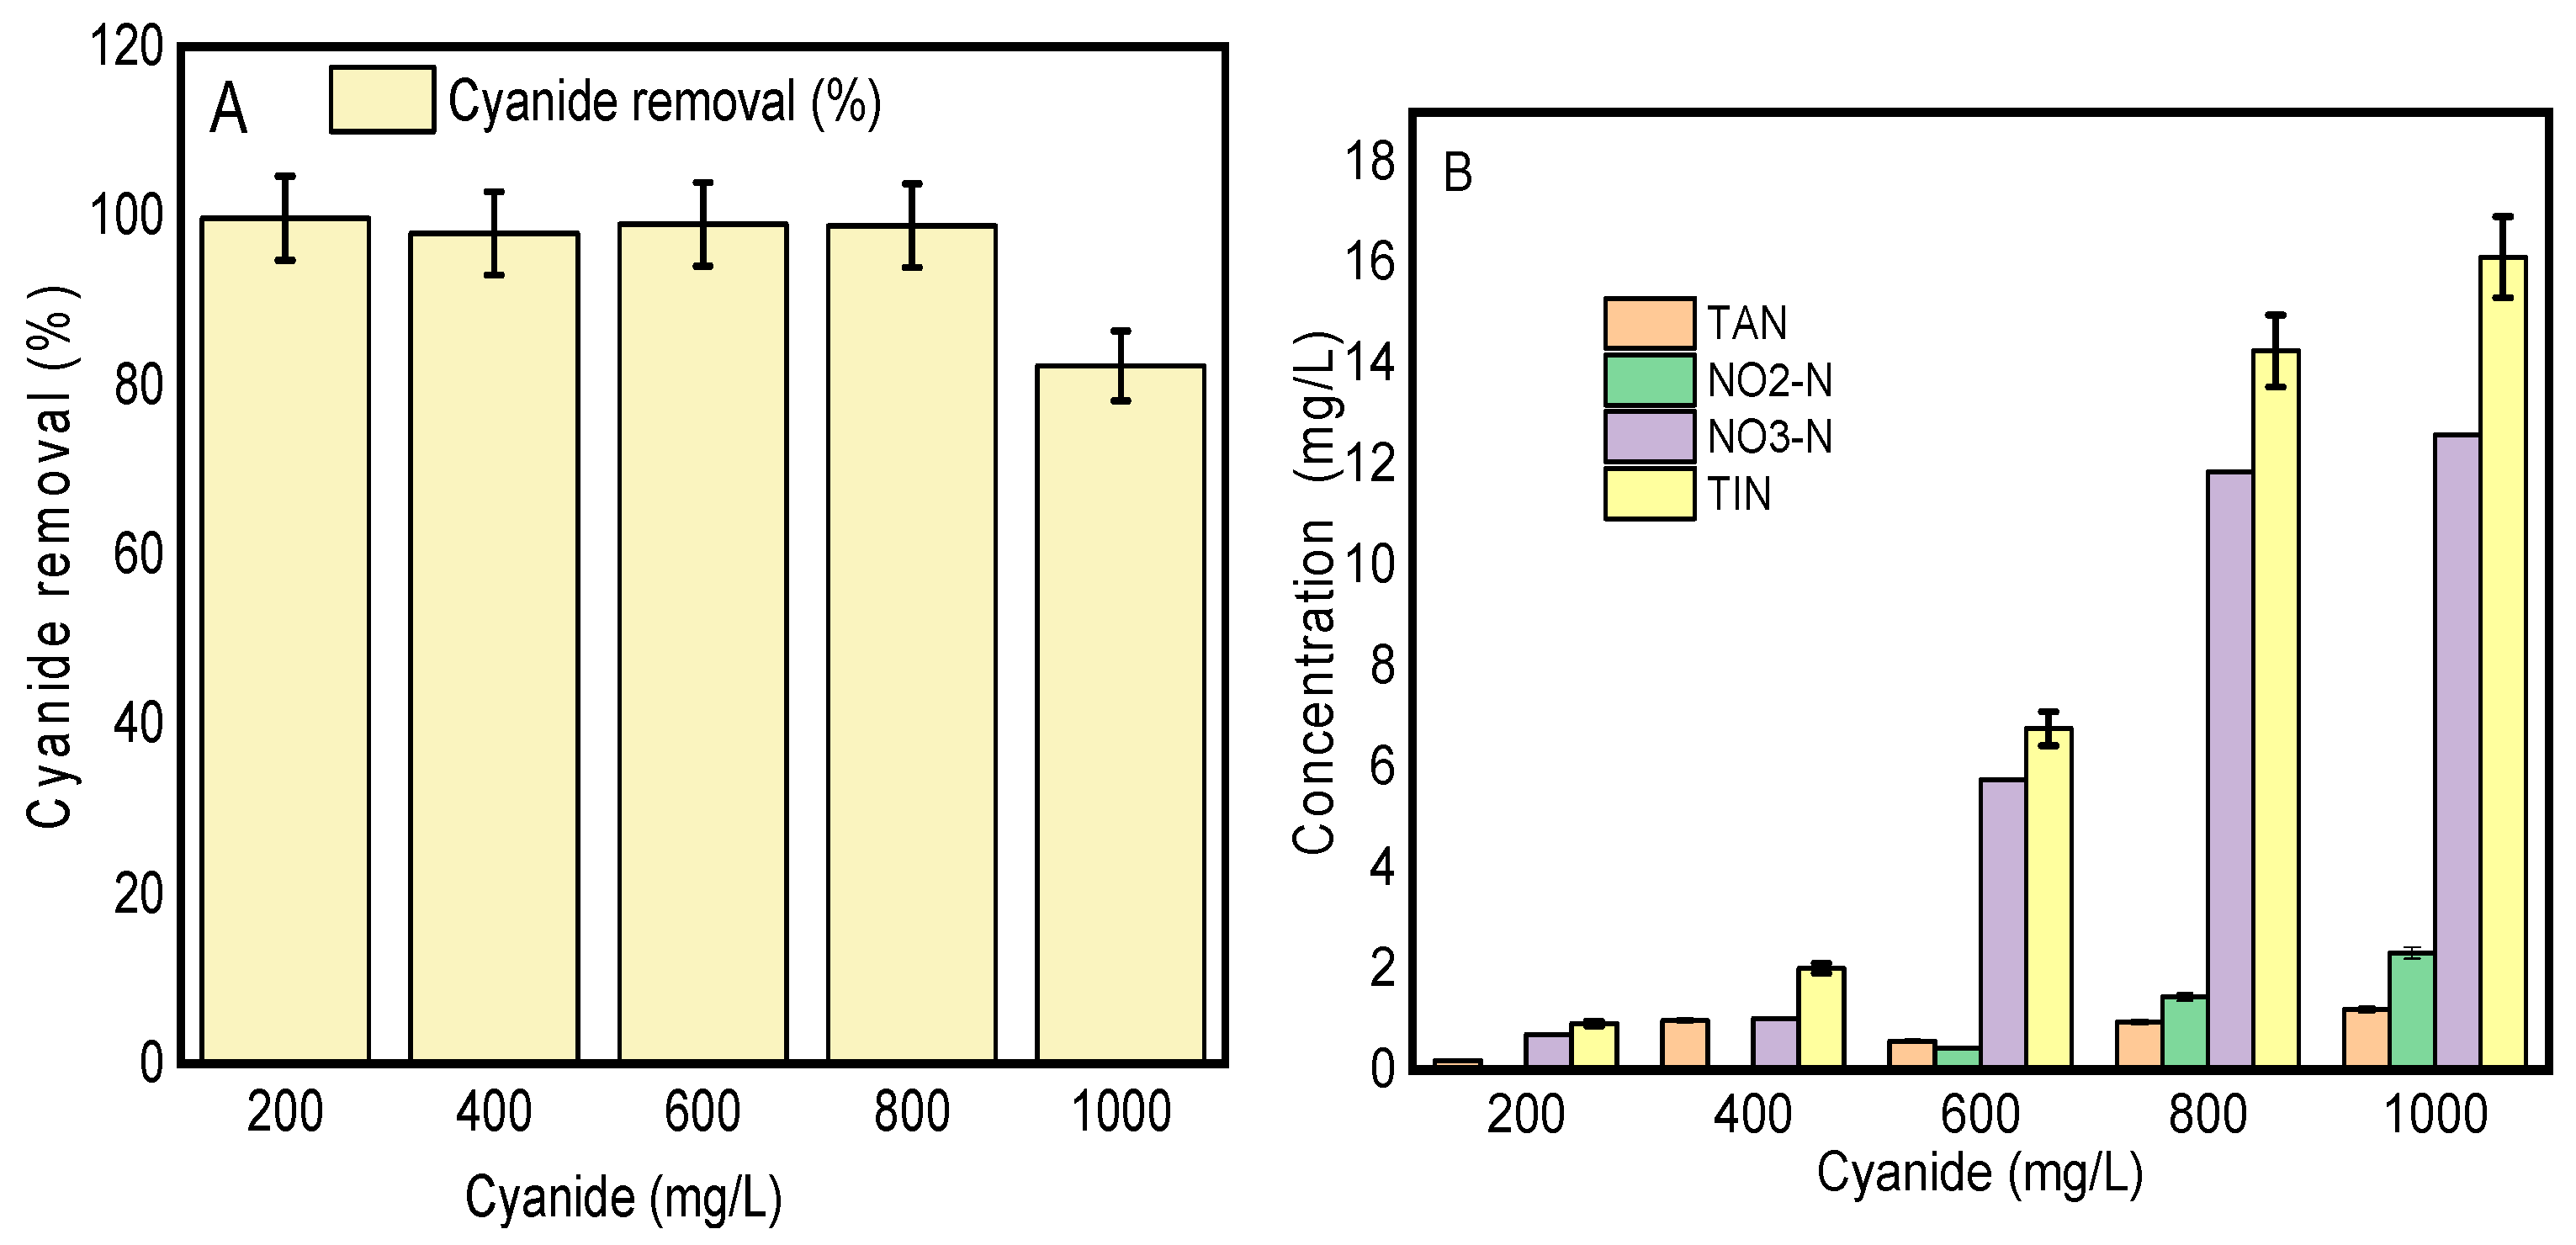
The maximum cyanide degradation potential of the established consortia was evaluated by increasing the cyanide concentration up to 1000 mg/L. The cyanide removal efficiency was 97.94 ± 0.10% for 400 mg/L, 99.02 ± 0.03% for 600 mg/L, 98.85 ± 0.03% for 800 mg/L, and 82.34 ± 1.17% for 1000 mg/L sodium cyanide (Figure 6A). No significant variation (p > 0.05) in cyanide removal was observed up to 800 mg/L. The consortia effectively reduced cyanide to meet the International Cyanide Management Code (ICMC) discharge limit of 0.2 mg/L within 20 treatment days. However, significant inhibition of cyanide biodegradation was noticed at 1000 mg/L.
The TIN in the final effluent for the various cyanide concentrations was below 18 mg/L (Figure 6B). Both TAN and TIN slightly increased when the cyanide load was increased from 200 mg/L to 1000 mg/L in the feed. However, it was still under the range of the permitted discharge standards for industrial wastewater.

3.5.2. The Effects of Carbon Sources on Cyanide Biodegradation

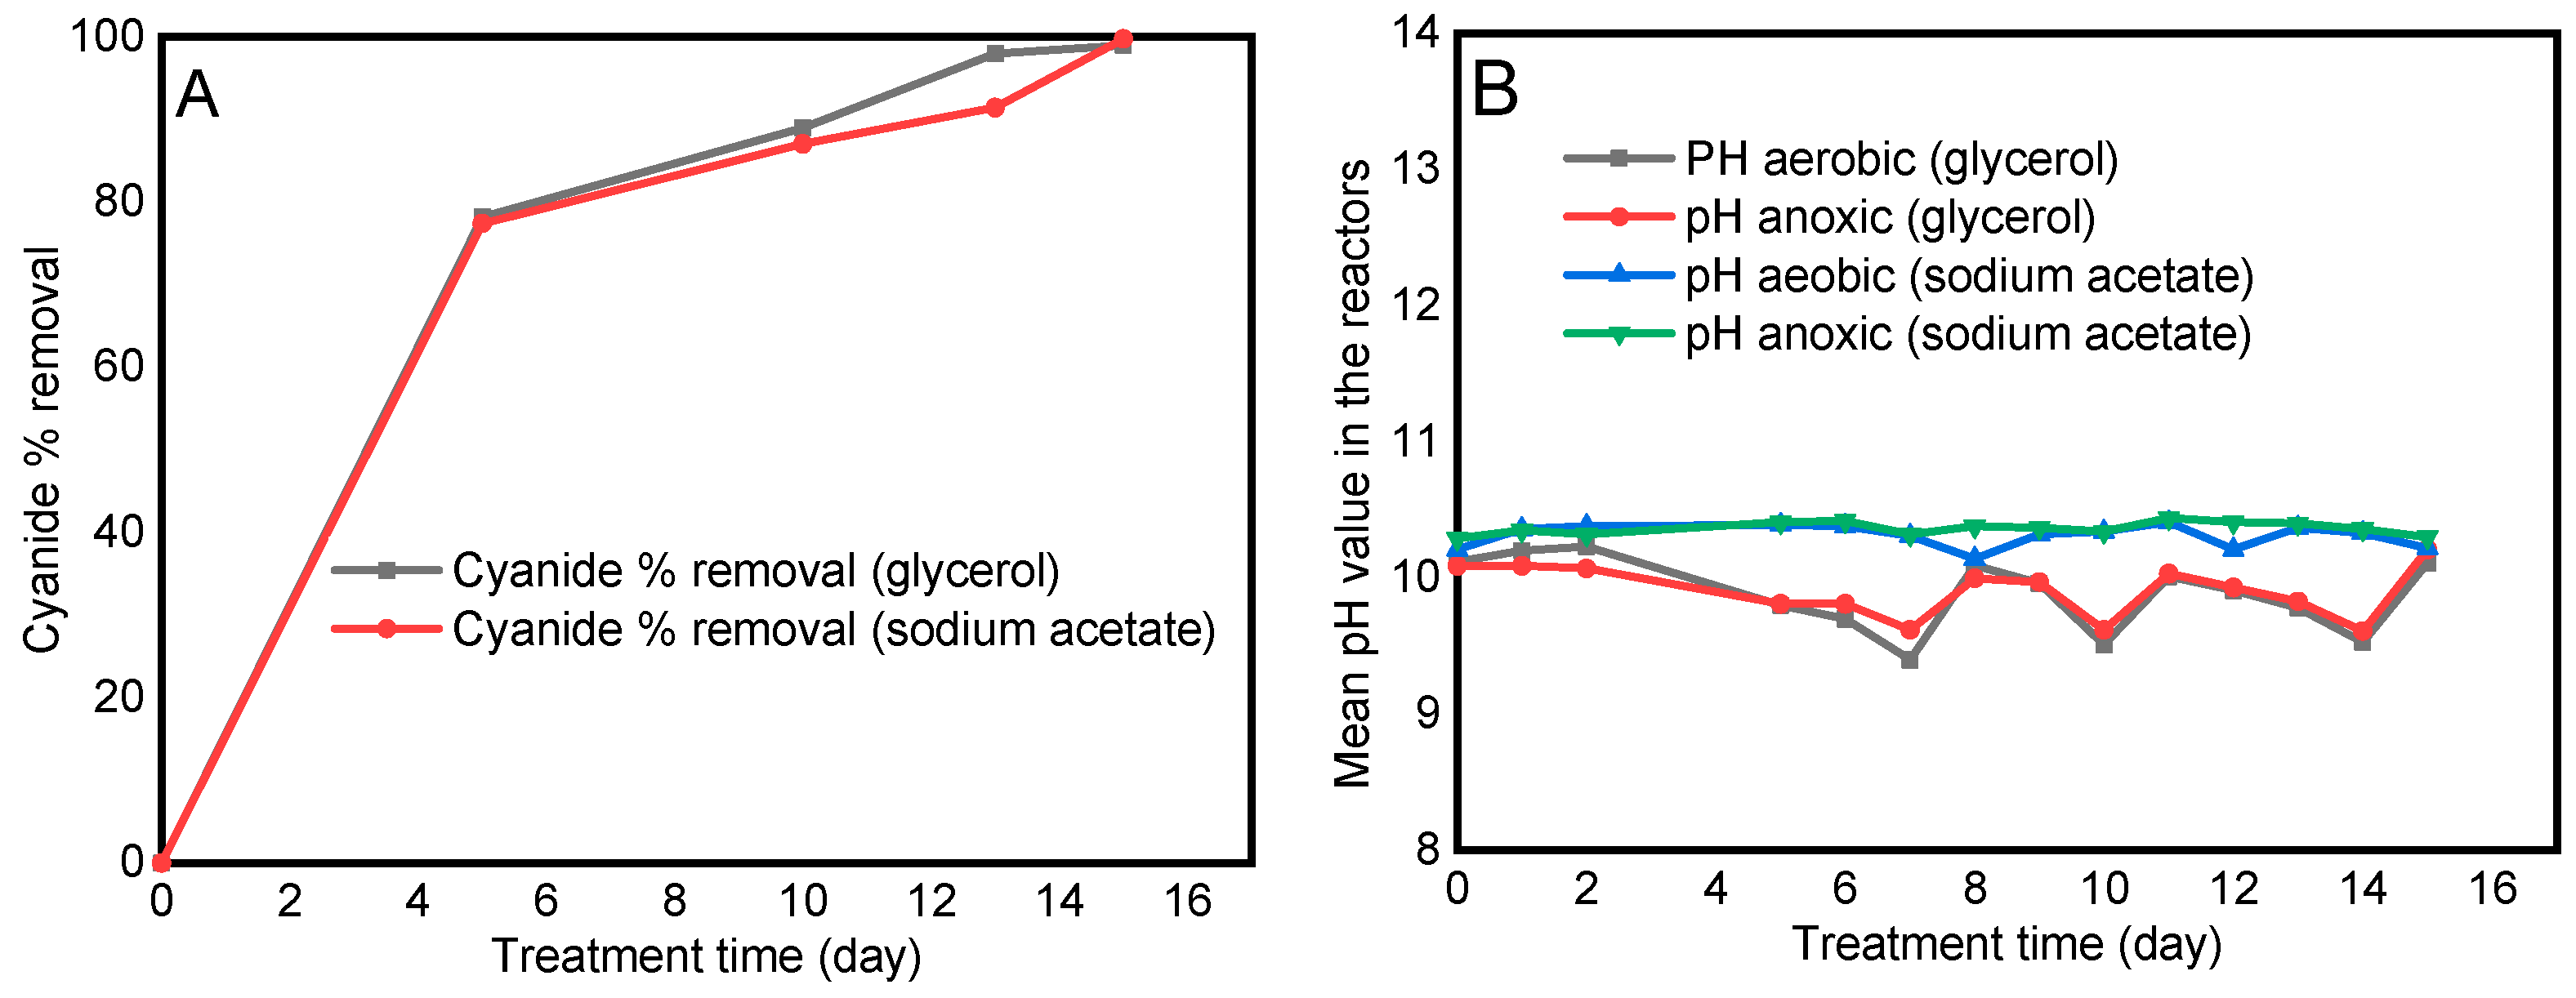
The cyanide degradation efficiency of the consortia was 99.74 ± 0.08% when sodium acetate was used as a carbon source and was not significantly affected when it was replaced by glycerol (Figure 7A). The only major difference noticed in the treatment process was pH fluctuation when glycerol was used as a carbon source (Figure 7B). When glycerol was used as a carbon source, the pH of the solution in the reactor was adjusted by sodium carbonate on days 7, 10, and 14 to control cyanide volatilization.

3.5.3. Effect of Hydraulic Retention Time

Once stable consortia were established, the effect of HRT on cyanide removal was examined. The HRT varied, by adjusting the flow rate to 0.8 mL/min, 1 mL/min, and 1.2 mL/min. The rate of the removal of cyanide when the flow rate was 0.8 mL/min was 99.39 ± 0.07% in 15 days (Figure 8A). The cyanide removal was not changed significantly when the flow rate was increased to 1 mL/min and 1.2 mL/min.
As the flow rate increased from 0.8 mL/min to 1.2 mL/min, the TAN and TIN increased significantly (Figure 8B).

4. Discussion

Different treatment setups using a single aerobic reactor have been evaluated for the treatment of cyanide-rich gold mine wastewater. Most of these studies lack efficiency and stability [7,33]. The present study proposed and established a new gold mine wastewater treatment setup incorporating both aerobic and anoxic reactors connected in series. Microbial consortia from Ethiopian Rift Valley soda lakes were acclimatized with simulated gold mine wastewater. In the acclimatization process, biofilms and flocks were formed in the reactors. The formation of biofilms and flocs suggests a stable community was established. Biofilm formation enhances degradation by providing a stable environment for microbial communities, increasing resistance to toxic compounds, and improving overall pollutant removal efficiency [34]. This enhancement occurs due to the formation of stable anoxic/anaerobic and aerobic zones that support different microbial activities [31,35].
During the consortia establishment process, cyanide removal was monitored. Cyanide removal was minimal during the initial stages of treatment. The sluggishness in cyanide degradation was likely due to the inactivity of microorganisms and important enzymes involved in the degradation process before cyanide induction. Previous studies on pure cultures have indicated that cyanide-degrading enzymes are inactive before being induced by cyanide, suggesting that induction time is necessary for cyanide-degrading enzymes [36]. The initial delay in cyanide degradation may also be attributed to the low cell density in the natural inoculum at the start of the process. The maximum level of cyanide degradation was observed between days 15 and 25, consistent with batch treatment studies showing accelerated degradation once microbes have adapted to the cyanide-holding medium and the new environment [30,37]. The residual cyanide concentration after 80 days of treatment remained unchanged, indicating that the consortia reached a steady state. In a steady state, the cyanide concentration in the final effluent nearly complied with the International Cyanide Management Institute (ICMI) discharge limit of 0.2 mg/L [9,10], showing the effectiveness of the consortia with the established setup.
The cyanide degradation potential of the established consortia was evaluated by increasing the cyanide concentration to 1000 mg/L. The consortia were effective up to 800 mg/L. Cyanide was degraded up to regulatory discharge limits of the ICMI permissible limit [9,10]. However, 1000 mg/L induced significant stress on the consortia. The cyanide concentration in most goldmine effluents is between 10 mg/L and 100 mg/L [7,8]. Previous studies with different treatment setups reported similar cyanide removal but were conducted with lower cyanide concentrations, longer treatment times, and higher HRTs [32,38].
Cyanide volatilization had minimal impact on the treatment process, with removal attributed entirely to microbial activity. To ensure cyanide removal was solely microbial, the pH of the solution was maintained as highly alkaline throughout the treatment period [21]. The main challenge in the biodegradation of gold mine wastewater is the lack of microorganisms adaptable to high alkaline pH conditions. Lowering the pH of the wastewater increases the risk of cyanide volatilization in the environment [10]. Therefore, in the gold mine wastewater treatment, the pH of the solution should be above 9.3. In the present study, the pH of both the feed and the reactor solutions remained above 10 throughout the treatment period. The consortia survived in this high pH as they originated from a highly alkaline soda lake with an average pH of 10.7. The pH of the solution in the reactors was in accordance with the pH levels reported for the lake over several years, 9.5 to 10.7 [27,28,29,39]. Previous studies reported that cyanide biodegradation is affected at pH levels above 10, as most cyanide-degrading enzymes function optimally between pH 6 and 9 [14,40]. However, at this pH range, some cyanide is released into the environment as a gas before treatment [10]. In the present study, consortia were able to survive and treat cyanide at pH values of 10.3 to 10.7. This highlights that Ethiopian Rift Valley soda lakes are ideal sources of cyanide-degrading microorganisms and promising for the treatment of cyanide-rich gold mine wastewater. The lake’s highly alkaline conditions allowed microbes to adapt to alkaline waste in the external environment.
Cyanide biodegradation results in the production of nitrogenous compounds such as ammonia and ammonium from cyanide degradation, and nitrites and nitrates from the oxidation of ammonia [1,41]. Ammonium can be produced from aerobics [42] and anaerobic [5] cyanide degradation. Throughout the treatment process, total ammonia nitrogen remained very low. This suggests that consortia may be involved in heterotrophic nitrification, aerobic denitrification, or ammonium assimilation in the reactors, as reported by [18,43]. The total ammonia nitrogen levels in the reactor increased during high cyanide degradation and decreased when cyanide degradation was low, given that no other nitrogen sources were provided in the reactors or the feed. Similar findings were reported by [44]. Total ammonia nitrogen above 5 mM impaired the cyanide degradation activity of microorganisms [36]. In the present study, the TAN throughout the treatment period remained below 1.2 mg/L, a non-inhibitory level for microbial growth [45]. Ammonia was not completely removed, even after the system reached a steady state, and nearly all cyanide was removed. The source of this ammonia is possibly due to the metabolic processes of microorganisms. A similar result is reported by [20,46]. On the final treatment days, the TAN concentration in the discharged effluent was 0.2 mg/L, which is below the permissible limit according to the Ethiopian Environmental Protection Authority [47].
During the treatment process, nitrite and nitrate were detected. Microorganisms convert ammonia into nitrite and nitrate [48]. As the TAN level declined, the concentration of nitrite-N and nitrate-N also decreased, indicating that simultaneous nitrification and denitrification were occurring in the treatment system. Ammonia oxidizers and denitrifiers are noncompetitive; they target different substrates in distinct steps of the nitrogen cycle and usually coexist in the same environment [49].
Nitrite in anoxic conditions can be accumulated due to a deficiency of oxygen and increased competition between nitrate and nitrite reductases for electrons [50]. As a result, the integration of the anoxic reactor with the aerobic reactor likely not only increased cyanide biodegradation but also facilitated the denitrification process. This is because heterotrophic microorganisms under oxygen deficiency typically reduce nitrate first to nitrite, then to different nitrogen oxides, and finally to nitrogen gas [51]. Therefore, cyanide degradation could be facilitated in the aerobic reactor, and the anoxic reactor increased the denitrification process. The integration of the two reactors increased the overall removal of cyanide and reactive nitrogen species. The concentration of nitrite and nitrate throughout the operation period met the regulatory discharge limit of (0.5 to 1 mg/L-N) guideline standard for industrial wastewater of many countries, including Ethiopia [47].
Cyanide is a chemical compound with carbon and nitrogen, but its chemical nature makes it a poor carbon source [52]. However, some microorganisms can use high concentrations of cyanide (>200 mg/L) as a sole carbon and nitrogen source [33]. However, the addition of external carbon sources proportional to cyanide concentration can improve cyanide degradation. In this study, sodium acetate and glycerol were used, while aldehydes and ketones were excluded. Consortia degraded cyanide effectively with either sodium acetate or glycerol. Several microbes can utilize these compounds as sole carbon and energy sources [53]. Studies conducted on a pure bacterial isolate, Aerococcus viridans, indicated glycerol is the preferred carbon source compared to other carbon sources [23]. However, some cyanide-degrading microorganisms like Burkholderia cepacia strain C-3 cannot degrade cyanide when glycerol is used as the only external carbon source but can effectively degrade cyanide when sodium acetate or sugars are used, suggesting species-specific carbon source preferences [54]. In the present study, when glycerol was used as a carbon source, the pH in the reactors fluctuated. The pH of the solution in the reactors was adjusted with sodium carbonate. According to Bell et al. (1992) [55], the pH of buffered solutions can be reduced by glycerol. However, several variables such as ammonia and acid production can affect the pH, and the glycerol effect alone may not fully explain these pH fluctuations.
Despite variations in HRT, the consortia maintained a high cyanide removal level. The observed degradation performance under this HRT aligns with previous studies. For instance, Villemur et al. (2015) [56] reported nearly 99% of cyanide removal with four-stage moving bed biofilm reactors (MBBRs) from a 36 to 40 h HRT over 566 treatment days. Similarly, Guamán Guadalima et al. (2018) [33] reported nearly 97% cyanide removal at a 10 h HRT using alkaliphilic consortia sourced from goldmine wastewater. In the present study, varying the flow rate, which affects the HRT, from 0.8 mL/min to 1.2 mL/min did not affect the cyanide removal efficiency of the consortia. However, there was a slight increase in TIN and nitrate-N with a flow rate rise. Despite these increases, the levels of residual cyanide in the final effluent and the reactive nitrogen species remained within the permissible limits set by the ICMI [10,47].

5. Conclusions

A novel aerobic-anoxic integrated gold mine wastewater treatment system was established, and the optimal treatment condition was optimized. Microbial consortia capable of tolerating high concentrations of cyanide were developed. The consortia removed approximately 99% of cyanide for up to 800 mg/L of cyanide. The established consortia were also effective in removing reactive nitrogen species derived from cyanide biodegradation. The final treatment effluent met the regulatory discharge limits of cyanide and nitrogen species recommended by regulatory bodies such as WHO and ICMI. This treatment system is recommended as a viable treatment method for real gold mine wastewater. The study indicates that Lake Chitu is a source of alkaliphilic cyanide-degrading microbes. Future experiments to scale up the process and characterize the microbial communities will shed additional light on the potential for this biotechnological process to minimize cyanide toxicity associated with gold mine effluents.

Author Contributions

G.B.: conceptualization, data curation, formal analysis, investigation, methodology, software, validation, visualization, writing—original draft, writing—review, and editing. C.S.: Conceptualization, data curation, formal analysis, investigation, methodology, software, supervision, validation, visualization, writing—review, and editing. A.S.: Conceptualization, data curation, formal analysis, fund acquisition, investigation, methodology, project administration, resource, supervision, validation, visualization, writing—review and editing. C.J.P.: Conceptualization, data curation, formal analysis, investigation, methodology, project administration, resource, supervision, validation, visualization, writing—review and editing. All authors have read and agreed to the published version of the manuscript.

Funding

This study was financed by the Swedish International Development Cooperation Agency (SIDA) through a research and training grant awarded to Addis Ababa University and the Swedish University of Agricultural Sciences (AAU-SLU Biotech) (https://sida.aau.edu.et/index.php/biotechnology-phdprogram) accessed date on 12 June 2024.

Data Availability Statement

Data are contained within the article.

Acknowledgments

The authors acknowledge Addis Ababa University, Institute of Biotechnology, and Lund University, Division of Applied Microbiology, Department of Chemistry. The authors acknowledge the Ethiopian Environmental Protection Authority’s permission to collect water and mud samples from Lake Chitu. The authors extend their gratitude to Amare Gessesse and Solomon Enquahone for their support.

Conflicts of Interest

The authors declare that the research was conducted in the absence of any commercial or financial relationships that could be construed as potential conflicts of interest.

References

  1. Sharma, M.; Akhter, Y.; Chatterjee, S. A review on remediation of cyanide containing industrial wastes using biological systems with special reference to enzymatic degradation. World J. Microbiol. Biotechnol. 2019, 35, 70. [Google Scholar] [CrossRef]
  2. Alvillo-Rivera, A.; Garrido-Hoyos, S.; Buitrón, G.; Thangarasu-Sarasvathi, P.; Rosano-Ortega, G. Biological treatment for the degradation of cyanide: A review. J. Mater. Res. Technol. 2021, 12, 1418–1433. [Google Scholar] [CrossRef]
  3. Tu, Y.; Han, P.; Wei, L.; Zhang, X.; Yu, B.; Qian, P.; Ye, S. Removal of cyanide adsorbed on pyrite by H2O2 oxidation under alkaline conditions. J. Environ. Sci. 2019, 78, 287–292. [Google Scholar] [CrossRef]
  4. Wang, J.; Faraji, F.; Ramsay, J.; Ghahreman, A. A review of biocyanidation as a sustainable route for gold recovery from primary and secondary low-grade resources. J. Clean. Prod. 2021, 296, 126457. [Google Scholar] [CrossRef]
  5. Luque-Almagro, V.M.; Cabello, P.; Sáez, L.P.; Olaya-Abril, A.; Moreno-Vivián, C.; Roldán, M.D. Exploring anaerobic environments for cyanide and cyano-derivatives microbial degradation. Appl. Microbiol. Biotechnol. 2018, 102, 1067–1074. [Google Scholar] [CrossRef]
  6. Razanamahandry, L.C.; Onwordi, C.T.; Saban, W.; Bashir, A.K.H.; Mekuto, L.; Malenga, E.; Manikandan, E.; Fosso-Kankeu, E.; Maaza, M.; Ntwampe, S.K.O. Performance of various cyanide degrading bacteria on the biodegradation of free cyanide in water. J. Hazard. Mater. 2019, 380, 120900. [Google Scholar] [CrossRef]
  7. Kumar, V.; Kumar, V.; Bhalla, T.C. Packed bed reactor for degradation of simulated cyanide-containing wastewater. 3 Biotech 2015, 5, 641–646. [Google Scholar] [CrossRef]
  8. Gupta, P.; Sreekrishnan, T.; Shaikh, Z. Application of hybrid anaerobic reactor: Treatment of increasing cyanide containing effluents and microbial composition identification. J. Environ. Manag. 2018, 226, 448–456. [Google Scholar] [CrossRef]
  9. Kumar, V.; Kumar, V.; Bhalla, T.C. Alkaline active cyanide dihydratase of Flavobacterium indicum MTCC 6936: Growth optimization, purification, characterization and in silico analysis. Int. J. Biol. Macromol. 2018, 116, 591–598. [Google Scholar] [CrossRef]
  10. Ofori-Sarpong, G.; Adam, A.-S.; Amankwah, R.K. Detoxification of Cyanide Wastewater by Cyanotrophic Organisms: The case of Phanerochaete chrysosporium. Ghana Min. J. 2020, 20, 34–44. [Google Scholar] [CrossRef]
  11. Anning, C.; Asare, M.O.; Junxiang, W.; Yao, G.; Xianjun, L. Effects of physicochemical properties of Au cyanidation tailings on cyanide microbial degradation. J. Environ. Sci. Health-Part A Toxic/Hazard. Subst. Environ. Eng. 2021, 56, 413–433. [Google Scholar] [CrossRef]
  12. Bird, G.; Brewer, P.A.; Macklin, M.G.; Balteanu, D.; Driga, B.; Serban, M.; Zaharia, S. The solid state partitioning of contaminant metals and As in river channel sediments of the mining affected Tisa drainage basin, northwestern Romania and eastern Hungary. Appl. Geochem. 2003, 18, 1583–1595. [Google Scholar] [CrossRef]
  13. Selebalo, I.M.; Scholes, M.C.; Clifford-Holmes, J.K. A Systemic Analysis of the Environmental Impacts of Gold Mining within the Blyde River Catchment, a Strategic Water Area of South Africa. Water 2021, 13, 301. [Google Scholar] [CrossRef]
  14. Baxter, J.; Cummings, S.P. The current and future applications of microorganism in the bioremediation of cyanide contamination. Antonie Van Leeuwenhoek Int. J. Gen. Mol. Microbiol. 2006, 90, 1–17. [Google Scholar] [CrossRef]
  15. Vuono, D.C.; Vanneste, J.; Figueroa, L.A.; Hammer, V.; Aguilar-Huaylla, F.N.; Malone, A.; Smith, N.M.; Garcia-Chevesich, P.A.; Bolaños-Sosa, H.G.; Alejo-Zapata, F.D.; et al. Photocatalytic Advanced Oxidation Processes for Neutralizing Free Cyanide in Gold Processing Effluents in Arequipa, Southern Peru. Sustainability 2021, 13, 9873. [Google Scholar] [CrossRef]
  16. Kaku, D.U.; Cao, Y.; Al-Masnay, Y.A.; Nizeyimana, J.C. An Integrated Approach to Assess the Environmental Impacts of Large-Scale Gold Mining: The Nzema-Gold Mines in the Ellembelle District of Ghana as a Case Study. Int. J. Environ. Res. Public Health 2021, 18, 7044. [Google Scholar] [CrossRef]
  17. Quiroz, C.J.C.; Quispe, G.d.L.F.; Mamani, M.C.; Choque, G.J.M.; Sacari, E.J.S. Cyanide Bioremediation by Bacillus subtilis under Alkaline Conditions. Water 2023, 15, 3645. [Google Scholar] [CrossRef]
  18. Mekuto, L.; Ntwampe, S.; Akcil, A. An integrated biological approach for treatment of cyanidation wastewater. Sci. Total. Environ. 2016, 571, 711–720. [Google Scholar] [CrossRef]
  19. Cabello, P.; Luque-Almagro, V.M.; Olaya-Abril, A.; Sáez, L.P.; Moreno-Vivián, C.; Roldán, M.D. Assimilation of cyanide and cyano-derivatives by Pseudomonas pseudoalcaligenes CECT5344: From omic approaches to biotechnological applications. FEMS Microbiol. Lett. 2018, 365, fny032. [Google Scholar] [CrossRef]
  20. Razanamahandry, L.C.; Mekuto, L.; Bazie, V.; Andrianisa, H.A.; Karoui, H.; Meibom, K.; Frutschi, M. Free Cyanide Degradation Kinetics of Cyanide Degrading Bacteria. In Proceedings of the 10th International Conference on Advance in Science, Engineering, Technology & Healthcare, Cape Town, South Africa, 19–20 November 2018. [Google Scholar]
  21. Olaya-Abril, A.; Pérez, M.D.; Cabello, P.; Martignetti, D.; Sáez, L.P.; Luque-Almagro, V.M.; Moreno-Vivián, C.; Roldán, M.D. Role of the Dihydrodipicolinate Synthase DapA1 on Iron Homeostasis During Cyanide Assimilation by the Alkaliphilic Bacterium Pseudomonas pseudoalcaligenes CECT5344. Front. Microbiol. 2020, 11, 28. [Google Scholar] [CrossRef]
  22. Alvarado-Lopez, M.J.; Garrido-Hoyos, S.E.; Raynal-Gutierrez, M.E.; El-Kassis, E.G.; Marrugo-Negrete, J.L.; Rosano-Ortega, G. Native Cyanide Degrading Bacterial Consortium and its Potential for Gold Mine Tailings Tertiary Biotechnological Treatment. Chem. Eng. Trans. 2022, 94, 1441–1446. [Google Scholar] [CrossRef]
  23. Jiang, W.; Lu, Y.; Feng, Z.; Yu, H.; Ma, P.; Zhu, J.; Wang, Y.; Sun, J. Biodegradation of Cyanide by a New Isolated Aerococcus viridans and Optimization of Degradation Conditions by Response Surface Methodology. Sustainability 2022, 14, 15560. [Google Scholar] [CrossRef]
  24. Antunes, A.; de la Haba, R.R.; Jebbar, M.; Hedlund, B.P. Editorial: Community series-extremophiles: Microbial genomics and taxogenomics, volume II. Front. Microbiol. 2024, 15, 1371210. [Google Scholar] [CrossRef]
  25. Andreote, A.P.D.; Dini-Andreote, F.; Rigonato, J.; Machineski, G.S.; Souza, B.C.E.; Barbiero, L.; Rezende-Filho, A.T.; Fiore, M.F. Contrasting the Genetic Patterns of Microbial Communities in Soda Lakes with and without Cyanobacterial Bloom. Front. Microbiol. 2018, 9, 244. [Google Scholar] [CrossRef]
  26. Jeilu, O.; Alexandersson, E.; Johansson, E.; Simachew, A.; Gessesse, A. A novel GH3-β-glucosidase from soda lake metagenomic libraries with desirable properties for biomass degradation. Sci. Rep. 2024, 14, 10012. [Google Scholar] [CrossRef]
  27. Jeilu, O.; Gessesse, A.; Simachew, A.; Johansson, E.; Alexandersson, E. Prokaryotic and eukaryotic microbial diversity from three soda lakes in the East African Rift Valley determined by amplicon sequencing. Front. Microbiol. 2022, 13, 999876. [Google Scholar] [CrossRef]
  28. Ali, Y.; Simachew, A.; Gessesse, A. Diversity of Culturable Alkaliphilic Nitrogen-Fixing Bacteria from a Soda Lake in the East African Rift Valley. Microorganisms 2022, 10, 1760. [Google Scholar] [CrossRef]
  29. Simachew, A.; Lanzén, A.; Gessesse, A.; Øvreås, L. Prokaryotic Community Diversity Along an Increasing Salt Gradient in a Soda Ash Concentration Pond. Microb. Ecol. 2016, 71, 326–338. [Google Scholar] [CrossRef]
  30. Shin, D.; Park, J.; Park, H.; Lee, J.-C.; Kim, M.-S.; Lee, J. Key Microbes and Metabolic Potentials Contributing to Cyanide Biodegradation in Stirred-Tank Bioreactors Treating Gold Mining Effluent. Miner. Process. Extr. Met. Rev. 2020, 41, 85–95. [Google Scholar] [CrossRef]
  31. Mekuto, L.; Ntwampe, S.K.; Utomi, C.E.; Mobo, M.; Mudumbi, J.B.; Ngongang, M.M.; Akinpelu, E.A. Performance of a continuously stirred tank bioreactor system connected in series for the biodegradation of thiocyanate and free cyanide. J. Environ. Chem. Eng. 2017, 5, 1936–1945. [Google Scholar] [CrossRef]
  32. Bilger, H.E.; Wolf, H.H. Method for the Coloremetric Determination of the Cyande Concentration of Aoueous Solutions. U.S. Patent US4871681A, 3 October 1989. [Google Scholar]
  33. Guadalima, M.P.G.; Monteros, D.A.N. Evaluation of the rotational speed and carbon source on the biological removal of free cyanide present on gold mine wastewater, using a rotating biological contactor. J. Water Process. Eng. 2018, 23, 84–90. [Google Scholar] [CrossRef]
  34. Qureshi, N.; Annous, B.A.; Ezeji, T.C.; Karcher, P.; Maddox, I.S. Biofilm reactors for industrial bioconversion processes: Employing potential of enhanced reaction rates. Microb. Cell Factories 2005, 4, 24. [Google Scholar] [CrossRef]
  35. Clemente, S.M.; Olivera, C.C.; Benites-Alfaro, E. Microbial Biofilm as a Methodology for Treatment of Cyanide-Contaminated Water. Chem. Eng. Trans. 2022, 93, 151–156. [Google Scholar] [CrossRef]
  36. Kao, C.; Liu, J.; Lou, H.; Lin, C.; Chen, S. Biotransformation of cyanide to methane and ammonia by Klebsiella oxytoca. Chemosphere 2003, 50, 1055–1061. [Google Scholar] [CrossRef]
  37. Mirizadeh, S.; Yaghmaei, S.; Nejad, Z.G. Biodegradation of cyanide by a new isolated strain under alkaline conditions and optimization by response surface methodology (RSM). J. Environ. Health Sci. Eng. 2014, 12, 85. [Google Scholar] [CrossRef]
  38. Botz, M.M.; Mudder, T.I.; Akcil, A.U. Cyanide treatment: Physical, chemical and biological processes. Dev. Miner. Process. 2005, 15, 672–702. [Google Scholar] [CrossRef]
  39. Ogato, T.; Kifle, D.; Fetahi, T.; Sitotaw, B. Evaluation of growth and biomass production of Arthrospira (Spirulina) fusiformis in laboratory cultures using waters from the Ethiopian soda lakes Chitu and Shala. J. Appl. Phycol. 2014, 26, 2273–2282. [Google Scholar] [CrossRef]
  40. Maniyam, M.N.; Sjahrir, F.; Ibrahim, A.L.; Cass, A.E.G. Biodegradation of cyanide by Rhodococcus UKMP-5M. Biologia 2013, 68, 177–185. [Google Scholar] [CrossRef]
  41. Vallenas-Arévalo, A.T.; Rosario, C.G.A.; Espinosa, D.C.R.; Tenório, J.A.S. Bacterial degradation of free cyanide in alkaline medium using bacillus licheniformis strain. Miner. Met. Mater. Ser. Part 2018, F6, 367–373. [Google Scholar] [CrossRef]
  42. Ingvorsen, K.; Højer-Pedersen, B.; Godtfredsen, S.E. Novel cyanide-hydrolyzing enzyme from Alcaligenes xylosoxidans subsp. denitrificans. Appl. Environ. Microbiol. 1991, 57, 1783–1789. [Google Scholar] [CrossRef]
  43. Mpongwana, N.; Ntwampe, S.K.O.; Mekuto, L.; Akinpelu, E.A.; Dyantyi, S.; Mpentshu, Y. Isolation of high-salinity-tolerant bacterial strains, Enterobacter sp., Serratia sp., Yersinia sp., for nitrification and aerobic denitrification under cyanogenic conditions. Water Sci. Technol. 2016, 73, 2168–2175. [Google Scholar] [CrossRef]
  44. Kandasamy, S.; Dananjeyan, B.; Krishnamurthy, K.; Benckiser, G. Aerobic cyanide degradation by bacterial isolates from cassava factory wastewater. Braz. J. Microbiol. 2015, 46, 659–666. [Google Scholar] [CrossRef]
  45. Müller, T.; Walter, B.; Wirtz, A.; Burkovski, A. Ammonium Toxicity in Bacteria. Curr. Microbiol. 2006, 52, 400–406. [Google Scholar] [CrossRef]
  46. Mekuto, L.; Kim, Y.M.; Ntwampe, S.K.O.; Mewa-Ngongang, M.; Mudumbi, J.B.N.; Dlangamandla, N.; Itoba-Tombo, E.F.; Akinpelu, E.A. Heterotrophic nitrification-aerobic denitrification potential of cyanide and thiocyanate degrading microbial communities under cyanogenic conditions. Environ. Eng. Res. 2019, 24, 254–262. [Google Scholar] [CrossRef]
  47. US/ETH/99/068/Ehiopia; EEPA, Provisional Standards for Industrial Pollution Control in Ethiopia. Prepared under the Ecologically Sustainable Industrial Development (ESID) Project; EPA/UNIDO: Addis Ababa, Ethiopia, 2003.
  48. Koren, D.W.; Gould, W.D.; Bédard, P. Biological removal of ammonia and nitrate from simulated mine and mill effluents. Hydrometallurgy 2000, 56, 127–144. [Google Scholar] [CrossRef]
  49. Kim, Y.M.; Cho, H.U.; Lee, D.S.; Park, C.; Park, D.; Park, J.M. Response of nitrifying bacterial communities to the increased thiocyanate concentration in pre-denitrification process. Bioresour. Technol. 2011, 102, 913–922. [Google Scholar] [CrossRef]
  50. Zhao, R.; Babbin, A.R.; Roerdink, D.L.; Thorseth, I.H.; Jørgensen, S.L. Nitrite accumulation and anammox bacterial niche partitioning in Arctic Mid-Ocean Ridge sediments. ISME Commun. 2023, 3, 1–14. [Google Scholar] [CrossRef]
  51. Felföldi, T.; Nagymáté, Z.; Székely, A.J.; Jurecska, L.; Márialigeti, K. Biological treatment of coke plant effluents: From a microbiological perspective. Biol. Futur. 2020, 71, 359–370. [Google Scholar] [CrossRef]
  52. Dhamole, P.B.; D’souza, S.F.; Lele, S.S. A Review on Alternative Carbon Sources for Biological Treatment of Nitrate Waste. J. Inst. Eng. Ser. E 2015, 96, 63–73. [Google Scholar] [CrossRef]
  53. Raghunandan, K.; Mchunu, S.; Kumar, A.; Kumar, K.S.; Govender, A.; Permaul, K.; Singh, S. Biodegradation of glycerol using bacterial isolates from soil under aerobic conditions. J. Environ. Sci. Health Part A 2014, 49, 85–92. [Google Scholar] [CrossRef]
  54. Adjei, M.D.; Ohta, Y. Factors affecting the biodegradation of cyanide by Burkholderia cepacia strain C-3. J. Biosci. Bioeng. 2000, 89, 274–277. [Google Scholar] [CrossRef]
  55. Bell, L.N.; Labuza, T.P. Compositional Influence on the pH of Reduced-Moisture Solutions. J. Food Sci. 1992, 57, 732–734. [Google Scholar] [CrossRef]
  56. Villemur, R.; Juteau, P.; Bougie, V.; Ménard, J.; Déziel, E. Development of four-stage moving bed biofilm reactor train with a pre-denitrification configuration for the removal of thiocyanate and cyanate. Bioresour. Technol. 2015, 181, 254–262. [Google Scholar] [CrossRef]
Figure 1. The sampling area map. The map in the upper left shows Ethiopia, while the upper right (green) shows the Oromia Regional State. The lower right (red) highlights Siraro District (Wereda), where Lake Chitu is located. The bottom left (blue) shows Lake Chitu.
Water 16 02956 g001
Figure 2. Schematic diagrams of the treatment setup.
Water 16 02956 g002
Figure 3. The biofilm formed during the consortia establishment process (A): biofilm formed on the wall of the reactor; (B): biofilm formed at the base of the reactor.
Water 16 02956 g003
Figure 4. Cyanide degradation and pH of the solution during the consortia establishment period. The initial residual cyanide concentration in the solution was 97.93 mg/L. (A): Residual cyanide concentration along the treatment period and cyanide percent removal; (B): the pH of the solution in the influent, aerobic reactor, and anoxic reactor.
Water 16 02956 g004
Figure 5. Dynamics of nitrogen metabolisms in the aerobic and anoxic reactors and final effluent (A): production and depletion of TAN; (B): nitrite-N (C) nitrate-N.
Water 16 02956 g005
Figure 6. The cyanide and cyanide derivative removal potential of the consortia. (A): Cyanide percent removal of the consortia for 200 mg/L, 400 mg/L, 600 mg/L, 800 mg/L, and 1000 mg/L; (B): final effluent concentration of TAN, nitrite-N, and nitrate-N when the consortia were fed with 200 mg/L, 400 mg/L, 600 mg/L, 800 mg/L, and 1000 mg/L.
Water 16 02956 g006
Figure 7. Impact of glycerol and sodium cyanide as a carbon source in the treatment system. (A): Cyanide % removal when glycerol and sodium acetate were used as a carbon source (B): The pH value in the aerobic and anoxic reactors and the final effluent when glycerol and sodium acetate were used as a carbon source.
Water 16 02956 g007
Figure 8. Percent removal of cyanide and the concentration of TAN, nitrite-N, nitrate-N, TAN, and TIN of the final effluent for different flow rates. (A): Percent removal of cyanide for the flow rates of 0.8 mL/min, 1 mL/min, and 1.2 mL/min; (B): the concentration of TAN, nitrite-N, nitrate-N, TAN, and TIN for 0.8 mL/min, 1 mL/min, and 1.2 mL/min.
Water 16 02956 g008
Table 1. Synthetic goldmine wastewater composition in 1000 mL of deionized water.
Salt Solution (g/L)Amount (mg/L)
K2HPO4·2H2O3
Na2HPO4·2H2O7
MgSO4·7H2O0.3
NaCl0.25
CaCl2·2H2O0.02
Na2CO310
CH3COONa0.25
NaCN(0.2, 0.4, 0.6, 0.8, 1) *
MnSO4·4H2O0.01
FeCl3·6H2O0.045
ZnSO4·7H2O0.01
CuSO4·H2O0.002
CoCl2·6H2O0.003
NiCl2·6H2O0.003
NaMoO4·2H2O0.02
Note: * Concentration was changed in the process.
Table 2. Experimental conditions during the operation period.
NaCN (mg/L)Carbon SourcepHTreatment Period (Day)
200CH3COO-Na10.32–10.690–85
400C2H3NaO210.01–10.485–107
600C2H3NaO29.71–10.31107–127
800C2H3NaO29.66–9.98127–145
1000C2H3NaO29.76–9.99145–170
200C3H8O39.73–9.99170–190
Disclaimer/Publisher’s Note: The statements, opinions and data contained in all publications are solely those of the individual author(s) and contributor(s) and not of MDPI and/or the editor(s). MDPI and/or the editor(s) disclaim responsibility for any injury to people or property resulting from any ideas, methods, instructions or products referred to in the content.