1. Introduction
Manganese is naturally present in the environment, found in many types of rocks, soil, and water [
1], and can be found in a wide range of minerals, including carbonates, oxides, silicates, and sulfides.
In soils, manganese can be detected in two primary forms: as manganese oxide and as a constituent of ferro-magnesian silicates of minerals [
2,
3,
4]. Notably, certain rock types, such as mafic and ultramafic rocks, shales, limestones, and basalts, harbor substantial manganese concentrations. These concentrations can be further amplified in soil and sediments through weathering processes [
5].
The Mn concentrations in the most superficial layers (0–20 cm) generally range between 2 mg/kg and 14,969 mg/kg, with an average value of 445 mg/kg [
6].
The presence and concentration of manganese in groundwater are subject to a multitude of factors, with rock geochemistry, water chemistry, and microbiological activity being the most influential [
7]. In European surface waters, manganese concentrations span a wide range, from 0.1 µg/L to 3010 µg/L, with an average value of 15.9 µg/L [
7]. However, it is crucial to note the high spatio-temporal variations in manganese content in surface waters, which have been increasingly documented. Depending on the hydrogeological context, manganese concentrations can experience significant fluctuations from their natural levels [
8,
9].
The quality of groundwater is a function of numerous hydrogeological and geochemical factors of the aquifers, such as the chemical–physical parameters (temperature, redox potential, electrical conductivity, pH, dissolved oxygen), the ions dissolved in the groundwater (Ca
2+, Mg
2+, Na
+, K
+, NH
4+, Cl
−, SO
42−, HCO
3−, F
−, NO
3−) necessary for the evaluation of the hydrochemical facies of the aquifer induced by the water–rock interaction, the type of aquifer (porous, fractured, karst) influencing the infiltration capacity of water and the recharge areas, etc. [
10,
11]. Although groundwater naturally takes on its chemistry (hydrochemical facies) based on the dissolved ions and depending on the chemical–physical and environmental conditions present in the aquifer (oxidizing, reducing conditions, microbial activity), anthropic pressures can significantly affect the groundwater quality (the infiltration of contaminants introduced by man into areas more or less vulnerable to pollution) [
12,
13].
One definition of pollution provided in the literature is “the introduction by man into the environment of substances or energy liable to cause hazards to human health, harm to living resources and ecological systems, damage to structure or amenity, or interference with legitimate use of the environment” [
14]. From this definition, it is clear that pollution is caused by anthropogenic activities. Therefore, the evaluation of pollution is linked to the work of differentiating natural and anthropogenic concentrations in environmental media [
15].
For this reason, to investigate the nature of the presence of concentrations above the limits (CSC) established by Legislative Decree 152/06 for manganese in the groundwater underlying a non-hazardous solid waste plant, a study was carried out on the geochemical characteristics of the aquifers present in the study area. Therefore, evaluating the natural background value, together with site-specific considerations, can assist in identifying any specific sources of contamination that may exist in an area.
Furthermore, a study focusing on threshold metal concentrations in volcanic areas, such as Colli Albani, could provide valuable information on how natural volcanic activities continue to shape the geochemistry of surface and subsurface environments. In particular, it could provide critical data regulators could consider when evaluating contamination thresholds in areas with high natural geochemical variability.
2. Geological and Hydrogeological Framework
The study area, which includes a landfill for non-hazardous solid waste, is located in the southern portion of the Roman countryside, on the border with the Agro Pontino and the southern slopes of the volcanic region of the Alban Hills (
Figure 1).
The study site is located at altitudes between 33 m and approximately 10 m above sea level in the Pontine plain and in the geological environment between the western margin of the volcanic district of the Alban Hills and the coastal area.
The area’s particular geomorphological position is characterized by the outcropping presence of sandy and clayey soils of marine origin, volcanic pyroclastic deposits, and terrestrial Quaternary sediments [
16].
The study area is rich in formations of pyroclastic origin and, even where sedimentary formations emerge, these are largely made up of the products of the disintegration and alteration of volcanic rocks, including pyroclastics, of different compositions [
17,
18].
Among the products of the Lazio volcano, the Lionate tuff emerges in the area of interest. This characteristic Alban pyroclastic owes its name to its general reddish-brown color, which varies from point to point and has a different consistency from lithoid to earthy. The constitutive peculiarity of this formation is represented by the fact that it is a lionized tuff deriving from a primary leucitic magma and exclusive to the Alban area [
18,
19,
20].
Based on the elaboration of the stratigraphic units relating to the surveys carried out during the planning of the landfill plant, the geological structure of the study area can be schematized according to the succession of formations shown in
Table 1.
The landfill plant is located in an area with a stratigraphic succession composed mainly of eight units, of which fine lithotypes are found in the most superficial layers, such as pyroclastics, silty sands, dark gray-blackish organic clayey silts, and peat from a lake environment, such as to characterize a semi-confinement of the aquifer. The area extends <10 km2.
The study site is included in the orographic basin of the Astura River, which extends for 400 km2 overall.
The stratigraphic structure, characterized by different intercalated lithological formations, determines particular and complex hydrogeological conditions, as the varying behavior of the individual lithological units concerning groundwater circulation [
21].
Based on the stratigraphic units carried out at the study site and reported in
Table 1, the height of the water table is around 15 m from the ground level; therefore, it is decidedly lower than the excavation of the landfill, which does not exceed 12 m from the ground level.
In the study site, 11 sampling points were identified located upstream of the landfill, whose coordinates and depths are shown in
Table 2.
3. Materials and Methods
The procedure used for this study first involved reconstructing the conceptual model. In particular, after reconstructing the geological and hydrogeological structure of the study area, the sampling of the 11 wells reported in
Table 2 was carried out to analyze the chemical–physical parameters and trace elements of the groundwater samples.
The “Guidelines for the Determination of Background Values for Soils and Groundwater” (LG), published by ISPRA (Istituto Superiore per la Protezione e la Ricerca Ambientale, Italian Institute for Environmental Protection and Research, Rome, Italy) in February 2018 [
22], were followed to determine the background values of manganese in the groundwater underlying the study area. The choice of sampling points was guided by the ISPRA LG, which ensures a quantity that guarantees adequate statistical significance and uses data collected over a broad observation period of approximately eight years, from 2014 to 2021.
The sampling points were selected among the piezometers located upstream of the plant based on the sample size, the temporal frequency of parameter observations, and the location of the points to guarantee the absence of impacts due to transport in the aquifer. The number of observations necessary to ensure the statistical significance of the determined value is between 10 and 30 [
23].
Based on the number of stations chosen (N = 11 sampling points) and the number of temporal observations (8 ≤ n ≤ 30), the case study demonstrates an adequate level of temporal variability. However, it also reveals poor spatial coverage, consequently falling within case C of the ISPRA LG (Case C: numerousness samples adequate to describe the variability over time of the parameter/s in the waters of the dataset under examination).
The case study is characterized by limited spatial variability (N = 11 sampling stations) and a substantial amount of temporal variability. The observation period falls between 2014 and 2021 for most of the sampling points. However, the MW40 sampling point is characterized by a number of temporal observations ≥ 8, the minimum limit defined by the ISPRA LG to consider adequate temporal variability, ensuring our strict adherence to the guidelines.
The methodology used to propose the background values of manganese considered the processing of chemical–physical and geochemical data as the first phase. In particular, the geochemical data processing allowed for the identification of the hydrochemical facies of the waters under study.
For the observation period 2014–2021, the following monitoring campaigns were taken into consideration:
- -
2014: March, June, September, December;
- -
2015: March, June, September, December;
- -
2016: March, June, September;
- -
2017: March, June, September, December;
- -
2018: March, June, September, November;
- -
2019: March, June, September;
- -
2020: April and November;
- -
2021: March.
In all monitoring campaigns, chemical–physical parameters such as temperature, pH, electrical conductivity, redox potential, and dissolved oxygen were measured, and trace element analyses were carried out.
Trace element concentrations were measured using an ICP-MS spectrometer (X Series 2 Thermo Fisher Scientific) (manufactured by Thermo Fisher Scientific at Sunnyvale, CA, USA). The analytical accuracy of this method varies between 2% and 5%. Major element concentrations were measured in March and September 2017 via ion chromatography. In particular, a Chromeleon Dionex ICS1100 chromatograph (manufactured by Thermo Fisher Scientific) was used to analyze cations and a Chromeleon Dionex IC5000 (manufactured by Thermo Fisher Scientific) chromatograph was used to analyze anions. The instrumental accuracy is ±2%. We used ultrapure water (Millipore, Milli-Q, 16 MΩ cm) (Merck, Darmstadt, Germany) to prepare blanks, standard solutions, and sample dilutions for both types of analysis [
24,
25]. We have performed these analyses at the Geochemical Laboratory, Department of Earth Sciences, Sapienza University of Rome (Rome, Italy).
In summary, the procedure for estimating the background values, in accordance with the ISPRA LG, involved the following phases:
- -
The treatment of non-detects (ND), i.e., concentrations that turned out to be lower than the “Detection Limit”;
- -
A preliminary analysis and identification of outliers, i.e., those values which, based on graphic representations or statistical tests, are configured as abnormal or aberrant;
- -
The application of statistical methods to verify that the outliers identified are actual outliers;
- -
The determination of the background value, which, as foreseen by the ISPRA LG, will be proposed as the 95th percentile in the case study [
22].
4. Results
4.1. Chemical–Physical Analysis Results
pH, electrical conductivity (EC), redox potential (Eh) and dissolved oxygen (DO) are parameters that can influence and mobilize Mn in groundwater, controlling its speciation and concentration in the aquatic environment [
5,
6,
11,
26,
27].
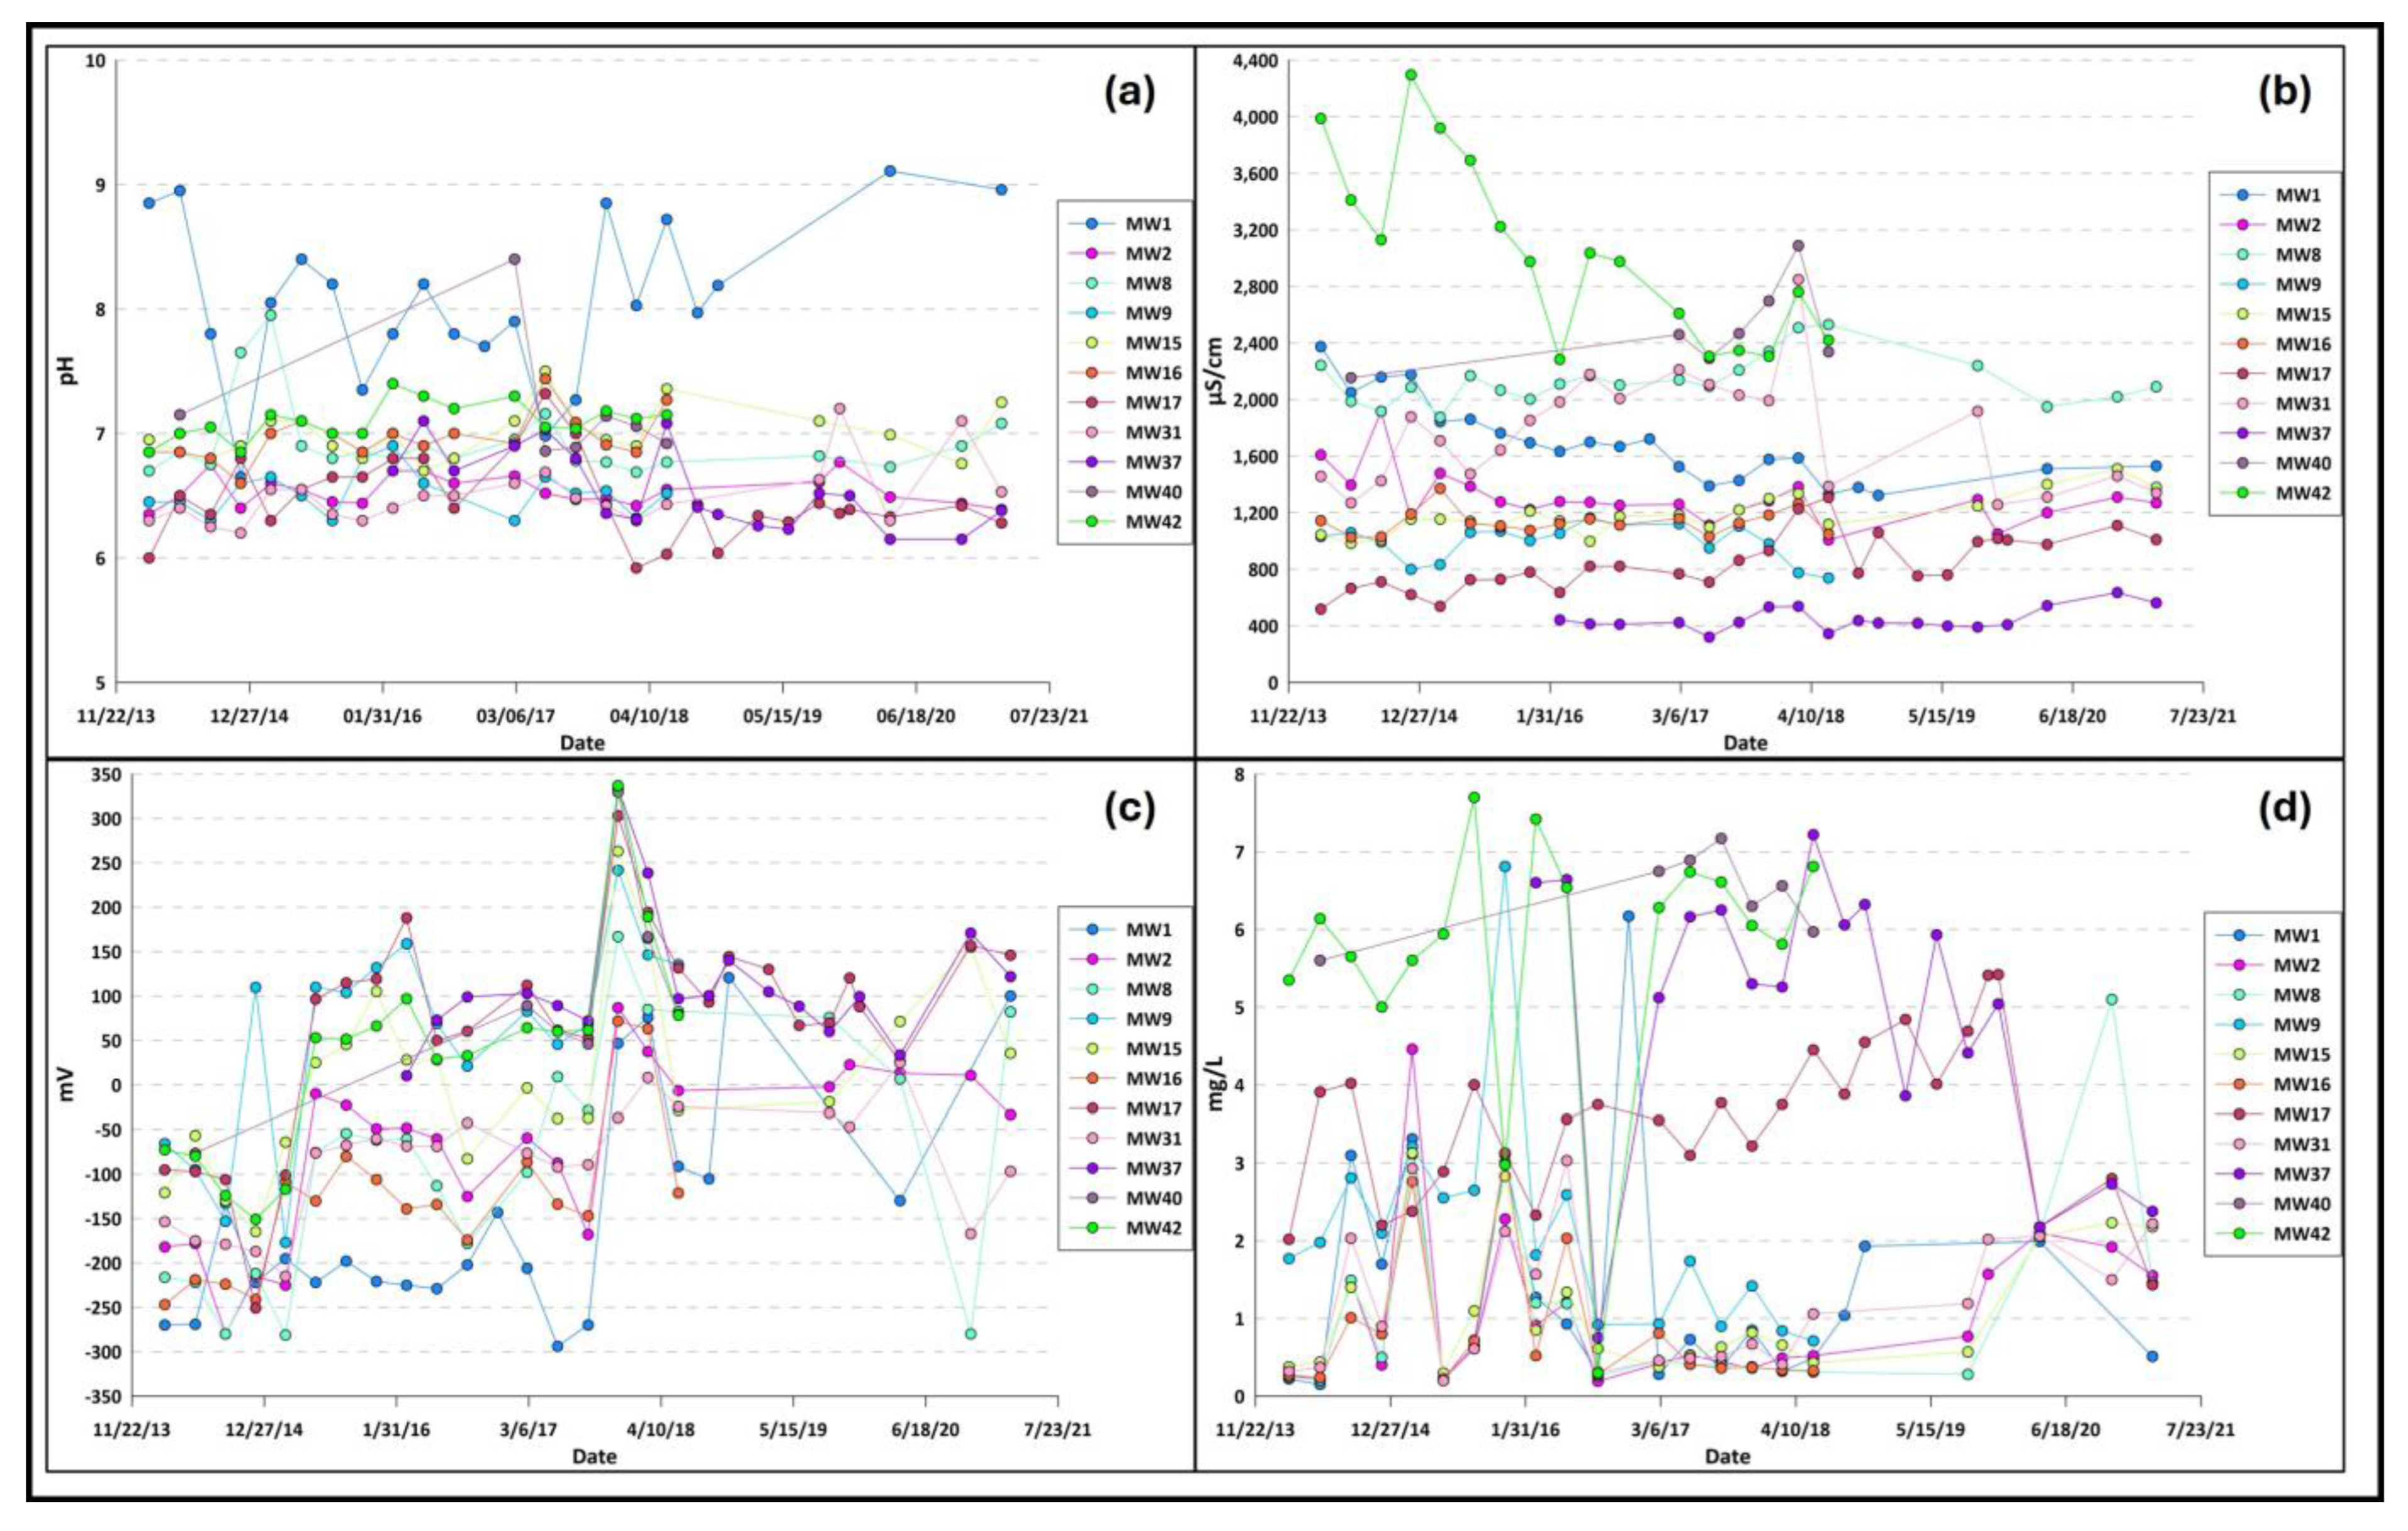
The pH seems to have a reasonably stable trend in the waters analyzed, with values ranging from a minimum of 5.9 for the MW17 piezometer to a maximum of 9.1 for the MW1 piezometer (
Figure 2a;
Table S1).
The electrical conductivity (EC), however, appears to have a fairly variable trend, with values that oscillate between a minimum of 320 µs/cm for the MW37 piezometer and a maximum of 4296 µs/cm recorded for the MW42 piezometer positioned to the east of the plant. (
Figure 2b;
Table S2).
The reduction potential (Eh) values measured in the 11 sampling points vary between a minimum of −294 mV, recorded for the MW1 piezometer, and a maximum of 337 mV, recorded for the MW42 piezometer. It is possible to notice that piezometers in the study area tend to have negative or low redox potential values (
Figure 2c;
Table S3).
As regards dissolved oxygen (DO), values are recorded in a range between 0.15 mg/L for the MW1 piezometer and 7.70 mg/L for the MW42 piezometer. It is helpful to remember that the Bridge5 protocol [
28] identifies dissolved oxygen (O
2) as a parameter suitable for distinguishing aerobic groundwater (O
2 ≥ 1 mg/L) and anaerobic groundwater (O
2 < 1 mg/L). About half of the data assumes dissolved oxygen values <1 mg/L and, consequently, an anaerobic environment (
Figure 2d;
Table S4).
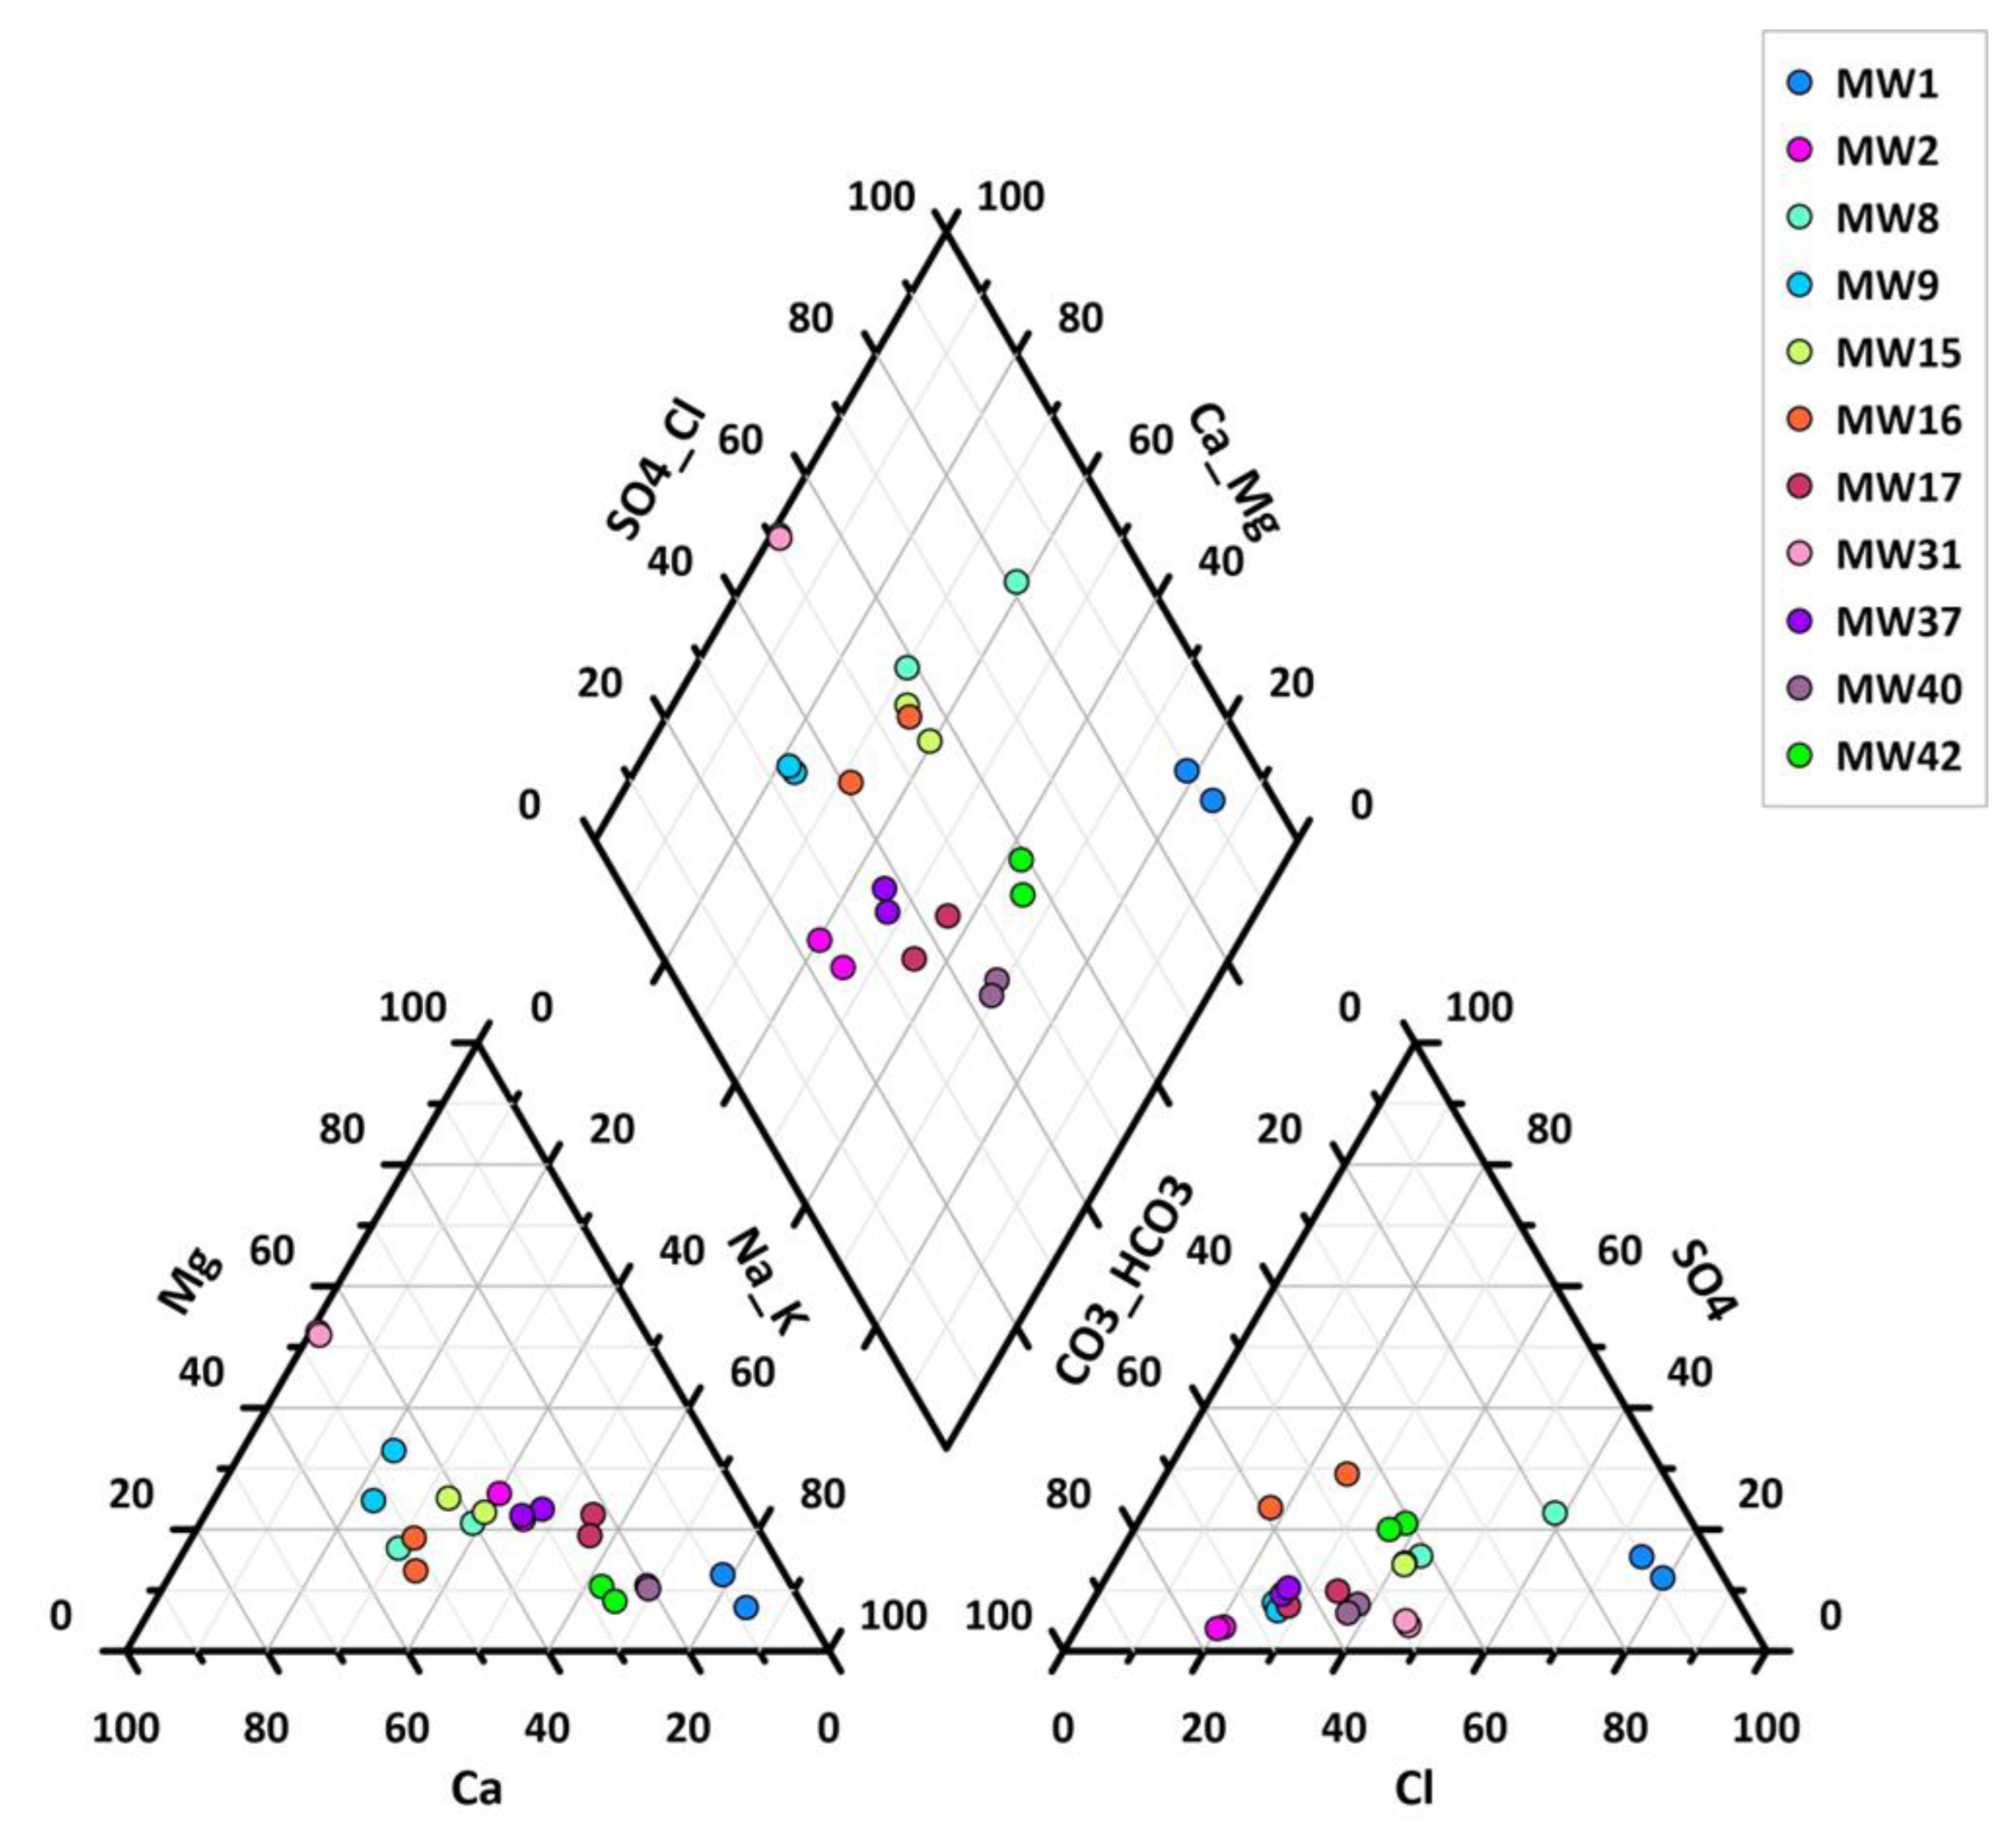
The geochemical data processing allowed for the identification of the hydrogeochemical facies of the waters under study. In particular, the results and geochemical processing were carried out considering March and November 2017, as they represent two different seasonal phases (
Table S5).
As the Piper diagram shows (
Figure 3), the MW1 piezometer presents alkaline sulfate–chloride waters with much higher chloride concentrations and much lower bicarbonates than the other water samples, thus deviating from the geochemical behavior of all the other piezometers.
Since the concentrations of Mn (
Table S6) were higher than the CSC foreseen by Legislative Decree 152/06, it was necessary to evaluate the background value of this metal in the study area to identify its geogenic or anthropic origin. In particular, the legal limits (50 μg/L) were exceeded in all piezometers except MW15, MW40, and MW42.
4.2. Calculation of Background Values
The processing of the chemical–physical data highlighted that the MW1 piezometer was characterized by negative and/or low redox potential values and high electrical conductivity. Furthermore, the processing of the dissolved oxygen results showed that MW1 was characterized by values mostly <1 mg/L, indicating preferentially anaerobic environments.
Therefore, based on the results, the MW1 piezometer presents geochemical behavior different from that of the other piezometers, which is also confirmed by the processing of the hydrogeochemical facies (
Figure 3). Consequently, it will not be considered when calculating the natural background value.
Our analysis of the dataset strictly adhered to the ‘Simple Substitution Methods’ outlined in the ISPRA LG. This involved replacing concentrations below the ‘Detection Limit’ (DL) with a value equal to half of the DL. In terms of exceeding the limits set by Legislative Decree 152/06, it was found that all piezometers, except MW15, MW40, and MW42, had surpassed the CSC.
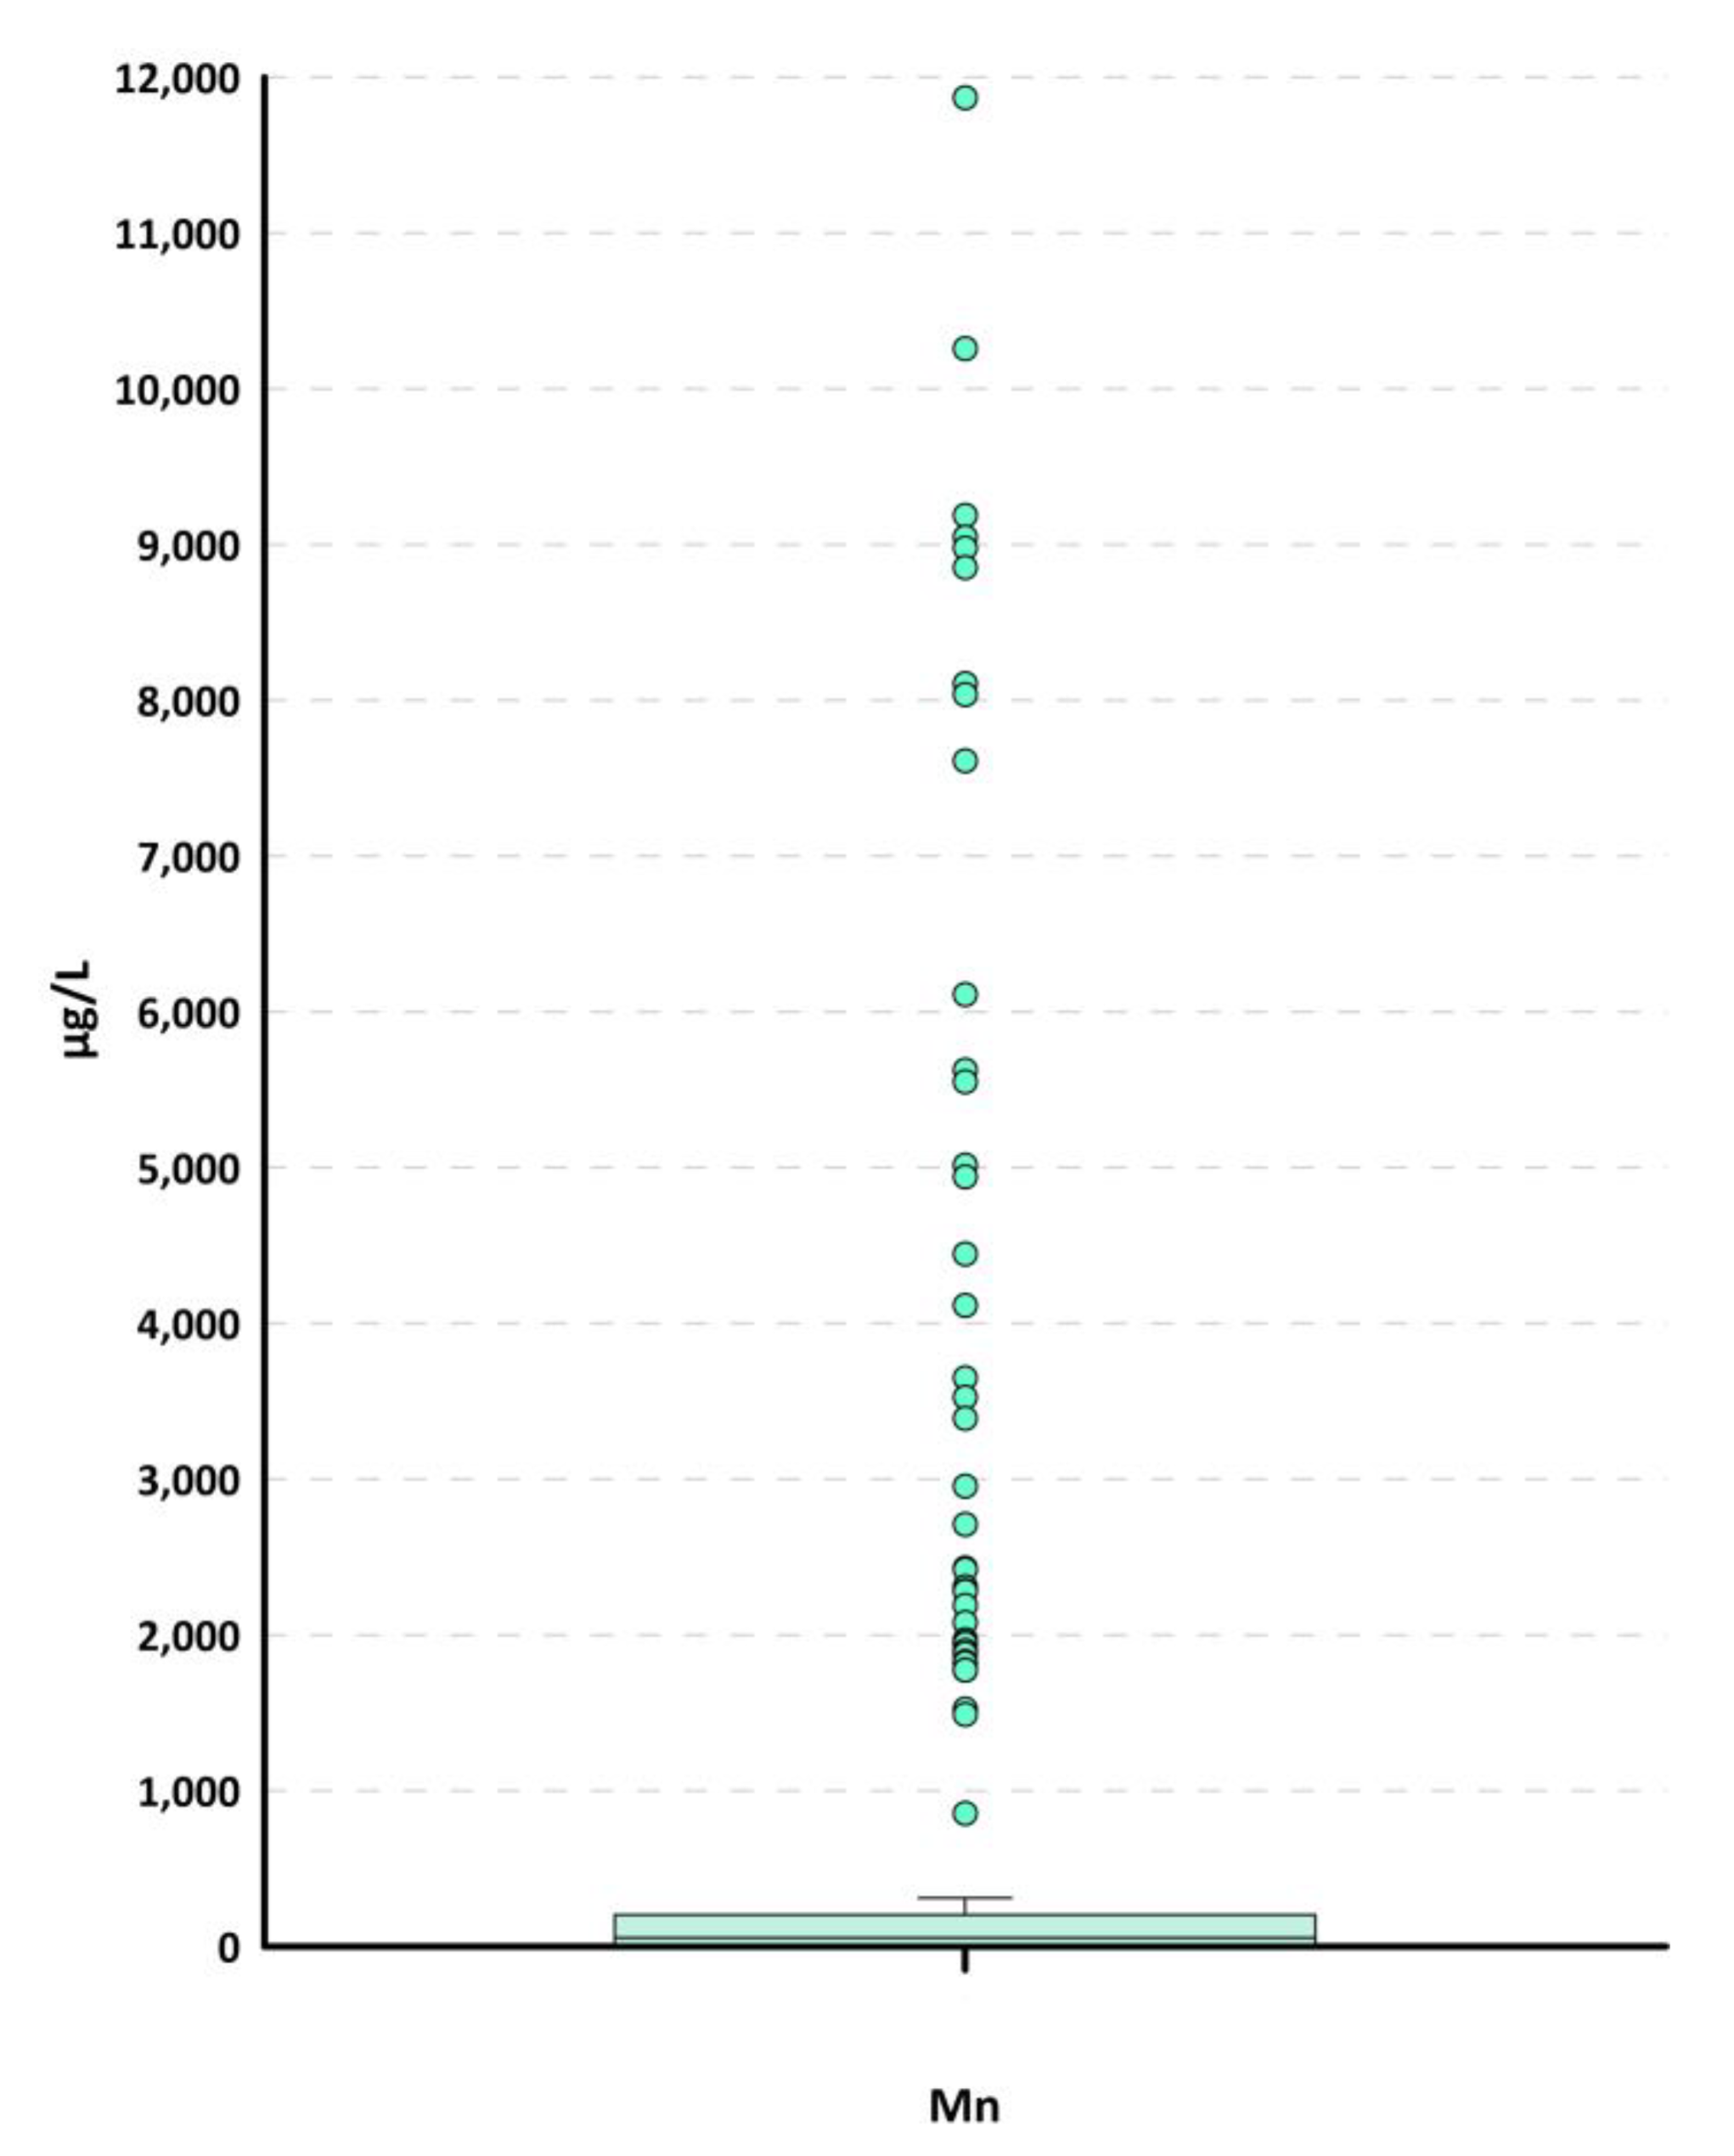
We then proceeded to identify possible outliers by reconstructing the box plots (
Figure 4). The application of the box plots allowed for the identification of numerous outliers in the upper tail, even those decidedly high for manganese. In particular, 41 outliers were identified.
However, to evaluate and analyze the outliers identified through the box plot, the Walsh statistical test was applied, which involves the verification of the following inequalities:
- -
x(r) − (1+a)x(r+1) + ax(k) < 0 for the lower tail
- -
x(n+1−r) − (1+a)x(n−r) + ax(n+1−k) > 0 for the upper tail
where
- -
a =
- -
b2 = 1/α where α = 0.10 if 50 < n < 220; α = 0.05 if n > 220
- -
c =
- -
n = number of data available
- -
k = r + c
- -
r = number of possible outliers.
If the inequalities are verified, the anomalous values identified in the lower and/or upper tails can be considered statistical outliers and, therefore, not representative of the natural background. For the case in question, the second equation was used, and the inequality for the upper tail, for which the box plot identified 41 outliers, is verified. In particular, all values above 311 µg/L appear to be statistical outliers.
At this point, the Huber test was carried out to verify further that the identified outliers were statistical. The procedures for carrying out the test include the following:
- -
Order the n observations from the smallest value x(1) to the largest value x(n); calculate the median (50 percentile) of the data;
- -
Calculate the difference (absolute value) between each observation and the median (Di);
- -
Calculate the median of the differences (Dm);
- -
Calculate the product 4.5 × Dm;
- -
Observations for which Di > 4.5 Dm are anomalous with α = 0.01.
The application of the Huber test allowed us to verify that all values above 311 µg/L are statistical outliers, just as the outliers identified with the box plots were.
Consequently, since the concentrations of the analytes follow a non-normal distribution, the background value was set equal to the 95th percentile, as envisaged in case C of the ISPRA LG [
22]. Ultimately, the NBV is equal to 192.3 µg/L.
5. Discussion
The NBV of 192.3 µg/L significantly exceeds the CSC defined by Legislative Decree 152/06 for manganese, which corresponds to 50 µg/L. For most of the NBV exceedances, the analyzed samples are characterized by negative redox values, thus highlighting possible ongoing local phenomena linked to the soil’s geogenic conditions.
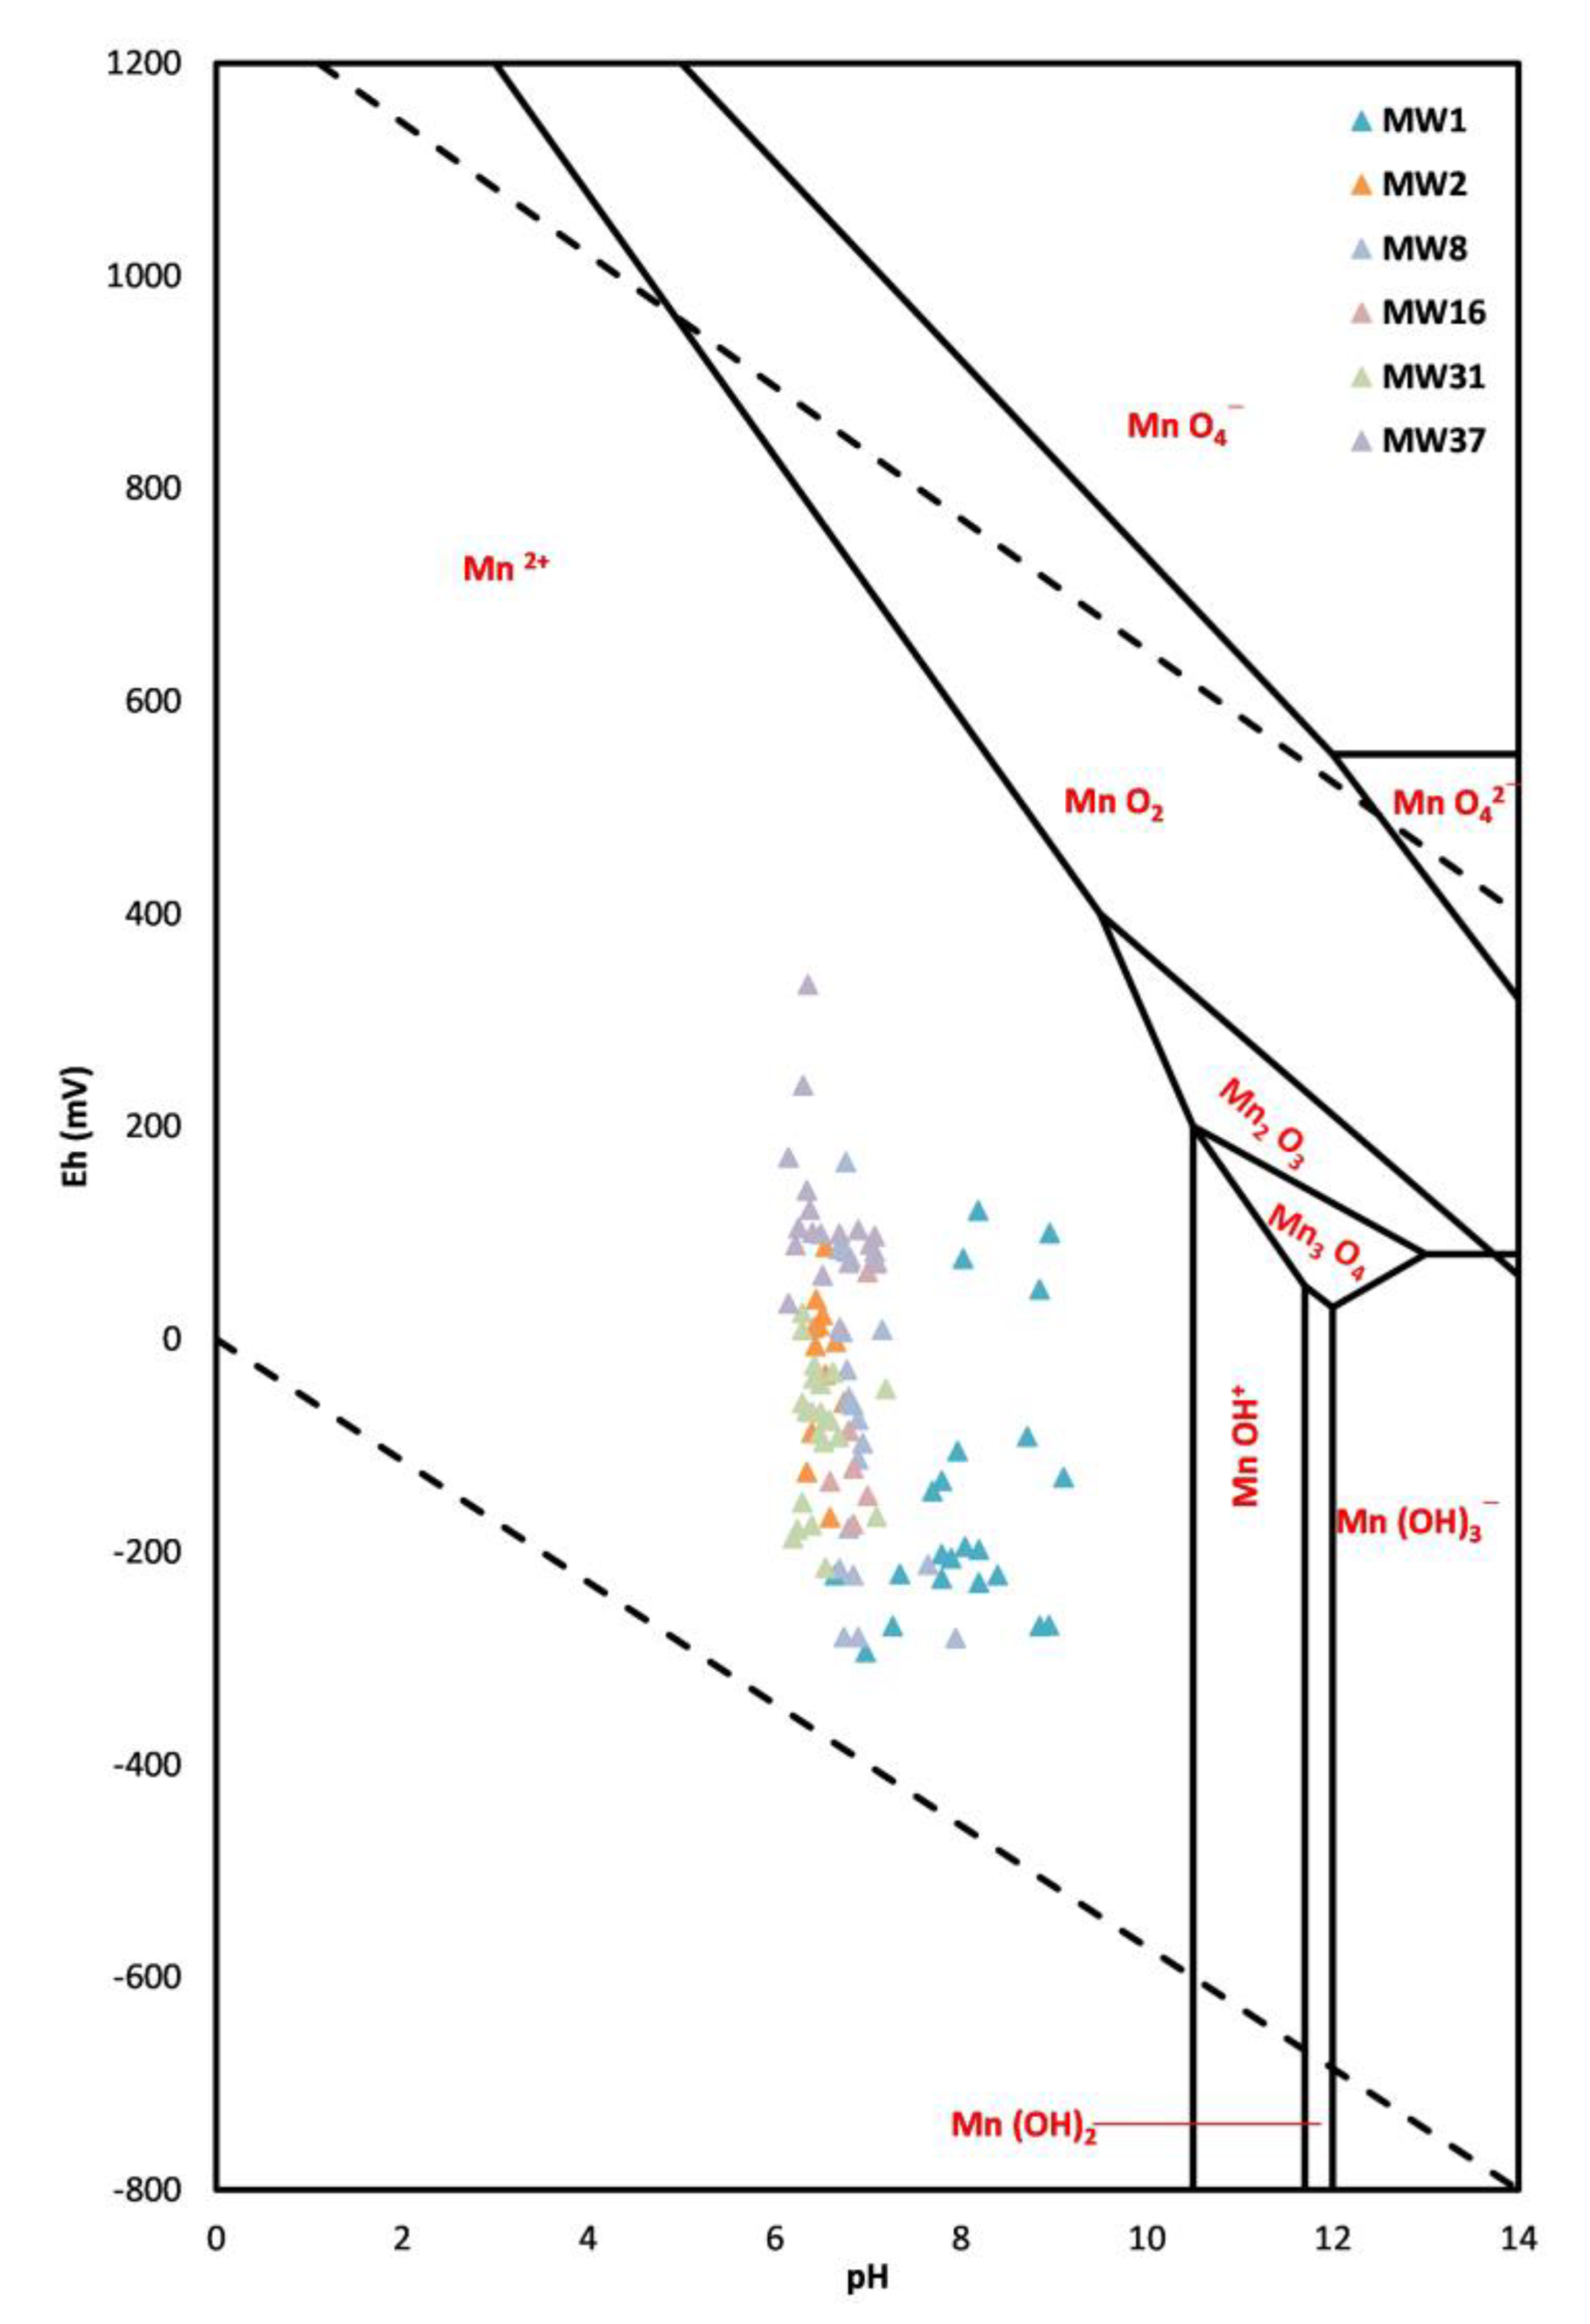
Therefore, given the correlation between manganese concentrations and redox potential values, it is useful to investigate manganese concentrations that exceed the NBV via the Eh/pH diagram, (
Figure 5).
In nature, manganese can exist in seven oxidation states (0, 2+, 3+, 4+, 5+, 6+ and 7+), but the three most important for groundwater behavior are Mn
2+, Mn
3+ and Mn
4+. The Mn
2+ ion is the most widespread and stable form in natural waters in an anaerobic environment, with Eh values < 0. It generally exists as a hydrated ion at a pH between 6 and 8, equal to over 95%, and at a pH equal to 9 for 62% of the species in solution [
29]. Mn occurs mainly as reduced soluble Mn
2+ at lower pH and Eh, but is oxidized to form precipitates with higher oxygen content and at higher pH. However, the availability and solubility of manganese, even in the form of Mn
2+ ions, generally increases with pH above 6.
The diagram shows that piezometers MW1, MW2, MW8, MW16, MW31 and MW37, whose concentrations are higher than the proposed NBV, are associated with the ionic form Mn2+, present in groundwater under reducing conditions.
In particular, even in this diagram, it is possible to notice how the MW1 piezometer behaves differently from all the other piezometers. This confirms the correct exclusion of the MW1 piezometer’s Mn concentrations from the calculation of the natural background value.
Therefore, the diagram shows how the analyzed samples are characterized by low or negative redox values, thus highlighting possible local phenomena in progress linked to the geogenic conditions of the soil, which could determine high manganese values. In fact, in the study area, there are layers of granular and lithoid tuffs with slightly clayey sand, which favor the establishment of anaerobic environments which determine the reduction in the redox potential towards low and negative values. These conditions favor the mobilization of metals, such as Mn, in groundwater, which can, therefore, have higher concentrations and even exceed legal limits.
6. Conclusions
The study of the natural background values for the groundwater of the non-hazardous solid waste landfill under study made it possible to propose a background value of 192.3 µg/L, which significantly exceeds the CSC defined by Legislative Decree 152/06 (50 µg/L).
Based on the indications provided by the ISPRA LG [
22], 11 sampling points were identified (MW1, MW2, MW8, MW9, MW15, MW16, MW17, MW31, MW37, MW40 and MW42), located hydrogeological upstream of the landfill, as they are useful for determining natural background values. On the basis of the spatial variability (N = 11 sampling points) and the temporal variability (8 ≤ n ≤ 30), the study falls into case C “Sample size adequate to describe the variability over time of the parameter(s) in the waters of the dataset in examination, but not in space” [
22], showing a confidence level for the proposed NBV which varies between the “Medium (M)” class, in the hypothesis of n ≤ 15, and the class “High (A)”, in the hypothesis of 16 ≤ n ≤ 30, in accordance with the ISPRA LG. Therefore, the proposed background value for manganese corresponds to the 95th percentile.
Based on the chemical–physical parameters, the MW1 piezometer was not considered for calculating the natural background value, as it was characterized by a different geochemical behavior compared to the other piezometers.
The calculations of Mn concentrations in groundwater have highlighted the presence of anaerobic environments to favor reducing conditions (Eh < 0). These conditions mainly characterize anoxic waters, and consequently, manganese is found in groundwater in the form of the ionic species Mn2+.
The Eh/pH diagram reconstruction highlighted how the piezometers (MW1, MW2, MW8, MW16, MW31 and MW37), whose Mn concentrations are higher than the proposed NBV, are associated with the ionic form Mn2+. Therefore, these considerations allow us to confirm the natural origin of exceeding manganese concentrations beyond the CSC of Legislative Decree 152/06.
These exceedances are therefore associated with the geological characteristics of the soils deriving from the meteoric degradation of rocks of pyroclastic origin and the establishment of local phenomena (anaerobic environments in reducing conditions), such as to favor the release and mobilization of manganese in the environmental compartments.
In sites subjected to high anthropic activity, it is important to distinguish the natural factor from the anthropic one. Consequently, it could be useful to add sampling points upstream and downstream of the plants being studied to better evaluate the phenomena that can influence the possible surpluses of the proposed NBV.
A study of this kind could also provide new perspectives on managing natural contamination in volcanic regions, offering potential advancements in environmental geochemistry and public health protection.


