Abstract
To investigate the influence of flow rate increment on the solute transport parameter of immobile zones in a karst system, a dye tracer test was conducted in the Downtown Salado Spring Complex (DSSC) comprising three springs: Big Boiling, Anderson, and Doc Benedict springs. The Multiflow two-region nonequilibrium model (2RNE) was used to simulate the breakthrough curve (BTC) of the springs, and changes in the solute transport parameters in response to flow rate increment were observed. The simulation result showed that the 2RNE model was capable of reproducing the BTC of all the DSSC springs, with an R-squared value greater than 0.9 in all flow rate increment scenarios. The research demonstrates that a positive correlation will exist between the flow rate and solute transport parameter of the immobile zones if the tracer transport to the spring is truly influenced by immobile zones. In contrast, a negative correlation will exist between the flow rate and mass transfer coefficient if the immobile zone has less influence. Overall, the research provides insights into contaminant movement in karst by documenting how tracers are retained in the immobile fluid zone.
1. Introduction
Groundwater from karst aquifers is a critical source of freshwater for human use, and karst aquifer protection is an essential component of water management in many regions of the world [1,2,3]. Within a typical karst system, the dissolution of carbonate rocks such as limestone and dolomite can lead to the formation of surface openings like sinkholes, caves, and solution-widened fractures, and groundwater flow in the system can occur as conduit porosity, matrix porosity, and fracture porosity [4,5,6,7,8,9,10]. Generally, in non-carbonate formations, groundwater flow through the rock matrix is minimal because of the poor connectivity and smaller pore space [6]. In contrast, flow in karst aquifers is usually dominant along fractures and bedding planes, serving as the point of origin for water movement in the subsurface and subsequent widening via dissolution into a turbulent karst conduit flow [11,12,13,14]. The duality of high flow velocity in the karst conduits under turbulent conditions and low flow velocity in tiny fractures adds to the complexity of a typical karst system [15,16]. Karstic conduits can transport contaminant spills over short or long distances, toward groundwater wells or karst springs, rendering groundwater vulnerable to contamination [17,18,19]. Additionally, contaminants can also be transported at low flow velocities in fractures before they finally reach karst springs [18]. Given this transport scenario, a profound understanding of contaminant transport in the karst system is crucial to groundwater remediation and protection. However, some challenges still exist in simulating contaminant transport in a karst system [9]. A fundamental challenge in defining flow through the karst system is based on the aquifer matrix heterogeneity, which can have multiple flow channels or pathways characterized by varying hydraulic and geometric features. To define the transport of solute (which mimics contaminant transport) through the karst system, the solute transport parameters under varying flow rates must be properly understood.
An important aspect of modeling solute transport processes in karst is the characterization of immobile or storage zones along karst conduits, which may have different responses under different flow rates (Figure 1). These immobile zones serve as solute storage and are released gradually into the mobile zone [20,21,22,23,24]. The storage and release of solute are very common phenomena in a karst system and have drawn increasing interest from researchers in recent years [25]. For instance, in situations where groundwater and surface water interact, riparian sediments may act as a storage zone where solutes are retained when the river level rises and are also gradually released into the river when there is a drop in the river level [26]. Similarly, surface karst features such as sinkholes, caves, and solution-widened fractures may carry a large amount of runoff (overland flow) and solute into the karst system under varying flow rates where there is a fluid mass exchange between the mobile and immobile zones along fractures and conduits [21]. The immobile zone in karst conduits is caused by surface irregularities along the conduit zone [2]. Such surface irregularities leading to reservoirs or pools along the conduit zones are caused by undercutting, cave breakdown, sediment clogging, and dead-end passages [27]. Immobile zones can cause long-tail behavior of the solute concentration breakthrough curve at karst springs, which are usually determined by a tracer test in karst aquifers. Numerous studies have conducted dye trace tests to investigate the relationship between solute transport and flow rate [28,29,30,31]. Morales et al. [2] analyzed the solute concentration BTC data from 26 tracer tests conducted at varying flow conditions. Findings from their work show a relationship between flow rate and peak velocity. Massei et al. [20] and Morales et al. [2] conducted experimental studies where two different solute transport models were used to replicate solute concentration BTC to investigate changes in solute transport parameters with response to flow rate. Their results showed that the long-tail behavior of the BTC was mainly due to the hydrodynamic conditions of the karst conduit system. Göppert and Goldscheider [32] examined the transport properties of the solute and colloidal in karst conduit systems at high and low flow conditions and discovered that higher flow rates result in higher peak concentrations. Dewaide et al. [28] investigated the influence of transient storage on the shape of BTC and found that the solute transport parameter varies significantly with increasing flow rate. Zhao et al. [30] conceptualized the karst conduit as a pool–pipe system, where the pipe mimics the conduits system and the pool mimics the immobile zone in karst conduits. The authors conducted a laboratory experiment to investigate the effect of flow rate variation on the shape of BTC. Although the simulation of flow rate variation in karst via laboratory experiments is quite common in the literature [21], not many studies have extensively quantified the influence of flow rate increment on the transport parameters of the immobile water zone of a karst system, especially in a field setting which, to our understanding, is closer to reality as compared to the several assumptions made to simulate reality in laboratory studies. One common approach in laboratory studies involves the construction of a single pipe of varying lengths to mimic flow scenarios in karst [30], even though karst systems often contain multiple conduits in complex networks.
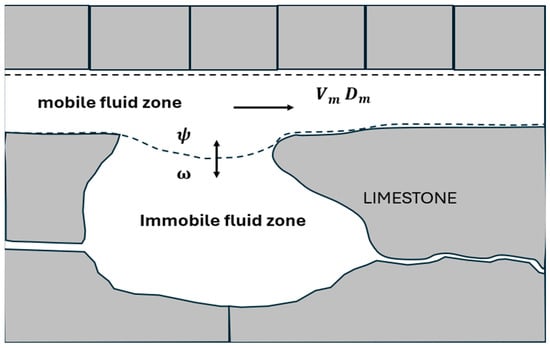
Figure 1.
Illustration of flow within karst conduit. The tracer in the mobile fluid zone is transported by advection (mobile fluid velocity, ) and dispersion (). The partition coefficient accounts for the proportion of mobile zones while the mass transfer coefficient ω accounts for the mass exchange between the mobile and immobile fluid zones.
The analysis of breakthrough curves allows for the quantitative assessment of solute transport parameters in the karst system and can also yield information about transport processes, such as dispersion, advection, flow convergences, and divergence, which is useful for contaminant transport studies [2]. The foundation for the analysis of BTCs is based on a solute transport model that is typically specified in terms of the primary transport processes and the common method of modeling tracer breakthrough curve is the use of the one-dimensional advection–dispersion transport equation (ADE) [11]. The ADE does not consider transport parameters such as the mass transfer coefficient that account for immobile zones in a karst system. As a result, it becomes difficult to simulate the long-tail behaviors of the observed breakthrough curves [23]. In other words, due to the mismatch between the ADE model breakthrough curve and the observed breakthrough curve in the tailing area, these models do not accurately depict the additional processes (immobile zone) affecting the solute transport. This constitutes a major drawback to the use of the ADE model; hence, the dual porosity or partitioning model is often used. An example of such a dual-porosity model is the two-regions nonequilibrium model (2RNE) which has been applied to karst aquifers by Field and Pinsky [27]. The 2RNE was first introduced by Toride et al. [33] and was designed to account for the presence of immobile fluid zones along solute transport channels and a first-order mass transfer between the immobile and mobile fluid zone. The 2RNE has been used by many researchers to describe solute transport processes in karst conduits [34,35]. Zhao et al. [21] noted that the 2RNE is suitable for modeling solute transport in karst conduits with a pool. The analytical solution to the 2RNE was modified into a multiflow approach (MFIT-2RNE) by Bodin [36] and has been implemented into a program called MFIT (Multiflow Inversion of Tracer Breakthrough Curve), which has been widely used to model solute transport in karst aquifers [37,38]. The MFIT program incorporates four transport models including the 2RNE into a multiflow approach such that each model can be used separately in the program. Despite the rich literature on the application of the 2RNE in modeling the transport processes in the karst system, to the best of our knowledge, no studies have been conducted where the MFIT-2RNE that incorporated the multi-channel approach is used to investigate the influence of flow rate increment for immobile zones in karst aquifers.
This work focuses on investigating the influence of flow rate increment on solute transport parameters for immobile zones in a karst system. The rationale behind the study is that flow rate increment simulates a turbulent flow condition within the conduit, which can best depict the behavior of contaminants, as it is retained in the immobile zones during extreme hydrologic conditions. The immobile zones are particularly important in urban karst areas where urban development, such as city construction, housing, agriculture, etc., increases the potential for land use, leading to concerns about the quality of karst groundwater resources [39]. A case study is the Downtown Salado Spring Complex (DSSC), comprising three springs, located adjacent to an urbanized area along Interstate Highway 35 in Salado, Bell County, Texas. Since the springs serve as a habitat for US federally listed threatened aquatic species (Eurycea chisholmensis), there is a need for modeling flow rate variation to understand the transport processes in conduits feeding the spring. For this purpose, a dye tracer test was conducted in the DSSC where rhodamine WT dye was injected into a cave well and monitored at the springs within the DSSC. The recorded breakthrough curve for each spring in the DSSC was analyzed using the MFIT-2RNE to account for the skewness and long tailing in the BTC.
2. Materials and Methods
2.1. Geological Setting of the Study Area
The surface geological setting of the study area consists of Cretaceous bedrock to Quaternary alluvium present along various stream channels in the Salado Creek basin. The formation of the Cretaceous rocks in the study area occurred as deposits on the shallow seafloor defined by significant transgression events of the modern Gulf of Mexico [40]. The pre-Cretaceous strata beneath the younger deposits dip between 10 and 70 degrees east, while the Cretaceous strata lie unconformably across them. The Cretaceous units in the study area dip southeastward at a slope of 10 to 300 feet per mile [41,42]. A major aquifer in this region of the United States is the Edwards Balcones Fault Zone (BFZ) aquifer. The Edwards BFZ aquifer lies along the normally faulted Balcones Fault Zone, with the fault system cutting through the Cretaceous age rocks and extending from Waco to San Antonio. The Fault zone is also positioned approximately parallel to Interstate Highway 35. The faults and fractures associated with the Balcones Fault Zone significantly impact the groundwater flow paths and hydraulic properties of the Edwards BFZ aquifer. The faults and fractures in the area act as natural channels for groundwater flow and also aid in the formation of caves and sinkholes within the region as a result of carbonate dissolution, and karstification. The Edwards BFZ aquifer is divided into three hydrogeological segments: the San Antonio Segment, the Barton Spring Segment, and the Northern Segment [43]. The study area is located within the Northern Segment of the aquifer. The Northern Segment of the Edwards BFZ aquifer is an unconfined and confined karst aquifer. The unconfined portion of the aquifer is made up of outcropping Comanche Peak Limestone, Edwards Limestone, and Georgetown Formations. Brune and Duffin [41] described the confined portion as the down-dip section of the aquifer where the hydraulically connected Edwards Limestone and other associated limestones are overlain by the confining Del Rio Formation also known as Del Rio Clay (Figure 2). The uppermost unit is the lower confining unit called the Walnut Formation, and it yields little or no water [42]. It is made up of carbonaceous clay material, also known as marl. The upper confining unit is the Del Rio Formation (sometimes called the Grayson Formation). These two formations act as aquitards for the aquiferous unit, which is comprised of the Georgetown, Edwards, and Comanche Peak limestones. The Eagle Ford Group, Buda Formation, and Austin Chalk Formation are Cretaceous units that overlie the Del Rio Formation and crop out in the Salado Creek basin. None of these overlying Cretaceous units are considered aquifers in this area. The study area is located in the unconfined portion within the Northern Segment of the Edwards BFZ aquifer where the Edwards and associated limestones crop out. The Edward Formation is the main aquifer unit and is highly fractured and faulted. It is described as a brittle, thick-bedded to massive limestone that has undergone significant dissolution, which has resulted in solution-collapse features that now serve as major water-bearing zones in the Edwards BFZ aquifer [41]. In the study area, the Edwards Formation has a maximum thickness of approximately 196 feet and begins to thin north of the study area [44]. A comprehensive geologic map of the Northern Segment is shown in Figure 3. The Edwards BFZ aquifer is made up of water-yielding units of carbonate rocks and sandstones and the Northern Segment covers an area of approximately 1000 square miles [45]. Furthermore, the aquifer is categorized as highly anisotropic and heterogeneous with preferential flow paths that follow the trend of the northeast–southwest positioned fractures and conduits associated with the Balcones Fault Zone [44]. The hydraulic gradient in the Northern Segment is east–southeast, which is largely determined by the surface topography, but deviates northward towards the Downtown Salado Spring Complex (DSSC) along the Balcones Fault Zone in Bell County [46]. The DSSC was created through the entrenchment process by Salado Creek into the Edwards (BFZ) aquifer that locally intersected fractures and conduits, thereby causing the exposure of the springs at the surface [46].
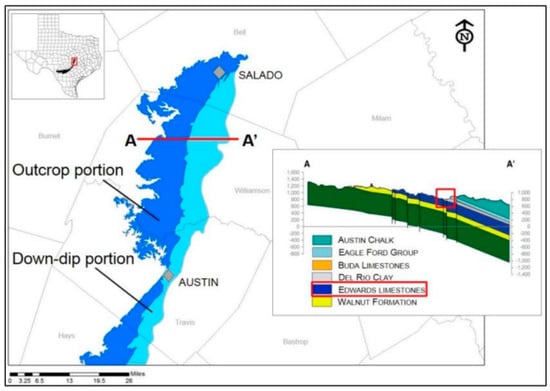
Figure 2.
A stratigraphic section that cuts across the Northern Segment of the Edward BFZ aquifer [47]. The red box represents the location of the study area, which shows that the Edwards limestone crops out at the surface and is considered the aquifer unit.
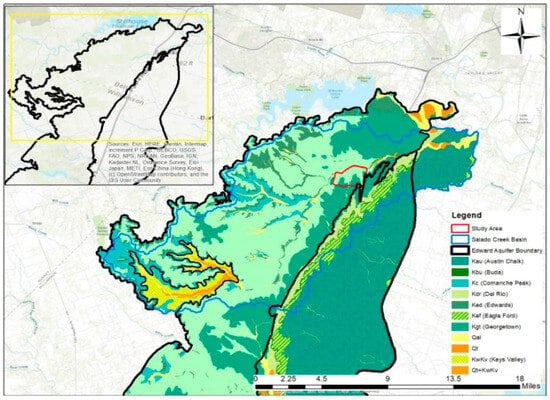
Figure 3.
Geologic map of the Northern Segment of the Edward BFZ aquifer, modified after Wong and Yelderman [47]. The DSSC study area is shown in the red box.
The climate in the study area is classified as subtropical and sub-humid to semiarid [44]. In central Texas, the average annual temperature is 68 °F. Winters are typically mild with a mean minimum temperature of 41 °F while summers are hot with a mean maximum temperature being 95 °F. A 76-year (1900–1976) precipitation record obtained from the U.S. National Weather Service indicates that the average annual precipitation is approximately 33.5 inches [41]. The minimum rains typically occur in July and August each year, while the peak rains occur in May and September.
2.2. Methodology
This research was conducted in two stages: (1) fieldwork, and (2) data processing and analysis. The techniques employed in these two stages are detailed below.
2.2.1. Dye Tracer Test
In March 2024, a dye tracer test was conducted in the Downtown Salado Spring Complex (DSSC), which consists of three springs: Big Boiling Spring, Anderson Spring, and Doc Benedict Spring (Figure 4). Previous work had established that the Stagecoach Inn cave well was hydraulically connected to the DSSC springs [47,48]. A 72 h field dye test was conducted using Rhodamine WT dye, a reddish-brown liquid dye commonly used in tracer studies of groundwater and surface water. The quantity of the rhodamine dye for injection was determined based on a formula recommended by Field [49] which is a function of the spring discharge, the distance between the injection and detection point, and the maximum peak concentration of the dye. This formula has been suggested to be effective in estimating quantities of dye for tracer tests [49]. Therefore, 172.5 g of rhodamine WT was injected into the Stagecoach Inn Cave Well and the tracer was monitored for 3 days by field fluorometer (PME Cyclop-7 Logger) with a calibrated time step of 5 min between each measurement. Before the dye tracer test, the fluorescence background concentrations of each DSSC spring were monitored and recorded for 30 min so that the tracer concentration value could be corrected. Discharge measurements for each spring were also measured. Previous research by Yelderman and Wong [47], who studied the DSSC karst system, has reported a constant discharge rate, which further means that the springs exhibit little to no discharge fluctuation except after storm events. Since there was no precipitation during the tests, the discharge rate was assumed to be constant for each measured day. Overall, the result of the dye tracer test is a breakthrough curve obtained for each monitored spring in the DSSC.
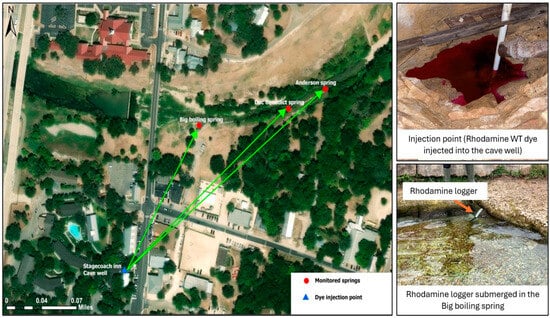
Figure 4.
Satellite imagery of the springs in the Downtown Salado Spring Complex (DSSC). The DSSC springs are Big Boiling Spring, Anderson Spring, and Doc Benedict Spring. The springs are all indicated by red circles, while the blue triangle shows the location of the cave well in the area.
Rhodamine WT can sorb to fine particles and minerals, but the potential for sorption to carbonate rocks is not well understood. Prior to the dye test in the karst system, we performed a laboratory test of the sorptive capacity of rhodamine WT in this karst system. Rock samples were collected from the DSSC study site, crushed into gravel-sized or finer material, and then placed into 22 L bins. Rock bins were then filled with a 0.33 mg/L rhodamine WT solution. Over a 48 h test, there was no detectable change in rhodamine concentration in water sampled from bins, suggesting minimal sorption effects.
2.2.2. Modeling Approach (Analysis of Breakthrough Curves)
By using conservative tracers such as rhodamine WT dye, the flow and transport processes in the karst system can be described by analytical modeling of breakthrough curves [50]. The concentration breakthrough curve obtained from the DSSC dye tracer test was analyzed using an inverse modeling process incorporated into the Multiflow Inversion of the Tracer Breakthrough Curve (MFIT) software version 1.0.0 [36]. MFIT is a breakthrough curve (BTC) fitting tool that integrates various analytical solute transport models with the optimization routine of PEST (a model-independent parameter optimizer) [51]. The foundation of the modeling technique in MFIT is based on the multiflow framework approach first described by Maloszewski et al. [52], which assumes that the spatial heterogeneity of a karst system can be represented as a series of independent one-dimensional channels (Figure 5). Analytical models such as the two-region nonequilibrium model (2RNE) of Toride et al. [33], which is incorporated into MFIT, describe the various solute transport processes at the scale of the individual one-dimension channel described in Figure 5. The 2RNE models are dual porosity models that account for the mass exchange of solute between individual one-dimensional channels and the surrounding adjacent stagnant zones (immobile zones). A key distinction between the 2RNE models and other transport models like the single fracture dispersion model (SFDM) is the mathematical expression of the mass exchange between the mobile and immobile zone, which is primarily governed by the diffusion (second order) process in the SFDM and the first-order process in the 2RNE model [36]. The overall equation that governs the model is given in this section. Equation (1) is the mass flux balance equation used to calculate the solute concentration at the outlet of the multiflow framework described in Figure 5.
where C is the solute concentration at the outlet, Q is the flow rate of the system, N is the number of flow channels between the injection and detection point, subscript j represents the flow channel index, and and are the concentration and flow rate in the jth channel, respectively.
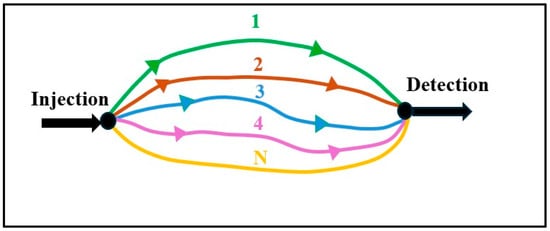
Figure 5.
A schematic representation of the multiflow modeling approach incorporated into the MFIT model program [36]. The transport of the tracers from injection to the detection point is assumed to occur via a flow network that consists of N-independent one-dimensional channels. Each of the channels represents fractures and conduits through which solute is transported into karst springs and the model assumes that there is no mass exchange between each of the channels. In other words, the channels are independent of each other. Using solute transport analytical equations from the 2RNE incorporated into the MFIT program, the model can define the solute transport parameters for each channel.
The 2RNE transport model accounts for the mobile and immobile fluid zones along the primary conduit but assumes that the immobile zone is due to surface irregularities, and as a result, matrix diffusion is negligible [21]. The transport equation governing the 2RNE model was first proposed by Coats and Smith [53] and is described below.
where and are the immobile and mobile volumetric water contents, respectively; [] is the concentration in the immobile zone, and is a first-order mass transfer coefficient. The analytical solution to Equations (2) and (3) was developed by Toride et al. [33], and further modified by Bodin et al. [36]; it is incorporated into the MFIT program and is presented below in Equations (4)–(8).
where is the modified Bessel function, is the integration variable, is the solute mass flowing through the jth channel, is the dispersion coefficient, is the advective velocity, t is the time variable, is the fraction of the mobile zone, is the mass transfer coefficient, is the length of the flow channel, are the Peclet number and mean transit time, respectively. The input parameters for the 2RNE model are presented in Table 1.

Table 1.
Input parameters of the 2RNE model in the MFIT program. Parameters with the subscript j must be defined for each flow channel between the injection and detection point, while the parameters with no subscript are common to all the flow channels. Q, , , and parameters were calculated based on the dye tracer results, while other parameters were fitted using the model.
2.2.3. Defining the Input Variables of the Transport Model
The flow rate between the injection point and each spring was calculated by multiplying the groundwater velocity by the cross-sectional area of the channel. The groundwater velocity is a function of the linear distance between the injection point and the spring, and the mean transit time. The mean transit time, which reflects the aquifer’s turnover time, is the amount of time needed for the centroid of the tracer mass to transit the whole length of the aquifer system. A simplified calculation by Mull et al. [54] was used to estimate the mean transit time. To calculate the cross-sectional area, an important parameter that is required is the maximum karst conduit volume, which is a function of the mean spring discharge and mean transit time [55]. The karst conduit volume is then divided by the distance to yield a cross-sectional area. The groundwater velocity (m/s) is multiplied by the cross-sectional area of the channel () to yield the total flow rate of the system (Q). The mass of the dye detected at each spring () was calculated by multiplying the mean discharge value by the measured tracer concentration [56]. is assumed to be the distance between the injection and detection point. Other parameters such as the partition coefficient (), mass transfer coefficient (ω), and peclet number (Pe) cannot be measured in the field but can only be obtained from the analytical modeling of breakthrough curves (calibration). A reasonable range of these parameter values was obtained from the current literature that has used the MFIT model or other similar models such as CXFIT [36,37]. Thereafter, MFIT provides the solution to the analytical equation of the model based on these initial parameter values, and the result is a modeled solute concentration breakthrough curve. In most cases, these modeled BTCs do not fit or match the observed BTC (actual field data) in one iteration or trial [23]. A better alternative is the autocalibration process by PEST which has been incorporated into the MFIT model program. PEST is a public-domain model-independent program that is used for parameter estimation. PEST automatically adjusts the model parameter until the simulated value of the model fits the observed BTC. Therefore, the optimization of the model parameters for each flow channel was performed using PEST [51]. The PEST optimization process of the model was carried out to incorporate flow rate variation where the actual flow rate (estimated based on field measurements) was used to determine the solute transport parameters such as Pe, ω and ψ. This was achieved by making the flow rate, mass of dye, and channel length fixed, while PEST generates the optimized parameters for Pe, ω, and ψ. At the end of the PEST optimization process, a specific number of optimized channels is produced based on the PEST optimization of the parameter values [36]. Each of these optimized channels is assumed to be a subsurface flow pathway through which the tracer passes into the spring and the solute transport parameters such as the transit time; Pe, , and in each channel are revealed in the model. In the next step, the flow rate was varied with an increasing rate of 5 /h and the new parameter values for the Pe, , and are determined from the model simulation based on the change in flow rate. In general, the analysis in this study involves comparing the change in the solute transport parameters as the flow rate varies. The model output was evaluated using the coefficient of determination (), which is the regression of the observed and modeled BTC and is given by Equation (9).
3. Results and Discussion
Tracer breakthrough curve analysis is a useful tool for characterizing karst conditions. These analyses can be interpreted qualitatively (karst network organization) or quantitatively (by examining tracer recovery, tracer velocities, and mean transit time).
3.1. Qualitative Interpretation of Breakthrough Curves at the DSSC Springs
Rhodamine WT dye was first detected at the Big Boiling Spring 0.75 h after its injection at the Stagecoach Inn cave well approximately 228 m away, with the maximum concentration of 0.22 ppm recorded 1.08 h after injection (Figure 6c). Thereafter, the dye was detected at Doc Benedict Spring only 1.33 h after the injection at the stagecoach inn cave well approximately 306 m away. It had a maximum tracer concentration of 0.044 ppm recorded 2.4 h after injection (Figure 6b). The dye was detected at Anderson Spring after 1.41 h of dye injection at the cave well approximately 383 m away (Figure 6a). Breakthrough curves (BTC) for all the springs were unimodal. The shape of the BTCs was characterized by a rapid increase in tracer concentration until it peaked, after which the concentration decreased slowly, resulting in the long tailing of the curves. While each spring was monitored for 72 h, it is worth noting that the field fluorometer installed at Big Boiling Spring detected no dye at the spring after 60.8 h. This was not the case for Anderson and Doc Benedict springs, as the fluorometer installed in both springs detected rhodamine dye in smaller concentrations throughout the 72 h tracer test. In other words, the breakthrough curve of Anderson and Doc Benedict springs was not complete at the end of the 72 h tracer test, which may indicate that a smaller amount of the dye was retained in the aquifer. In general, the tracer was detected at the three springs, which confirms the hydraulic connection between the cave well and the monitoring springs in the DSSC.
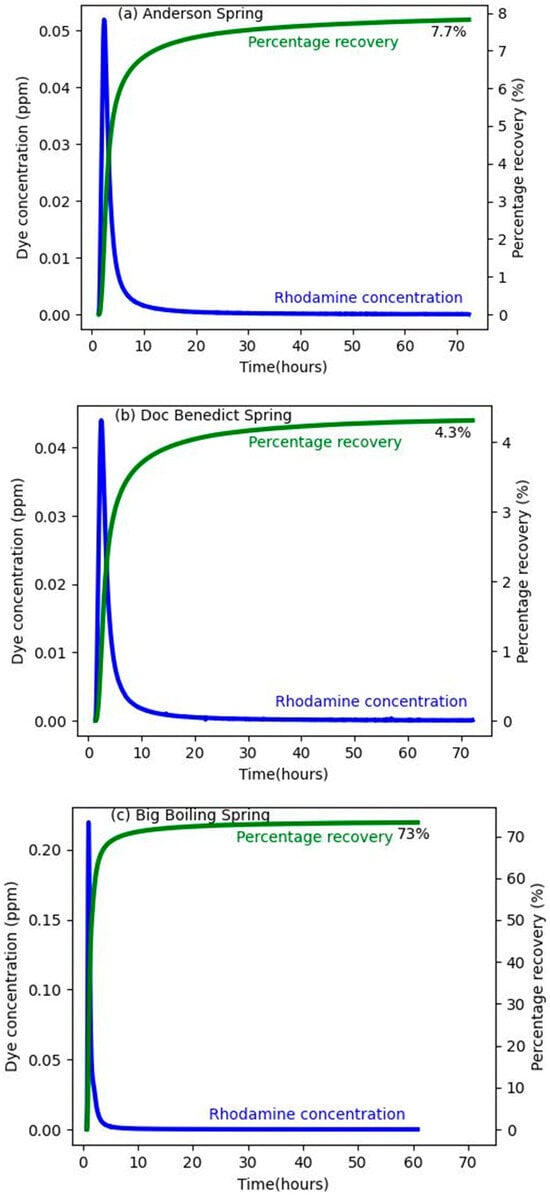
Figure 6.
(a) Breakthrough curves of Anderson Spring, (b) breakthrough curve of Doc Benedict Spring, and (c) breakthrough curve of Big Boiling Spring. The blue and green line plot represents the observed rhodamine concentration and the percentage of dye recovery, respectively.
3.2. Quantitative Interpretation of Breakthrough Curves at the DSSC Springs
The estimation of tracer recovery for each spring at the DSSC is given by Equation (10):
where is the concentration of the tracer (ppb), is the spring discharge (m3/s), is the total mass of tracer recovered (g), n is the number of receptors, and is any necessary time needed to allow conversion into mass. The result shows 73%, 7.7%, and 4.3% tracer recovery for Big Boiling, Anderson, and Doc Benedict springs, respectively. This indicates a 15% overall tracer loss during the tracer test. Furthermore, the dye recovery of 73% in Big Boiling Spring confirms that the spring is a major outlet from the cave well. The peak and mean velocities are calculated based on the time of dye peak concentration, and the mean transit time, respectively. The mean transit time is the amount of time needed for the centroid of the tracer mass to transit the whole length of the aquifer system. Although the mean transit time of the tracer cannot be read directly from the BTC of all the DSSC springs, it generally falls between the 50% tracer discharge time and the peak time of detection [23]. Therefore, the mean transit time can be estimated based on the centroid of the dye concentration of the BTC. Since the BTC of all DSSC springs is positively skewed, the time of half recovery of the tracer was determined by superimposing the cumulative recovery curve and breakthrough curve on the same plot (Figure 6). Given this approach, the mean transit time for the BTC of Doc Benedict, Big Boiling, and Anderson springs is 3.3, 1.3, and 3.1 h, respectively. The mean tracer velocity is the measure of the velocity of the centroid of the dye mass. Based on the linear distance and the mean transit time determined from the centroid of dye mass, the mean tracer velocity for Doc Benedict, Big Boiling, and Anderson springs was calculated to be 92.7 m/h, 175 m/h, and 123.5 m/h, respectively. The calculated mean tracer velocities were observed to be within the range of the mean tracer velocities reported for karst conduit flow, such as from 4.5 to 1450 m/h by Ford and Williams [57] and from 7.2 to 1880 m/h by Milanovic [58]. The long-tailing behavior of the breakthrough curves of the DSSC springs in addition to the tracer loss observed led us to consider the immobile zone along tracer paths to the springs. These immobile or storage zones can be viewed as the stagnant zones of the karst conduits paths where some tracer is deposited and retained during transport [11,59]. To model the immobile zone in the karst system while taking into consideration conduits flow paths, we assumed that matrix diffusion did not take place during the tracer test. This assumption was made because the duration of our tracer test (3 days) was not sufficient for matrix diffusion to be significant.
3.3. Modeling Results
The two-region nonequilibrium model (2RNE) was used to reproduce the breakthrough curves of the DSSC springs with a single peak and long tailings and the changes in the solute transport parameters in response to flow rate increment are discussed.
3.3.1. Flow Rate Variation for Doc Benedict Spring and Anderson Spring
The output parameter of the 2RNE model for Doc Benedict Spring is presented in Table 2. The total flow rate (Q) between the cave well and Doc Benedict was calculated as 72 m3/h. The mass of the dye detected (M) at the spring was calculated to be 7.5 g. The length of the flow channel (L) is approximately 306 m. Next, the 2RNE in the MFIT computer program (MFIT-2RNE) was run five times. In the first simulation, the actual transport parameters based on field calculations (Q, M, and L) were fixed while PEST generated the optimized value for the Pe, , and T. The model output of the first simulation with an actual flow rate of 72 m3/h is presented in Figure 7. The model shows an value greater than 0.95, suggesting a good model fit between the observed (rhodamine) concentration and the 2RNE modeled concentration, especially at the tailings, which was also visibly evident. Two optimized channels were obtained from the 2RNE model. In other words, two channels produced the best fit between the 2RNE modeled and the observed breakthrough curve of Doc Benedict Spring. Here, the two channels (channels 1 and 2) are interpreted as subsurface tracer pathways through which the tracer is dispersed into Doc Benedict Spring. Furthermore, the channels are assumed to be independent of each other, i.e., no mass exchange can exist between them and the sum of the mass of each channel is equal to the total mass of dye detected at the spring. In our case, the sum of mass discharged from the two channels, i.e., 5.19 g in channel 1 and 2.31 g in channel 2, was equal to the total tracer mass (7.5 g) calculated using Equation (10) for Doc Benedict Spring. The Peclet number (Pe) differentiates several forms of mass movement in porous media, including advection, dispersion, and diffusion. An advective controlled solute transport is indicated by a Pe number greater than a threshold value of 0.4. [60]. In the model output for the actual flow rate of 72 m3/h, the Pe for channels 1 and 2 is observed to be between 3.5 and 43, which is significantly higher than the threshold value, indicating advectively controlled tracer transport in the channel. The partition coefficient is the fraction of the mobile zone along each channel. For instance, the of 0.81 in channel 1 means that the proportion of the mobile zone (81%) is higher than the immobile zone (19%). The mass transfer coefficient is given as 0.0021 m−1 and 0.0012 m−1 for channel 1 and channel 2, respectively.

Table 2.
Model output summary for Doc Benedict Spring. Parameters with subscripts 1 and 2 represent channels 1 and 2, respectively.
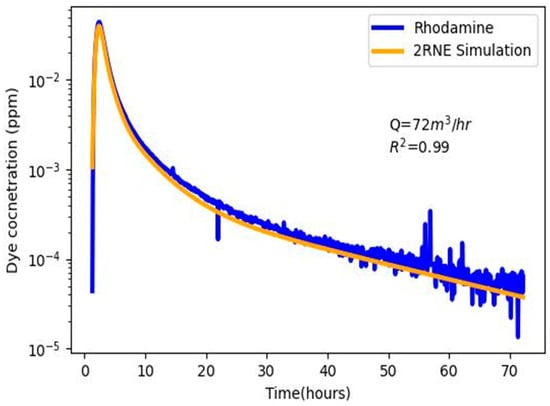
Figure 7.
Model output for a flow rate of 72 m3/h for Doc Benedict Spring.
As originally reported by Mull et al. [54], flow rate is a major factor that defines the hydrologic condition related to solute transport. This becomes evident when the solute transport parameters are plotted as a function of flow rate and a relationship is determined. Therefore, in subsequent simulations, the actual flow rate is increased up to 92 m3/h at an interval of 5 m3/h and changes in transport parameters of the two channels are observed for each flow rate increment. The result of the model output presented in Figure 8 shows that as the flow rate increases, the model fitting at the tailings gradually deteriorates, leading to a misfit between the observed and modeled breakthrough curves. The misfit became visible at a flow rate greater than 82 m3/h, which means that the increment of the actual flow rate up to 82 m3/h produced a better model fit compared to the flow rate of 87 m3/h and 92 m3/h for Doc Benedict Spring. Additionally, the 2RNE simulation for flow rates of 87 m3/h and 92 m3/h produced a modeled concentration value lower than that of the observed rhodamine concentration. This phenomenon is attributed to the dilution effect of the tracers as the flow rate increases, which means that the tracers spread out thinly due to the rapid movement of groundwater along the channel.
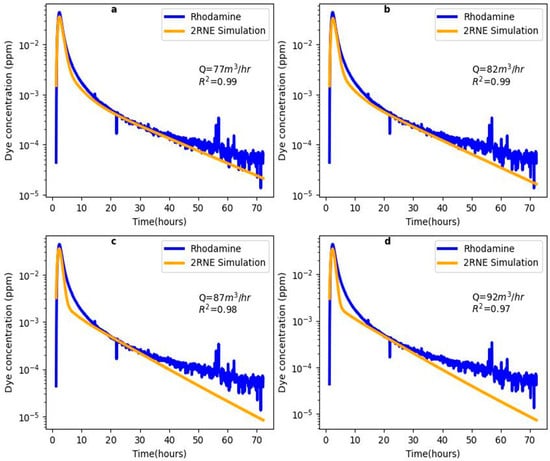
Figure 8.
2RNE Modeling output for flow rate variation for Doc Benedict Spring: (a) model output for a flow rate of 77 m3/h, (b) model output for a flow rate of 82 m3/h, (c) model output for a flow rate of 87 m3/h, and (d) model output for a flow rate of 92 m3/h.
The Pe is shown to decrease in all channels as the flow rate increases, assuming a constant flow length between the cave well and the spring. Morales et al. [2] and Massei et al. [20] also reported similar findings in their study of the solute transport process in the karst system. By comparing the based on the actual flow rate to the of subsequent flow rate variation, a 7.4% and 17.2% maximum percentage increase is observed at a flow rate (Q) of 92 m3/h in channels 1 and 2, respectively. This suggests that a positive correlation exists between the Q and along both channels (Figure 9a). Furthermore, the greater the percentage of the immobile zone (1 − ), the greater the mass exchange flux of the tracer between these stagnant flow zones and mobile zones over time. The percentage of immobile zones recorded in all flow rate increment scenarios in channel 2 is larger than that recorded in channel 1, leading to a 152% and 200% maximum increase in of channels 1 and 2, respectively, when compared with the calibrated value based on the actual Q. The values also increase with an increasing Q in both channels, indicating a positive correlation between the two parameters (Figure 9b). The positive correlation between Q and also suggests an intense exchange between the mobile and immobile zones. Due to the significant tailings of the BTC, the transit time calculated by the 2RNE model is shorter in channel 1 and significantly longer in channel 2. These transit times correspond to the average groundwater velocity ranging between 121 and 134 m/h and 30 and 31.5 m/h for the mobile zone of channels 1 and 2, respectively. While changes in Pe from flow rate variation have shown that the two channels are dominated by advectively controlled tracer transport, the shorter transit time calculated by the 2RNE model in channel 1 corresponds to an increased for each flow rate increment, indicating a greater advective controlled tracer transport compared to channel 2 with a longer transit time and a decreased . The dispersion coefficient (D) in both channels also increases as Q increases due to mixing caused by rapid groundwater flow along the channels (Figure 9c). This demonstrates that D, which is typically referred to as a constant parameter of a system, effectively changes in response to Q.

Figure 9.
Correlation plot for Doc Benedict Spring (a) correlation between Q and , (b) correlation between Q and , and (c) correlation between Q and D.
For Anderson Spring, the total flow rate (Q) between the cave well and the spring was calculated as 136 m3/h and the calibrated model parameter is presented in Table 3. Similarly to Doc Benedict Spring, the actual Q of 136 m3/h, L (383 m) from the cave well to the Anderson Spring, and the calculated M (13.4 g) for the spring, was kept fixed while other solute transport parameters were determined by PEST optimization. The inversion of the breakthrough curve based on these input parameters yielded two (2) channel tracer paths from the cave well to Anderson Spring. The simulation was run four times for subsequent flow rate increments up to 151 m3/h. Similarly to Doc Benedict Spring, the misfit at the tailings of the BTC as flow rate increases is due to the dilution effect along the channels (Figure 10). The mean transit time produced from the 2RNE model in channel 2 is less than the estimated transit time from the BTC, while the mean transit time from the 2RNE model in channel 1 is greater than the estimated transit time from the BTC. The low 2RNE transit time in channel 2 corresponds to high values of greater than 0.64. Similarly, the high 2RNE transit time of channel 1 corresponds to the low values of less than 0.42. This means that the percentage of the mobile fluid zone that contributes to the breakthrough curve of Anderson Spring increases at a shorter transit time along the channels. The , and values along the channel also increased as Q increased, indicating a positive correlation (Figure 11) and demonstrating intense mass exchange between the mobile and immobile zones. The model result shows that both Anderson and Doc Benedict springs displayed similar trends in , and in response to increasing Q.

Table 3.
Model output for Anderson Spring.
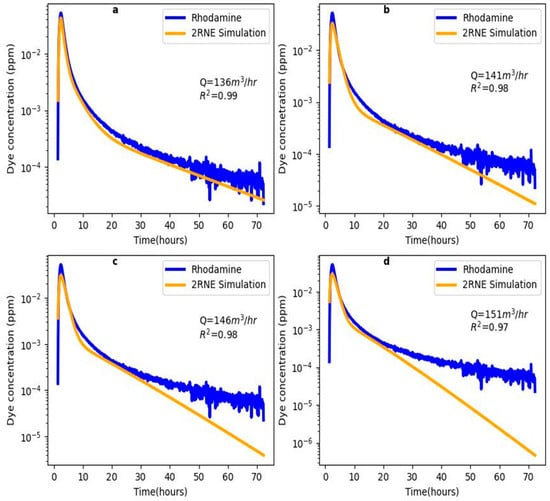
Figure 10.
2RNE Modeling output for flow rate variation for Anderson Spring: (a) model output at a flow rate of 136 m3/h, (b) model output at a flow rate of 141 m3/h, (c) model output at a flow rate of 146 m3/h, and (d) model output at a flow rate of 151 m3/h.

Figure 11.
Correlation plot for Anderson Spring: (a) correlation between Q and D, (b) correlation between Q and , and (c) correlation between Q and .
3.3.2. Flow Rate Variation for Big Boiling Spring
The model output parameter for Big Boiling Spring is presented in Table 4. The simulation result with a fixed Q of 1069 m3/h, L (228 m), and M (126 g) yielded three channels, indicating three flow path connections between the injection point and Big Boiling Spring. The calibrated values for and along the channels range between 0.37 and 0.92 and 0.00024 and 0.0016 m−1, respectively. As Q increased up to 1084 m3/h (Figure 12), the values increased while the values decreased in all channels. The D values are also observed to increase as Q increases along the channels (Figure 13a). A positive correlation exists between Q and (Figure 13c), while a decrease in values in response to Q increment demonstrates a negative correlation (Figure 13b). The high values (up to 0.92) and low values in response to increasing Q indicate that most tracers were transported in the main channel (mobile fluid zone) and there is a lower mass exchange between the mobile and immobile zones, leading to the tracer concentration falling below detection at 60.8 h.

Table 4.
Model output parameters for Big Boiling Spring.
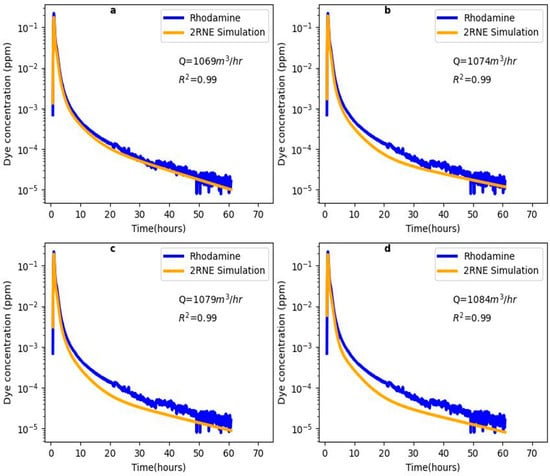
Figure 12.
2RNE Modeling output for flow rate variation for Big Boiling Spring: (a) model output at a flow rate of 1069 m3/h, (b) model output at a flow rate of 1074 m3/h, (c) model output at a flow rate of 1079 m3/h, and (d) model output at a flow rate of 1084 m3/h.

Figure 13.
Correlation plot for Big Boiling Spring (a) correlation between Q and D, (b) correlation between Q and , and (c) correlation between Q and .
4. Summary and Conclusions
The dye tracer test conducted at the DSSC revealed the influence of flow rate variation on the solute transport parameters of the immobile zone. The BTC of the springs was analyzed using the Multiflow 2RNE model and the model output generated a satisfactory model fit. This also means that the 2RNE model was capable of reproducing the BTC of the DSSC springs. The relationship between flow rate and the key transport parameters for the immobile zones has been established. A positive correlation exists between Q and the solute transport parameters of the immobile zone for Doc Benedict and Anderson springs. In Big Boiling Spring, a positive correlation also exists between Q and ; however, a negative correlation exists between Q and . When comparing the 2RNE modeling results of the three springs, the calibrated values for ranged from 0.58 to 0.87 for Doc Benedict Spring, 0.31 to 0.74 for Anderson Spring, and 0.37 to 0.92 for Big Boiling Spring. This implies that fewer tracers were detained in the immobile zone, especially in Big Boiling Spring. This makes sense considering that 85% of the tracers were recovered during the tracer test. As increases in response to increasing Q, more tracer is transported in the mobile zone, making up the equilibrium portion of the solute transport system. Thus, it is appropriate to anticipate that the mobile zone would occupy the majority of solution conduit volumes, which were obtained for all springs, as signified by the high values in all Q increment scenarios. The BTC of Big Boiling Spring showed the highest (>0.9) in one of the channels, which is expected due to its high mean flow velocity and spring discharge compared to Doc Benedict and Anderson springs. On the other hand, the values of Big Boiling Spring, ranging between 0.00024 and 0.0016 , were observed to be low when compared to the values of 0.0011–0.0031 and 0.0012–0.0055 for Anderson and Doc Benedict springs, respectively. The low value of suggests that a greater proportion of the tracer mass in the mobile zone had no sufficient time to equilibrate with the immobile zone before reaching the springs. Another possibility could be that the tracer mass delayed in the immobile zone is cast back into the mobile zone relatively quickly, leading to the shorter tailing of the BTC for Big Boiling Spring. In summary, the result shows that the BTC of Big Boiling Spring delivers the highest and the lowest in response to flow rate variation compared to the BTC of Anderson and Doc Benedict springs. This suggests that the immobile zone strongly influences tracer transport toward the Anderson and Doc Benedict springs compared to Big Boiling Spring. The dye test is further confirmation that the conduit systems feeding the DSSC springs are interconnected. The connectivity suggests that the DSSC springs could be thought of as a single, cohesive spring system and that migratory aquatic threatened species, like the Eurycea chisholmensis, may be able to travel throughout the spring system. Furthermore, the understanding of the solute transport parameters in response to increasing flow rate, as demonstrated in this study, can help boost groundwater remediation time, especially in the springs that are strongly influenced by immobile zones, such as the Anderson and Doc Benedict springs. Overall, the study provides information on addressing particular vulnerability questions such as (1) mean transit time, (2) time of first detection, (3) time of peak concentration, and (4) recovery time.
Author Contributions
Conceptualization, T.A., S.M.P. and J.C.Y.; methodology, T.A.; software, T.A.; validation, T.A. and J.C.Y.; formal analysis, T.A.; data curation, T.A. and J.C.Y.; writing—original draft preparation, T.A.; writing—review and editing, J.C.Y. and S.M.P.; supervision, J.C.Y.; funding acquisition, J.C.Y. All authors have read and agreed to the published version of the manuscript.
Funding
This research was funded by the Clearwater Underground Water Conservation District (CUWCD), Grant no: 10738-23.
Data Availability Statement
The raw data supporting the conclusions of this article will be made available by the authors on request.
Acknowledgments
We thank Wayne Hamilton for participating in the research fieldwork (dye tracer test).
Conflicts of Interest
The authors declare no conflicts of interest.
References
- Kiraly, L. Karstification and groundwater flow. In Evolution of Karst: From Prekarst to Cessation; Založba ZRC: Postojna, Slovenia; Ljubljana, Slovenia, 2002; pp. 155–190. [Google Scholar]
- Morales, T.; Fdez, I.; Valderrama, D.; Uriarte, J.A.; Antiguedad, I.; Olazar, M. Predicting travel times and transport characterization in karst conduits by analyzing tracer-breakthrough curves. J. Hydrol. 2007, 334, 183–198. [Google Scholar] [CrossRef]
- Ford, D.; Williams, P. Karst Hydrogeology and Geomorphology; Wiley: Chichester, UK, 2007. [Google Scholar]
- Smart, C.C. Artificial tracer techniques for the determination of the structure of conduit aquifers. Groundwater 1988, 26, 445–453. [Google Scholar] [CrossRef]
- White, W.B. Geomorphology and Hydrology of Karst Terrains; Oxford University Press: New York, NY, USA, 1988; p. 464. [Google Scholar]
- Birk, S.; Geyer, T.; Liedl, R.; Sauter, M. Process-based interpretation of tracer tests in carbonate aquifers. Groundwater 2005, 43, 381–388. [Google Scholar] [CrossRef] [PubMed]
- Shuster, E.T.; White, W.B. Seasonal fluctuations in the chemistry of lime-stone springs: A possible means for characterizing carbonate aquifers. J. Hydrol. 1971, 14, 93–128. [Google Scholar] [CrossRef]
- Bakalowicz, M. Karst groundwater: A challenge for new resources. Hydrogeol. J. 2005, 13, 148–160. [Google Scholar] [CrossRef]
- Hartmann, A.; Goldscheider, N.; Wagener, T.; Lange, J.; Weiler, M. Karst water resources in a changing world: Review of hydrological modeling approaches. Rev. Geophys. 2014, 52, 218–242. [Google Scholar] [CrossRef]
- Yang, M.; Yaquian, J.A.; Annable, M.D.; Jawitz, J.W. Karst conduit contribution to spring discharge and aquifer cross-sectional area. J. Hydrol. 2009, 578, 124037. [Google Scholar] [CrossRef]
- Goldscheider, N.; Drew, D. Methods in Karst Hydrogeology; Taylor and Francis Group: London, UK, 2007; ISBN 13 978-0-415-42873-6/978-0-20393462-3. [Google Scholar]
- Worthington, S.R.H.; Ford, D.C. Self-organized permeability in carbonate aquifers. Groundwater 2009, 47, 326–336. [Google Scholar] [CrossRef]
- Kresic, N. Water in Karst: Management, Vulnerability, and Restoration; McGraw-Hill: New York, NY, USA, 2012; 708p, ISBN 978-0-07-175333-3. [Google Scholar]
- Ronayne, M.J. Influence of conduit network geometry on solute transport in karst aquifers with a permeable matrix. Adv. Water Resour. 2013, 56, 27–34. [Google Scholar] [CrossRef]
- Stephenson, J.B.; Zhou, W.F.; Beck, B.F.; Green, T.S. Highway stormwater runoff in karst areas—Preliminary results of baseline monitoring and design of a treatment system for a sinkhole in Knoxville, Tennessee. Eng. Geol. 1999, 52, 51–59. [Google Scholar] [CrossRef]
- Katz, B.G. A multitracer approach for assessing the susceptibility of groundwater contamination in the Woodville Karst Plain, Northern Florida. In U.S. Geological Survey Karst Interest Group Proceedings: Water-Resources Investigations Report; Kuniansky, E.L., Spangler, L.E., Eds.; Geological Survey (U.S.): Reston, VA, USA, 2001; pp. 167–176. [Google Scholar]
- Zhou, W.; Beck, B.F. Management and mitigation of sinkholes on karst lands: An overview of practical applications. Environ. Geol. 2008, 55, 837–851. [Google Scholar] [CrossRef]
- Shokri, M.; Ashjari, J.; Karami, G. Surface and subsurface karstification of aquifers in arid regions: The case study of Cheshme-Ali Spring, NE Iran. J. Cave Karst Stud. 2016, 78, 25–35. [Google Scholar]
- Katz, B.G. Nitrate contamination in karst groundwater. In Encyclopedia of Caves; Culver, D., White, W., Eds.; Elsevier Science: Amsterdam, The Netherlands, 2019; pp. 756–760. [Google Scholar]
- Massei, N.; Wang, H.Q.; Field, M.S.; Dupont, J.P.; Bakalowicz, M.; Rodet, J. Interpreting tracer breakthrough tailing in a conduit-dominated karstic aquifer. Hydrogeol. J. 2006, 14, 849–858. [Google Scholar] [CrossRef]
- Zhao, X.; Chang, Y.; Wu, J.; Xue, X. Effects of flow rate variation on solute transport in a karst conduit with a pool. Environ. Earth Sci. 2009, 78, 237. [Google Scholar] [CrossRef]
- Cen, X.; Xu, M.; Qi, J.; Zhang, Q.; Shi, H. Characterization of karst conduits by tracer tests for an artificial recharge scheme. Hydrogeol. J. 2021, 29, 2381–2396. [Google Scholar] [CrossRef]
- Chu, X.; Ding, H.; Zhang, X. Simulation of solute transport behaviors in saturated karst aquifer system. Sci. Rep. 2021, 11, 15614. [Google Scholar] [CrossRef]
- Schiperski, F.; Zirlewagen, J.; Stange, C.; Tiehm, A.; Licha, T.; Scheyt, T. Transport-based source tracking of contaminants in a karst aquifer: Model implementation, proof of concept, and application to event-based field data. Water Res. 2022, 213, 118145. [Google Scholar] [CrossRef]
- Rinaldo, A.; Benettin, P.; Harman, C.J.; Hrachowitz, M.; McGuire, K.J.; Van Der Velde, Y.; Enrico Bertuzzo, E.; Botter, G. Storage selection functions: A coherent framework for quantifying how catchments store and release water and solutes. Water Resour. Res. 2015, 51, 4840–4847. [Google Scholar] [CrossRef]
- Harvey, J.; Gooseff, M. River corridor science: Hydrologic exchange and ecological consequences from bedforms to basins. Water Resour. Res. 2015, 51, 6893–6922. [Google Scholar] [CrossRef]
- Field, M.S.; Pinsky, P.F. A two-region nonequilibrium model for solute transport in solution conduits in karstic aquifers. J. Contam. Hydrol. 2000, 44, 329–351. [Google Scholar] [CrossRef]
- Dewaide, L.; Bonniver, I.; Rochez, G.; Hallet, V. Solute transport in heterogeneous karst systems: Dimensioning and estimation of the transport parameters via multi-sampling tracer-tests modeling using the OTIS (One-dimensional Transport with Inflow and Storage) program. J. Hydrol. 2016, 534, 567–578. [Google Scholar] [CrossRef]
- Goeppert, N.; Goldscheider, N.; Berkowitz, B. Experimental and modeling evidence of kilometer-scale anomalous tracer transport in an alpine karst aquifer. Water Res. 2020, 178, 115755. [Google Scholar] [CrossRef] [PubMed]
- Zhao, X.; Chang, Y.; Wu, J.C.; Peng, F. Laboratory investigation and simulation of breakthrough curves in karst conduits with pools. Hydrogeol. J. 2017, 25, 2235–2250. [Google Scholar] [CrossRef]
- Mohammadi, Z.; Gharaat, M.J.; Field, M. The effect of hydraulic gradient and pattern of conduit systems on tracing tests: Bench scale modeling. Groundwater 2019, 57, 110–125. [Google Scholar] [CrossRef] [PubMed]
- Goldscheider, N. A new quantitative interpretation of the long-tail and plateau-like breakthrough curves from tracer tests in the artesian karst aquifer of Stuttgart, Germany. Hydrogeol. J. 2008, 16, 1311–1317. [Google Scholar] [CrossRef]
- Toride, N.; Leij, F.J.; van Genuchten, M.T. The CXTFIT Code for Estimating Transport Parameters from Laboratory or Field Tracer Experiments, Version 2.1; Research Report No. 137; U. S. Salinity Laboratory, Agricultural Research Service, U.S. Department of Agriculture: Riverside, CA, USA, 1993.
- Geyer, T.; Birk, S.; Licha, T.; Liedl, R.; Sauter, M. Multitracer test approach to characterize reactive transport in karst aquifers. Groundwater 2007, 45, 36–45. [Google Scholar] [CrossRef]
- Aydin, H.; Ekmekci, M.; Soylu, M.E. Effects of sinuosity factor on hydrodynamic parameters estimation in karst systems: A dye tracer experiment from the Beyyayla sinkhole (Eskişehir, Turkey). Environ. Earth Sci. 2014, 71, 3921–3933. [Google Scholar] [CrossRef]
- Bodin, J. MFIT 1.0.0: Multi-Flow Inversion of Tracer breakthrough curves in fractured and karst aquifers. Geosci. Model Dev. 2020, 13, 2905–2924. [Google Scholar] [CrossRef]
- Bodin, J.; Porel, G.; Nauleau, B.; Paquet, D. Delineation of discrete conduit networks in karst aquifers via combined analysis of tracer tests and geophysical data. Hydrol. Earth Syst. Sci. 2022, 26, 1713–1726. [Google Scholar] [CrossRef]
- Yin, M.; Ma, R.; Zhang, Y.; Chen, K.; Guo, Z.; Zheng, C. A Dual heterogeneous domain model for upscaling anomalous transport with multi-peaks in heterogeneous aquifers. Water Resour. Res. 2022, 58, e2021WR031128. [Google Scholar] [CrossRef]
- Hartmann, A.; Kralik, M.; Humer, F.; Lange, J.; Weiler, M. Hydrological modeling of an alpine dolomite karst system. In Advances in Research in Karst Media; Andreo, B., Carrasco, F., Durán, J.J., LaMoreaux, J.W., Eds.; Springer: Berlin/Heidelberg, Germany, 2010; pp. 223–229. [Google Scholar]
- Young, K.; Grunig, D.; Jordan, M.A.; Parker, D.F.; Williams, B. Guidebook to the Geology of Travis County; The Student Geological Society, The University of Texas: Austin, TX, USA, 1977. [Google Scholar]
- Brune, G.; Duffin, G.L. Occurrence, Availability, and Quality of Groundwater in Travis County, Texas; Report; Texas Department of Water Resources: Austin, TX, USA, 1983; Volume 276, p. 219.
- Duffin, G.; Musick, S.P. Evaluation of Water Resources in Bell, Burnet, Travis, Williamson, and Parts of Adjacent Counties, Texas; Report 326; Texas Water Development Board: Austin, TX, USA, 1991.
- Jones, I.C. The Northern Segment of the Edwards (Balcones Fault Zone) Aquifer. In The Edwards Aquifer: The Past, Present, and Future of a Vital Water Resource; Sharp, J.M., Jr., Green, R.T., Schindel, G.M., Eds.; Geological Society of America Memoir; Geological Society of America: Boulder, CO, USA, 2019; Volume 215, pp. 119–130. [Google Scholar]
- Jones, I.C. Conceptual Model: Northern Segment of the Edwards (Balcones Fault Zone) and Associated Trinity Aquifers of Texas; Draft; Texas Water Development Board: Austin, TX, USA, 2020.
- Schwartz, F.W.; Zhang, H. Fundamentals of Groundwater; J. Wiley: Chichester, UK, 2003. [Google Scholar]
- Dahl, S.L. Hydrogeology and Stream Interactions of the Edwards Aquifer in the Salado Creek Basin, Bell and Williamson Counties, Central Texas. Unpublished. Master’s Thesis, Baylor University, Waco, TX, USA, 1990. [Google Scholar]
- Wong, S.; Yelderman, J.C., Jr. An Investigation into the Recharge Pathways and Mechanisms in the Northern Segment of the Edwards Aquifer, Bell County, Texas (Phase I, Phase II, Phase III); Research Report Prepared for Clearwater Underground Water Conservation District; Baylor University, Department of Geology: Waco, TX, USA, 2015. [Google Scholar]
- Mahler, B.J.; Bennett, P.C.; Zimmerman, M. Lanthanide-labeled clay: A new method for tracing sediment transport in karst. Groundwater 1998, 36, 835–843. [Google Scholar] [CrossRef]
- Field, M.S. The QTRACER2 Program for Tracer-Breakthrough Curve Analysis for Tracer Tests in Karstic Aquifers and Other Hydrologic Systems; US Environmental Protection Agency: Washington, DC, USA, 2002.
- Benischke, R.; Goldscheider, N.; Smart, C. Tracer techniques. In Methods in Karst Hydrogeology; Goldscheider, N., Drew, D., Eds.; Taylor and Francis: London, UK, 2007; pp. 147–170. [Google Scholar]
- Doherty, J. PEST Model Independent Parameter Estimation; User Manual; Watermark Numerical Computing: Brisbane, Australia, 2009. [Google Scholar]
- Maloszewski, P.; Harum, T.; Benischke, R. Mathematical modelling of tracer experiments in the karst of Lurbach system. Steirische Beitraege Hydrogeol. 1992, 43, 116–136. [Google Scholar]
- Coats, K.H.; Smith, B.D. Dead end pore volume and dispersion in porous media. Soc. Pet. Eng. J. 1964, 23, 73–84. [Google Scholar] [CrossRef]
- Mull, D.S.; Liebermann, T.D.; Smoot, J.L.; Woosley, L.H. Application of Dye-Tracing Techniques for Determining Solute-transport Characteristics of Ground Water in Karst Terranes (No. PB-92-231356/XAB; EPA-904/6-88/001); Environmental Protection Agency: Atlanta, GA, USA, 1988.
- Atkinson, T.C.; Smith, D.I.; Lavis, J.J.; Witaker, R.J. Experiments in tracing underground waters in limestones. J. Hydrol. 1973, 19, 323–349. [Google Scholar] [CrossRef]
- Gaspar, E. Modern Trends in Tracer Hydrology; CRC Press: Boca Raton, FL, USA, 1987; Volume II, 137p. [Google Scholar]
- Ford, D.C.; Williams, P.W. Karst Geomorphology and Hydrology; Unwin Hayman: London, UK, 1989. [Google Scholar]
- Milanovic, P.T. Karst Hydrogeology; Water Resources: MI, USA, 1981. [Google Scholar]
- Zhang, C.; Shu, L.; Appiah-Adjei, E.K.; Lobeyo, A.G.A.; Tang, R.; Fan, J. Laboratory simulation of groundwater hydraulic head in a karst aquifer system with conduit and fracture domains. Carbonates Evaporites 2017, 31, 329–337. [Google Scholar] [CrossRef]
- Fetter, C.W. Contaminant Hydrogeology; Prentice Hall: London, UK, 1992. [Google Scholar]
Disclaimer/Publisher’s Note: The statements, opinions and data contained in all publications are solely those of the individual author(s) and contributor(s) and not of MDPI and/or the editor(s). MDPI and/or the editor(s) disclaim responsibility for any injury to people or property resulting from any ideas, methods, instructions or products referred to in the content. |
© 2024 by the authors. Licensee MDPI, Basel, Switzerland. This article is an open access article distributed under the terms and conditions of the Creative Commons Attribution (CC BY) license (https://creativecommons.org/licenses/by/4.0/).