Abstract
Under the dual pressures of rapid urbanization and intensifying global climate change, China has proposed governance policies aimed at promoting ecological urban construction. Wetland landscapes play a key role in sustaining human and social well-being. As a significant city in the middle reaches of the Yangtze River, Wuhan’s wetland resources play an irreplaceable role in maintaining the regional ecological balance and promoting sustainable economic and social development. However, urbanization poses a severe challenge to the ecological service functions of wetlands. Consequently, in this study, we analyzed the spatial–temporal evolution patterns of the sub-functional systems of carbon sequestration, biodiversity conservation, water yield, and water purification in five wetland types in Wuhan City from 2000 to 2020 by using the CASA model and InVEST model. Then, a wetland multi-functional assessment framework was constructed to quantify the comprehensive multi-function score. It is imperative to unravel the underlying mechanisms driving the changes in wetland functions and to explore the equilibrium point between wetland conservation and urban sustainable development. Our results show that the wetland area of Wuhan City decreased from 5077.33 km2 in 2000 to 4696.60 km2 in 2020, and the wetland multi-functions exhibited significant spatial heterogeneity from 2000 to 2020. Wetland carbon sequestration increased from 0.94 Tg in 2000 to 1.11 Tg in 2020. The wetland habitat quality declined from 0.13 in 2000 to 0.11 in 2020. The water production of the wetlands increased from 5.43 × 10⁹ t in 2000 to 22.59 × 10⁹ t in 2020. The wetland N loss decreased from 55,850.58 t in 2000 to 49,209.93 t in 2020. The highest multi-function score was in paddy fields, which increased from 0.41 ± 0.12 to 0.51 ± 0.12, followed by tidal flats, which increased from 0.39 ± 0.14 to 0.50 ± 0.16, and the lowest was rivers, which also increased from 0.33 ± 0.12 to 0.41 ± 0.14. The multi-function score was closely related to the wetland type and urban development direction over the past two decades, and it was negatively correlated with production and living density, providing new ideas for wetland ecological protection and construction in Wuhan City.
1. Introduction
The Ramsar Convention promulgated in 1971 defines wetlands as ‘natural or artificial, stationary or flowing, freshwater or slightly brackish water bodies, as well as swamps, peatlands, etc.’ [1]. However, definitions and clarifications of wetlands are an ongoing controversy within the scientific community due to their complexity and interdisciplinary nature. In ecology, wetlands are regarded as independent and complete ecosystems because they encompass both aquatic and terrestrial environmental characteristics. Wetland biodiversity is very high [2], and many species can only survive and reproduce in this specific ecosystem. Meanwhile, the International Biological Program pays more attention to the interactions between water, land, and plants [3]. The main divergence in defining wetlands lies in the criteria for wetland boundaries [4] and the Chinese national standard for wetland classification (GB24708-2009-T) [5] drafted by the Survey and Design Institute of the State Forestry Administration of China in 2010. Therefore, it is key to specify wetland classifications and acquire wetland maps via remote sensing, which is fundamental to the study of wetlands.
Wetlands demonstrate not only terrestrial and aquatic characteristics but also have some unique traits, such as special water bodies, flora and fauna, and soil properties. Relevant studies [6] have suggested that wetlands provide many important ecosystem services, such as balancing water quantity [7], purifying water and air quality [8], regulating the microclimate, and maintaining ecological balance and biodiversity [9]. The multi-functions of wetlands are, in fact, a human assessment closely linked to decisions about land use [10]. In 2000, the concept of a ‘multi-functional landscape’ was first introduced at the International Seminar on Multi-functional Landscape, aimed not only at ecological functions but also encompassing social, historical, economic, and cultural functionalities. Multi-functions in ecological research encompass various aspects, such as the clarification of concepts, the evaluation of algorithms, the selection of indicators, and spatial-planning strategies. Naveh explicitly emphasized the complex system of interdisciplinary intersections in multi-functional landscapes [11]. Subsequently, Chinese scholars followed this and mainly focused on agriculture and rural areas [12,13]. In 2021, Mao et al. conducted a study on urban multi-functional landscape spatial planning, adopting a landscape ecology framework, with a particular emphasis on the significance of human perceptions in shaping and influencing the planning process [14]. In 2023, Zhang et al. integrated urban hydraulic heritage with multi-functional landscape planning, fostering a holistic approach to the development of heritage culture and ecological sustainability [15]. This integrated approach has garnered increased attention toward urban water systems, emphasizing their crucial role in balancing cultural preservation with environmental resilience. However, under the current context of ecological research, given the complexity of wetland multi-functionality, we still lack a systematic evaluation framework that comprehensively considers the trade-offs among various functions, such as carbon sequestration, biodiversity conservation, water yield, and water purification, and that comprehensively reflects the multi-functional potential of wetlands [16]. Therefore, it is essential to construct a multi-functional assessment framework for wetlands that, through analyzing the spatio-temporal evolution patterns of landscape multi-functionality and exploring the constraining factors in the process of wetland ecological restoration, aims to quantify the multi-functional potential of wetlands, provide a protection management policy basis for planners, and, ultimately, promote the sustainable development of wetlands.
As a major city in central China, Wuhan is known as the ‘city of a thousand lakes’ and the ‘river city’. Its wetland area reached 4696.60 km2 in 2020, accounting for approximately 54.81% of the city’s total area. Wuhan’s wetland types are diverse, including the largest river in Asia, the Yangtze River; the eighth largest freshwater lake in China, Liangzi Lake; and the internationally important wetland, the Chen Lake wetland [17]. These wetlands have a high level of species diversity and are also major migration and habitat areas for birds. There are more than 1100 species of various animals and plants, including more than 20 species of national key protected wild animals. However, the acceleration of urbanization has severely threatened the ecological functions of wetlands [18,19]. Subsequently, an ecological urban water construction project has been actively promoted in Wuhan City, aiming to improve its ecological water network [20]. The 14th Meeting of the Conference of the Contracting Parties to the Ramsar Convention on Wetlands (COP14) was held in Wuhan in 2022 with the aim of jointly discussing the importance of wetland protection and development [21]. Therefore, it is key to assess the wetland multi-functions to optimize the wetland ecological security pattern for Wuhan City. Here, we analyzed the spatio-temporal changes of different wetland types in Wuhan City from 2000 to 2020 and then analyzed four ecosystem function changes. Moreover, we constructed a multi-function assessment framework to evaluate the multi-function score of wetlands over the past two decades to verify the positive environmental effects of wetlands. The specific goals are (1) revealing Wuhan’s wetland landscape dynamics over the past 20 years, (2) constructing a multi-functional assessment framework for wetland landscape and verifying by Wuhan wetlands, (3) identifying and quantifying the threats to wetlands posed by natural factors and human impacts, and (4) demonstrating the compensatory benefits of multi-function wetland landscapes to ecological damage in urban development. Our findings show that the wetland multi-function could help to formulate scientific measures to improve the environmental quality of wetlands, promote wetland biodiversity, achieve the practice of policies, and guide the comprehensive planning of Wuhan’s wetlands.
2. Materials and Methods
Wuhan City is the capital of Hubei Province, located in the eastern part of Hubei Province, and is a city at the confluence of the middle reaches of the Yangtze River and the Han River (Figure 1). Geographically, it is situated between 113°41′ to 115°05′ East longitude and 29°58′ to 31°22′ North latitude. The total land area of the city is 8467.11 km2. In terms of administrative divisions, Wuhan City governs 13 central urban areas and new urban areas, which include 7 central urban areas, such as Jiang’an District, Jianghan District, Wuchang District, Qiaokou District, Hanyang District, Qingshan District, and Hongshan District, as well as 6 new urban areas, including Dongxihu District, Hannan District, Caidian District, Jiangxia District, Huangpi District, and Xinzhou District. On the natural ecological front, Wuhan is home to many rivers and lakes. The richness of its wetland resources plays a significant role in maintaining ecological balance, enhancing the stability of the ecosystem, protecting biodiversity, and increasing the scenic value in the region. These functions effectively promote the development of the regional economy [22].
Figure 1.
The location of the study area and research framework.
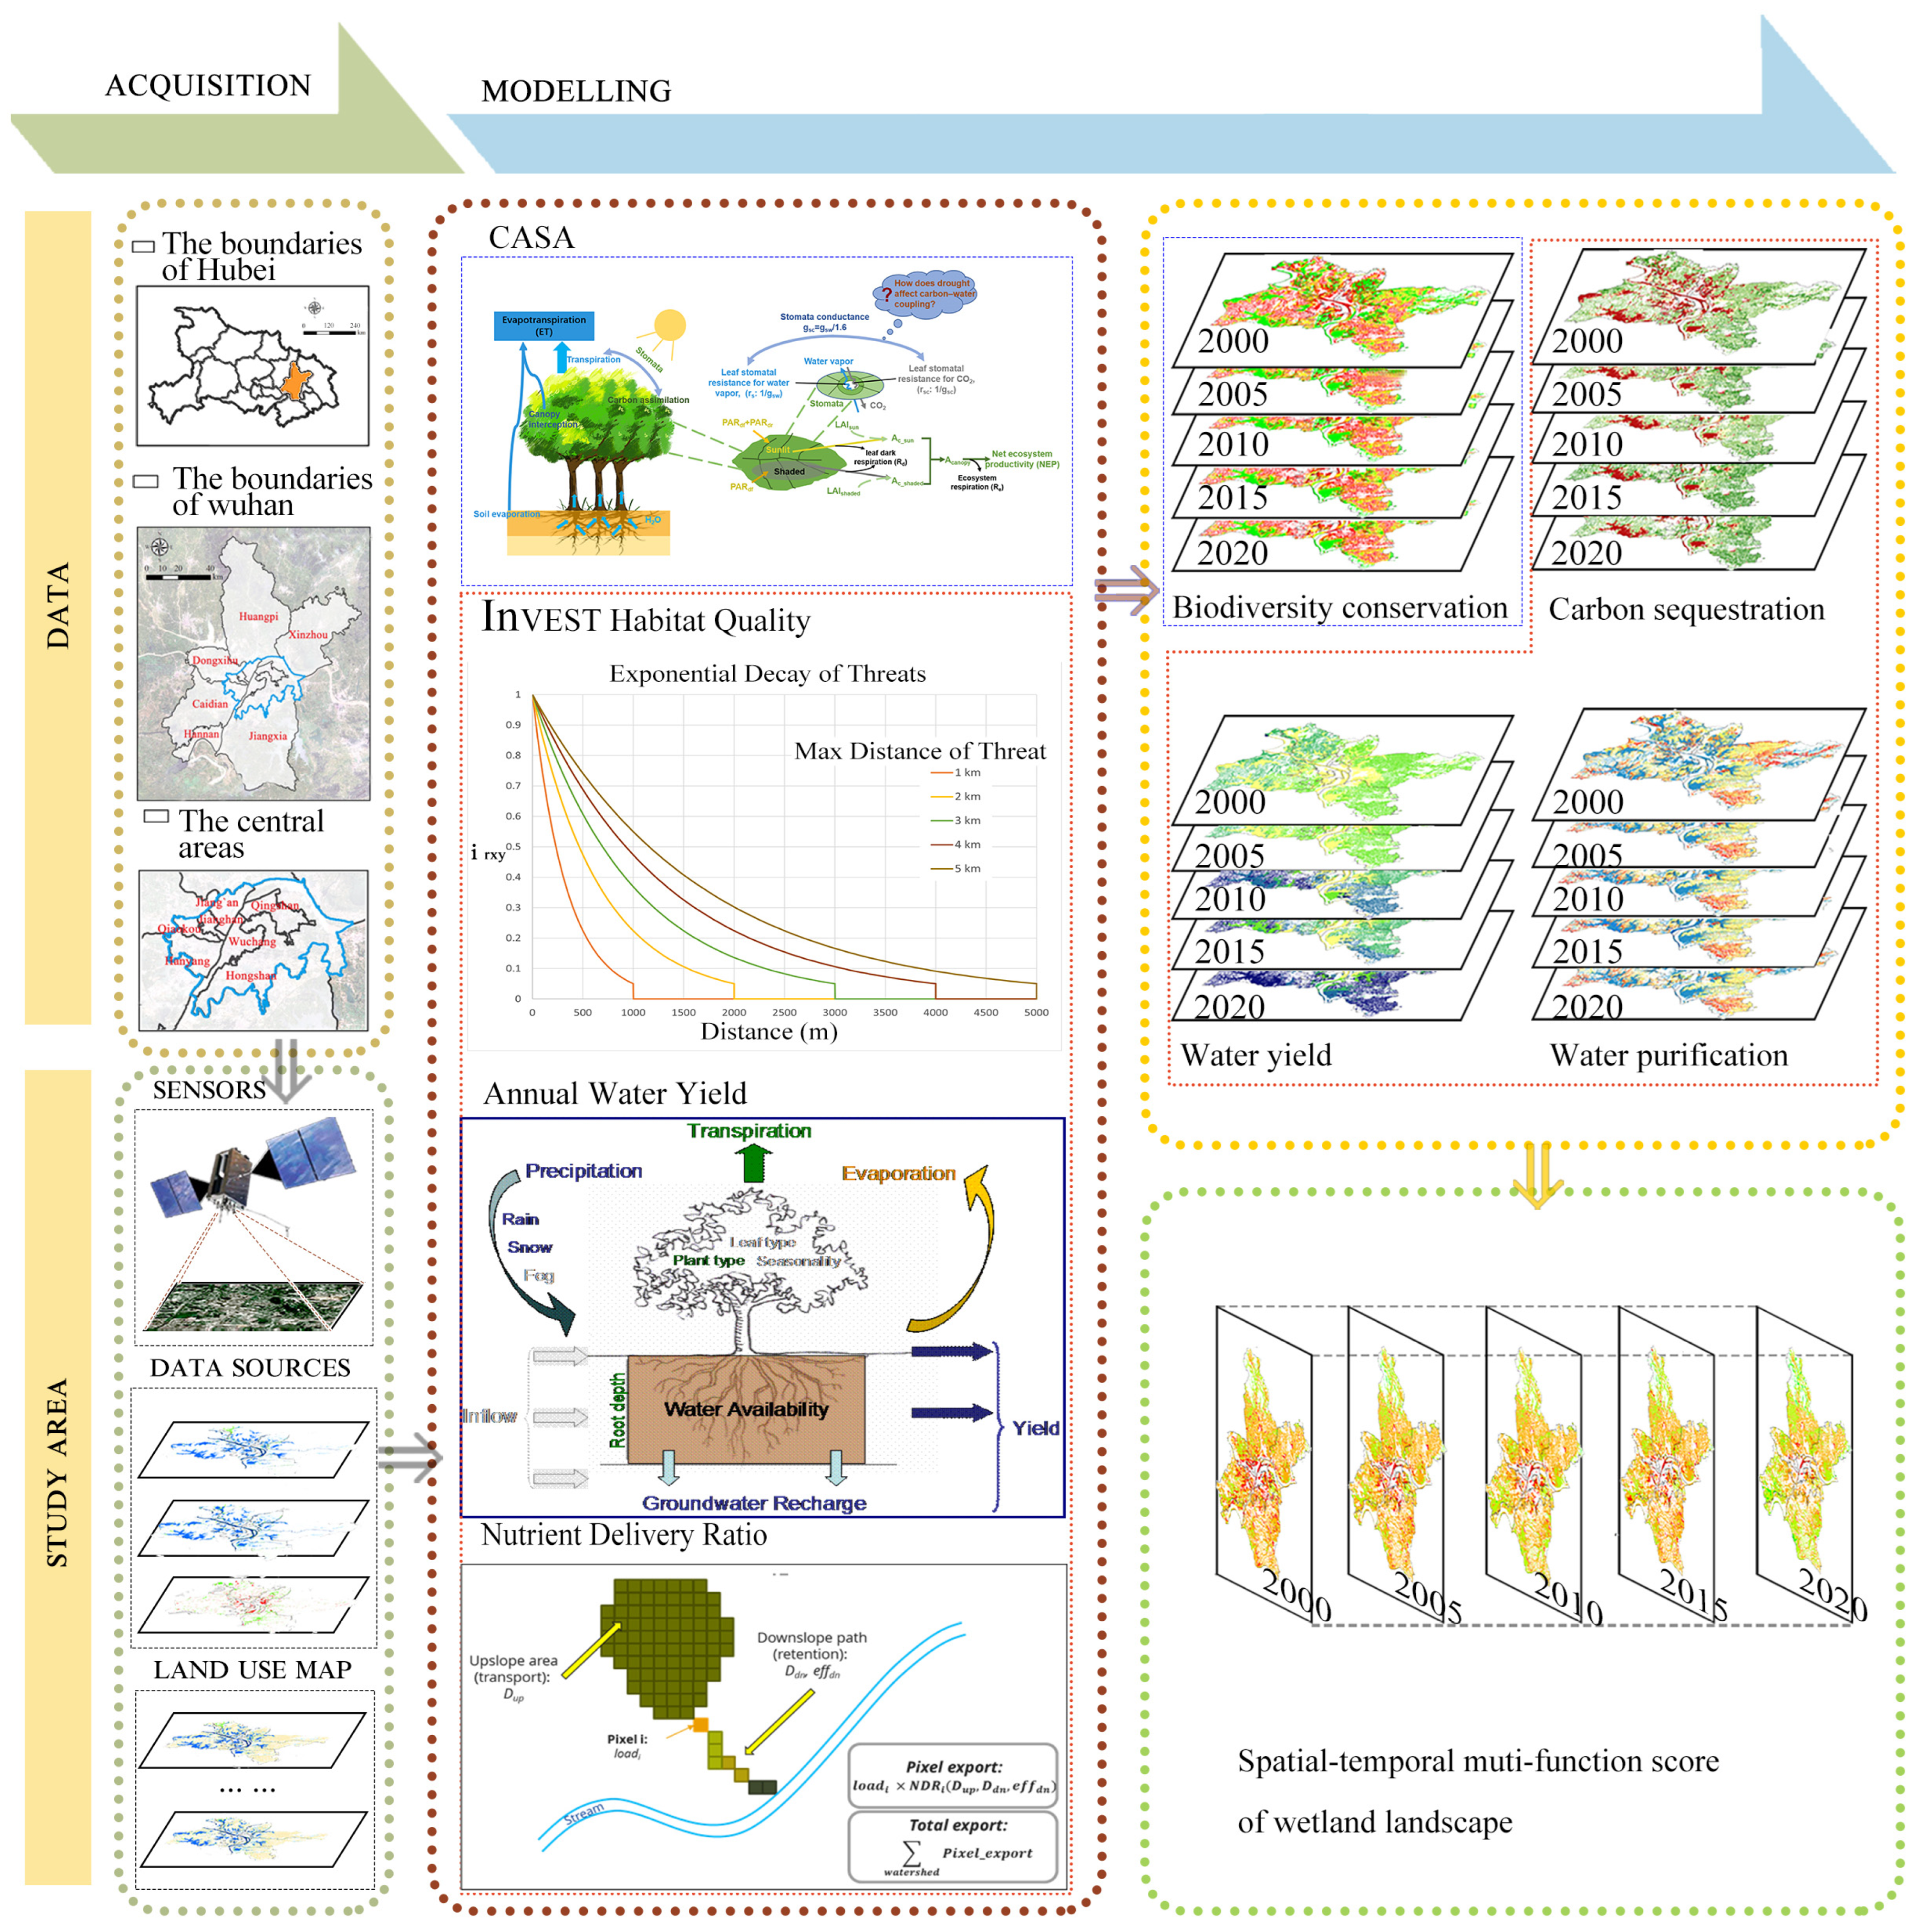
2.1. Data and Research Framework
In the past 20 years, Wuhan has generated a variety of urban diseases due to the pressure of rapid urbanization, which has a great impact on the wetland system [23]. We obtained land use maps with 30 m resolution, which cover five-year periods centered on 2000, 2005, 2010, 2015, and 2020, and the monthly mean temperature and precipitation data with a 1 km resolution from Resource and Environment Science and Data Center (https://www.resdc.cn/, accessed on 13 May 2023). The monthly total radiation maps in 2000, 2005, 2010, 2015, and 2020 were estimated by interpolating the observations of meteorological stations (http://data.cma.cn, accessed on 13 May 2023). The DEM data were sourced from ASTER Global Digital Elevation Model V002 (http://www.gscloud.cn/, accessed on 13 May 2023). Soil maps with 30 arc-second resolution were acquired from the Cold and Arid Regions Sciences Data Center at Lanzhou (http://westdc.westgis.ac.cn/, accessed on 15 May 2023). The monthly NDVI data with 1 km resolution were obtained from MODIS-NDVI products (MOD13Q1) (http://modis.gsfc.nasa.gov/, accessed on 15 May 2023).
2.2. Wetland Landscape Classification
The wetland landscapes were divided into paddy fields, rivers, lakes, pools, and tidal flats (Table 1).
Table 1.
Classification and definition of wetland types.
In this study, we selected the net total area of change, the annual area of change, the annual rate of change and dynamic degree to quantify the wetland change, as well as the annual rate of change using Equation (1).
where reflects the annual area change rate of i-th wetland. is the area of i-th wetland at the start of monitoring (km2), (km2) is the changed area of from the j-th land type to the i-th wetland (km2), and t is the period (year).
2.3. Ecological Model and Function Assessment
2.3.1. Carbon Sequestration Assessment
In this study, the CASA model was utilized to calculate the carbon dynamics at the regional scale [24]. Absorbed photosynthetic active solar radiation (APAR) and light-use efficiency (ε) were two important parameters for the model to calculate Net Primary Production (NPP). The APAR follows Equation (2):
where SOL is the total solar radiation. t is time, while x is the spatial location. FPAR (see Equation (3)) is the fraction of the photosynthetically active radiation absorbed by vegetation canopy, which is calculated by FPAR(x, t)NDVI (see Equation (4)) and FPAR(x, t)SR (see Equation (5)):
In this study, FPARmax and FPARmin are the maximum (i.e., 0.950) and minimum (i.e., 0.001) values of FPAR. NDVIi,min and NDVIi,max are the minimum and maximum values of the NDVI, and are set as 0.7994 and 0.0765 for all wetlands.
SR(x, t) is the simple ratio of NDVI in x pixel and t month (Equation (6)).
SRi,max and SRi,min are the maximum and minimum values of the SR, 8.970 and 1.166 for all wetlands.
ε is the light use efficiency, which indicates the efficiency of plant to transfer absorbed photosynthetic effective solar radiation into organic carbon (Equation (7)):
where Tɛ1(x, t) and Tɛ2(x, t) indicate the reduction in light-use efficiency caused by the temperature factor; Wɛ(x, t) reflects the reduction in light-use efficiency created by the moisture factor. Meanwhile, εmax is the maximum light-use efficiency, 0.542.
2.3.2. Biodiversity Conservation Assessment
The InVEST model is an advanced tool for the quantitative evaluation of biodiversity, employing a continuum of habitat quality indices that reflect the ecological conditions necessary for species sustenance, reproduction, and stability. The model offers a nuanced appraisal of landscape integrity and degradation categorized as low, medium, and high. The InVEST model initially used a binary approach to habitat land use correlation, later refined by a continuous scoring system from 0 to 1 that more accurately differentiates habitat quality among various land uses (habitat quality score in Table 2). This scoring is positively correlated with habitat suitability and is determined by the interplay of threat impacts, habitat–threat proximity, legal protection status, and the habitat’s sensitivity to threats, culminating as important assessment for biodiversity conservation.
Table 2.
Habitat quality scores and the responses to threat factors of land use types.
Each threat has a different destructive potential in farmland and built-up lands. These threats damage habitat quality by different weights to reflect the relative impact of the threats. In accordance with related studies [25], the weights range from 0 to 1, the higher score indicating stronger destructiveness of threats (Table 2).
Meanwhile, the distance decay functions is influenced by the distance of threat factor distance (Table 3).
Table 3.
Threat factors of habitat quality and their attributes.
2.3.3. Water Yield Assessment
The water yield was quantified the InVEST model. Annual water yield was estimated by the Budko curve and annual average precipitation [26] (see Equation (8)).
where Yxj is the water yield in x pixel for the land-use type of j; AETxj refers to the actual evapotranspiration, and Px is the annual average precipitation in x pixel. The evapotranspiration partition was calculated following Equation (9):
where ωx (see Equation (10)) is the plant’s available water coefficient in x pixel; Rxj (see Equation (11)) is the dimensionless Budyko Dryness index of the cell.
where Z is a hydro-geological parameter, which can characterize the seasonal rainfall distribution on basin, ranging from 1 to 30. AWCx is the plant-available water content. kxj refers to the plant evapotranspiration in x pixel for land-use type of j. ET0x is the reference evapotranspiration in x pixel (see Equation (12)).
where Ra represents the extraterrestrial radiation; Tmin and Tmax refer to the daily minimum and maximum temperatures, respectively.
2.3.4. Water Purification Assessment
We used the NDR module of the InVEST model to estimate the N loss rate, which is a negative indicator of water purification. The model could describe the movement of nutrients in space [27]. Specifically, nutrient sources across the landscape are derived from land-use-change-specific nutrient loading rates and are primarily based on empirical data. It simulates the N flow across the grid cells in the simulation domain according to the mass balance equation, and the nutrient loads and nutrient transport were estimated, where nutrient load indicates the source of nutrients across the landscape by the land use map and associated loading rates. In contrast, nutrient transport is calculated as a factor for belonging to the same flow path [28]. In this paper, pixel-scale N loss is characterized by the nutrient load and the nutrient delivery ratio (Equation (13)), and N loss at the watershed scale is the sum of pixel-scale N losses (Equation (14)).
where Npixel and Nwatershed are the nitrogen loss (kg/year) at the pixel and watershed scale. The loadi is the N load (kg/year) for the i-th pixel. The NDRi is the nutrient delivery ratio of N for the i-th pixel and is a function decided by the upslope area parameter (Dup), the downslope flow path parameter (Ddn), and the retention efficiency of the land use type on the downslope flow path (effdn).
The NDR model necessitates several types of input data, comprising Digital Elevation Models (DEM), land utilization information, raster data as a proxy for nutrient runoff, and watershed boundary data in vector format. Although the statical data include DEM and watershed boundary, the precipitation data varied between 2000 and 2020. In addition, a biophysical table and some parameters are critical for the input of the model [29].
2.4. Multi-Function Assessment
Firstly, we use Equation (15) to modify three positive indicators (NPP, habitat quality and water yield), and use Equation (16) to modify the negative indicator (N loss).
where is the modified score of the i-th pixel and is between 0 and 1. is the ecological function value of the i-th pixel, and and are the maximal and minimal values of the wetland’s ecological function in Wuhan City (Equation (17)).
where Mf is the multi-function score, is the modified score of the j-th ecological function, and the is the weight of the j-th ecological function. The weight determined by the entropy method is 0.3, 0.3, 0.2, and 0.2 for carbon sequestration, biodiversity conservation, water yield, and water purification.
3. Results
3.1. Spatial and Temporal Changes of Wetland Landscapes from 2000 to 2020
From 2000 to 2020, the wetland area of Wuhan City continued to decrease (from 5077.33 km2 to 4696.60 km2), with a growth rate of−0.37%, and the fastest shrinking in 2005–2010, reduced by 127.79 km2. Wetlands were mainly occupied by paddy fields in Wuhan City, more than 63% (Table 4), followed by lakes, 17%. Tidal flats had the lowest growth rate, only 4%. Although the paddy field growth rate has always been high, it decreased from 3346.95 km2 in 2000 to 2890.86 km2 in 2020, with a rate of decrease of −0.68% per year. Lakes also decreased in area from 904.37 km2 to 814.69 km2. On the other hand, the area of pools, rivers, and tidal flats increased gradually. Pools had the largest growth rate of 1.19% per year.
Table 4.
The wetland areas (km2) and area change (%/yr) in Wuhan City, China.
Wetlands of Wuhan City are mainly distributed in the new urban areas far away from both sides of the Yangtze river, and they are mainly a paddy field. Wetlands are mainly distributed in the southern and eastern regions, and Hongshan District has many paddy fields and lakes. Overall, the wetland area of Wuhan City decreased from 2000 to 2020. The reduction is most obvious at the junction of the central areas and the new urban areas, mainly paddy fields. Meanwhile, wetlands increased in the new urban areas, and the central areas of Hongshan District also increased significantly (Figure 2).
Figure 2.
The wetland landscape maps.
3.2. Assessment of Four Ecological Functions
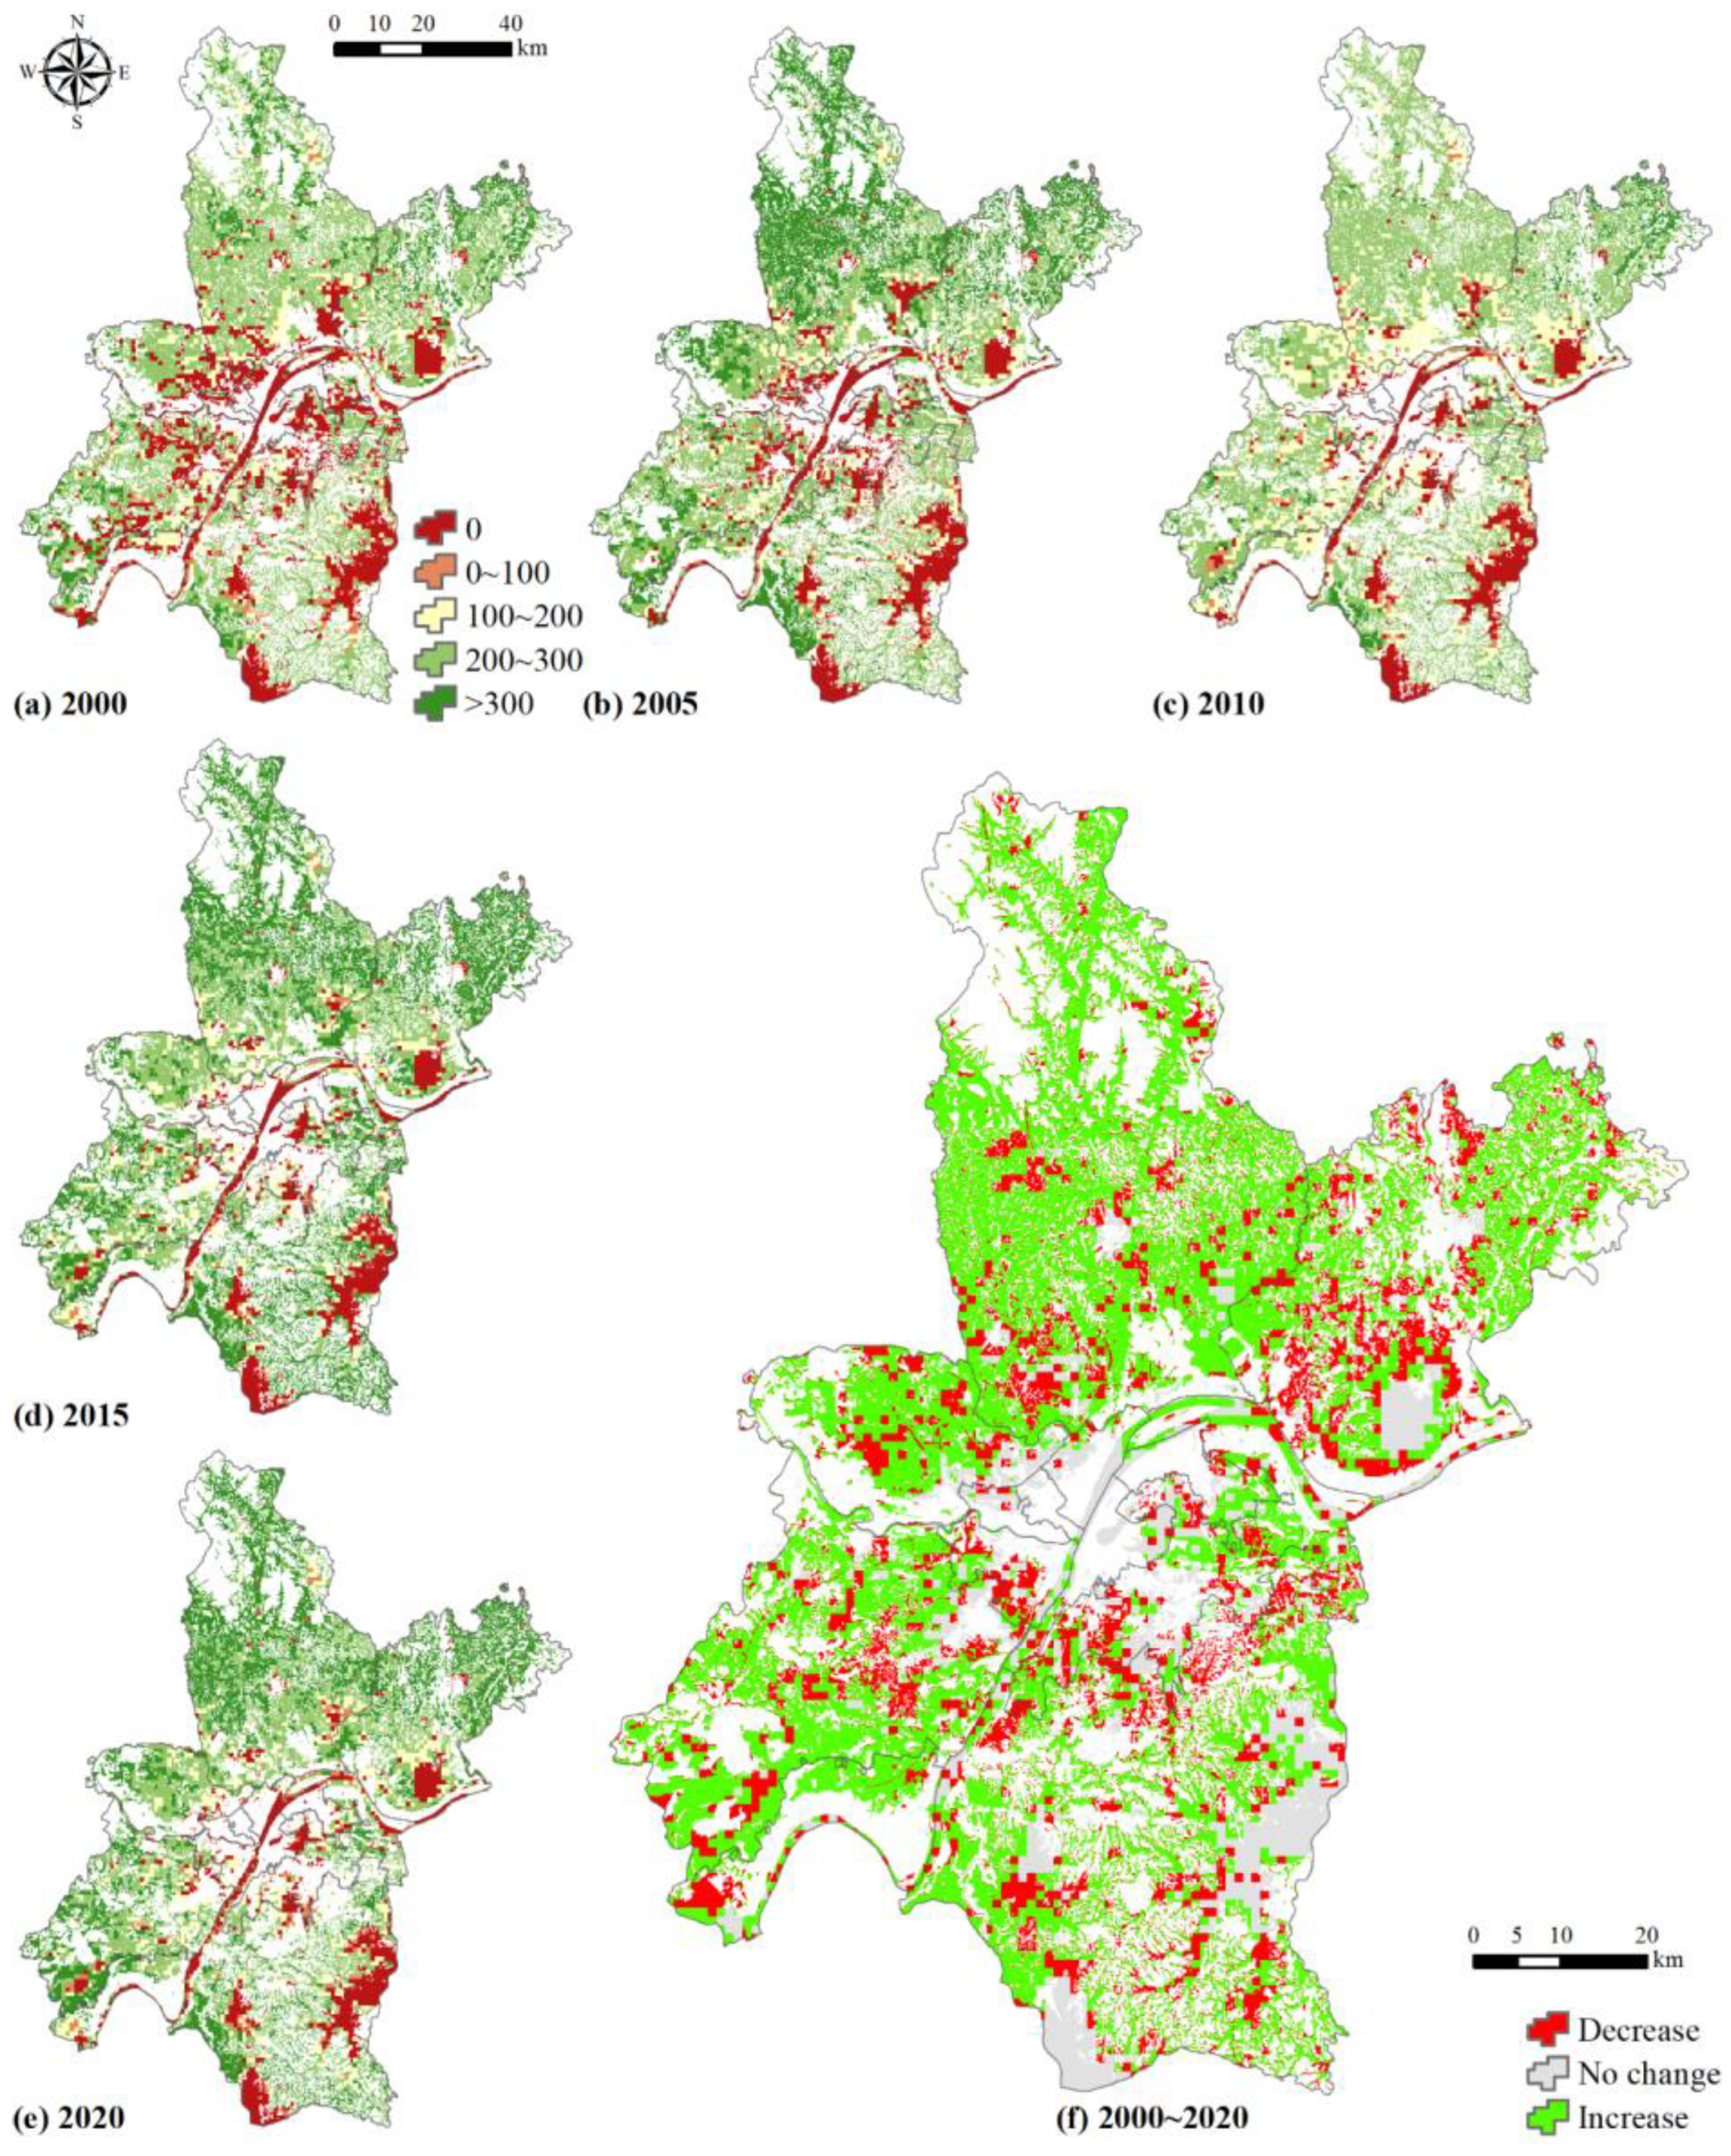
3.2.1. Carbon Sequestration
The mean NPP of wetlands increased over the past 20 years (Table 5). The annual carbon sequestration of wetlands increased from 0.94 Tg in 2000 to 1.11 Tg in 2020. Specifically, paddy fields have the highest NPP and increased from 226.48 ± 100.82 g/m2 in 2000 to 283.61 ± 76.89 g/m2 in 2020. There are no significant differences in the NPP of pools and tidal flats. The NPP of pools increased from 155.54 ± 107.43 g/m2 to 230.61 ± 86.03 g/m2, while the NPP of tidal flats increased from 160.47 ± 129.27 g/m2 to 220.71 ± 112.91 g/m2. The NPP of lakes was the smallest, 112.17 ± 115.91 g/m2 in 2020.
Table 5.
The NPP (g/m2) of different wetland landscapes from 2000 to 2020.
Higher NPPs are mainly located in the new urban areas (Figure 3), especially in the southern parts of Huangpi, Caidian, and Xinzhou Districts, where the NPPs in these areas exceed 300 g/m2, with the main wetland type being paddy fields. The NPP is relatively low in the central wetlands, at about 100 g/m2. In addition, the NPP of rivers and lakes is extremely low, even approaching 0 g/m2, such as in the Yangtze River, East Lake, South Lake, and Tangxun Lake. Over the past 20 years, the NPP decreased significantly in the central areas, which are mainly lakes. Meanwhile, the NPP increased in the north west, where the area is mainly paddy fields.
Figure 3.
The NPP (g/m2 yr) of wetland landscape.
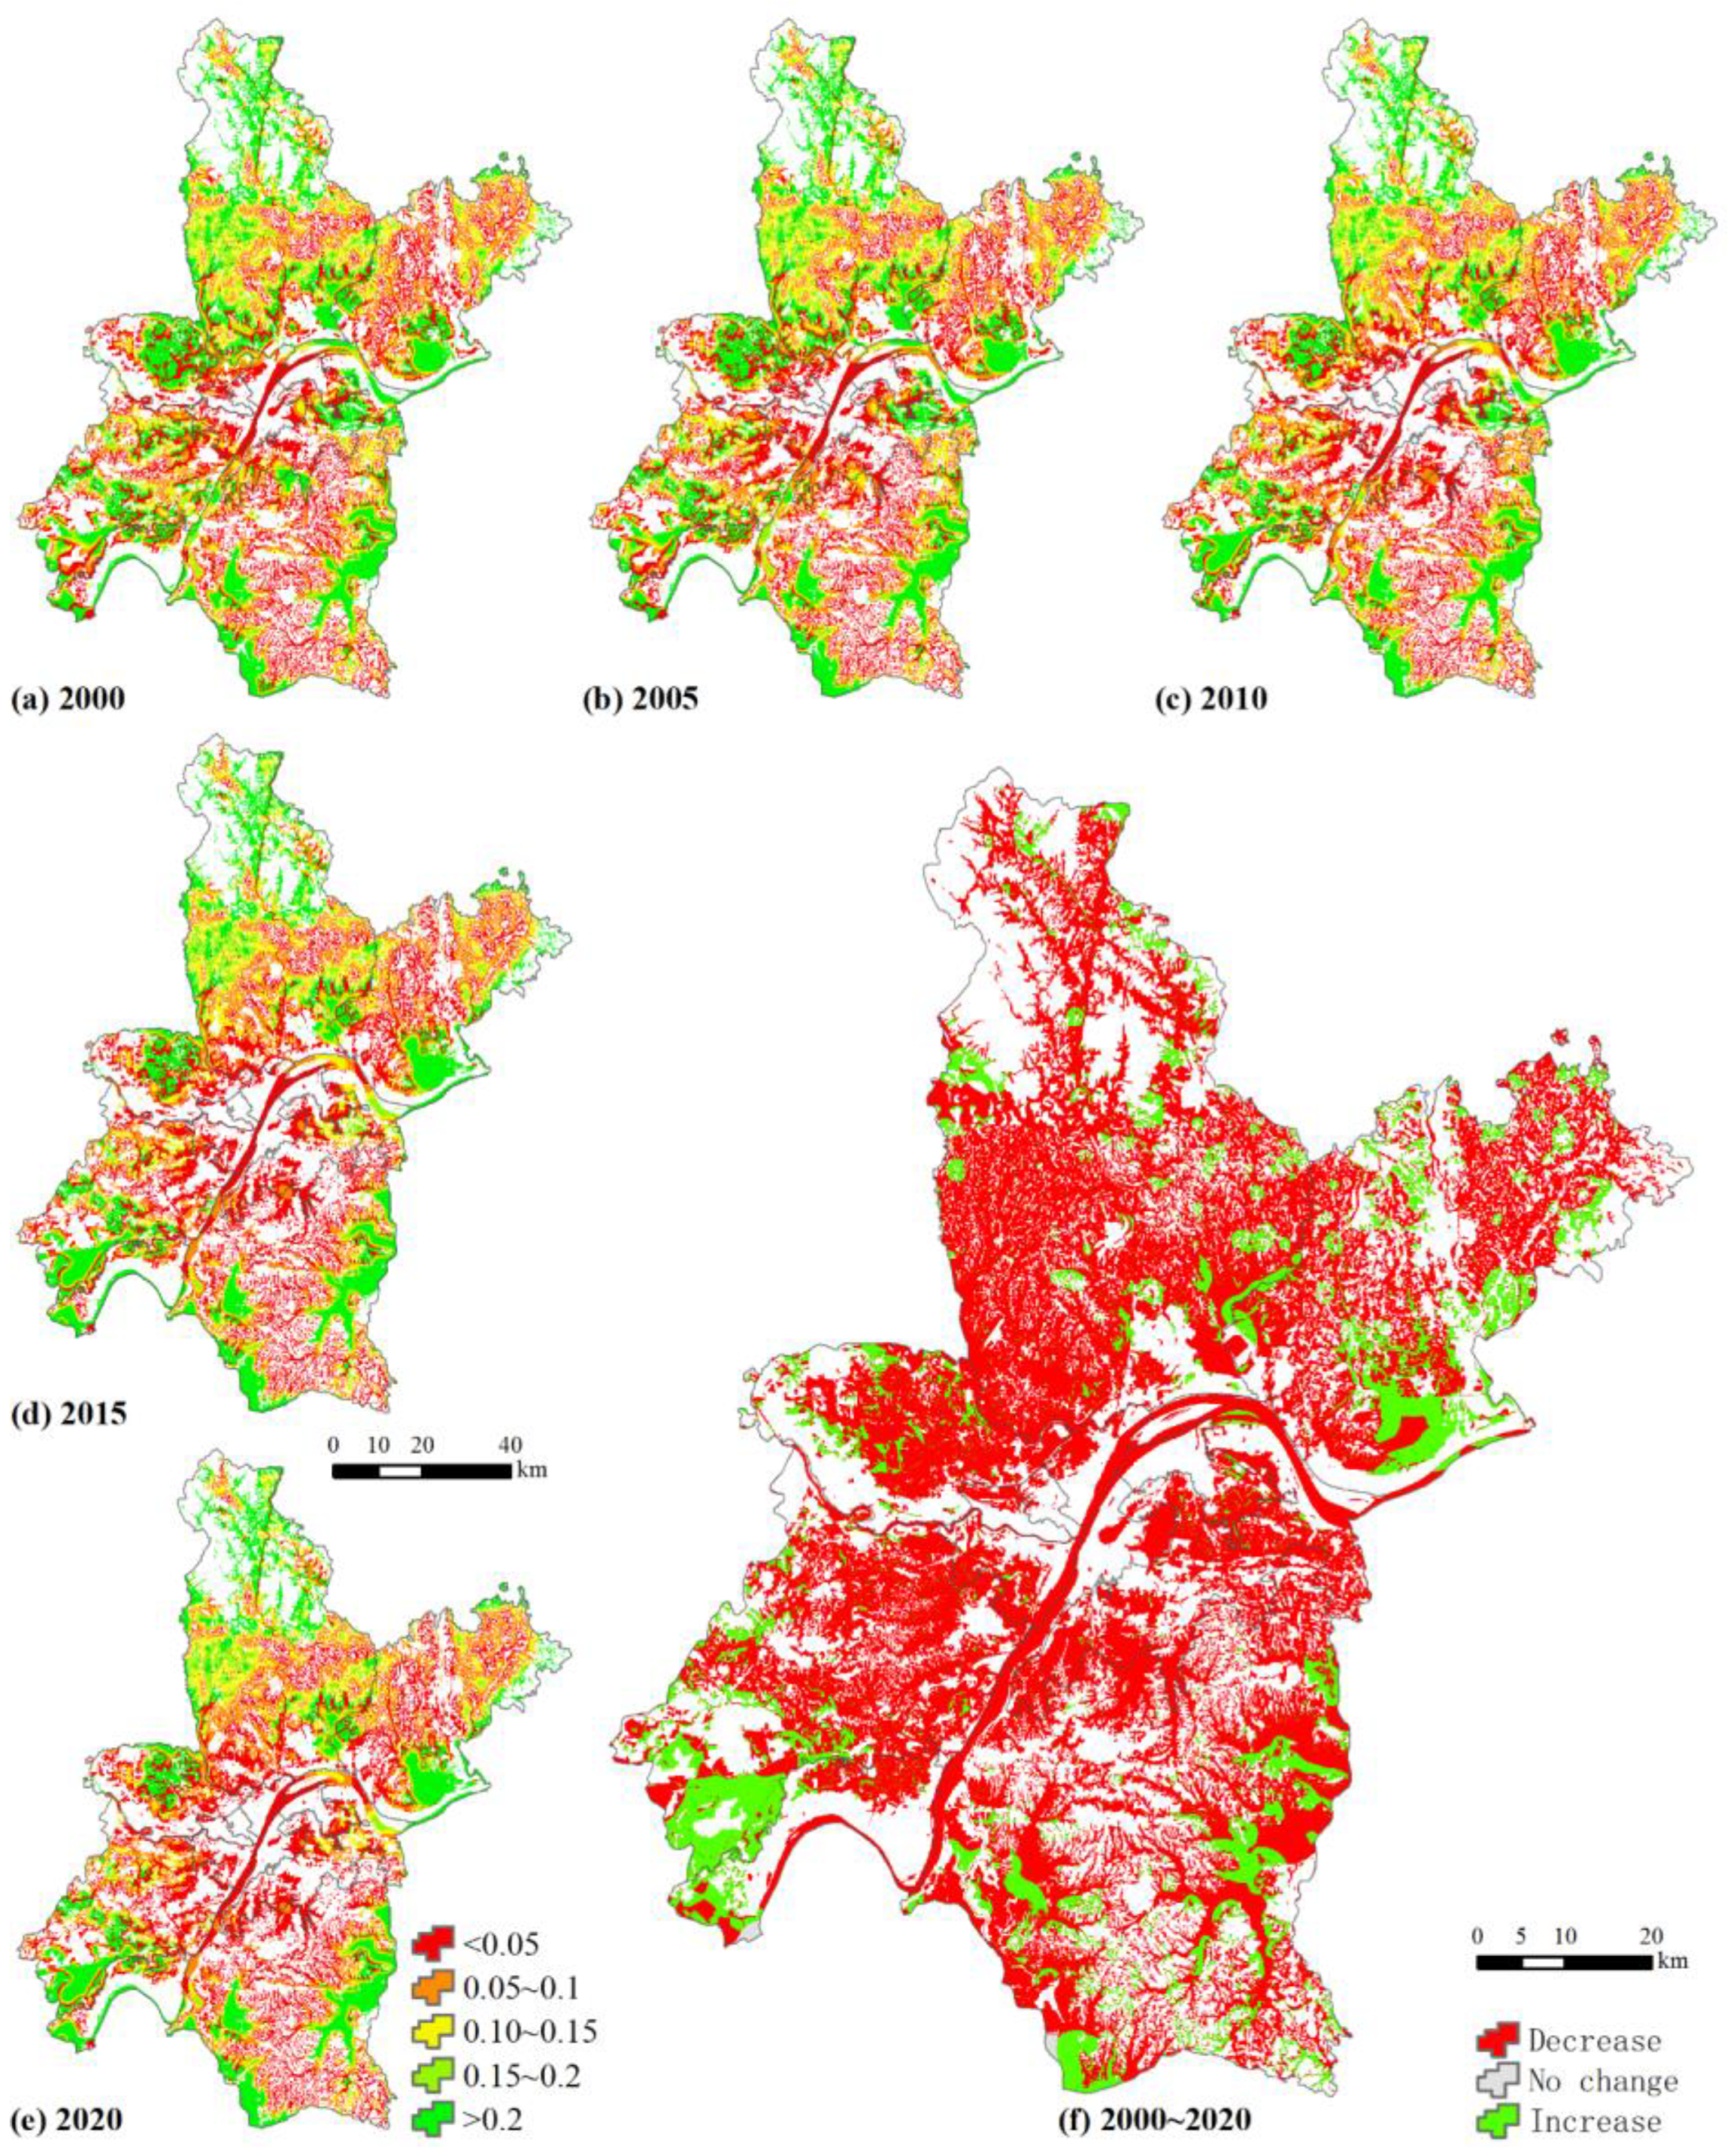
3.2.2. Biodiversity Conservation
The habitat quality of wetlands declined from 0.13 ± 0.09 in 2000 to 0.11 ± 0.09 in 2020 (Table 6). The habitat quality is higher in lakes, paddy fields, and tidal flats among these wetland landscapes. The river’s habitat quality is the lowest. Overall, all water body types are in the same range of change, with the exception of rivers, where it was a bit more different in 2020 (decreased from 0.12 ± 0.10 to 0.07 ± 0.09). Meanwhile, the habitat quality of paddy fields also decreased from 0.13 ± 0.09 to 0.11 ± 0.09.
Table 6.
The habitat quality score of different wetland landscapes from 2000 to 2020.
Higher habitat quality is mainly concentrated in the new urban areas, including the northern and southeastern parts of Huangpi District and the southern parts of Jiangxia and Caidian Districts. The habitat quality is greater than 0.2 in these areas, which are mainly lakes, pools, and tidal flats. This reflects the fact that after ecological management, the role of plant water conservation has affected the water yield in these areas, and the ecological environment has been rebuilt. The habitat quality of central wetlands is relatively low, around 0.05. The habitat quality of wetlands in Wuhan City has significantly decreased from 2000 to 2020, spreading from the central areas to the surrounding areas. However, the spatial and temporal changes in habitat quality are not significant for the wetlands in Wuhan City (Figure 4).
Figure 4.
Habitat quality score of wetland landscape.
3.2.3. Water Yield
Although there was a significant decline in 2015, overall annual water production increased from 5.43 × 10⁹ t in 2000 to 22.59 × 10⁹ t in 2020. The mean water yield of wetlands increased from 1.07 ± 0.89 t/m2 in 2000 to 4.81 ± 1.80 t/m2 in 2020. In particular, the water yield of paddy fields is the largest and increased from 162.41 ± 52.11 t/m2 in 2000 to 560.23 ± 137.35 t/m2 in 2020. The rate of increase in water yield is largest for lakes, which increased from 0.00 t/m2 in 2000 to 414.10 ± 163.46 t/m2 in 2020. The water yield of rivers was the lowest in 2020, only 275.40 ± 163.09 t/m2 (Table 7).
Table 7.
The water yield (t/m2) of different wetland landscapes from 2000 to 2020.
The water yield improved significantly in Wuhan City, especially in the new urban areas (Figure 5). The water yield in the eastern and southern regions (Caidian, Jiangxia, Xinzhou) fluctuated around 2010, and water production exceeded 400 t/m2 in most regions, mainly paddy fields, pools, and lakes. This may be related to the dramatic increase in population that changes the urban pattern, and the road splits the wetland and makes it broken. The large-scale reduction in vegetation has caused a loss in the ability to conserve water, resulting in soil erosion [30,31]. At the same time, the regions with water yield decline are concentrated in the central areas, mainly paddy fields. And the water yield is relatively low in the central areas, around 100 t/m2.
Figure 5.
The water yield (t/m2) of wetland landscape.
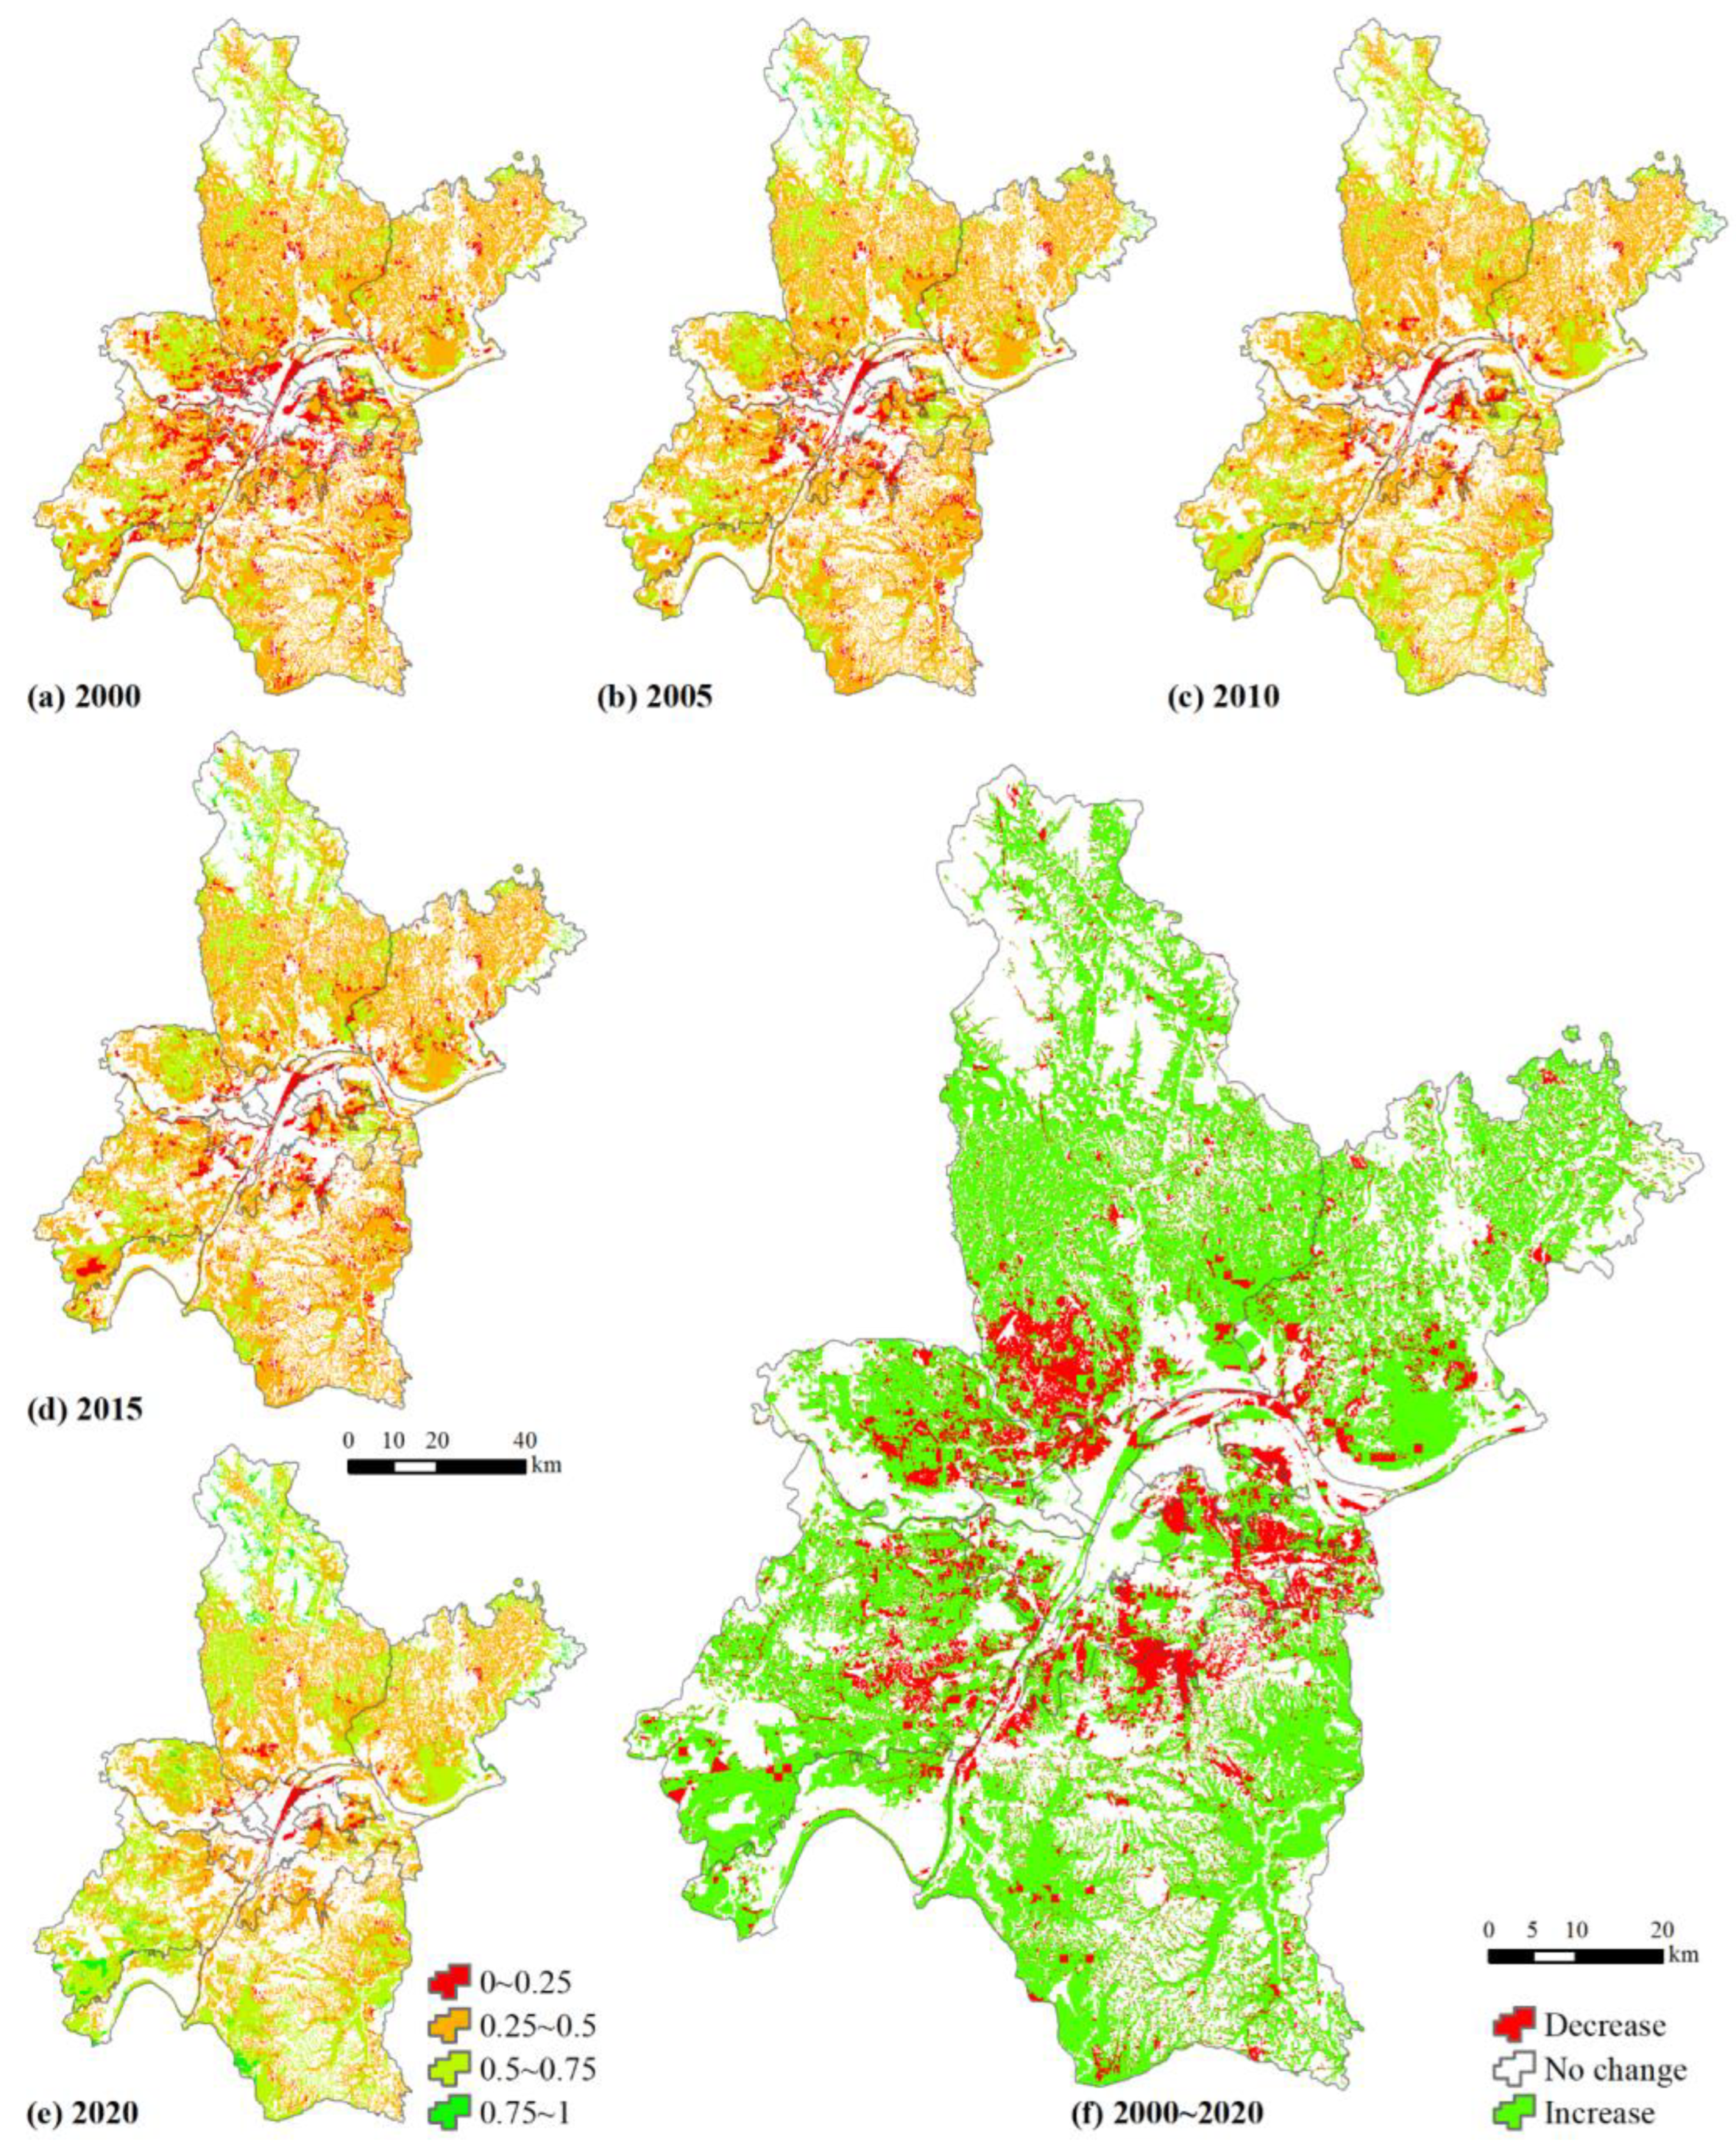
3.2.4. Water Purification
The N loss of wetlands decreased from 55,850.58 t in 2000 to 49,209.93 t in 2020. The N loss rate of wetlands decreased from 110.00 ± 80.11 kg/ha in 2000 to 104.78 ± 80.44 kg/ha in 2020 (Table 8), indicating that water purification improved significantly. The N loss rate is the largest for paddy fields among wetland landscapes, reaching 145.00 ± 65.56 kg/ha in 2020, representing that paddy fields are weak in terms of water purification. Meanwhile, the N loss rate is the smallest for lakes, only 31.78 ± 45.33 kg/ha in 2020. Moreover, N loss of tidal flats has increased from 31.78 ± 48.44 kg/ha in 2000 to 40.00 ± 57.11 kg/ha in 2020, indicating that water purification of tidal flats degraded during 2000–2020.
Table 8.
The N loss (kg/ha) of different wetland landscapes from 2000 to 2020.
High N loss occurs in the new urban areas that are far from the city center (such as Huangpi and Xinzhouin Districts), and the N loss rate exceeds 2.0 kg/ha in these areas, mainly paddy fields. N loss changes are clearly diagonally distributed from 2000 to 2020. N loss increased in the east and south lakes and decreased in the west and north paddy fields (Figure 6).
Figure 6.
The N loss rate (kg/ha) of wetland landscape.
3.3. Spatial–Temporal Multi-Function Score of Wetland Landscape
The multi-function score of wetlands in Wuhan City improved from 0.39 ± 0.13 in 2000 to 0.49 ± 0.13 in 2020 (Table 9). Specifically, the multi-function score of the paddy field is the highest and increased from 0.41 ± 0.12 in 2000 to 0.51 ± 0.12 in 2020, and the paddy field is strong in terms of carbon sequestration and water yield but weak in water purification. The multi-function score of tidal flats also has a faster growth rate and increased from 0.39 ± 0.14 in 2000 to 0.50 ± 0.16 in 2020. It is more advanced and stable in all wetlands, with great potential. Lakes also grew significantly from 0.36 ± 0.12 in 2000 to 0.46 ± 0.14 in 2020 and had the highest habitat quality (0.12 ± 0.11) and water-purification capability with the lowest N loss (31.78 ± 45.33 kg/ha). The lowest multi-function score is found in rivers, which had the lowest habitat quality (0.07 ± 0.09) and water yield (2.75 ± 1.63 t/m2). Among them, the initial values of the pool and the lake are identical. However, since the lake is a natural water body, it is difficult to control and requires a longer time frame, resulting in a longer period of change for its multifunctional score. In contrast, the pool is mostly an artificial construction with a clear ecological governance goal, leading to more significant changes in its multi-functional score.
Table 9.
The multi-function score of different wetland landscapes from 2000 to 2020.
There was a notable spatial pattern in the multi-function score of the wetland landscape in Wuhan (Figure 7). Specifically, the wetlands with higher scores are mainly concentrated in the periphery of the new urban areas, and the multi-function score is mostly above 0.5 in these regions, where there are lakes, pools, and tidal flats. The multi-function score is positively related to the urban center distance, and the growth rate is higher in the new urban areas from 2000 to 2020. The multi-function score increased in Jiangxia, Dongxihu, and southern Xinzhou Districts, where there are lakes and pools, between 2000 and 2010. However, it degraded in the southwestern part of Caidian District between 2010 and 2015. And the multi-function score increased between 2015 and 2020.
Figure 7.
The multi-function score of wetland landscape.
4. Discussion
4.1. Wetland Changes in Wuhan City from 2000 to 2020
Wetland dynamics in Wuhan between 2000 and 2020 were influenced by natural factors and human activities. On the one hand, precipitation in Wuhan has varied in recent years (Figure 8a), reflecting the uneven water supplement for wetlands in different years. On the other hand, urbanization and population growth could partly explain the rapid decline in paddy fields over the past 20 years (Figure 8b). Urbanization has transformed urban infrastructure but has also severely degraded wetland environments due to water pollution from heavy industries, including garment and machinery factories. These human activities deteriorated water, soil, and air, further disrupting biodiversity and regional ecological composition cycling. Meanwhile, some wetland protection policies, such as the ‘Implementation Programme for Wuhan Wetland Protection and Restoration System’ (Wuhan Municipal Ecology and Environment Bureau, 2018), have been proposed; these policies could partly explain the increases in rivers, pools, and tidal flats.
Figure 8.
Precipitation (a) and permanent population (b) trend map of Wuhan in 2000–2020 (data from Department of Water Resources of Hubei Province).
Wetland dynamics exhibited significant spatial heterogeneity in Wuhan City. Wetlands were more pronounced in the central areas than in the new urban areas. The central area is mainly characterized by rivers and lakes, while the new northern urban area region is predominantly characterized by paddy fields, and the new southern urban area region features a combination of paddy fields and lakes. A population-aggregation effect has formed in the central areas due to abundant water and soil resources, flat terrain, and convenient transportation [32]. Moreover, the population density in the central areas is nearly ten times that of the new urban areas, which has directly increased land scarcity in the central areas, gradually encroaching on wetlands and other functional lands.
Both paddy fields and lakes had negative growth (−0.68% yr and −0.50% yr). Among them, the reduction in paddy fields is mainly caused by urbanization and increases in forestlands due to the ‘Returning Farmland to Forest’ policy [33]. Population density is more likely to encroach on arable lands in economic areas [34]. Additionally, the aquaculture industry encroached on wetlands and caused water eutrophication, reducing Nanhu Lake, Houhu Lake, and Futou Lake. The particular case of Chenhu Lake in Caidian District reveals a gradual transformation of degraded lake wetlands into agricultural fields or fishponds, significantly contributing to the fragmentation of wetland ecosystems and posing threats to biodiversity and ecological services [35]. Since 2016, Wuhan’s government has actively implemented a series of ecological protection and restoration measures, notably including the comprehensive removal of the ‘three nets’ (i.e., enclosing nets, barriers, and cages) used in lake fisheries [36]. These policy initiatives aim to reduce human interference, restore natural ecological processes in lakes, and lay a solid foundation for the holistic rehabilitation and sustainable development of wetland ecosystems.
Pool, tidal flat, and river areas had positive growth (1.19%/yr, 1.05%/yr, and 0.66%/yr). Pools are located around paddy fields and rivers and have the fastest growth rate in the past 20 years. On the one hand, water-conservancy projects have addressed various issues, such as power generation and water supply for irrigation [37]. On the other hand, lake area reduction has degraded urban water storage capacity and increased the waterlogging and Wuhan City drought frequency. It is urgent to increase pools to solve these problems. Furthermore, tidal flats are the main migration sites for precious wildlife and support plant growth, which provides industrial materials for fodder and paper-making. A total of 166 lakes were listed as rescue protection wetlands in 2010 [38], and Wuhan City was listed as a national pilot city for water ecological civilization construction in 2014 [39]. These policies have positively improved the tidal flat and river areas, with the fastest-growing tidal flat mainly located around rivers and lakes.
4.2. Multi-Function Assessment and Its Change in Wuhan City
Wetland multi-function assessment is complex due to the inclusion of various wetland sub-functional systems such as carbon sequestration, biodiversity conservation, water yield, and water purification. The assessment results are closely related to the wetland landscape type and the urban development direction. Focusing on land uses, the multi-function score is negatively related to production and living density. The economic-radiation effect and industrial transport demand directly affect biodiversity conservation, which could partly explain the lower multi-function score (about 0) of rivers in the central areas [40]. Although the multi-function score of paddy fields is the highest (0.51 ± 0.12 in 2020), water is seriously affected by nitrogen and phosphorus fertilizers during agricultural production. There are fewer anthropogenic activities for tidal flats, including those naturally formed and degraded after the man-made destruction of rivers and lakes, so its multi-function score is higher (0.50 ± 0.16). Furthermore, most pools are artificially constructed with a clear purpose of water conservation, exhibiting well-functioning systems. In addition, the ongoing reduction in water areas and fragmentation of lake patches have reduced lake carbon sequestration, adversely impacting its multi-function assessment, which is indicative of a trend toward ecological degradation.
From 2000 to 2015, the overall low multi-function score of wetlands was caused by the development of the central areas encroaching on the new urban areas resources and the lack of attention to ecological and environmental governance. The Wuhan government released the ‘Work Programme for the Creation of an International Wetland City in Wuhan’ in 2019, which underscored the significance of wetlands’ diverse functions, including production, ecology, and tourism, and outlined detailed strategies. Wuhan was recognized as the second batch of ‘International Wetland Cities’ in 2022 [41], signifying the city’s progression toward a diversified and sustainable ecological development trajectory.
4.3. Suggestions and Implications for Enhancing Multi-Functions of Wetlands
Carbon neutrality is important for addressing the climate change issue. As early as 2015, 151 countries made commitments to carbon neutrality in the signing of the Paris Agreement [42]. China proposed the ‘carbon peaking and carbon neutralization targets’ in September 2020 to achieve ecological civilization construction [43]. Wetlands serve as an important carbon sink due to their key soil carbon storage. China has gradually aligned with international standards, establishing organizations such as the Chinese Wetland Society to strengthen academic exchanges and cooperation at home and abroad. Therefore, this study constructed a multi-function assessment framework and quantified wetland carbon sequestration, biodiversity conservation, water yield, and water purification and expounded and analyzed the spatial and temporal evolution of landscape multi-functions, subsequently unveiling the underlying constraints encountered during wetland ecological-restoration efforts. This multi-function assessment framework not only uncovers the latent ecological and cultural tourism benefits embedded within planning and development strategies but also presents novel research avenues for evaluating ecological engineering. In this way, the ecological sustainable development of Wuhan and more regions can be realized, and the land space allocation can be optimized (Figure 9).
Figure 9.
Landscape planning for enhancing multi-functions.
At the governmental level (macro perspective), the government plays a crucial role in the construction and conservation of multifunctional wetland landscapes. Primarily, the government should strengthen the supervision of factories and domestic sewage, setting up a digital and transparent detection system [44]. Meanwhile, it actively adjusts the aquaculture structure by combining with tourism, cultural industries, and habitat restoration and transformation [45,46,47]. The diversified utilization of wetland resources not only helps enhance the ecological value of wetlands but also promotes the sustainable development of local economies. Furthermore, the government should establish reward and punishment mechanisms to encourage residents to actively participate in urban ecological governance, raise public awareness of environmental protection, and jointly promote the sustainable development of the urban environment.
At the social level (mesoscopic perspective), it serves as a bridge in the construction and protection of multifunctional wetland landscapes. Various stakeholders should jointly participate in the multifunctional development of wetlands, integrating natural elements with human well-being to achieve shared use and mutual benefit of wetland resources [48]. Planners could reasonably build waterfront squares, ecological floating islands, ecological revetments, and other nodes by matching aquatic and terrestrial plant communities. In addition, as the beneficiaries of the urban ecological environment, residents should also be transformed into implementers. Simultaneously, society should strengthen communication and exchange with multidisciplinary fields and integrate the optimized strategy of ‘Multiple planning integration’ for national territorial space to provide scientific evidence and technical support for wetland conservation. Moreover, the multi-function landscape construction of wetlands necessitates the seamless integration of ecosystem service valuation methodologies, thereby achieving a delicate equilibrium between societal progress and economic growth while simultaneously acknowledging the multifaceted values inherent in wetlands [49]. This integration facilitates the establishment of a sustainable and rational ecological safety blueprint, ensuring harmony between development and conservation [50].
At the public level (microscopic perspective), as the direct beneficiaries of the urban ecological environment, the public should also become the implementers of the construction and protection of multi-function wetland landscapes [51]. By participating in the reward and punishment mechanisms announced by policymakers, as well as a series of design activities planned by planners or through volunteer service, fund donations, and other means, the public can gain a deeper understanding of the importance of wetland protection and actively participate in it. This not only enhances the public’s environmental awareness but also facilitates the smooth implementation of wetland-protection efforts.
4.4. Our Limitations and Uncurtains
Firstly, ecological models could effectively reflect the spatial heterogeneity of wetland function. The InVEST model could effectively respond to differences in habitat quality, water yield, and water quality in physical environments such as topography, soils, landscape types, and threats. Its evaluations primarily focus on superficial landscape characteristics, neglecting the intricate biodiversity distinctions within seemingly uniform landscapes. This oversight constitutes a limitation when assessing ecosystem functions at a regional scale [52]. However, the InVEST model can evaluate many ecosystem service functions with the advantages of less input data, low application cost, and ease of operation. Secondly, the multi-function assessment framework is based on the Analytic Hierarchy Process (AHP), which relies heavily on the subjective judgments of experts, leading to a strong subjectivity bias in the evaluation results [53]. Additionally, when dealing with both qualitative and quantitative wetland functions (such as carbon storage and water yield), the method fails to fully leverage the precision of quantitative data, affecting the objectivity and accuracy of the evaluation. Future studies could consider quadrant measurements of different wetland ecological functions, and there is still a need for further improvements and consideration in the setting of model parameters and the construction of a multi-function assessment framework. Lastly, this study solely focuses on the functional aspect of wetlands. However, other factors, including climate, upstream runoff, and land use, all contribute to the area and distribution patterns of regional wetlands [54]. Public awareness of environmental protection also significantly impacts the sustainable development and conservation of wetlands. In addition, the multi-function assessment framework also has some limitations for areas with poor satellite conditions.
Overall, the analytical results presented in this paper indicate a degradation trend in the functions of Wuhan’s wetlands, accompanied by notable spatial heterogeneity. This underscores the urgent need for enhanced rational allocation of resources, thereby improving the ecological quality of wetland landscapes under the guidance of a new type of urbanization.
5. Conclusions
This study examined the spatial–temporal characteristics of various wetland types and multi-function assessment in Wuhan from 2000 to 2020. The results indicated wetland multi-functions exhibited a significant spatial heterogeneity. The wetland area of Wuhan decreased from 2000 to 2020 at −0.37%/yr. Among them, paddy fields and lakes decreased by −0.68%/yr and −0.50%/yr, respectively. However, pools, tidal flats, and rivers increased by 1.19%/yr, 1.05%/yr, and 0.66%/yr, respectively. Four wetland functions of carbon sequestration, biodiversity conservation, water yield, and water purification were assessed by ecological models. These functions were better in the new urban areas than in the central areas. Paddy fields were more prominent in biodiversity conservation (0.11 ± 0.09), carbon sequestration (283.61 ± 76.89 g/m2 of NPP), and water production (5.60 ± 1.37 t/m2), but the water-purification capacity was poorer. In addition, the multi-function score increased from 2000 to 2020, except for a decrease from 2005 to 2010. Meanwhile, the multi-function score improved significantly, bordering the central areas and the new urban areas between 2000 and 2005. Between 2015 and 2020, multidimensional policies targeting biological protection, wetland restoration, and industrial adjustment were introduced due to the government and society’s greater awareness of wetland ecological protection. The multi-function score was closely related to the wetland type and urban development direction in the past two decades and was negatively correlated with the production and living density, providing new ideas for wetland ecological protection and construction in Wuhan City.
Author Contributions
Conceptualization, Q.L. and C.H.; methodology, C.H.; software, X.G.; validation, X.G. and C.H.; resources, C.H.; data curation, Y.Y.; writing—original draft preparation, Y.Y.; writing—review and editing, C.H.; visualization, Y.Z. and Q.L.; supervision, C.H.; funding acquisition, C.H. All authors have read and agreed to the published version of the manuscript.
Funding
This work is sponsored by the General Project of the Hubei Social Science Fund (grant number HBSKJJ20243233, HHBSK2022YB357, 2021211).
Data Availability Statement
No new data were created or analyzed in this study. Data sharing is not applicable to this article.
Conflicts of Interest
The authors declare no conflicts of interest.
References
- Aslam, R.W.; Shu, H.; Javid, K.; Pervaiz, S.; Mustafa, F.; Raza, D.; Ahmed, B.; Quddoos, A.; Al-Ahmadi, S.; Hatamleh, W.A. Wetland identification through remote sensing: Insights into wetness, greenness, turbidity, temperature, and changing landscapes. Big Data Res. 2024, 35, 100416. [Google Scholar] [CrossRef]
- Junya, W. Functional Evolution and Development Response of the Rule of Law on Wetland Protection in China. China Land Sci. 2024, 38, 38–46. [Google Scholar] [CrossRef]
- Guozhuang, S.; Jingjuan, L. Review on Wetland Vegetation Biomass Inversion Using SAR Data. Remote Sens. Inf. 2016, 31, 1–8. [Google Scholar] [CrossRef]
- Jun, Y.; Liangshu, S.; Xiaoping, T. A Preliminary Analysis of Three Mainstream Wetland Definitions in Wetland Conservation and Management in China. Wetl. Sci. 2022, 20, 607–612. [Google Scholar] [CrossRef]
- GB24708-2009-T; Chinese National Standard for Wetland Classification. China Zhijian Publishing House: Beijing, China, 2009.
- Jin, G.; Guangyi, D.; Haibo, J.; Qiuying, M.; Yang, W.; Chunguang, H.; Yue, G.; Yingyue, C. Water quality management of micro swamp wetland based on the “source-transfer-sink” theory: A case study of Momoge Swamp Wetland in Songnen Plain, China. J. Clean. Prod. 2024, 446, 141450. [Google Scholar] [CrossRef]
- Tao, X.; Qiangsheng, S.; Yi, w.; Shengbang, S.; Zhiqiang, W.; Ming, Z. Progress and perspectives in the research of wetland ecosystem services. Chin. J. Ecol. 2022, 41, 1205–1212. [Google Scholar] [CrossRef]
- Weidong, W.; Ting, Y.; Weibing, G.; Weixi, P.; Ping, W.; Bin, Z.; Chundong, Z.; Qinghua, C.; Rongbin, Z.; Kewen, X.; et al. Ecological wetland paradigm drives water source improvement in the stream network of Yangtze River Delta. J. Environ. Sci. 2021, 110, 55–72. [Google Scholar] [CrossRef]
- Zhang, C.; Wen, L.; Wang, Y.; Liu, C.; Zhou, Y.; Lei, G. Can Constructed Wetlands be Wildlife Refuges? A Review of Their Potential Biodiversity Conservation Value. Sustainability 2020, 12, 1442. [Google Scholar] [CrossRef]
- Fu, B.; Xu, P.; Wang, Y.; Yan, K.; Chaudhary, S. Assessment of the ecosystem services provided by ponds in hilly areas. Sci. Total Environ. 2018, 642, 979–987. [Google Scholar] [CrossRef]
- Jian, P.; Huiling, L.; Yanxu, L.; Xin, C.; Xiaoxu, H. International Research Progress and Perspectives on Multifunctional Landscape. Adv. Earth Sci. 2015, 30, 465–476. [Google Scholar] [CrossRef]
- Yujie, G.; Zhibin, R.; Yulin, D.; Peng, Z.; Chengcong, W.; Zijun, M.; Xingyuan, H. Multifunctionality can be promoted by increasing agriculture-dominated heterogeneous landscapes in an agro-forestry interlacing zone in northeast China. Landsc. Urban Plan. 2023, 238, 104832. [Google Scholar] [CrossRef]
- Jian, P.; Zhicong, L.; Yanxu, L. Research Progress on Assessing Multi-Functionality of Agriculture. Chin. J. Agric. Resour. Reg. Plan. 2014, 35, 1–8. [Google Scholar] [CrossRef]
- Qizheng, M.; Luyv, W.; Min, L.; Qinghai, G.; Chanjuan, H.; Yuanzheng, L. Landsenses Ecology effects of multi-functional green space landscape in urban residential area. Acta Ecol. Sin. 2021, 41, 7509–7520. [Google Scholar] [CrossRef]
- Xuewei, Z.; Chaohan, L.; Wei, R.; Xiangrong, W. Study on the Landscape Multifunctionality and Multi-subject Game in the Fuzhou West Lake Water Heritage. Chin. Landsc. Archit. 2023, 39, 36–42. [Google Scholar] [CrossRef]
- Hou, N.; Yang, X.; Wang, W.; Sardans, J.; Yin, X.; Jiang, F.; Song, Z.; Li, Z.; Tian, J.; Ding, X.; et al. Mangrove wetland recovery enhances soil carbon sequestration capacity of soil aggregates and microbial network stability in southeastern China. Sci. Total Environ. 2024, 951, 175586. [Google Scholar] [CrossRef]
- Kaifeng, P.; Weiguo, J.; Yue, D. Identification of wetland damage degree and analysis of its driving forces in Wuhan Urban Agglomeration. J. Nat. Resour. 2019, 34, 1694–1707. [Google Scholar] [CrossRef]
- Jiaoyang, X.; Yixue, W.; Mingjun, T.; Pengcheng, W.; Zhaogui, Y.; Hui, W. Ecosystem services of lake-wetlands exhibit significant spatiotemporal heterogeneity and scale effects in a multi-lake megacity. Ecol. Indic. 2023, 154, 110843. [Google Scholar] [CrossRef]
- Ru, C.; Chunbo, H. Landscape Evolution and It’s Impact of Ecosystem Service Value of the Wuhan City, China. Int. J. Environ. Res. Public Health 2021, 18, 13015. [Google Scholar] [CrossRef]
- Ou, J.; Li, J.; Li, X.; Zhang, J. Planning and Design Strategies for Green Stormwater Infrastructure from an Urban Design Perspective. Water 2023, 16, 29. [Google Scholar] [CrossRef]
- Weiguo, J.; Ze, Z.; Ziyan, L.; Yawen, D. Experience and future research trends of wetland protection and restoration in China. Acta Geogr. Sin. 2023, 78, 2223–2240. [Google Scholar] [CrossRef]
- Juan, D.; Shrestha, R.P.; Nitivattananon, V.; Nguyen, T.P.L.; Razzaq, A. Unveiling the Value of Nature: A Comprehensive Analysis of the Ecosystem Services and Ecological Compensation in Wuhan City’s Urban Lake Wetlands. Water 2023, 15, 2257. [Google Scholar] [CrossRef]
- Huifang, L.; Yujing, H.; Tao, W.; Zhihua, W.; Yanan, L.; Huanfeng, S. Evolution of urban morphological polycentricity and the thermal response in Wuhan from 2000 to 2020. Sustain. Cities Soc. 2024, 100, 105055. [Google Scholar] [CrossRef]
- Qipeng, L.; Zhe, W.; Chunbo, H. Green Infrastructure Offset the Negative Ecological Effects of Urbanization and Storing Water in the Three Gorges Reservoir Area, China. Int. J. Environ. Res. Public Health 2020, 17, 8077. [Google Scholar] [CrossRef] [PubMed]
- Shuangshuang, L.; Qipeng, L.; Mingzhu, X.; Dengyue, Z.; Chunbo, H. Spatial and Temporal Variations of Habitat Quality and Its Response of Landscape Dynamic in the Three Gorges Reservoir Area, China. Int. J. Environ. Res. Public Health 2022, 19, 3594. [Google Scholar] [CrossRef] [PubMed]
- Sharp, R.; Chaplin-Kramer, R.; Wood, S.; Guerry, A.; Tallis, H.; Ricketts, T.; Nelson, E.; Ennaanay, D.; Wolny, S.; Olwero, N.; et al. Invest User’s Guide; The Natural Capital Project; Stanford University: Stanford, CA, USA; University of Minnesota: Minneapolis, MN, USA; The Nature Conservancy: Arlington County, VA, USA; World Wildlife Fund: Gland, Switzerland, 2018. [Google Scholar]
- Redhead, J.W.; May, L.; Oliver, T.H.; Hamel, P.; Sharp, R.; Bullock, J.M. National scale evaluation of the InVEST nutrient retention model in the United Kingdom %J Science of the Total Environment. Sci. Total Environ. 2018, 610, 666–677. [Google Scholar] [CrossRef]
- Bangshuai, H.; Andie, R.; Aihua, L. Modeling nutrient release with compiled data in a typical Midwest watershed. Ecol. Indic. 2021, 121, 107213. [Google Scholar] [CrossRef]
- Chunbo, H.; Dengyue, Z.; Xin, F.; Chao, L.; Guosong, Z. Landscape dynamics facilitated non-point source pollution control and regional water security of the Three Gorges Reservoir area, China. Environ. Impact Assess. Rev. 2022, 92, 106696. [Google Scholar] [CrossRef]
- Lu, C.; Sidai, G.; Yangli, L. Discerning changes and drivers of water yield ecosystem service: A case study of Chongqing-Chengdu District, Southwest China. Ecol. Indic. 2024, 160, 111767. [Google Scholar] [CrossRef]
- Chao, W.; Le, M.; Yan, Z.; Nengcheng, C.; Wei, W. Spatiotemporal dynamics of wetlands and their driving factors based on PLS-SEM: A case study in Wuhan. Sci. Total Environ. 2022, 806, 151310. [Google Scholar] [CrossRef]
- Chao, L.; Yuan, L.; Yajin, Z.; Shuangshuang, L.; Chunbo, H. Simulation and Analysis of the Effects of Land Use and Climate Change on Carbon Dynamics in the Wuhan City Circle Area. Int. J. Environ. Res. Public Health 2021, 18, 11617. [Google Scholar] [CrossRef]
- Jing, C.; Shuangshuan, L.; Chunbo, H.; Lunche, W.; Zelin, L.; Changhui, P. Impacts of environmental and socioeconomic factors on gross ecosystem product of the Three Gorges reservoir area, China. Land Degrad. Dev. 2024, 35, 2824–2839. [Google Scholar] [CrossRef]
- Yanwen, L.; Chengwu, L.; Zongyi, H.; Xia, Z.; Binghua, H.; Hanzhou, H. Spatial-temporal evolution of ecological land and influence factors in Wuhan urban agglomeration based on geographically weighted regression model. Chin. J. Appl. Ecol. 2020, 31, 987–998. [Google Scholar] [CrossRef]
- Yu, C.; Kun, L.; Yao, D.; Teng, M. Identification of Degradation Process of Chenhu Wetland over Last 50 Years. Earth Sci. 2021, 46, 661–670. [Google Scholar] [CrossRef]
- Yansheng, G.; Yuenan, L.; Shucheng, X.; Hongfu, Y. On the Establishment of Wuhan as an International Wetland City from the Perspective of Lake Evolution. Earth Sci. 2023, 48, 3193–3204. [Google Scholar] [CrossRef]
- Yonglin, Z.; Jiaojiao, R.; Wen, W.; Mingyao, Z.; Mingquan, L.; Shengjun, W. Response of Water Quality in Small Reservoirs to Landscape Composition, Landscape Configuration, and Reservoir Characteristics in the Upper Reaches of the Yangtze River During Dry Season. Environ. Sci. 2023, 44, 2528–2538. [Google Scholar] [CrossRef]
- Shengfu, Y.; Wenjie, F. Performance Evaluation and Determinants of Land Supply in Wuhan. Econ. Geogr. 2021, 41, 185–193. [Google Scholar] [CrossRef]
- Qiuyue, Y.; Da, G.; Deyong, S.; Yi, L. Environmental regulation, pollution reduction and green innovation: The case of the Chinese Water Ecological Civilization City Pilot policy. Econ. Syst. 2021, 45, 100911. [Google Scholar] [CrossRef]
- Kui, M.; Chen, Z. Research on coupling coordination developm ent of inland port logistics and regional industry—Taking Wuhan new port as an example. Prices Mon. 2021, 1, 80–87. [Google Scholar] [CrossRef]
- Weiguo, J.; Xiaoya, W.; Zhuo, L.; Ziyan, L.; Yawen, D. Processes and future research trends of sustainable development of wetland cities. J. Nat. Resour. 2024, 39, 1241–1261. [Google Scholar] [CrossRef]
- Jing, C.; Chunbo, H.; Xintao, G.; Changhui, P.; Lei, D. Can forest carbon sequestration offset industrial CO2 emissions? A case study of Hubei Province, China. J. Clean. Prod. 2023, 426, 139147. [Google Scholar] [CrossRef]
- Shuilin, Q.; Jie, P.; Leshan, J. Value Realization Mechanism of Ecological Goods in Natural Resources: An Analytical Framework of the Regime Complex. China Land Sci. 2021, 35, 10–17+25. [Google Scholar] [CrossRef]
- Chunbo, H.; Dengyue, Z.; Chao, L.; Qipeng, L. Integrating territorial pattern and socioeconomic development into ecosystem service value assessment. Environ. Impact Assess. Rev. 2023, 100, 107088. [Google Scholar] [CrossRef]
- Qingbo, L.; Rui, L.; Zhiqi, B. Real-time discrimination of contamination source composed of multiple pollutants in surface water based on deep learning and UV–Vis spectral abundance estimation methodology. Spectrochim. Acta Part A Mol. Biomol. Spectrosc. 2024, 307, 123635. [Google Scholar] [CrossRef]
- Jing, Z.; Tianyuan, Z.; Yuequn, L. Novel method for industrial sewage outfall detection: Water pollution monitoring based on web crawler and remote sensing interpretation techniques. J. Clean. Prod. 2021, 312, 127640. [Google Scholar] [CrossRef]
- Yiyan, C.; Ye, L.; Cunjin, L. Electronic agriculture, blockchain and digital agricultural democratization: Origin, theory and application. J. Clean. Prod. 2020, 268, 122071. [Google Scholar]
- Huang, C.; Gan, X.; Wan, Y.; Jin, L.; Teng, J.; Li, Z. China contributed to low-carbon development: Carbon emission increased but carbon intensity decreased. Front. Ecol. Evol. 2024, 12, 1338742. [Google Scholar] [CrossRef]
- Hongjuan, Z.; Zhicheng, Z.; Kang, L.; Chunbo, H.; Guanpeng, D. Integrating land use management with trade-offs between ecosystem services: A framework and application. Ecol. Indi Cators 2023, 149, 110193. [Google Scholar] [CrossRef]
- Jieling, L.; Hui, F. Construct the future wetland ecological security pattern with multi-scenario simulation. Ecological Indicators. 2023, 153, 110473. [Google Scholar] [CrossRef]
- Chen, W.; Di, K.; Cai, Q.; Li, D.; Liu, C. Research on Motivational Mechanisms and Pathways for Promoting Public Participation in Environmental Protection Behavior. Int. J. Environ. Res. Public Health 2023, 20, 5084. [Google Scholar] [CrossRef]
- Di, W.; Liang, Z.; Ying, W.; Jian, G.; Jiangfeng, L.; Qian, C. Dynamics in construction land patterns and its impact on water-related ecosystem services in Chengdu-Chongqing urban agglomeration, China: A multi-scale study. J. Clean. Prod. 2024, 469, 143022. [Google Scholar] [CrossRef]
- Pingping, Z.; Md Ali, Z.; Ahmad, Y. Developing indicators for sustainable urban regeneration in historic urban areas: Delphi method and Analytic Hierarchy Process (AHP). Sustain. Cities Soc. 2023, 99, 104990. [Google Scholar] [CrossRef]
- Wang, S.; Shentu, H.; Yu, H.; Wang, L.; Wang, J.; Ma, J.; Zheng, H.; Huang, S.; Dong, L.; Wei, J. Impact of urbanization and land use on wetland water quality: A case study in Mengxi town. Urban Clim. 2024, 55, 101855. [Google Scholar] [CrossRef]
Disclaimer/Publisher’s Note: The statements, opinions and data contained in all publications are solely those of the individual author(s) and contributor(s) and not of MDPI and/or the editor(s). MDPI and/or the editor(s) disclaim responsibility for any injury to people or property resulting from any ideas, methods, instructions or products referred to in the content. |
© 2024 by the authors. Licensee MDPI, Basel, Switzerland. This article is an open access article distributed under the terms and conditions of the Creative Commons Attribution (CC BY) license (https://creativecommons.org/licenses/by/4.0/).