Abstract
Soil erosion is a global environmental problem, and soil conservation is the prevention of soil loss from erosion. The Ten Kongduis (kongdui is the translation of “short-term flood gullies” in Mongolian) are ten tributaries in the upper Inner Mongolia section of the Yellow River Basin. The study of the spatial and temporal variability in soil conservation in the Ten Kongduis is of extraordinary scientific significance both in terms of the discipline and for the ecological and environmental management of the region. With the InVEST model, the characteristics of the spatial and temporal variations in soil conservation service in the Ten Kongduis since 2000 and how rainfall and land use have influenced soil conservation were analyzed. The results show that both avoided erosion and avoided export varied considerably between years. The minimum values of avoided erosion and avoided export were both in 2015, with values of 17.59 × 10⁶ t and 0.92 × 10⁶ t, respectively. The maximum value of avoided erosion was 57.03 × 10⁶ t in 2020 and that of avoided export was 4.08 × 10⁶ t in 2000. Spatially, avoided export was primarily found in the upper reaches of the east–central portion of the study area, and avoided erosion, with values of >40 t·(ha·yr)−1, was in the upper east–central portion of the study area, followed by the upper west–central portion. The difference between upstream and downstream was larger in the western part of the study area. The effect of rainfall was dominant and positive in both avoided erosion and avoided export. The relationships between the rain erosivity factor and the values of avoided erosion and avoided export were significantly positive. Where more erosion occurs, more erosion is retained. Soil that has been eroded away from slopes under vegetation or other water conservation measures may not necessarily be transported to the stream channel in the current year. These conclusions will help us to have a clearer understanding of where sediments are generated and transported and provide a scientific basis for soil and water conservation and ecosystem safety management of watersheds.
1. Introduction
Soil conservation is a vital regulating service in regional ecosystems through ecosystem structure and processes [1] that is defined as the ability of an ecosystem to prevent soil erosion [2,3]. Soil erosion is an environmental problem that exists worldwide that can destroy soil resources and lead to land deterioration and serious ecological degradation [4,5,6]. The Status of the World’s Soil Resources report shows that most of the world’s soil resources are in fair or poor condition [4], with more than 2 billion hectares affected by soil erosion, costing the global GDP about USD 8 billion per year [7]. In China, the threat of soil erosion is equally serious, especially in the Yellow River Basin (YRB). In 2021, the total area of soil and water loss in the YRB reached about 2.6 × 10⁵ km2 [8]. Soil conservation is the prevention of soil loss through erosion or the loss of fertility induced by overuse, acidification, salinization, or other chemical soil pollution [9,10]. Improving soil conservation functions is important for the ecological protection and high-quality development of the YRB [11].
According to the Soil and Water Conservation Monitoring Center of the Ministry of Water Resources of China, which issued the Technical Guidelines for Monitoring the Dynamics of Soil and Water Loss in 2020, of the 76 tributaries in the YRB with watersheds larger than 1000 km2, there are 11 tributaries with serious soil erosion. Among them, the most serious and difficult to manage are the Ten Kongduis (kongdui is the translation of “short-term flood gullies” in Mongolian), which are ten tributaries in the upper Inner Mongolia section of the YRB. Pisha sandstone, known as “Earth’s ecological cancer”, is located in the upper stream of the Ten Kongduis, which are highly susceptible to soil and water loss. The average annual sediment delivered from the Ten Kongduis to the YRB is about 2.7 × 10⁷ t, which is more than one-tenth of the total amount of sediment entering the YRB in China. The Ten Kongduis are one of the direct producers of the “hanging river on the ground” of the Inner Mongolia section and lower reaches of the YRB [12]. In order to implement the strategy of ecological protection and high-quality development of the YRB, the Chinese Inner Mongolia Autonomous Region has listed the comprehensive management of the Ten Kongduis as a major initiative of the development strategy [13]. Knowledge of sediment initiation and transport processes allows management to intervene in the transport process by, for example, changing how land is used and managed to reduce sediment loads [14]. Therefore, the study of the spatial and temporal variability in soil conservation in the Ten Kongduis is of extraordinary scientific significance both in terms of the discipline and for the ecological and environmental management of the region.
In general, field observations of soil erosion and sediment yield are most accurate. However, this is impractical for large study areas because of financial and human resource constraints. The literature shows that some models can be used to understand the processes of soil erosion and sediment yield in watersheds [15], including the Universal Soil Loss Equation (USLE), Revised Universal Soil Loss Equation (RUSLE), Water Erosion Predict Project (WEPP), European Soil Erosion Model (EUROSEM) [16], Water and Tillage Erosion Model and Sediment Delivery Model (WaTEM/SEDEM) [17], Soil and Water Assessment Tool (SWAT) [18], Agricultural Non-Point Source Pollution (AGNPS) model [19], and Limburg Soil Erosion Model (LISEM) [20]. Meanwhile, because physically based soil loss and sediment transport models require large amounts of data, it is not easy to apply them in areas where data are scarce [15]. So far, for the Ten Kongduis, there are only three hydrological stations. Therefore, the main study on the Ten Kongduis is based on the measured data at the three hydrological stations to analyze the changes in the runoff and sediment discharge and less on the whole region to carry out research on the spatial and temporal dynamics of the sediment yield. Therefore, the Integrated Valuation of Ecosystem Services and Tradeoffs (InVEST) model, which works with few climate and soil data [21], was chosen to evaluate the soil conservation in the Ten Kongduis at different spatial and temporal scales. The soil conservation module of the InVEST model considers the sum of soil erosion reduction and retention as soil conservation. The former is the difference between the potential and actual erosion of the soil, and the latter is the ability of the plot to intercept sediment uphill, which can be expressed as the product of the incoming sand volume and the sediment retention rate. Compared with the Universal Soil Loss Equation (USLE), this model integrates the erosion mitigation and sediment retention effects of vegetation, and the evaluation results are more scientific [16]. Soil erosion and sediment yields have been simulated with the InVEST model in many countries around the world [22,23,24,25,26,27].
Thus, based on the InVEST model, the objective of this paper was to quantify and map the characteristics of the spatial and temporal variations in soil conservation services in the Ten Kongduis since 2000, obtain the effects of rainfall and land use on soil conservation, assess the spatial and temporal distribution of sediment retention services, and identify where sediment retention occurs in the landscape. The results can allow water and land managers to investigate the spatial and temporal changes in ecosystem soil and water conservation functions and their driving factors in typical management projects carrying out ditching and land reclamation and design better strategies to reduce sediment loads by changing the land use and management practices in the Ten Kongduis and YRB through understanding where sediments are generated and transported and provide a scientific basis for soil and water conservation and the ecosystem safety management of watersheds.
2. Materials
2.1. Study Area
The Ten Kongduis in the upper reaches of the YRB are located between 39°47′40″–40°33′30″ N and 108°48′35″–110°56′40″ E, including ten rivers from west to east. The Ten Kongduis join the Yellow River from the south bank in parallel between the Sanhuhekou and Toudaoguai hydrological stations (Figure 1). According to Yang and Shi [28], the total watershed area of the Ten Kongduis is 7885 km2. The upper reaches of the kongduis are hilly and gully areas, the middle reaches flow through the Kubuqi Desert, and the lower reaches are alluvial plains.
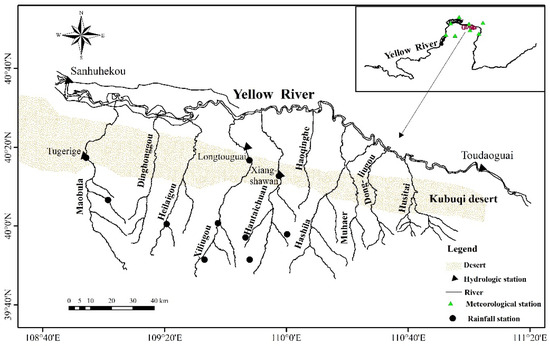
Figure 1.
Location of the Ten Kongduis.
Belonging to a temperate continental monsoon climate, the Ten Kongduis are located in a semi-arid desert steppe area with low rainfall. The average temperature ranges from 6.1 °C to 7.4 °C and the annual precipitation is 200 ~ 400 mm. The rainfall mainly occurs in the form of rainstorms, concentrated from July to October. These rainstorms usually produce highly hyper-concentrated flows that rapidly rise and fall in the kongduis. The Ten Kongduis are one of the most typical ecologically vulnerable areas in China, with relatively harsh natural conditions [29].
2.2. Sediment Delivery Ratio Model
The Sediment Delivery Ratio (SDR) model of InVEST 3.14.1 was used to model the spatial distribution of terrestrial sediment production and transport to the stream.
2.2.1. Annual Soil Loss
The amount of annual soil loss in pixel i, uslei, in tons ha−1yr−1, was derived by the Revised Universal Soil Loss Equation (RUSLE1), as shown below [30]:
where is the rainfall erosivity, in MJ·mm (ha·hr·yr)−1; is the soil erodibility, in ton·ha·hr (MJ·ha·mm)−1; is the slope length–gradient factor, unitless; is the cover-management factor, unitless; and is the support practice factor, unitless.
- (1)
- Rain erosivity factor
The rain erosivity factor Ri reflects the soil stripping by rainfall, transportation, and the surface-scouring ability of rainfall and is a reflection of the potential capacity of precipitation to cause soil erosion. The half-month rainfall erosivity, R, in MJ·mm (ha·yr)−1, was calculated using the formula below:
where Pj is the erosive rainfall (mm) for day j in a given half-month of k days, and α and β are coefficients [31]. When the daily rainfall is equal to or greater than 12 mm, Pj is the actual rainfall; otherwise, Pj is equal to 0 [32]. The annual erosivity Ri was calculated as shown below:
The β was estimated with the empirical formula below [33]:
where Pd12 and Py12 are the average daily and annual rainfall for days with rainfall ≥12 mm, respectively. According to Yang and Lu [31], α was calculated as shown below:
- (2)
- Soil erosion factor
The soil erodibility factor Ki refers to the sensitivity of soil to erosion and measures the ease with which soil particles can be separated and transported by rainfall. Ki was calculated according to Williams et al. [34]:
where Sand, Silt and Clay are the contents of sand, silt and clay, respectively (%), C is the soil organic carbon content (%), and SN1 = 1 − Sand/100. Zhang et al. [35] found that the equation above cannot be used for Chinese soil directly, so they revised it as shown below:
- (3)
- Slope length–gradient factor
The slope length–gradient factor LSi is the main topographic factor that creates runoff with erosive capacity and leads to erosion events and can represent the influence of topographic features on soil erosion. The LSi factor was developed by Desmet and Govers [36]:
where is an estimate of the specific catchment area; Si is the slope of each grid cell i, as a percentage; θ is the slope, in units of degree; D is the grid cell linear dimension (m); is the aspect direction for grid cell i; is the angle of the slope in pixel i, in radians; and m is the RUSLE length exponent factor. According to the model manual, the upper limit of the long slope length was 122 m [30,36].
- (4)
- Cover management factor
The cover management factor Ci refers to the ratio of the amount of soil loss from a specific type of crop or vegetation under certain conditions after the implementation of vegetation management measures to the amount of soil loss without management measures. Ci is closely related to vegetation cover. According to Cai et al. [37], the equation is as follows:
where f is the vegetation cover (%), NDVI is the normalized difference vegetation index, and NDVIsoil and NDVIveg are the NDVI values of bare soil pure pixels and pure pixels with 100% vegetation coverage, respectively [38]. For this study, the NDVIsoil and NDVIveg were defined as the 0.5% and 99.5% quantiles of all the NDVI values, respectively [39,40]. The smaller the value, the less erosion is likely to be caused by that land use/land cover type (LULC). The higher the value, the more severe the erosion is likely to be for that LULC.
- (5)
- Support practice factor
The value of support practice factor Pi ranges from 0 to 1. A value of 1 indicates that no measures are being taken to reduce erosion. A value of less than 1 indicates that management measures to reduce erosion are being taken. Land use information can indirectly reflect soil and water conservation measures, and in large-scale watershed soil erosion studies, it is usually determined by assigning values to different land use types in conjunction with fieldwork information [41]. The value is negatively correlated with the effect of water conservation measures and was assigned according to [22] (Table 1).

Table 1.
Pi values for different land uses.
2.2.2. Sediment Delivery Ratio
The SDR for a pixel i was derived from the conductivity index IC with the following equation [42]:
where SDRmax is the maximum theoretical SDR, with the mean value set to 0.8 [42]. IC0 and k are calibration parameters that define the SDR-IC relationship shape (it is an increasing function). IC0 and k are generally set to 0.5 and 2, which are the default values, respectively, using kb only for calibration [42].
2.2.3. Sediment Export
The sediment export from a given pixel i Ei (unit: tons·ha−1yr−1) is expressed as
The total catchment sediment export E (unit: tons·ha−1yr−1) is expressed as
2.2.4. Soil Conservation Service Indicators
To evaluate the service of soil conservation, we can obtain two outputs. (1) Avoided erosion is the contribution of vegetation to reducing erosion at a pixel site. This can be used to quantify ecosystem services in terms of local soil loss and is calculated as
where is the amount of erosion avoided in pixel i.
(2) Avoided export is the contribution of vegetation to avoiding erosion at a pixel site and is calculated as
where is the amount of sediment detained by pixel i, and is the total trapped sediment in pixel i from the upslope [14].
2.3. Data Sources and Processing
The DEM data used in this paper were ASTER GDEM data with a resolution of 30 m and were downloaded from the Geospatial Data Cloud (https://www.gscloud.cn/).
The monthly rainfall was calculated using the daily precipitation data from 2000 to 2020, including 10 rainfall stations in the watershed in the hydrological yearbook provided by the Yellow River Water Conservancy Authorities and 8 meteorological stations around the watershed obtained from the National Meteorological Authorities (http://data.cma.cn/) (Figure 1). Ordinary kriging spatial interpolation with Arc GIS 10.5 was performed to obtain a raster map of the annual rainfall erosivity factor in the watershed.
The soil data included soil texture (sand, silt, and clay contents) and soil organic carbon and came from the Chinese soil dataset (V1.1) (https://data.tpdc.ac.cn/) and were used to calculate the soil erodibility factor.
The annual land use/land cover (LULC) datasets with a spatial resolution of 30 m from 1985 to 2022 were downloaded from http://www.ncdc.ac.cn. The LULC types were divided into nine categories: cropland, forestland, shrubland, grassland, water, snow/ice, barren land, impervious land, and wetland.
The NDVI products for the years 2000–2022 with a spatial resolution of 30 m were downloaded from the National Ecosystem Science Data Center (https://doi.org/10.12199/nesdc.ecodb.rs.2021.012). These data were used to obtain a raster map of the annual cover management factor. Combined with the LULC data, the zonal tool of Arc GIS 10.5 was used to obtain the average Ci for the different LULC types.
The watershed boundary data used to extract the raster map of the rainfall erosivity, soil erodibility, and LULC types were obtained from the DEM. According to Yang and Shi [28], the threshold of the accumulation area of the Ten Kongduis is 0.1 km2. Based on the resolution of the DEM, the conversion into the number of pixels was 111.
To address the fact that the different data sources had different spatial resolutions and different years, the parameter data input to the InVEST Sediment Delivery Ratio model were unified into a 30 m × 30 m spatial resolution with the projection coordinates of the Albers Conical Equal Area, and we analyzed the spatial evolution characteristics of soil conservation of the study area in 2000, 2005, 2010, 2015, and 2020.
Since Xiliugou Kongdui has the most complete observed data and is located in the center of the study area, it can avoid, to some extent, the errors caused by large differences in rainfall and surface material composition in the simulation of other kongduis. We used observed data from the Longtouguai hydrographic station in Xiliugou Kongdui (Figure 1) for the calibration of parameter kb. The observed sediment data were obtained from the hydrological yearbook provided by the Yellow River Water Conservancy Authorities.
Other calculations and graphing of relevant data were performed using Microsoft Excel 2016 and IBM SPSS Statistics 20.0.
2.4. Effect Calculation
In order to quantitatively distinguish the effects of rainfall and land use on the soil conservation value, we took 2000 as an example, replaced its rain erosivity factor with the values in 2005, 2010, 2015, and 2020, kept the other data unchanged to compare the simulated value with the actual value, and judged the effect of rainfall on the soil conservation value, and we then replaced its land use data with those of 2005, 2010, 2015, and 2020, kept the other data unchanged, and also compared the simulated value with the actual value to judge the land use’s impact on the soil conservation value. The simulated values of the soil conservation SR and SL were calculated by changing the rain erosivity factor and land use data, respectively, in the same year, and subtracting the real values Ryear from them as (Ryear-SR) and (Ryear-SL), respectively. The effects of rainfall and land use on soil conservation were then calculated as follows:
Re is the effect of rainfall on soil conservation (in 100%), and Le is the effect of land use on soil conservation.
3. Results
3.1. Rain Erosivity Factor Change
In Figure 2, spatially, in all years, the distribution of the rain erosivity factor showed an increasing trend from west to east. Meanwhile, it varied considerably from year to year, with the largest value being in 2020 and the smallest in 2005, with mean values of 605.94 and 212.12 MJ·mm·(ha·yr)−1, respectively. Specifically, 2005 and 2015 were dominated by values of less than 250 MJ·mm·(ha·yr)−1, with 71.59% and 65.04% of the regional rain erosivity factor in this range, respectively. The rain erosivity factor in 2020 lay mainly between 500 and 600 MJ·mm·(ha·yr)−1, which represented 71.40% of the study area. In contrast, in 2000 and 2010, the rain erosivity factors were dominated by values of less than 350 MJ·mm·(ha·yr)−1 and more than 400 MJ·mm·(ha·yr)−1.
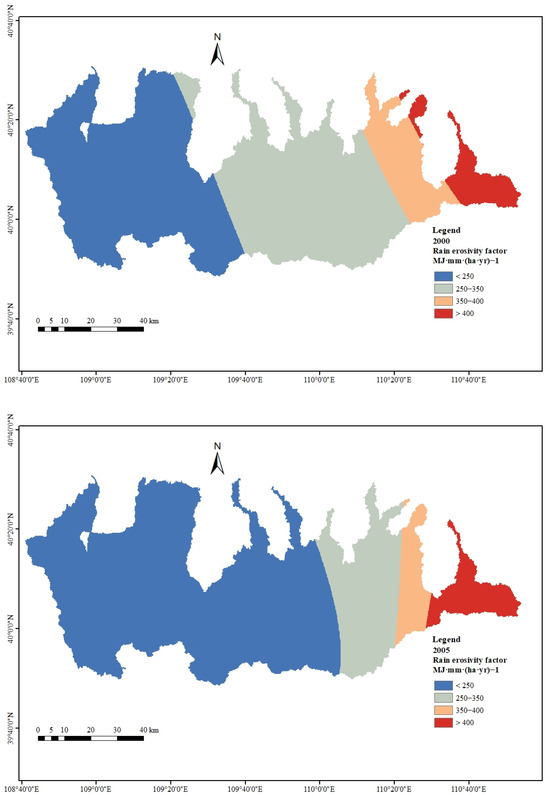
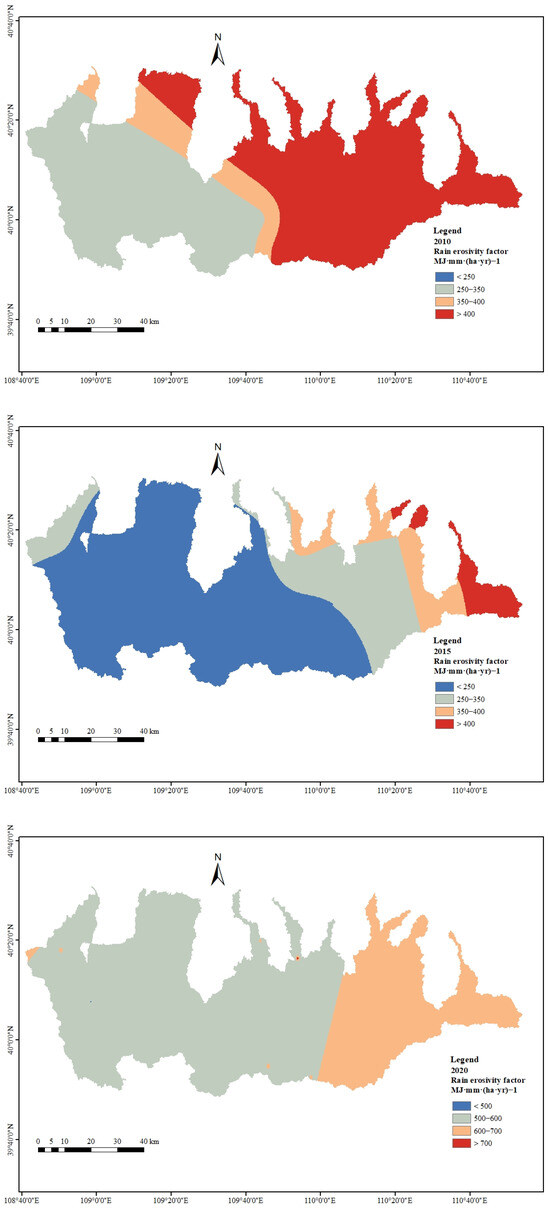
Figure 2.
Rain erosivity factors of the Ten Kongduis from 2000 to 2020.
3.2. LULC Changes
The LULC types of the Ten Kongduis included cropland, forestland, grassland, water, barren land, and impervious land. As shown in Figure 3, the dominant LULC type in the Ten Kongduis was grassland, which was mainly distributed in the upstream area of the watershed, accounting for 72.93–80.93% of the study area, and increased from 2000 to 2020, followed by barren land, which was mainly in the middle reaches of the western part of the watershed, accounting for 16.79–7.18% of the study area, and significantly decreased from 2000 to 2020. Cropland was mainly located in the lower eastern watershed and increased from 2000 to 2020, accounting for 9.96% of the study area in 2000 to 11.51% in 2020, while the remaining three LULC types accounted for a smaller area of less than 1%. Overall, there was less spatial variation across the land use types from 2000 to 2020.
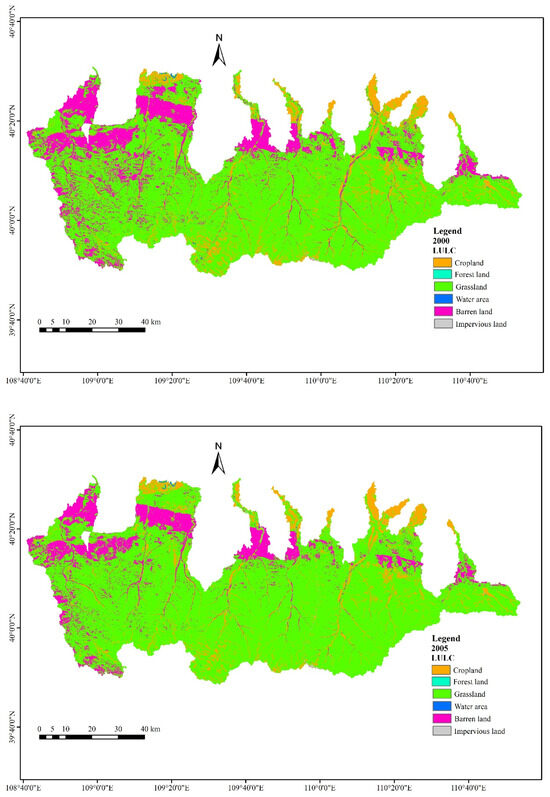
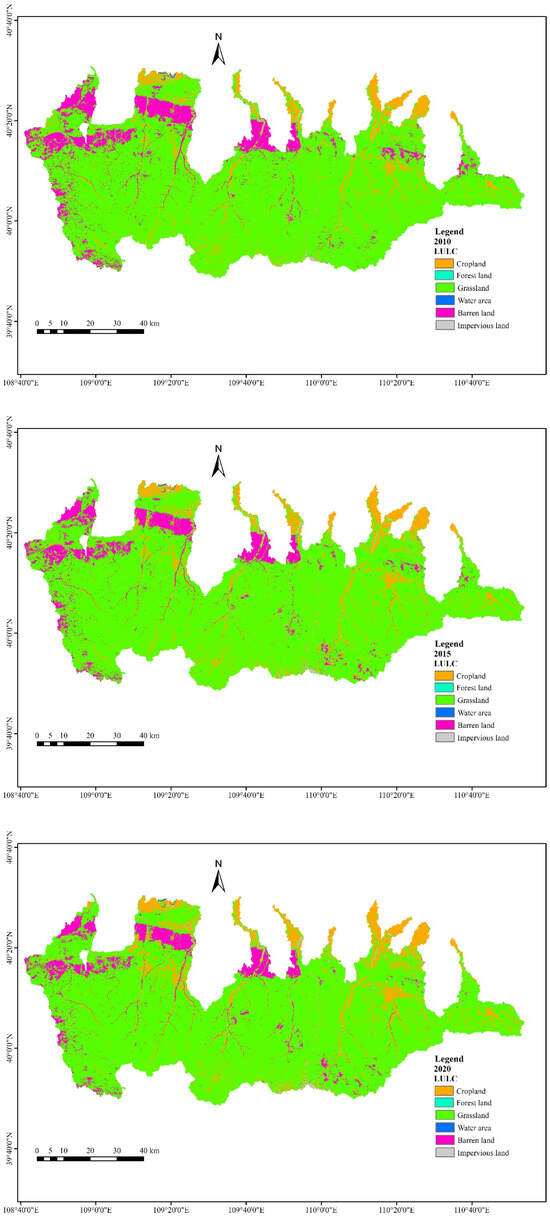
Figure 3.
LULC in the Ten Kongduis from 2000 to 2020.
3.3. Calibration Results
At Longtouguai in the Xiliugou Kongdui in 2000 [43], the specific sediment yield of the Xiliugou Kongdui was about 0.266 t ha−1yr−1·, while the modeled sediment export was 0.295 t·ha−1 yr−1, with the default value of each parameter described in Section 2.2. The relative error was 10.85%. After calibrating the kb value to 1.9, the final modeled sediment export was obtained as 0.274 t·ha−1yr−1. Similarly, we calibrated the values of kb for 2005, 2010, 2015, and 2020 to enable the relative error to be controlled within ±5%.
3.4. Temporal Changes in Soil Conservation
As mentioned above, two outputs were provided for evaluating the service of soil conservation, namely, avoided erosion and avoided export. Therefore, the calculations are shown in Table 2. Both varied considerably between years and, in general, both avoided erosion and avoided export appeared to increase from 2000 to 2020, especially the avoided erosion value. Specifically, the minimum and maximum values of avoided erosion were 17.59 × 10⁶ t in 2015 and 57.03 × 10⁶ t in 2020, respectively, and the minimum and maximum values of avoided export were 0.92 × 10⁶ t in 2015 and 4.08 × 10⁶ t in 2000, respectively.

Table 2.
Soil conservation in the study area for 2000–2020.
3.5. Spatial Distribution of Soil Conservation
The avoided erosion and avoided export were divided into six intervals <1, 1–5, 5–10, 10–20, 20–40, and >40 t·(ha·yr)−1. As shown in Figure 4, high avoided export, namely, the role of vegetation in preventing erosion into streams, was primarily found in the east–central upper reaches of the study area, except in 2015, with values ranging from 10 to 20 t·(ha·yr)−1. For 2015, the spatial variations in avoided export were small, mainly in intervals of <1 t·(ha·yr)−1.
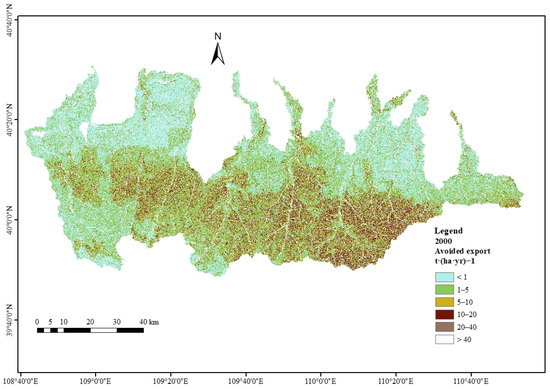
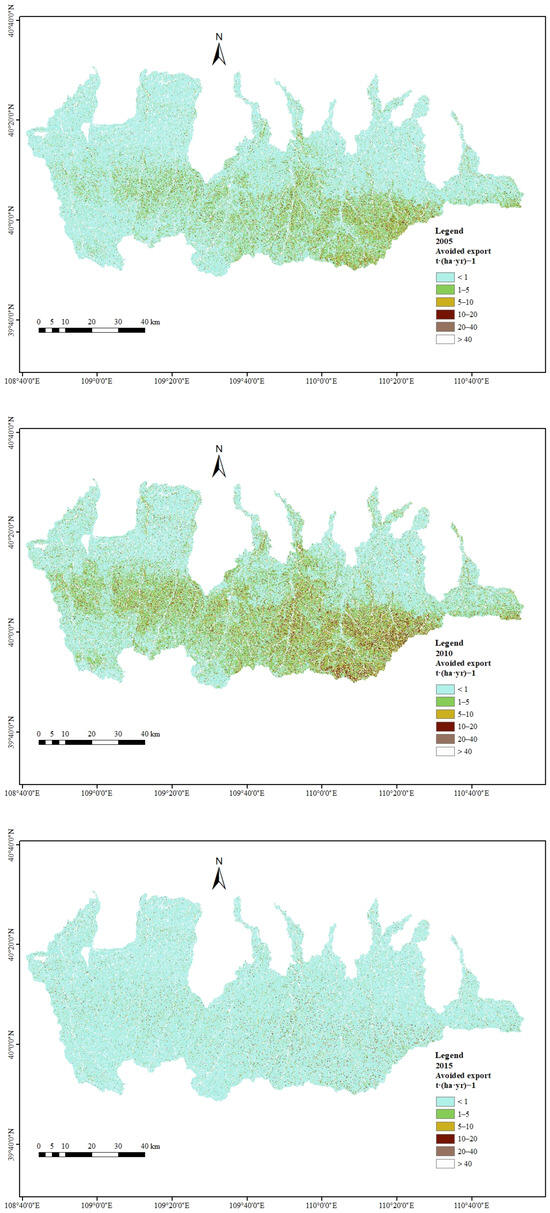
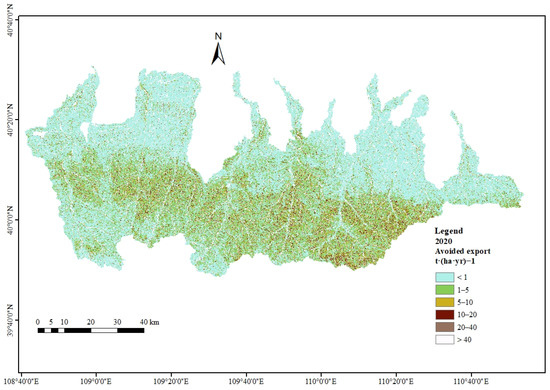
Figure 4.
Avoided export in the Ten Kongduis from 2000 to 2020.
As shown in Figure 5, avoided erosion, namely, the vegetation’s effect on preventing soil erosion in each pixel, a consistent pattern emerged in the differences in the spatial distribution across years, i.e., the area with avoided erosion values of >40 t·(ha·yr)−1 was the upper east–central portion of the study area, followed by the upper west–central portion. Relatively speaking, the difference in avoided erosion between upstream and downstream was larger in the western study area, while the difference between upstream and downstream was smaller in the central and eastern study areas, and this distribution feature was especially obvious in 2005 and 2015.
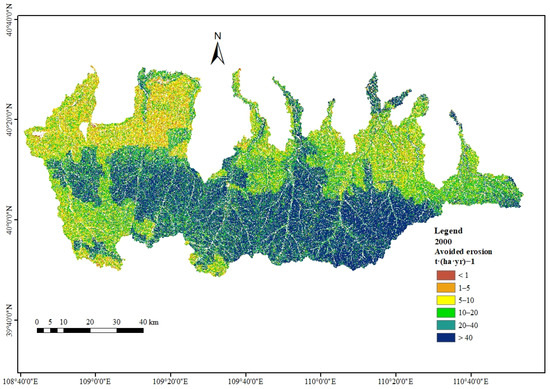
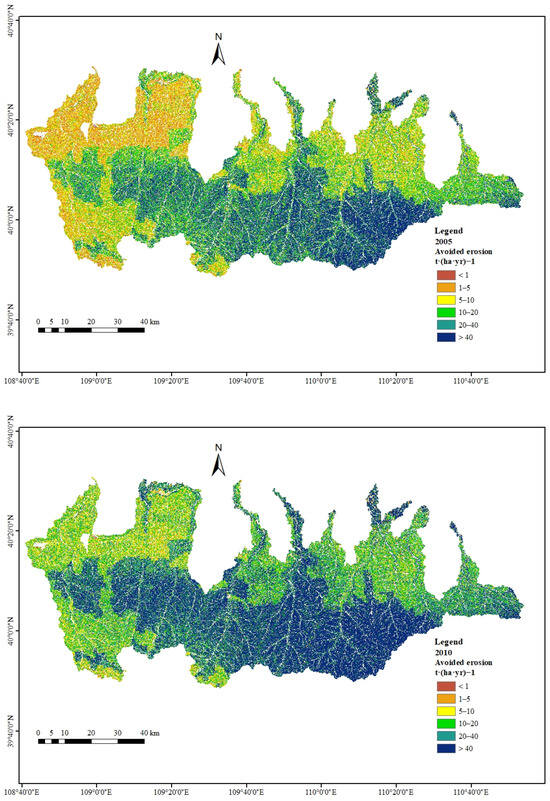
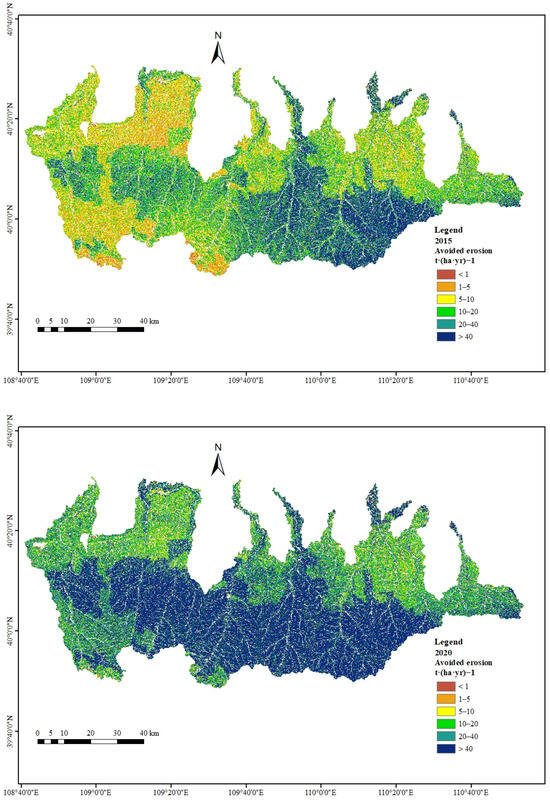
Figure 5.
Avoided erosion in the Ten Kongduis from 2000 to 2020.
3.6. Analysis of Factors Influencing Soil Conservation Services
Based on the previous analysis, we selected 2015, which had the smallest avoided erosion and avoided export values, 2020, which had the largest avoided erosion value, and 2000, which had the largest avoided export value, as the study objects.
For 2000, keeping the other parameters constant, the land use data were replaced with those in the years 2005, 2010, 2015, and 2020; similarly, keeping the other parameters constant, the rain erosivity factor was replaced with the values in 2005, 2010, 2015, and 2020, and the simulation results were obtained for each scenario, as shown in Table 3.

Table 3.
Simulation of soil conservation in the study area in 2000.
Based on the simulation results, we calculated the effects of the rain erosivity factor and land use data on soil conservation each year, and the results are shown in Table 4. It can be seen that the effect of rainfall was dominant and positive on both avoided erosion and avoided export, i.e., as the rain erosivity factor increased, the soil conservation value increased. The regression relationships between the rain erosivity factor and the values of avoided erosion and avoided export were significantly positive, with the relationship equations expressed as yavoided erosion = 0.093xRi − 1.42 (p < 0.001, R = 0.998) and yavoided export = 0.015xRi − 0.28 (p < 0.001, R = 0.998), respectively.

Table 4.
The effects of rain erosivity factors and land use data on soil conservation in 2000.
For 2015, the results of simulating soil conservation in the remaining years and the effects of the rain erosivity factor and land use on them are shown in Table 5 and Table 6, respectively.

Table 5.
Simulation of soil conservation in the study area in 2015.

Table 6.
The effects of rain erosivity factors and land use data on soil conservation in 2015.
In Table 6, it can be seen that the effect of rainfall was dominant and all positive, while the effect of land use on avoided export was increased. Statistical analysis showed that the rain erosivity factor was significantly and positively correlated with both avoided erosion and avoided export, with the relationship equations expressed as yavoided erosion = 0.094xRi − 1.46 (p < 0.001, R = 0.998) and yavoided export = 0.005xRi − 0.095 (p < 0.001, R = 0.998).
For 2020, the results of simulating soil conservation in the remaining years and the effects of the rain erosivity factor and land use on them are shown in Table 7 and Table 8, respectively.

Table 7.
Simulation of soil conservation in the study area in 2020.

Table 8.
The effects of rain erosivity factors and land use data on soil conservation in 2020.
As shown in Table 8, the rain erosivity factor continued to be the main positive influence on the soil conservation values, as in the simulations for 2000 and 2015. Statistical analysis yielded the relationships as yavoided erosion = 0.096xRi − 1.50 (p < 0.001, R = 0.998) and yavoided export = 0.005xRi − 0.10 (p < 0.001, R = 0.998).
It can also be seen that when the rainfall erosivity was maintained at its maximum in 2020, land use changes had a negative impact on avoided export. In contrast, when the rainfall erosivity was maintained at a smaller value in 2015, land use changes had a positive impact on avoided export (Table 6).
4. Discussions
It is worth mentioning that a common feature of these changes is that when the value of rainfall erosivity in the base year was greater than in the simulation year and the land use data were changed, the impact of land use on avoided export was negative, and when the value of rainfall erosivity in the base year was less than in the simulation year and the land use data were changed, the impact of land use on avoided export was positive. The impact of land use on avoided export was positive. Meanwhile, the effect of land use on avoided erosion was exactly the opposite of that of avoided export. The preliminary inference is that because barren land showed significant changes between years, while other land uses did not change significantly between years, when the rainfall erosivity was large, the high reduction in vegetation at this time eroded soil from the slopes, and the amount of soil erosion was much larger than the amount of sediment export. When the rainfall erosivity was small, the vegetation at this time mainly reduced the eroded soil entering the stream, and the difference between the soil erosion and sediment export decreased.
Based on the above analysis, it can be seen that the rain erosivity factor had a positive effect on soil conservation values, both for the years with the largest and smallest avoided erosion and avoided export values. The rain erosivity factor is a reflection of the ability of rainfall to strip, move, and scour the surface of the soil, showing the potential ability of rainfall to cause soil erosion and loss [6]; thus, it seems that the greater the rain erosivity factor, the greater the amount of soil erosion. Meanwhile, according to the definition of soil conservation, it can be seen that avoided erosion and avoided export are the avoidance of erosion and reduction in erosion, so they can be used to identify where sediment is trapped/retained in the landscape. In this way, it seems that the effect of rain erosivity on both should be negative. However, from the formulas for avoided erosion and avoided export, the two are sized by the difference between the RKLS and USLE. It appears that both the RKLS and USLE are directly proportional to the rainfall erosivity, i.e., the greater the rainfall erosivity, the greater the values of both the RKLS and USLE, when other factors are held constant. Therefore, it can be inferred that for the Ten Kongduis, the extent of the increase in the RKLS is greater than the extent of the increase in the USLE when the rainfall erosivity increases, and, at this time, the benefit of vegetation and good management practices is more pronounced. Where more erosion is created, more erosion is retained. Soil that has been eroded away from slopes under vegetation or other water conservation measures may not necessarily be transported to the stream channel in the current year; thus, focusing solely on protecting high-retention areas does not necessarily address where erosion occurs in the first place.
5. Conclusions
Based on the temporal and spatial changes in the rain erosivity factor, LULC types, and other multi-factors from 2000 to 2020, in this study, the temporal and spatial changes in the soil conservation values of the Ten Kongduis every five years from 2000 to 2020 could be obtained, including the avoided erosion and avoided export values, and we quantified the impacts of rainfall and LUCC on soil conservation values, which will help us to have a clearer understanding of soil erosion and the sediment transport process in the river basin. The conclusions are as follows:
- (1)
- The rain erosivity factor showed an increasing distribution from west to east in all years. Meanwhile, it varied considerably from year to year, with the largest being in 2020 and the smallest in 2005. The dominant LULC type in the Ten Kongduis was grassland, which was mainly distributed in the upstream area of the watershed, accounting for over 70% of the study area. Barren land was predominantly found in the middle reaches of the western watershed and significantly decreased from 2000 to 2020. Cropland was mainly located in the lower eastern watershed.
- (2)
- Both avoided erosion and avoided export varied considerably between the years. The minimum values of avoided erosion and avoided export were both in 2015, with values of 17.59 × 10⁶ t and 0.92 × 10⁶ t, respectively. The maximum value of avoided erosion was 57.03 × 10⁶ t in 2020 and that of avoided export was 4.08 × 10⁶ t in 2000. Spatially, avoided export was primarily found in the upper reaches of the east–central portion of the study area, and avoided erosion, with values of >40 t·(ha·yr)−1, was in the upper east–central portion of the study area, followed by the upper west–central portion. The difference in avoided erosion between upstream and downstream was larger in the western study area.
- (3)
- The effect of rainfall was dominant and positive on both avoided erosion and avoided export. The relationship between the rain erosivity factor and the values of avoided erosion and avoided export was significantly positive. When the rainfall erosivity was large, the high reduction in vegetation at this time eroded soil from the slopes. Conversely, the vegetation mainly reduced the eroded soil entering the stream.
Author Contributions
Writing—original draft preparation, X.H.; writing—review and editing, H.Y.; supervision, J.C. All authors have read and agreed to the published version of the manuscript.
Funding
This work was supported by the National Natural Science Foundation of China (42001009) and the Hebei Academy of Sciences High-level Talent Cultivation and Sponsorship Program (2023G01).
Data Availability Statement
Data will be made available on the request.
Conflicts of Interest
The authors declare that they have no known competing financial interests or personal relationships that could have appeared to influence the work reported in this paper.
References
- Rong, Y.J.; Li, K.; Guo, J.W.; Zheng, L.F.; Luo, Y.; Yan, Y.; Wang, C.X.; Zhao, C.L.; Shang, X.; Wang, Z.T. Multi-scale spatio-temporal analysis of soil conservation service based on MGWR model: A case of Beijing-Tianjin-Hebei, China. Ecol. Indic. 2022, 139, 108946. [Google Scholar] [CrossRef]
- Lu, S.J.; Duan, X.W.; Wei, S.Z.; Lin, H.H. An insight to calculate soil conservation service. Geogr. Sustain. 2022, 3, 237–245. [Google Scholar] [CrossRef]
- Zhao, W.; Liu, Y.; Daryanto, S.; Fu, B.; Wang, S.; Liu, Y. Metacoupling supply and demand for soil conservation service. Curr. Opin. Environ. Sustain. 2018, 33, 136–141. [Google Scholar] [CrossRef]
- Borrelli, P.; Robinson, D.A.; Fleischer, L.R.; Lugato, E.; Ballabio, C.; Alewell, C.; Meusburger, K.; Modugno, S.; Schutt, B.; Ferro, V.; et al. An assessment of the global impact of 21st century land use change on soil erosion. Nat. Commun. 2017, 8, 2013. [Google Scholar] [CrossRef] [PubMed]
- Montanarella, L.; Pennock, D.J.; McKenzie, N.; Badraoui, M.; Chude, V.; Baptista, I.; Mamo, T.; Yemefack, M.; Singh Aulakh, M.; Yagi, K.; et al. World’s soils are under threat. Soil 2016, 2, 79–82. [Google Scholar] [CrossRef]
- Xu, X.J.; Yan, Y.J.; Dai, Q.H.; Yi, X.S.; Hu, Z.Y.; Cen, L.P. Spatial and temporal dynamics of rainfall erosivity in the karst region of southwest China: Interannual and seasonal changes. Catena 2023, 221, 106763. [Google Scholar] [CrossRef]
- Sartori, M.; Philippidis, G.; Ferrari, E.; Borrelli, P.; Lugato, E.; Montanarella, L.; Panagos, P. A linkage between the biophysical and the economic Assessing the global market impacts of soil erosion. Land Use Policy 2019, 86, 299–312. [Google Scholar] [CrossRef]
- Liu, C.; Zhang, X.; Wang, T.; Chen, G.; Zhu, K.; Wang, Q.; Wang, J. Detection of vegetation coverage changes in the Yellow River Basin from 2003 to 2020. Ecol. Indic. 2022, 138, 108818. [Google Scholar] [CrossRef]
- Mekonnen, M.; Keesstra, S.D.; Stroosnijder, L.; Baartman, J.E.M.; Maroulis, J. Soil Conservation Through Sediment Trapping: A Review. Land Degrad. Dev. 2015, 26, 544–556. [Google Scholar] [CrossRef]
- Ma, X.F.; Zhu, J.T.; Yan, W.; Zhao, C.Y. Assessment of soil conservation services of four river basins in Central Asia under global warming scenarios. Geoderma 2020, 375, 114533. [Google Scholar] [CrossRef]
- Wang, X.; Liu, G.; Lin, D.; Lin, Y.; Lu, Y.; Xiang, A.; Xiao, S. Water yield service influence by climate and land use change based on InVEST model in the monsoon hilly watershed in South China. Geomat. Nat. Hazards Risk 2022, 13, 2024–2048. [Google Scholar] [CrossRef]
- Zhang, J.G.; Li, X.; Li, J.J.; Chang, F.Y. Distribution characteristics and control countermeasures of soil and water loss in Ten Kongduis of Yellow River. Bull. Soil Water Conserv. 2023, 43, 159–164, (In Chinese with English abstract). [Google Scholar]
- Chi, J.M.; Liu, D.J.; Yu, Y.; Zhu, R.P. Effects of land-use changes on soil erosion in Ten Tributaries of the Yellow River Basin. J. Sediment Res. 2023, 48, 16–23, (In Chinese with English abstract). [Google Scholar]
- Natural Capital Project. InVEST 3.14.1; Stanford University, University of Minnesota, Chinese Academy of Sciences, The Nature Conservancy, World Wildlife Fund, Stockholm Resilience Centre and the Royal Swedish Academy of Sciences: San Francisco, CA, USA, 2023. [Google Scholar]
- Gashaw, T.; Bantider, A.; Zeleke, G.; Alamirew, T.; Jemberu, W.; Worglul, A.W.; Dile, Y.T.; Bewket, W.; Meshesha, D.T.; Adem, A.A.; et al. Evaluating InVEST model for estimating soil loss and sediment export in data scarce regions of the Abbay (Upper Blue Nile) Basin: Implications for land managers. Environ. Chall. 2021, 5, 100381. [Google Scholar] [CrossRef]
- Qiao, X.R.; Li, Z.J.; Lin, J.K.; Wang, H.J.; Zheng, S.W.; Yang, S.Y. Assessing current and future soil erosion under changing land use based on InVEST and FLUS models in the Yihe River Basin, North China. Int. Soil Water Conserv. Res. 2023, 12, 298–312. [Google Scholar] [CrossRef]
- De Vente, J.; Poesen, J.; Verstraeten, G.; Govers, G.; Vanmaercke, M.; Van Rompaey, A.; Arabkhedri, M.; Boix-Fayos, C. Predicting soil erosion and sediment yield at regional scales: Where do we stand? Earth-Sci. Rev. 2013, 133, 94. [Google Scholar] [CrossRef]
- Betrie, G.D.; Mohamed, Y.A.; van Griensven, A.; Srinivasan, R. Sediment management modelling in the Blue Nile Basin using SWAT model. Hydrol. Earth Syst. Sci. 2011, 15, 807. [Google Scholar] [CrossRef]
- Haregeweyn, N.; Yohannes, F. Testing and evaluation of the agricultural non-point source pollution model (AGNPS) on Augucho catchment, western Hararghe, Ethiopia. Agric. Ecosyst. Environ. 2003, 99, 201–212. [Google Scholar] [CrossRef]
- Hengsdijk, H.; Meijerink, G.; Mosugu, M. Modeling the effect of three soil and water conservation practices in Tigray, Ethiopia. Agric. Ecosyst. Environ. 2005, 105, 29–40. [Google Scholar] [CrossRef]
- Sharp, R.; Douglass, J.; Wolny, S.; Arkema, K.; Bernhardt, J.; Bierbower, W.; Chaumont, N.; Denu, D.; Fisher, D.; Glowinski, K.; et al. InVEST 3.9.0. User’s Guide. The Natural Capital Project; Stanford University, University of Minnesota, The Nature Conservancy, and World Wildlife Fund: San Francisco, CA, USA, 2020. [Google Scholar]
- Hamel, P.; Chaplin-Kramer, R.; Sim, S.; Mueller, C. A new approach to modeling the sediment retention service (InVEST 3.0): Case study of the Cape Fear catchment, North Carolina, USA. Sci. Total Environ. 2015, 524–525, 166–177. [Google Scholar] [CrossRef]
- Hamel, P.; Falinski, K.; Sharp, R.; Auerbach, D.A.; Sánc-hez-Canales, M.; Dennedy-Frank, P.J. Sediment delivery modeling in practice: Comparing the effects of watershed characteristics and data resolution across hydro-climatic regions. Sci. Total Environ. 2017, 580, 1381–1388. [Google Scholar] [CrossRef] [PubMed]
- Ayana, E.K.; Fisher, J.R.B.; Hamel, P.; Boucher, T.M. Identification of ditches and furrows using remote sensing: Application to sediment modelling in the Tana watershed, Kenya. Int. J. Remote Sens. 2017, 38, 4611–4630. [Google Scholar] [CrossRef]
- Zhou, M.; Deng, J.; Lin, Y.; Belete, M.; Wang, K.; Comber, A.; Huang, L.; Gan, M. Identifying the effects of land use change on sediment export: Integrating sediment source and sediment delivery in the Qiantang River Basin, China. Sci. Total Environ. 2019, 689, 38–49. [Google Scholar] [CrossRef] [PubMed]
- Ayt, O.H.; Khebiza, M.Y.; Messouli, M.; Bounoua, L.; Karmaoui, A. Delineation of vulnerable areas to water erosion in a mountain region using SDR InVEST model: A case study of the Ourika watershed, Morocco. Sci. Afr. 2020, 10, e00646. [Google Scholar]
- Marques, S.M.; Campos, F.S.; David, J.; Cabral, P. Modelling sediment retention services and soil erosion changes in Portugal: A spatial-temporal approach. ISPRS Int. J. Geo-Inf. 2021, 10, 262. [Google Scholar] [CrossRef]
- Yang, H.; Shi, C.X. Basin form characteristics, causes and implications of the ten kongduis in the upper reaches of the Yellow River. Quat. Int. 2017, 453, 15–23. [Google Scholar] [CrossRef]
- Fang, H. Impact of land use changes on catchment soil erosion and sediment yield in the northeastern China: A panel data model application. Int. J. Sediment Res. 2020, 35, 540–549. [Google Scholar] [CrossRef]
- Renard, K.; Foster, G.; Weesies, G.; McCool, D.; Yoder, D. Predicting Soil Erosion by Water: A Guide to Conservation Planning with the Revised Universal Soil Loss Equation (RUSLE); Agriculture Handbook No. 703; U.S. Department of Agriculture: Washington, DC, USA, 1997.
- Yang, F.B.; Lu, C.H. Spatiotemporal variation and trends in rainfall erosivity in China’s dryland region during 1961–2012. Catena 2015, 133, 362–372. [Google Scholar] [CrossRef]
- Xie, Y.; Liu, B.Y.; Zhang, W.B. Study on standard of erosive rainfall. J. Soil Water Conserv. 2000, 14, 6–11, (In Chinese with English abstract). [Google Scholar]
- Zhang, W.B.; Xie, Y.; Liu, B.Y. Rainfall erosivity estimation using daily rainfall amounts. Sci. Geogr. Sin. 2002, 22, 705–711, (In Chinese with English abstract). [Google Scholar]
- Williams, J.R. The EPIC model. In Computer Models of Watershed Hydrology; Singh, V.P., Ed.; Water Resources Publications, Highlands Ranch CO.: Littleton, CO, USA, 1995; pp. 909–1000. [Google Scholar]
- Zhang, K.L.; Peng, W.Y.; Yang, H.L. Soil erodibility and its estimation for agricultural soil in China. Acta Pedol. Sin. 2007, 44, 7–13, (In Chinese with English abstract). [Google Scholar] [CrossRef]
- Desmet, P.J.J.; Govers, G. A GIS procedure for automatically calculating the USLE LS factor on topographically complex landscape units. J. Soil Water Conserv. 1996, 51, 427–433. [Google Scholar]
- Cai, C.; Ding, S.; Shi, Z.; Huang, L.; Zhang, G. Study of Applying USLE and Geographical Information System IDRISI to Predict Soil Erosion in Small Watershed. J. Soil Water Conserv. 2000, 2, 19–24. [Google Scholar]
- Carlson, T.N.; Ripley, D.A. On the relation between NDVI, fractional vegetation cover, and leaf area index. Remote Sens. Environ. 1997, 62, 241–252. [Google Scholar] [CrossRef]
- Ge, J.; Meng, B.P.; Liang, T.G.; Feng, Q.S.; Gao, J.L.; Yang, S.X.; Huang, X.D.; Xie, H.J. Modeling alpine grassland cover based on MODIS data and support vector machine regression in the headwater region of the Huanghe River, China. Remote Sens. Environ. 2018, 218, 162–173. [Google Scholar] [CrossRef]
- An, Y.M.; Zhao, W.W.; Li, C.J.; Ferreira, C.S.S. Temporal changes on soil conservation services in large basins across the world. Catena 2022, 209, 105793. [Google Scholar] [CrossRef]
- McKague, K. Universal Soil Loss Equation (USLE). OMAFRA: USLE Fact Sheet. 2023. Available online: https://files.ontario.ca/omafra-universal-soil-loss-equation-23-005-en-2023-03-02.pdf (accessed on 9 October 2024).
- Vigiak, O.; Borselli, L.; Newham, L.T.H.; Mcinnes, J.; Roberts, A.M. Comparison of conceptual landscape metrics to define hillslope-scale sediment delivery ratio. Geomorphology 2012, 138, 74–88. [Google Scholar] [CrossRef]
- Yang, H.; Shi, C.X.; Cao, J.S. A field Investigation on gully erosion and implications for changes in sediment delivery processes in some tributaries of the upper Yellow River in China. ISPRS Int. J. Geo-Inf. 2022, 11, 288. [Google Scholar] [CrossRef]
Disclaimer/Publisher’s Note: The statements, opinions and data contained in all publications are solely those of the individual author(s) and contributor(s) and not of MDPI and/or the editor(s). MDPI and/or the editor(s) disclaim responsibility for any injury to people or property resulting from any ideas, methods, instructions or products referred to in the content. |
© 2024 by the authors. Licensee MDPI, Basel, Switzerland. This article is an open access article distributed under the terms and conditions of the Creative Commons Attribution (CC BY) license (https://creativecommons.org/licenses/by/4.0/).