Article

Using a Triple Sensor Collocation Approach to Evaluate Small-Holder Irrigation Scheme Performances in Northern Ethiopia

by
Amina Abdelkadir Mohammedshum
1,2,*,
Ben H. P. Maathuis
1,
Chris M. Mannaerts
1 and
Daniel Teka
3
1
Faculty of Geo-Information Science and Earth Observation (ITC), University of Twente, Hallenweg 8, 7522 NH Enschede, The Netherlands
2
Institute of Geo-Information and Earth Observation Sciences (I-GEOS), Mekelle University, Mekelle P.O. Box 231, Ethiopia
3
Department of Land Resource Management and Environmental Protection (LaRMEP), Mekelle University, Mekelle P.O. Box 231, Ethiopia
*
Author to whom correspondence should be addressed.
Water 2024, 16(18), 2638; https://doi.org/10.3390/w16182638
Submission received: 11 July 2024 / Revised: 13 September 2024 / Accepted: 14 September 2024 / Published: 17 September 2024

Abstract

:
This study uses a triple-sensor collocation approach to evaluate the performance of small-holder irrigation schemes in the Zamra catchment of Northern Ethiopia. Crop water productivity (CWP), as an integrator of biomass production and water use, was used to compare the overall efficiencies of three types of irrigation systems: traditional and modern diversions, and dam-based irrigation water supply. Farmer-reported data often rely on observations, which can introduce human estimation and measurement errors. As a result, the evaluation of irrigation scheme performance has frequently been insufficient to fully explain crop water productivity. To overcome the challenges of using one single estimation method, we used a triple-sensor collocation approach to evaluate the efficiency of three small-scale irrigation schemes, using water productivity as an indicator. It employed three independent methods: remotely sensed data, a model-based approach, and farmer in-situ estimates to assess crop yields and water consumption. To implement the triple collocation appraisal, we first applied three independent evaluation methods, i.e., remotely sensed, model-based, and farmer in-situ estimates of crop yields and water consumption, to assess the crop water productivities of the systems. Triple-sensor collocation allows for the appraisal and comparison of estimation errors of measurement sensor systems, and enables the ranking of the estimators by their quality to represent the de-facto unknown true value, in our case: crop yields, water use, and its ratio CWP, in small-holder irrigated agriculture. The study entailed four main components: (1) collecting in-situ information and data from small-holder farmers on crop yields and water use; (2) derivation of remote sensing-based CWP from the FAO WaPOR open database and time series; (3) evaluation of biomass, crop yields and water use (evapotranspiration) using the AquaCrop model, integrating climate, soil data, and irrigation management practices; (4) performing and analysis of a categorical triple collocation analysis of the independent estimator data and performance ranking of the three sensing and small-holder irrigation systems. Maize and vegetables were used as main crops during three consecutive irrigation seasons (2017/18, 2018/19, 2019/20). Civil war prevented further field surveying, in-situ research, and data collection. The results indicate that remote sensing products are performed best in the modern and dam irrigation schemes for maize. For vegetables, AquaCrop performed best in the dam irrigation scheme.

1. Introduction

Irrigation-led agricultural development has been a primary focus for many developing countries, aiming to enhance food production and self-sufficiency [1,2]. Ineffective utilization of irrigation water remains an issue in many irrigation schemes in Tigray, Ethiopia. Studies conducted by [1,3] corroborate this concern, their study being done for different dams in Tigray. Their findings suggest that existing irrigation schemes in Tigray operate at less than 50% efficiency, with over 50% of the water lost due to evaporation, seepage, and poor irrigation materials [3]. No comprehensive studies have been conducted in the study area to assess water use efficiency and productivity in the existing irrigation schemes, as highlighted by [1,4]. Enhancing water use efficiency and improving agricultural water productivity are crucial considerations, especially in water-scarce areas [5]. Water productivity, defined as the crop yield or biomass ratio to actual evapotranspiration (ETa), is a vital indicator for evaluating the efficiency of irrigation schemes [6,7]. In addition, according to [5,8], crop water productivity is defined as the ratio of the mass of the product (either grain or biomass) to the amount of water consumed. Agricultural biomass or production can be quantified in kilograms or measured by income, locally expressed in Ethiopian Birr [5,9].
A review of the literature generally shows three major approaches for evaluating crop water productivity: (1) modeling with e.g., the FAO AquaCrop model; (2) satellite remote sensing-based, e.g., WaPOR; and (3) field assessments from local farmers and experiments. (1) Numerous studies have been conducted to monitor crop water productivity using the AquaCrop model [10,11,12,13,14]. AquaCrop is a water productivity yield model that simulates above-ground biomass production in exchange for water transpired by the crop [14]. It has been reliably calibrated and evaluated for various common crops, including maize [5,11,12]. Researchers have utilized the AquaCrop model to assess water management by evaluating water use efficiency. Compared to other crop models [12], it is claimed that AquaCrop requires less explicit parameters. However, as highlighted by [14], it is essential to note that the effectiveness of the AquaCrop model is strongly influenced by factors such as the availability of inputs like climate and soil type. (2) In recent studies, several researchers have employed satellite remote sensing-based products accessible through the FAO Water Productivity Open Access Portal (WaPOR) to evaluate crop water productivity. For instance, [15,16,17,18,19] have developed methodologies to derive crop water productivity (CWP) from the WaPOR time series data for assessing the performance of irrigation schemes. However, limitations are present within the WaPOR database, such as concerns about the quality of remote sensing (RS) images and spatial variability resulting from low resolution, as highlighted by [15,17]. Also, the use of remote sensing for predicting irrigation water demand is challenged by uncertainties in the spatial and temporal resolutions of remote sensing data [20]. (3) The local farmers’ assessments were used to collect yield. As indicated by [9,21], yields were obtained from agricultural offices and field sites. However, it is important to note that farmer-reported yields may also be subject to errors [7]. Additionally, according to [5], data collection involves a combination of direct measurements and interviews conducted with farmers and local experts. However, farmer-reported data often depend on observations, which can introduce human estimation and measurement errors. As a result, the performance of irrigation schemes was rarely judged sufficient to explain crop water productivity.
To overcome the challenges of using one single estimation method, we used a triple-sensor collocation approach to evaluate the efficiency of three types of small-scale irrigation schemes, using water productivity as an indicator. Triple collocation is considered a fundamental method on a universal scale and is a powerful approach for integrating product analysis in regions with limited data availability [22]. Categorical triple collocation can be used to identify the most accurate measurement system at a particular location, and it is estimated from three collocated datasets [23,24,25,26]. Moreover, categorical triple collocation ranks the three measurement systems based on their measurements of a categorical variable [23,24,26]. It is more appropriate to describe remote sensing-derived information by comparison with farmer in-situ and model estimates rather than those based only on one approach. Therefore, by comparing the strengths of model-based analysis, farmer in-situ data, and satellite observations, a more robust assessment of crop performance can be achieved. No study has yet evaluated irrigation scheme performances using the triple-sensor collocation approach, which integrates satellite data, modeling techniques, and farmer in-situ data.
The present paper applies triple collocation to compare crop water productivity and performance estimates from three small-scale irrigation areas in Northern Ethiopia, using the independent water productivity estimates: farmer in-situ, satellite, and the crop growth model. (1) Data collected from the farmer’s yields and water use; (2) CWP derived from the RS-based WaPOR time series data using the yield and the actual evapotranspiration and interception (ETIa); (3) water productivity or water use efficiency derived with the AquaCrop model using available climate data, soil data, irrigation management practice, and using as main crop types maize and vegetables (onion and pepper); (4) running categorical triple collocation analysis to rank the best approach from the three independent estimates. We believe that these consecutive steps can lead to an improved estimate and estimation of irrigation scheme performance.

2. Study Areas and Dataset

2.1. Study Area

The study was conducted in three small-scale irrigation schemes in the Zamra catchment, a tributary of the Tekeze sub-basin in Northern Ethiopia. The Tekeze sub-basin has a total area of 82,350 km2, and the Zamra catchment has an area of 1588 km2 (Figure 1). The elevation of the catchment varies from 1248 m to 3542 m above sea level (m a.s.l).
The climatic conditions in the Tigray region are mainly semi-arid [27]. Most parts of the study area lie between altitudinal ranges of 1500–2300 m above sea level, with a predominantly sub-humid climate. Rainfall in the Tigray region is erratic, and heavy rains sometimes cause flooding [1]. The primary rainfall season lasts from June to mid-September, with some areas obtaining rainfall from February to May. The annual precipitation values for 2010–2021 in the Zamra catchment were analyzed using the Climate Hazards Group InfraRed Precipitation with the Station (CHIRPS) available within the WaPOR database [28], resulting in an average annual precipitation of 600 mm. The minimum and maximum annual precipitation over the analysis period was 514 mm and 715 mm, respectively.

2.2. Datasets

2.2.1. Field Survey

The data collected, such as water productivity, yield, and irrigated area, for the irrigation season from December to May (2017/18, 2018/19, and 2019/20), were collected from survey data [29]. In addition, the water consumption in each irrigation scheme was assessed using Parshall flumes, which measured the volume of water used per hectare (m3/ha). However, civil war prevented further field surveying, in-situ research, and data collection.

2.2.2. Climate Data

The in-situ climate data were sourced from the Ethiopian Education Network to Support Agricultural Transformation (EENSAT) project’s automatic weather stations (AWS) within the Zamra catchment [30]. These stations were positioned at 3.9 km, 5.6 km, and 5.4 km from the traditional diversion, modern diversion, and dam irrigation schemes, respectively. The recorded variables included precipitation, temperature, relative humidity, wind speed, and solar radiation. Appendix A data were obtained from the weather station of Mekelle airport, acquired from the Ethiopia National Meteorological Agency (NMA).

2.2.3. Soil Data

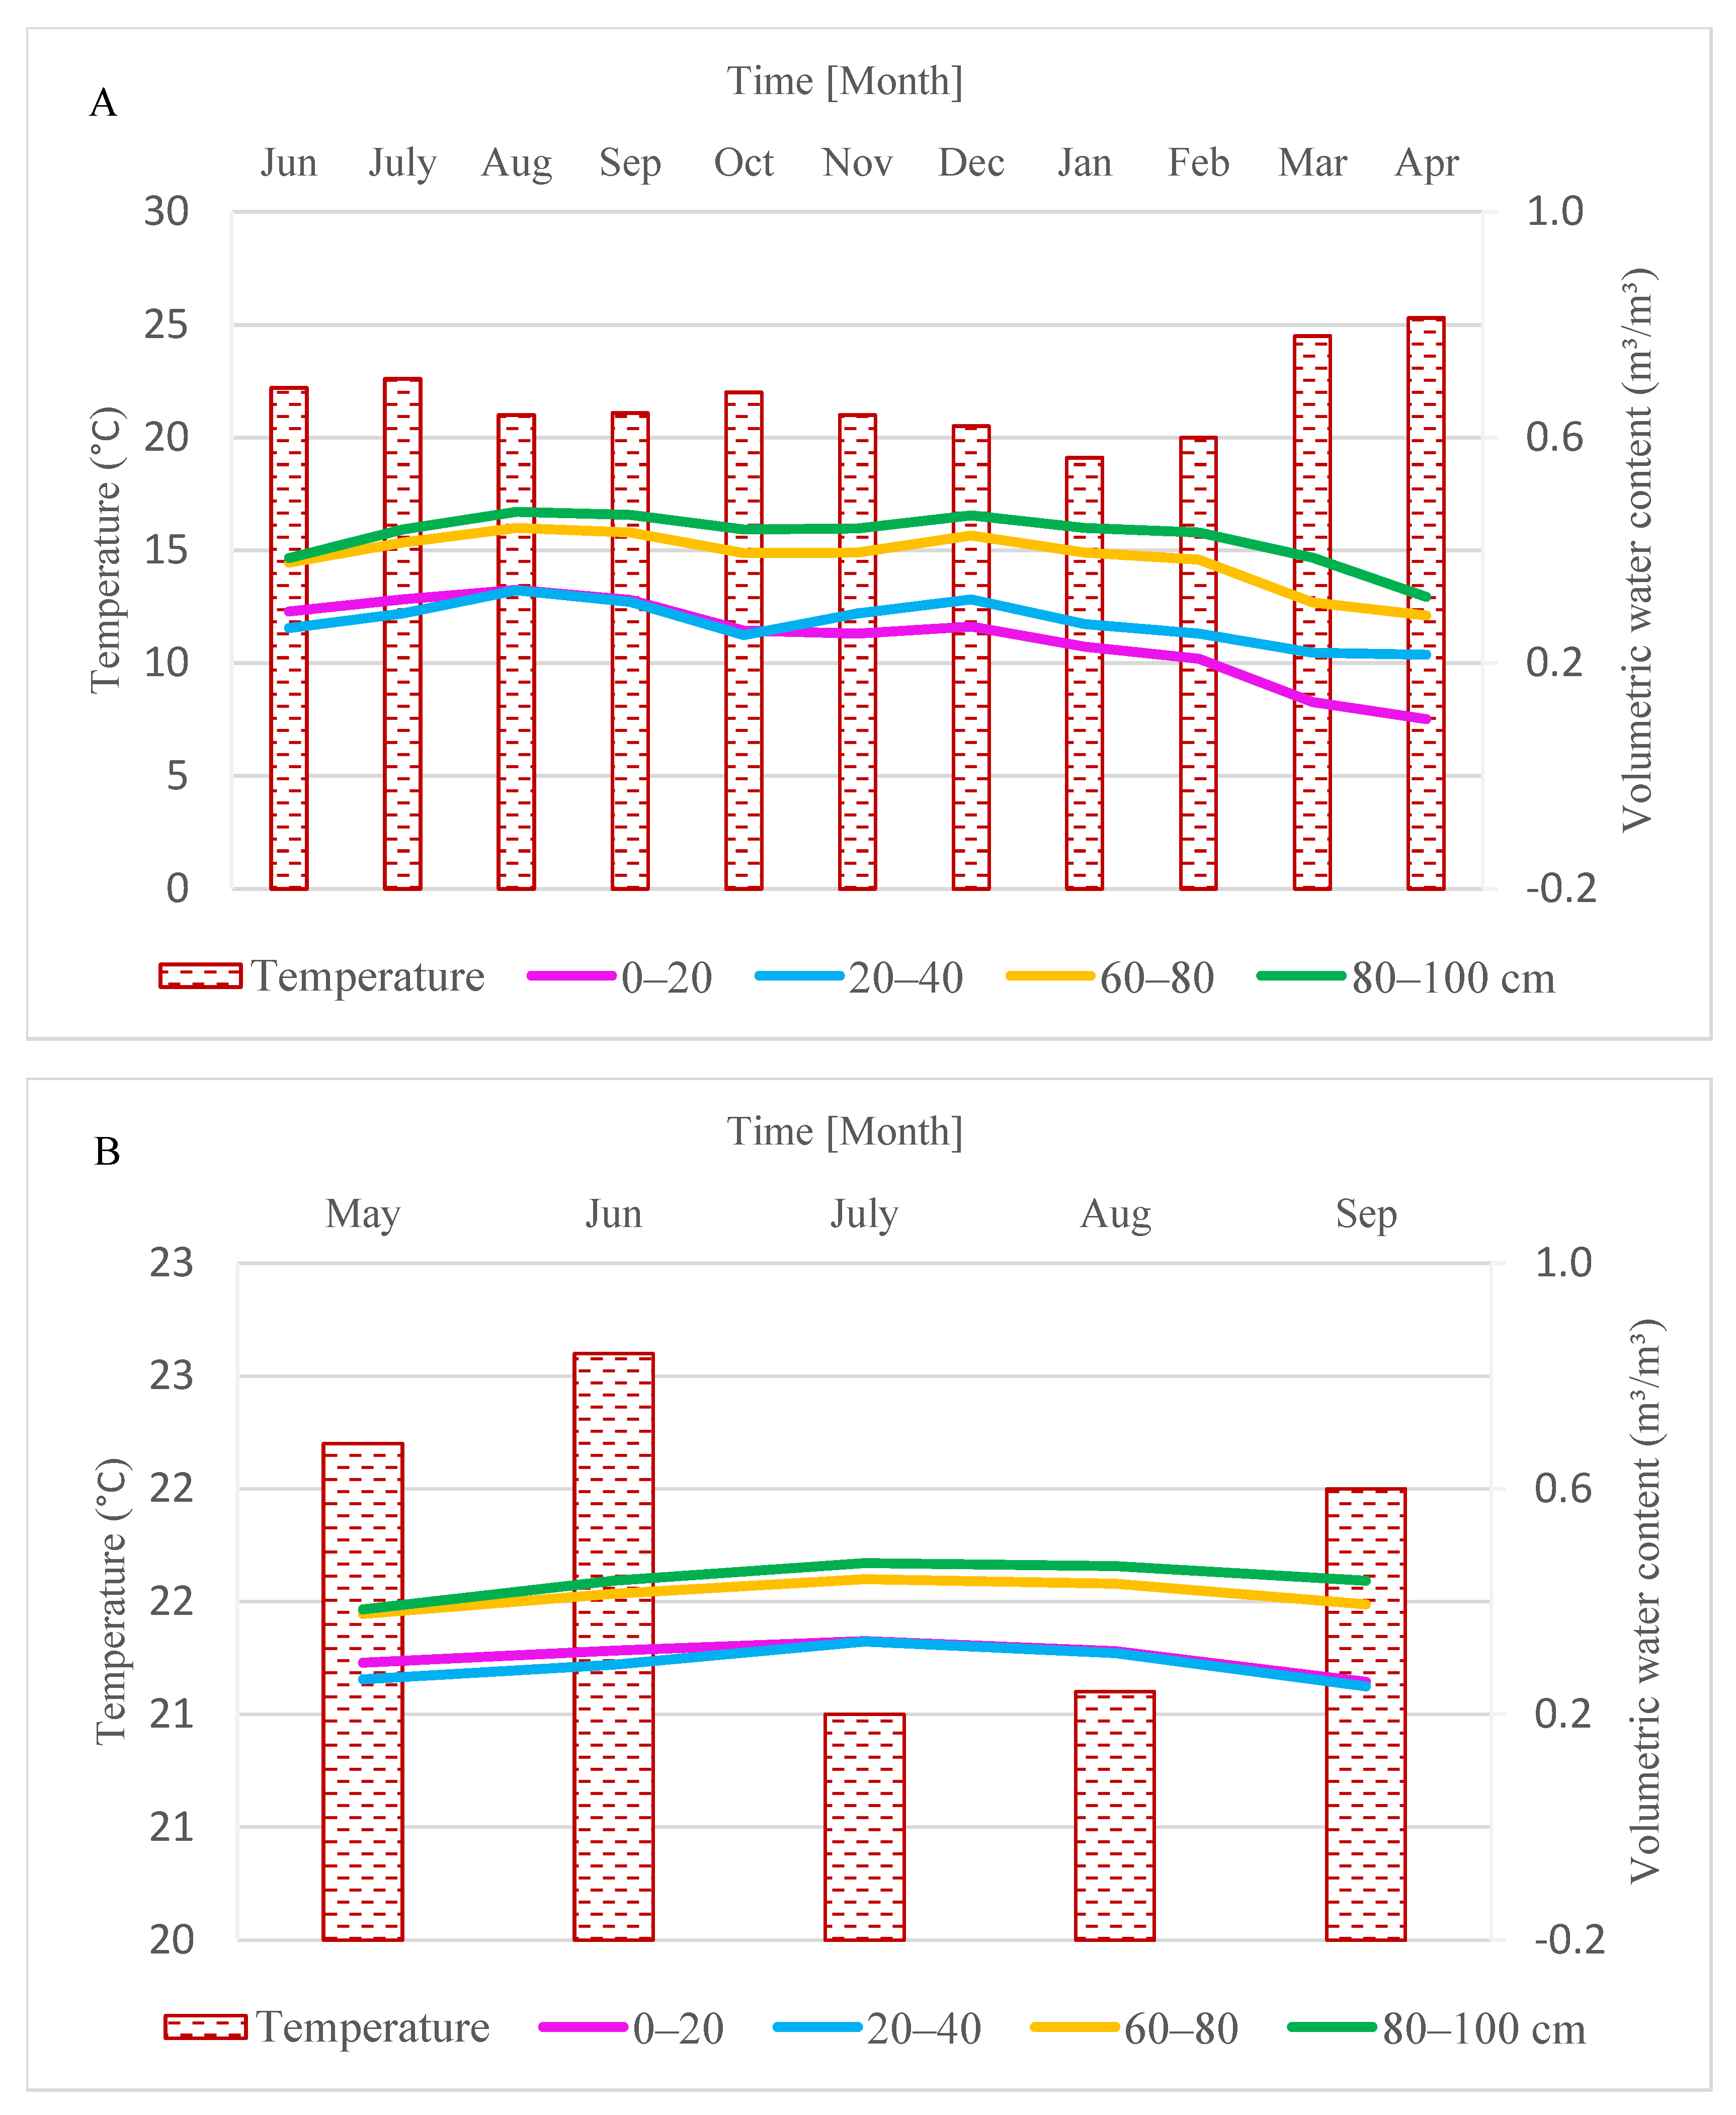
5TE soil moisture sensors [31] were installed and measured temperature and volumetric water content (VWC) in the irrigation schemes (Figure A1A,B). During the sensors’ installation, soil samples were collected for laboratory analysis of physical soil properties (refer to Table A1). The soil laboratory analysis was conducted for the irrigation schemes. Parameters assessed during the analysis included soil texture, field capacity (FC), permanent wilting point (PWP), available water (AW), hydraulic conductivity (HC), bulk density (BD), moisture content (MC), and particle density (PD). In the top layer of the soil (0–20 cm depth), the recorded volumetric water content (VWC) showed consistently low values starting from the end of October (refer to Figure A1A). Conversely, in the middle and lower layers of the soil, the VWC exhibited higher values. High temperatures in April caused a decrease in volumetric water content in the upper soil layers due to increased evaporation, which reduced the soil’s moisture levels.

2.2.4. Crop Data and Irrigation Methods Management Practice

From mid-December to March, different crops are planted, and, in general, the crop is harvested in April. Crops like maize, onion, tomato, and pepper are grown during the irrigation season. Furrow irrigation methods were consistently utilized across these schemes. Additional information on irrigation management practices was gathered through field visits and discussions with local farmers and extension workers, providing valuable insights into agricultural practices within the area. For instance, the sowing dates for maize typically occur two weeks earlier than for vegetables across all sites.

2.2.5. Remote Sensing-Based Data

WaPOR time series data are obtained from the FAO WaPOR water productivity portal. The time series data available at https://wapor.apps.fao.org/home/WAPOR_2/2 (accessed on 20 December 2023) was used to calculate CWP. The data used for this study were Level 2 data with 100 m spatial and dekadal temporal resolutions [32].

3. Methodology

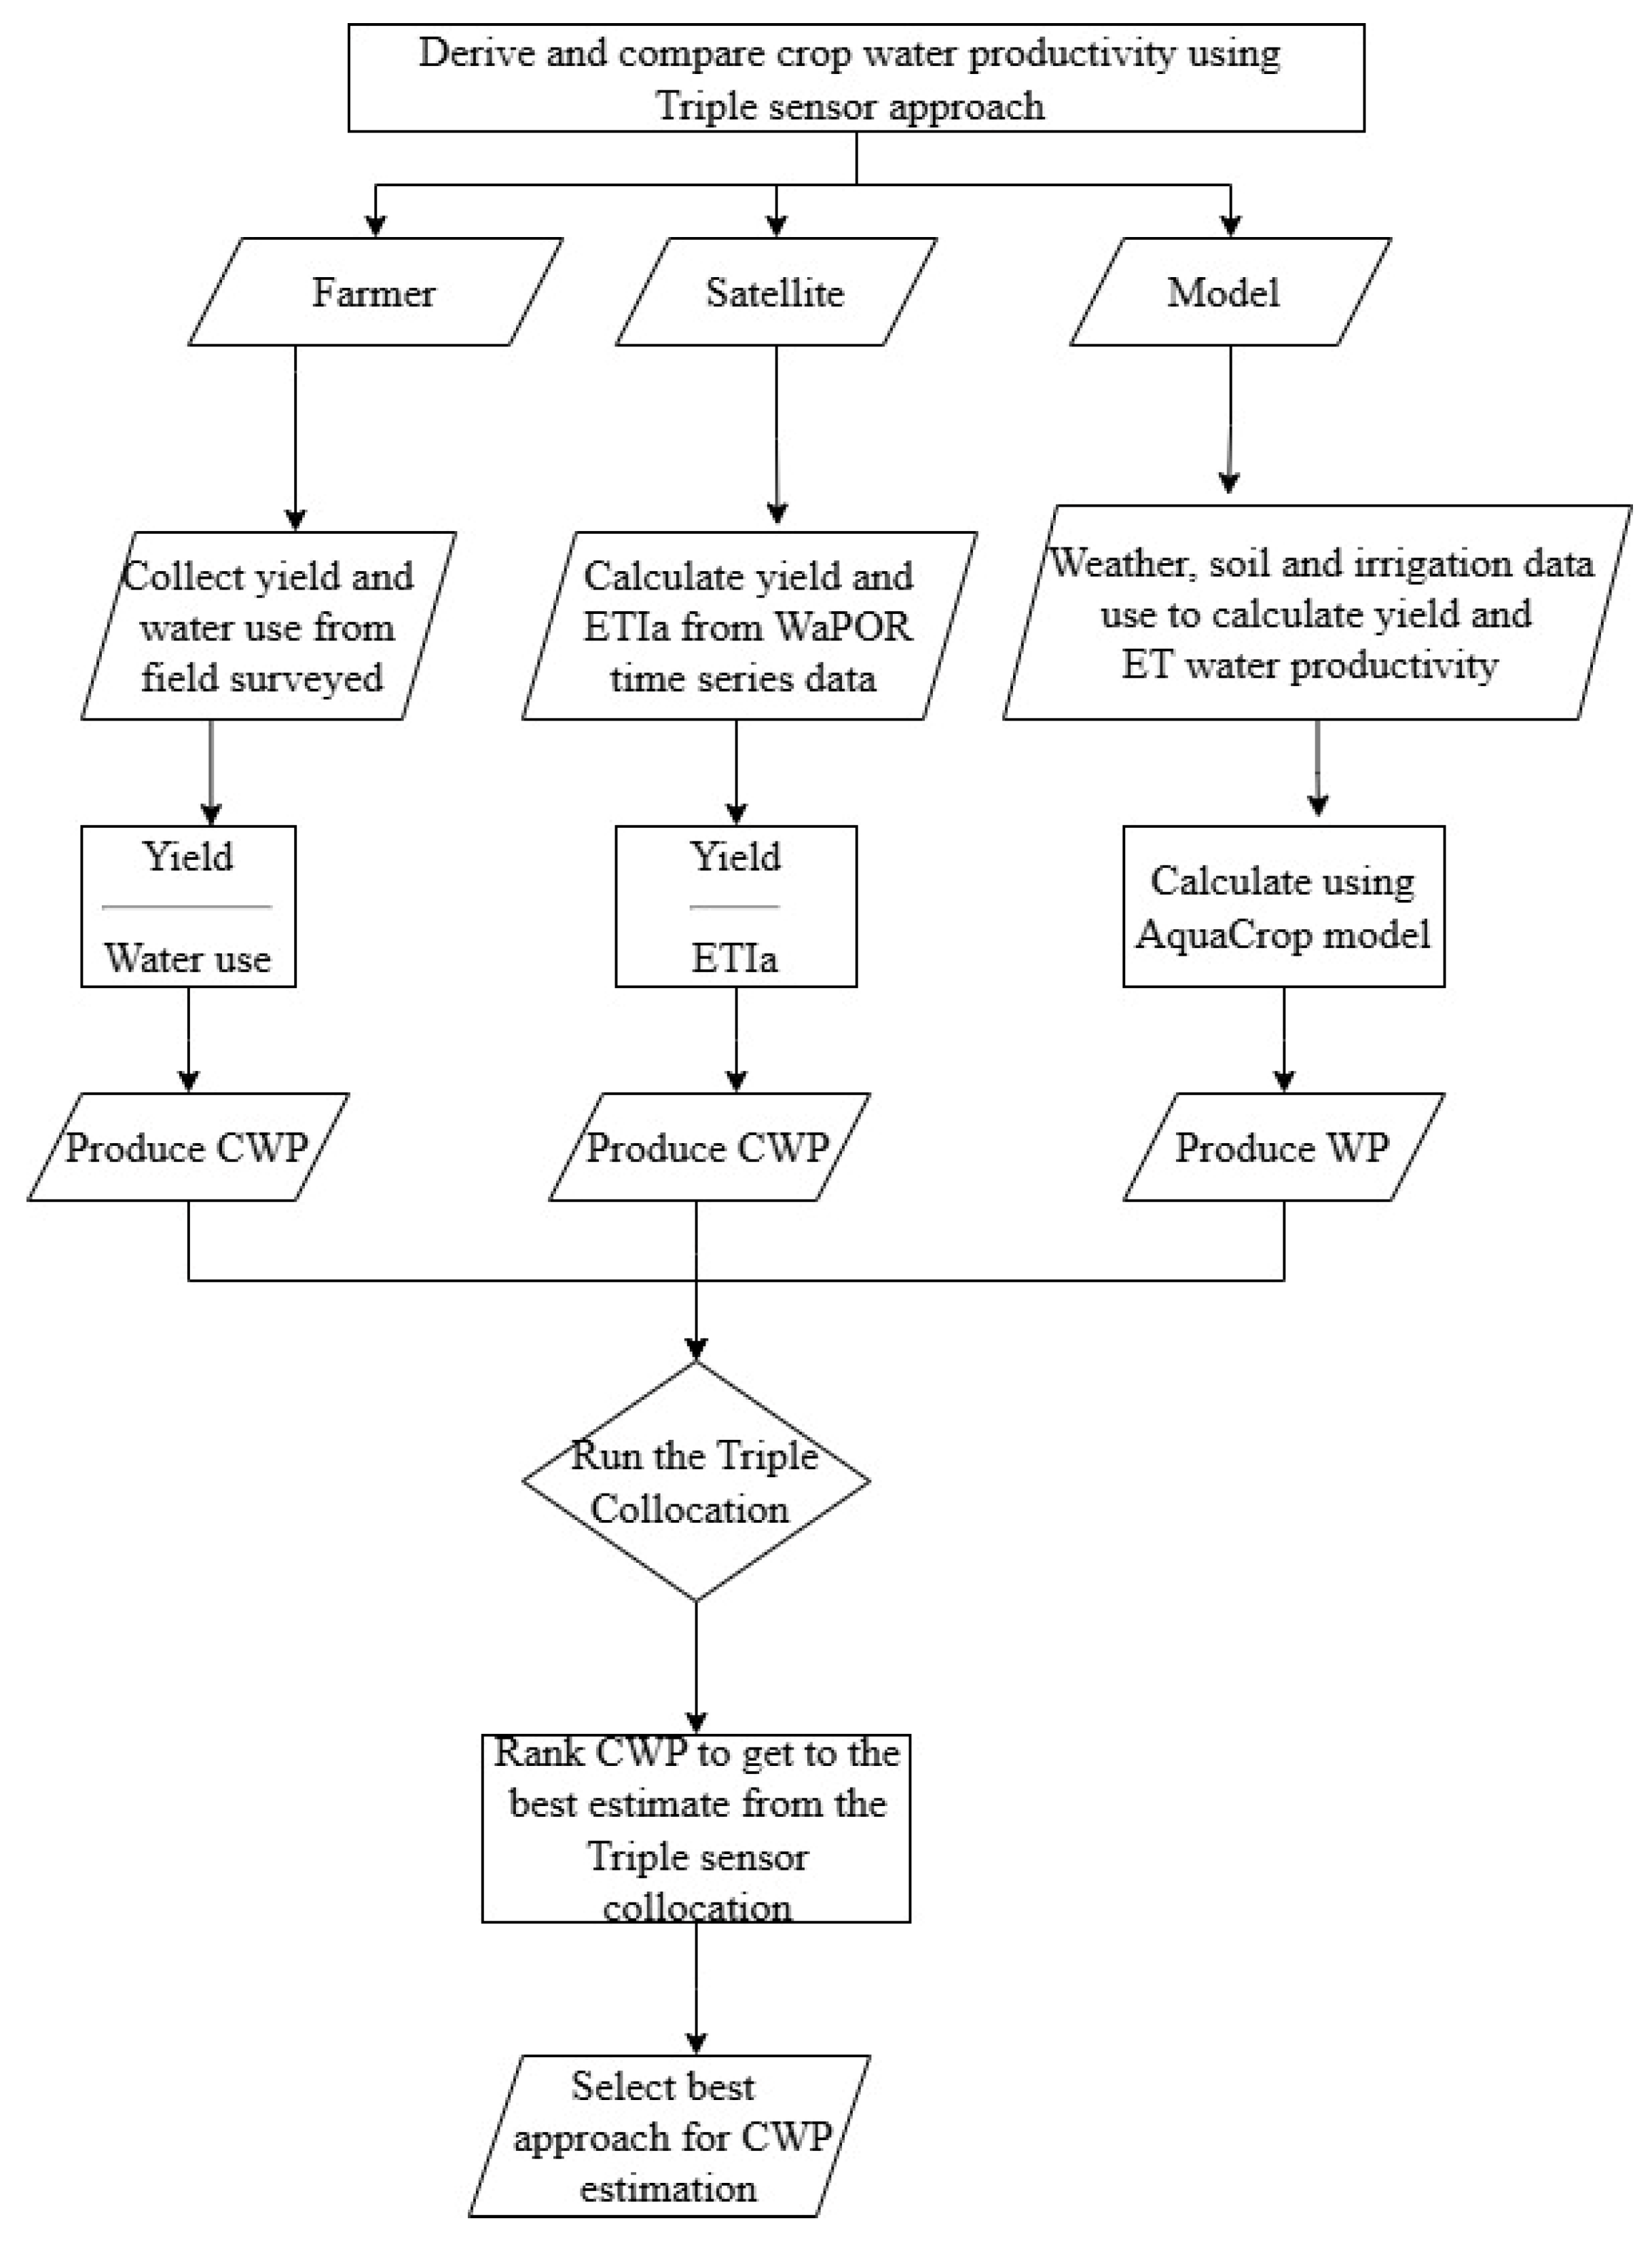
Crop water productivity was used as a proxy for assessing the irrigation scheme performance in the study area. The approach, as shown in Figure 2, summarizes the methodological approach for evaluating crop water productivity using triple-sensor collocation. Initially, water productivity was derived from field data collected directly from farmers, incorporating yield and water use information. Secondly, crop water productivity was derived from WaPOR time series data via yield and actual evapotranspiration and interception (ETIa). Thirdly, the water productivity was computed utilizing the AquaCrop model. Fourthly, the triple collocation analysis was conducted to identify the best estimate from the triple sensor and to select a reliable estimate for crop water productivity.

3.1. Sensor 1: Farmer In-Situ Observations

Crop water productivity was derived from survey data [29], utilizing the collected yield (kg) and water use (m3). The yield calculation for maize and vegetables involved averaging the result (kg) per area (ha). Water use was determined by measuring the amount of water used per hectare (m3/ha). Table 1 presents the average yields and water usage for maize and vegetables across three irrigation seasons, per irrigation schemes categorized as traditional, modern, and dam sources.
Crop water productivity
The crop water productivity (CWP) was calculated using the ratio of average yield (kg) to water use (m3), as per (Equation (1)):
C W P = A v e r a g e y i e l d W a t e r u s e

3.2. Sensor 2: Remote Sensing-Based CWP

Crop water productivity was calculated using the WaPOR time series data [33,34], specifically by computing the yield ratio to ETIa. This method, validated in multiple studies [15,16,17,18,19], has proven effective in assessing crop water productivity and monitoring irrigation schemes.
Actual Evapotranspiration and Interception
Actual Evapotranspiration and Interception are the sums of soil evaporation (E), canopy transpiration (T), and interception (I) [32,33]. ETIa values can be converted into volume for a specific area, e.g., 1 mm = 10 m3/ha. The sum of all three parameters of the ETIa can be used to quantify water consumption [32,33]. In combination with biomass production/yield, it is possible to derive agricultural water productivity [32,33].
Biomass and yield
The total biomass production (TBP), representing the cumulative above- and below-ground dry matter generated throughout the growing season, is defined by [35]. TBP is computed as the sum of net primary production (NPP), converted into dry matter production (DMP) units (kgDM/ha) from the start of the season (SOS) to the end of the season (EOS). This study’s SOS and EOS spanned from December to May, corresponding to the irrigation season. The daily TBP (kgDM/ha/day) was calculated using the formula provided in (Equation (2)) [33,35]:
T B P s = i = S O S E O S N i D M P i
  • DMP(i) is the Dry Matter Production at dekad i, expressed in kgDM/ha/day, where 1 gC/m2/day (NPP) = 22.222 kgDM/ha/day (DMP).
  • N(i) is the number of days within each dekadal, varying between 8 (end of February) &11.
The yield (kg) was calculated using the formula in (Equation (3)) from [34]. Initially, the total biomass production (TBP) was multiplied by the harvest index (HI) specific to C4 crops, such as maize, and scaled by a factor of 1.8. The resulting value was then divided by one minus the crop yield’s moisture content (MC), as outlined in (Equation (3)):
Y i e l d = T B P H I C 4 1 M C
The maize crop’s moisture content and harvest index were 0.26 and 0.48, respectively [32,34].
Crop water productivity
The maize crop water productivity (CWP), measured in kg/m3, was derived by dividing the yield production (in kilograms) by the total actual evapotranspiration and interception (in cubic meters). Similarly, the CWP for vegetables was determined using the Total Biomass Production (TBP) ratio to ETIa. This analysis utilized WaPOR time series data across three irrigation seasons spanning 2017/18, 2018/19, and 2019/20. The formula is provided in Equation (4) [32]:
C W P = T B P / Y i e l d E T I a

3.3. Sensor 3: Model-Based CWP (AquaCrop)

AquaCrop model
In the AquaCrop model, crop water productivity is considered a more conservative specific crop property [36], and water productivity (WP*), a climate-normalized water productivity, is used to compute biomass growth. The WP* parameter value (units: dry biomass per area, g/m2) for C3 and C4 plants and crops can be preset by the user during the initial modelling process. Information on water application, computed plant transpiration, reference evapotranspiration, and other environmental factors are then used to incrementally (e.g., per crop cycle day) evaluate biomass growth [37]. This is in contrast to the two other assessment methods, i.e., satellite and farmer in-situ, where the CWP value is derived by taking the ratio of RS-based or in-situ observed crop dry biomass and water consumption (actual evapotranspiration). In our modeling of maize and legumes, AquaCrop WP* values of 15 to 20 g/m2 and 30 to 35 g/m2 were, respectively, used for the C3 and C4 crops. AquaCrop [37] enables the generation of total growth cycle CWP (kg dry biomass or crop yield per m3 plant transpiration, Tr) and system water productivity, also called Water Use Efficiency or WUE (kg dry biomass or crop yield per m3 ET evapotranspiration i.e., soil evaporation and plant transpiration). This is comparable to the CWP of WaPOR and CWP derived from farmer crop yield and observed irrigation water use data. The model uses local weather data and reference evapotranspiration to simulate daily crop growth and development [13]. In addition, the model utilizes soil profile information, including field capacity, permanent wilting point, and saturated hydraulic conductivity (Table A1). We also evaluated Canopy Cover (CC) development and variables used in AquaCrop with medium high-resolution vegetation index data (Planet Scope 5-m) in the periods [38]. The AquaCrop model has proven to be successful in monitoring crop water productivity for maize and other crops in other studies [5,11,12,39]. Validation of the AquaCrop model is explained in detail in the Appendix A.

3.4. Triple Collocation

To identify the most suitable sensor predictor for crop water productivity, we initially computed the triple-sensor collocation, and subsequently selected the optimal estimator for various irrigation schemes. The categorical triple collocation method estimates the ranking of the three measurement systems for each category based on their balance [24]. Following the methodology proposed by [24], categorical triple collocation (CTC) was used here to appraise and rank the system performances of the irrigation system types. This study assesses crop water productivity using satellite, model-based, and farmer-in-situ data to ascertain the most dependable source. The CTC method relies on the statistical covariance analysis of three independent data sources, providing correlations to rank the reliability of the dataset [24,25,40]. Furthermore, CTC can be determined and used to estimate scores for sensitivity and specificity [25]. According to [23,24], CTC provides the correct ranking for the highest or lowest-ranked product, thereby improving the knowledge and understanding of the method’s reliability. The equation to calculate CTC rank is provided below:
R = Q 12 Q 13 Q 23 Q 12 Q 23 Q 13 Q 23 Q 13 Q 12
According to [24], CTC can be summarized in three steps:
  • Calculate the sample 3 × 3 covariance matrix Q from the observations X1,X2, X3. For example, we used the sample data to calculate using the python code computation, as shown in the Appendix A. Equation (A2):
Q = 0.38 2.25 0.83 0.41 1.75 0.84 0.38 2.65 1.14
2.
Use Q and Equation (5) to estimate R.
R = 0.996 1.001 0.999
3.
Sort R to obtain rankings.
(1)
Sensor 2 (highest)
(2)
Sensor 3 (middle)
(3)
Sensor 1 (lowest)
The software used for this analysis was Python 3.8.5 (see code in Appendix A) and the Integrated Land and Water Information System (ILWIS 3.8.6). All the processing was performed using the ITC geospatial computing platform (http://crib.utwente.nl) (accessed on 2 January 2024).

4. Results

4.1. Crop Water Productivity

Farmer in-situ results
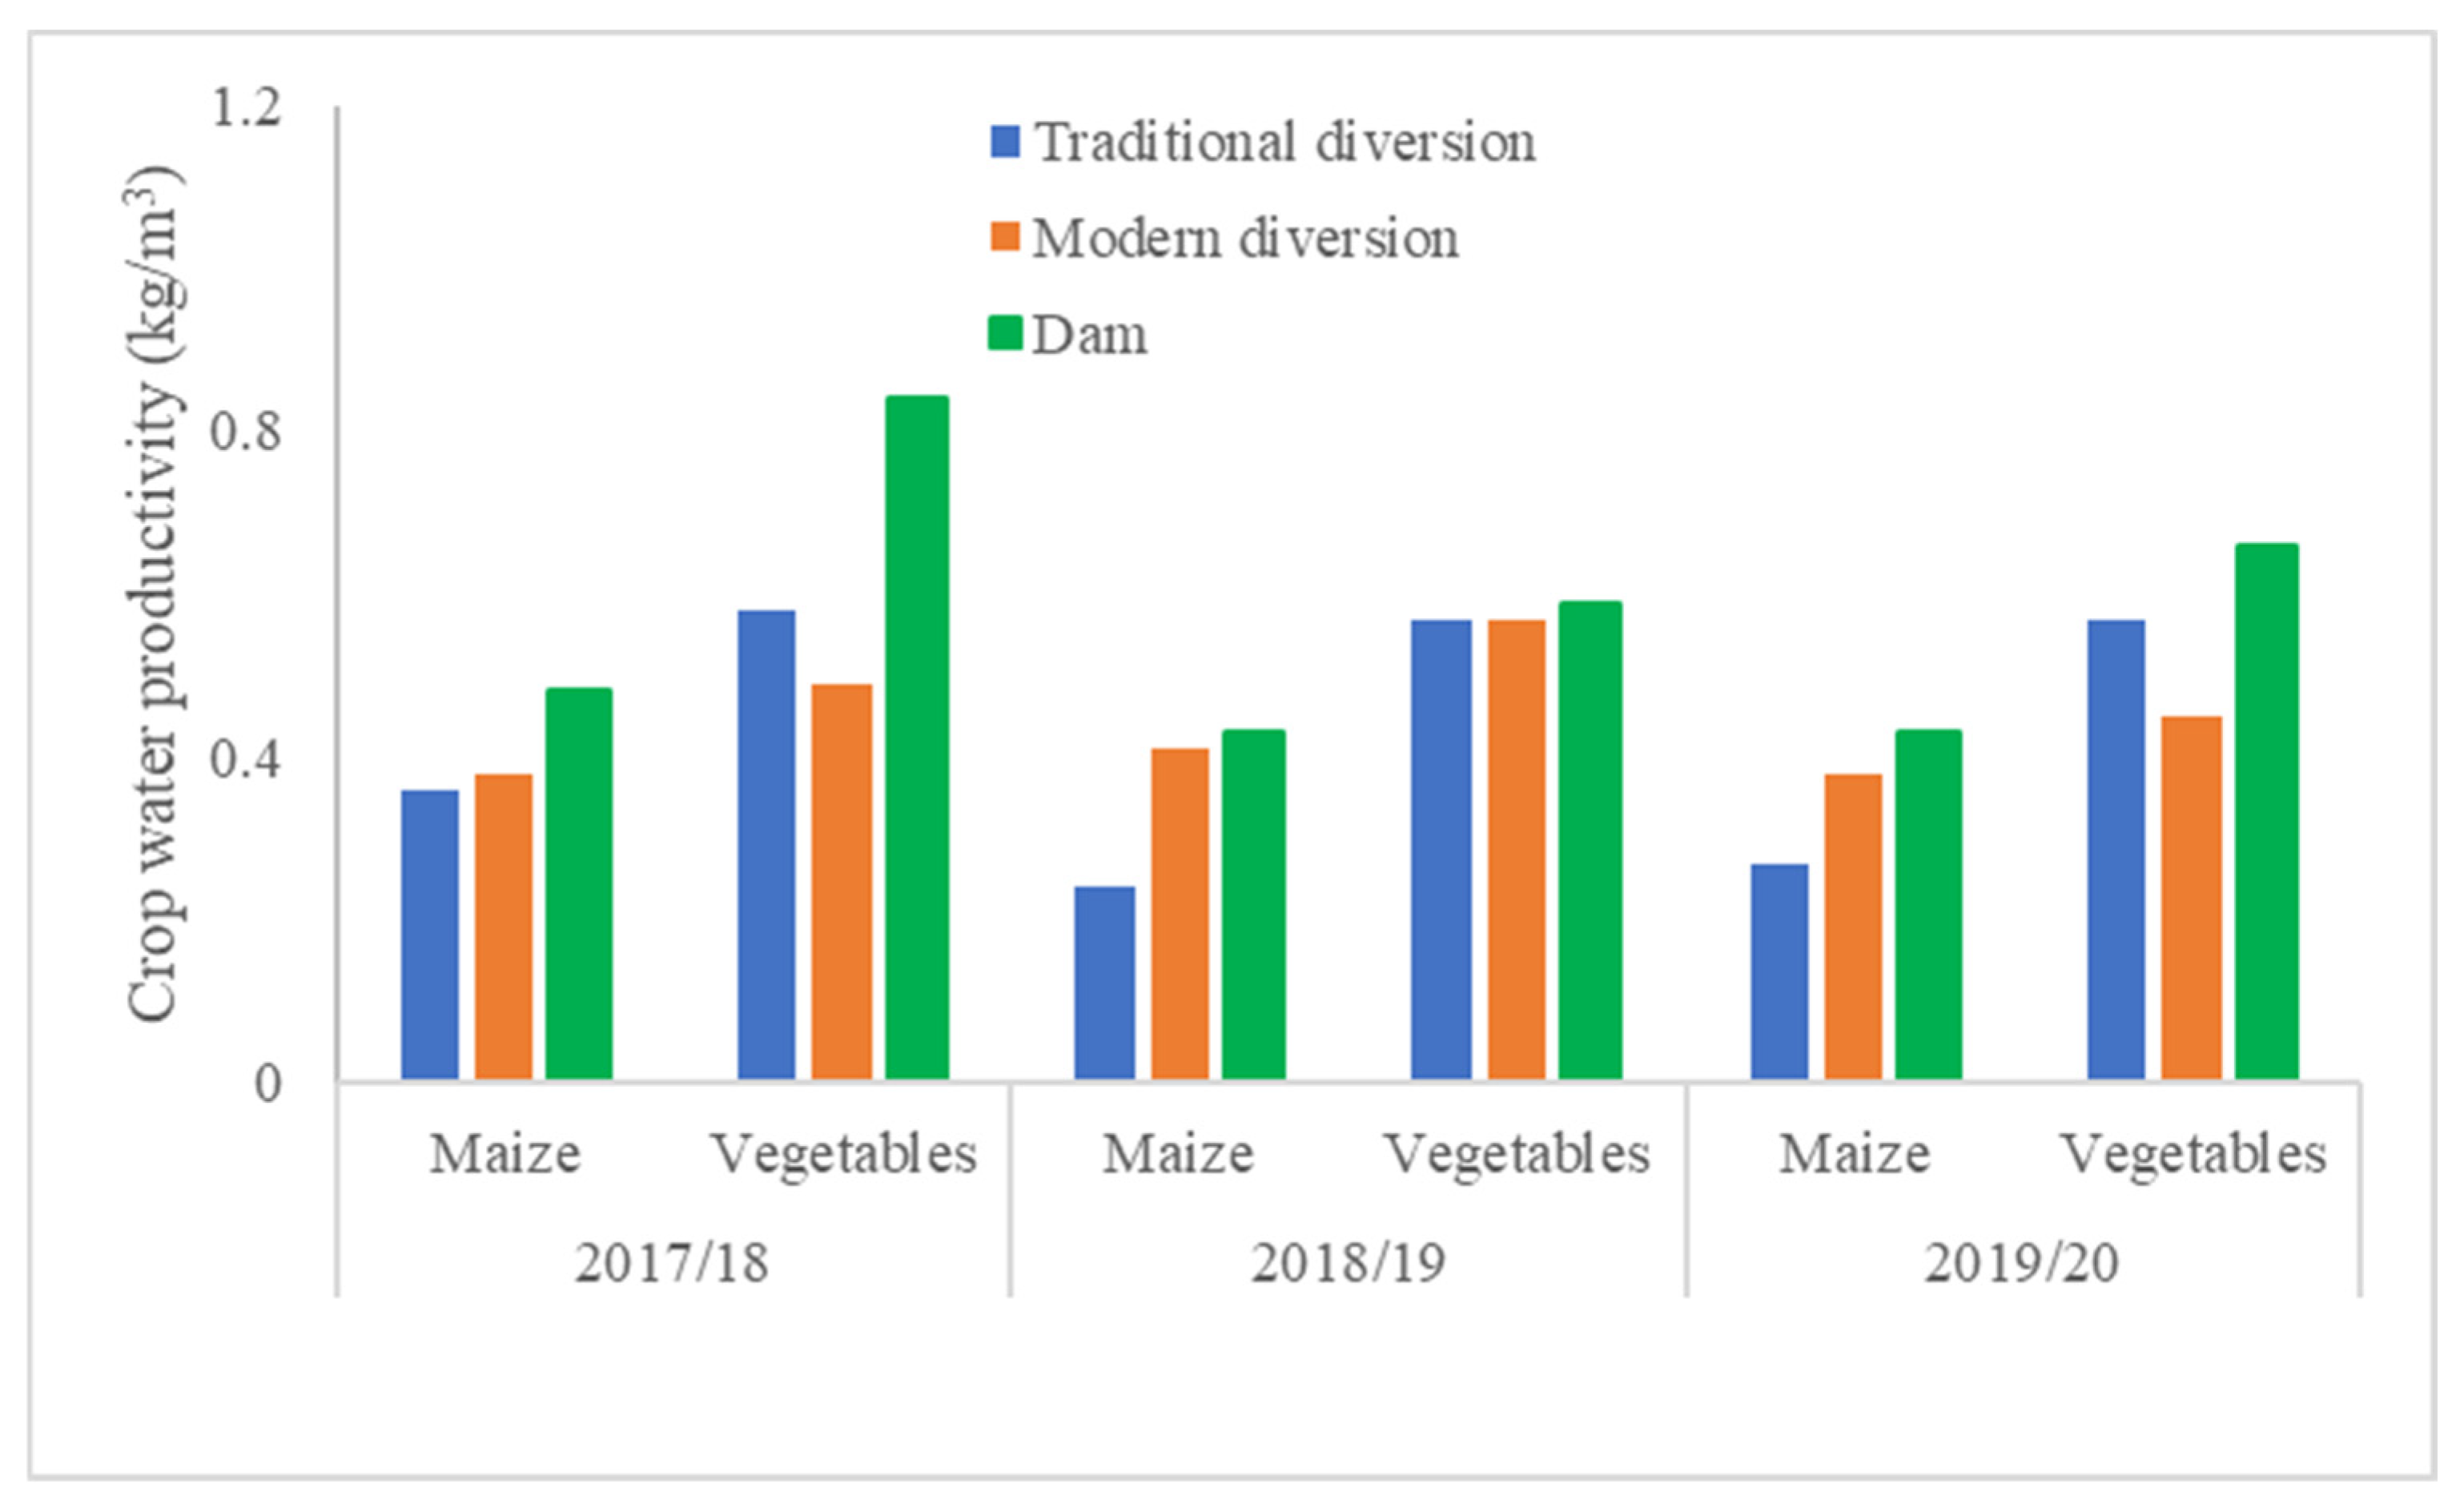
Figure 3 shows crop water productivity data for maize and vegetables across three irrigation seasons, calculated from sensor 1. The observed trends in CWP underscore the influence of different irrigation sources on crop productivity over multiple seasons. Maize consistently exhibited the highest CWP across all three seasons, with optimal water use efficiency and consistently high productivity observed when sourced from the dam. The modern diversion showed intermediate CWP values compared to the dam and traditional diversions, potentially efficient water management practices. On the other hand, the traditional diversion recorded the lowest CWP among the other sources, indicating potential issues such as water loss and inefficient distribution. The crop water productivity reached its lowest point for vegetables when sourced from the modern diversion, compared to the traditional diversion and dam, respectively. In conclusion, the analysis consistently reveals that the dam provided the highest CWP for both maize and vegetables (Figure 3).
Remote sensing derived results
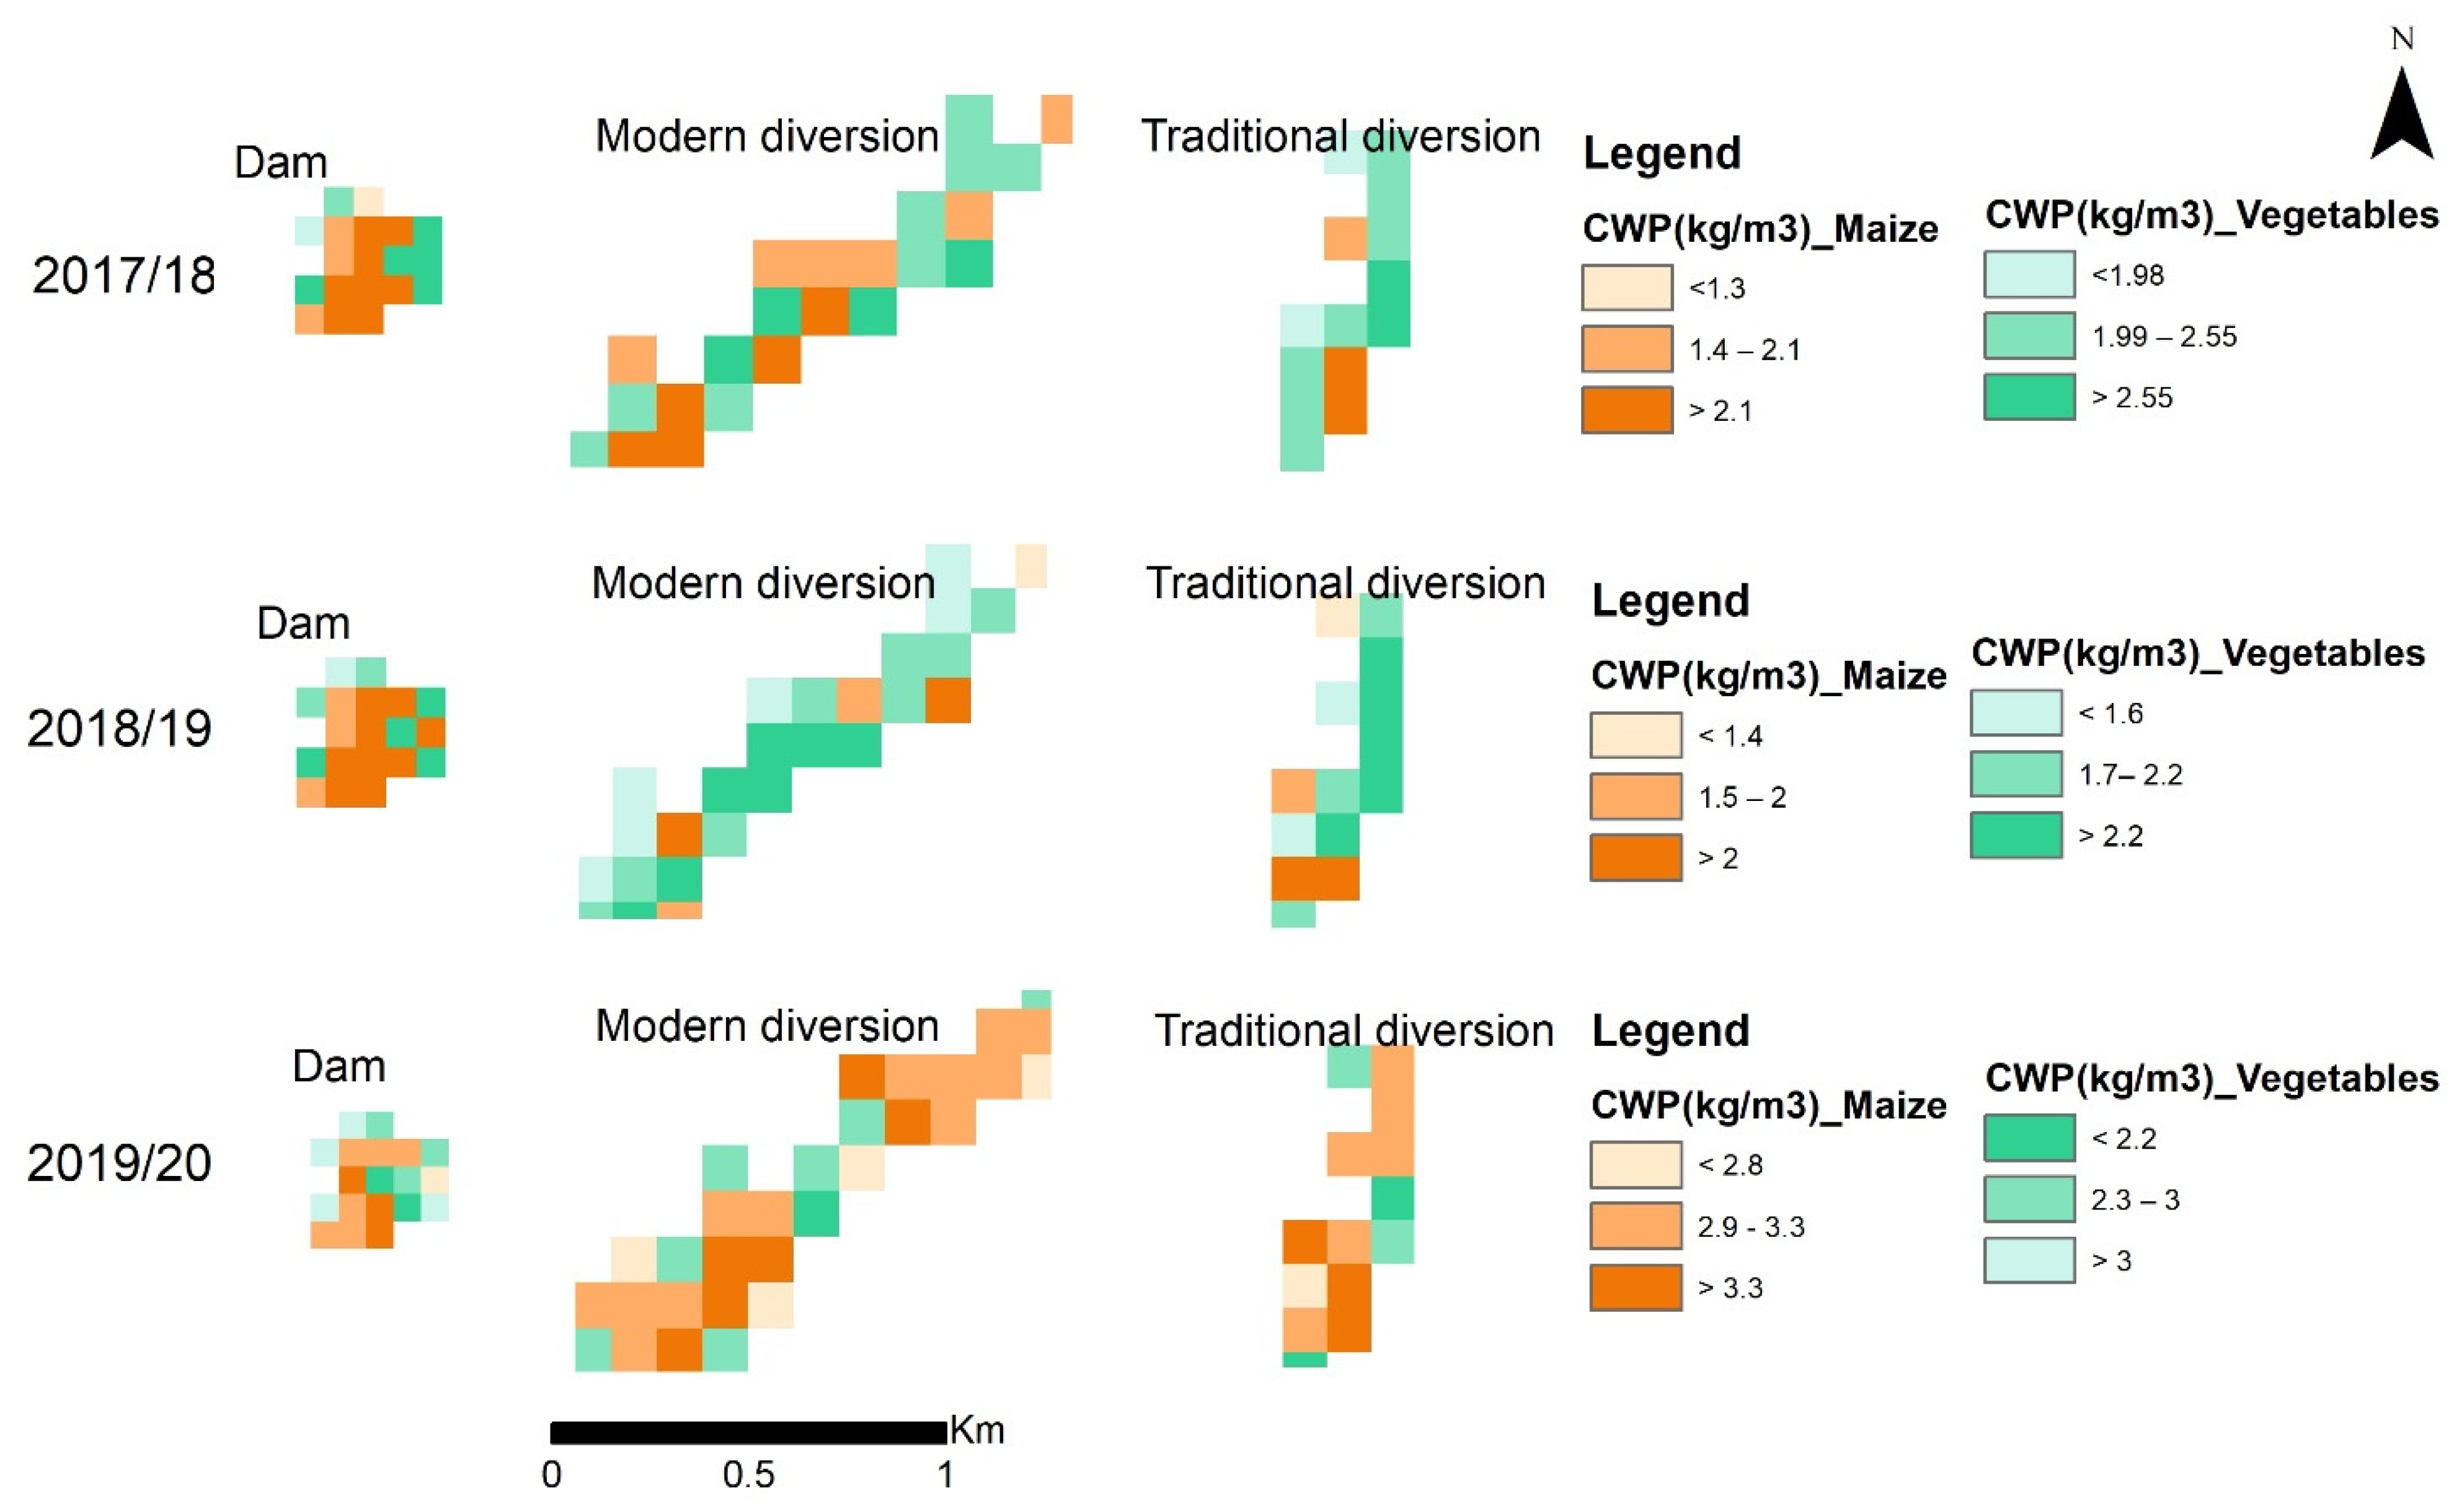
The crop water productivity, as derived from the satellite images, is illustrated in Figure 4. Across all irrigation schemes, the highest CWP was achieved during the 2019/20 irrigation season compared to other seasons. Conversely, both crops had the lowest CWP during the 2018/19 irrigation season. The study’s findings are consistent with precipitation values recorded during the study years. The highest average yield was achieved in the specified irrigation season, possibly due to favorable precipitation conditions. In traditional and modern diversion irrigation schemes, crop water productivity for vegetables was higher than for maize. This could be due to shorter growing periods (see Figure A2), lower water requirements, or the higher market value of vegetables. These factors may lead farmers to prioritize water allocation and management for vegetable crops, resulting in higher water productivity. On the other hand, maize exhibited a higher CWP than vegetables in the dam irrigation scheme. Dams often provide a more reliable and consistent water supply, allowing ample availability for maize crops. Additionally, farmers may allocate more land and resources to maize due to higher demand or profitability.
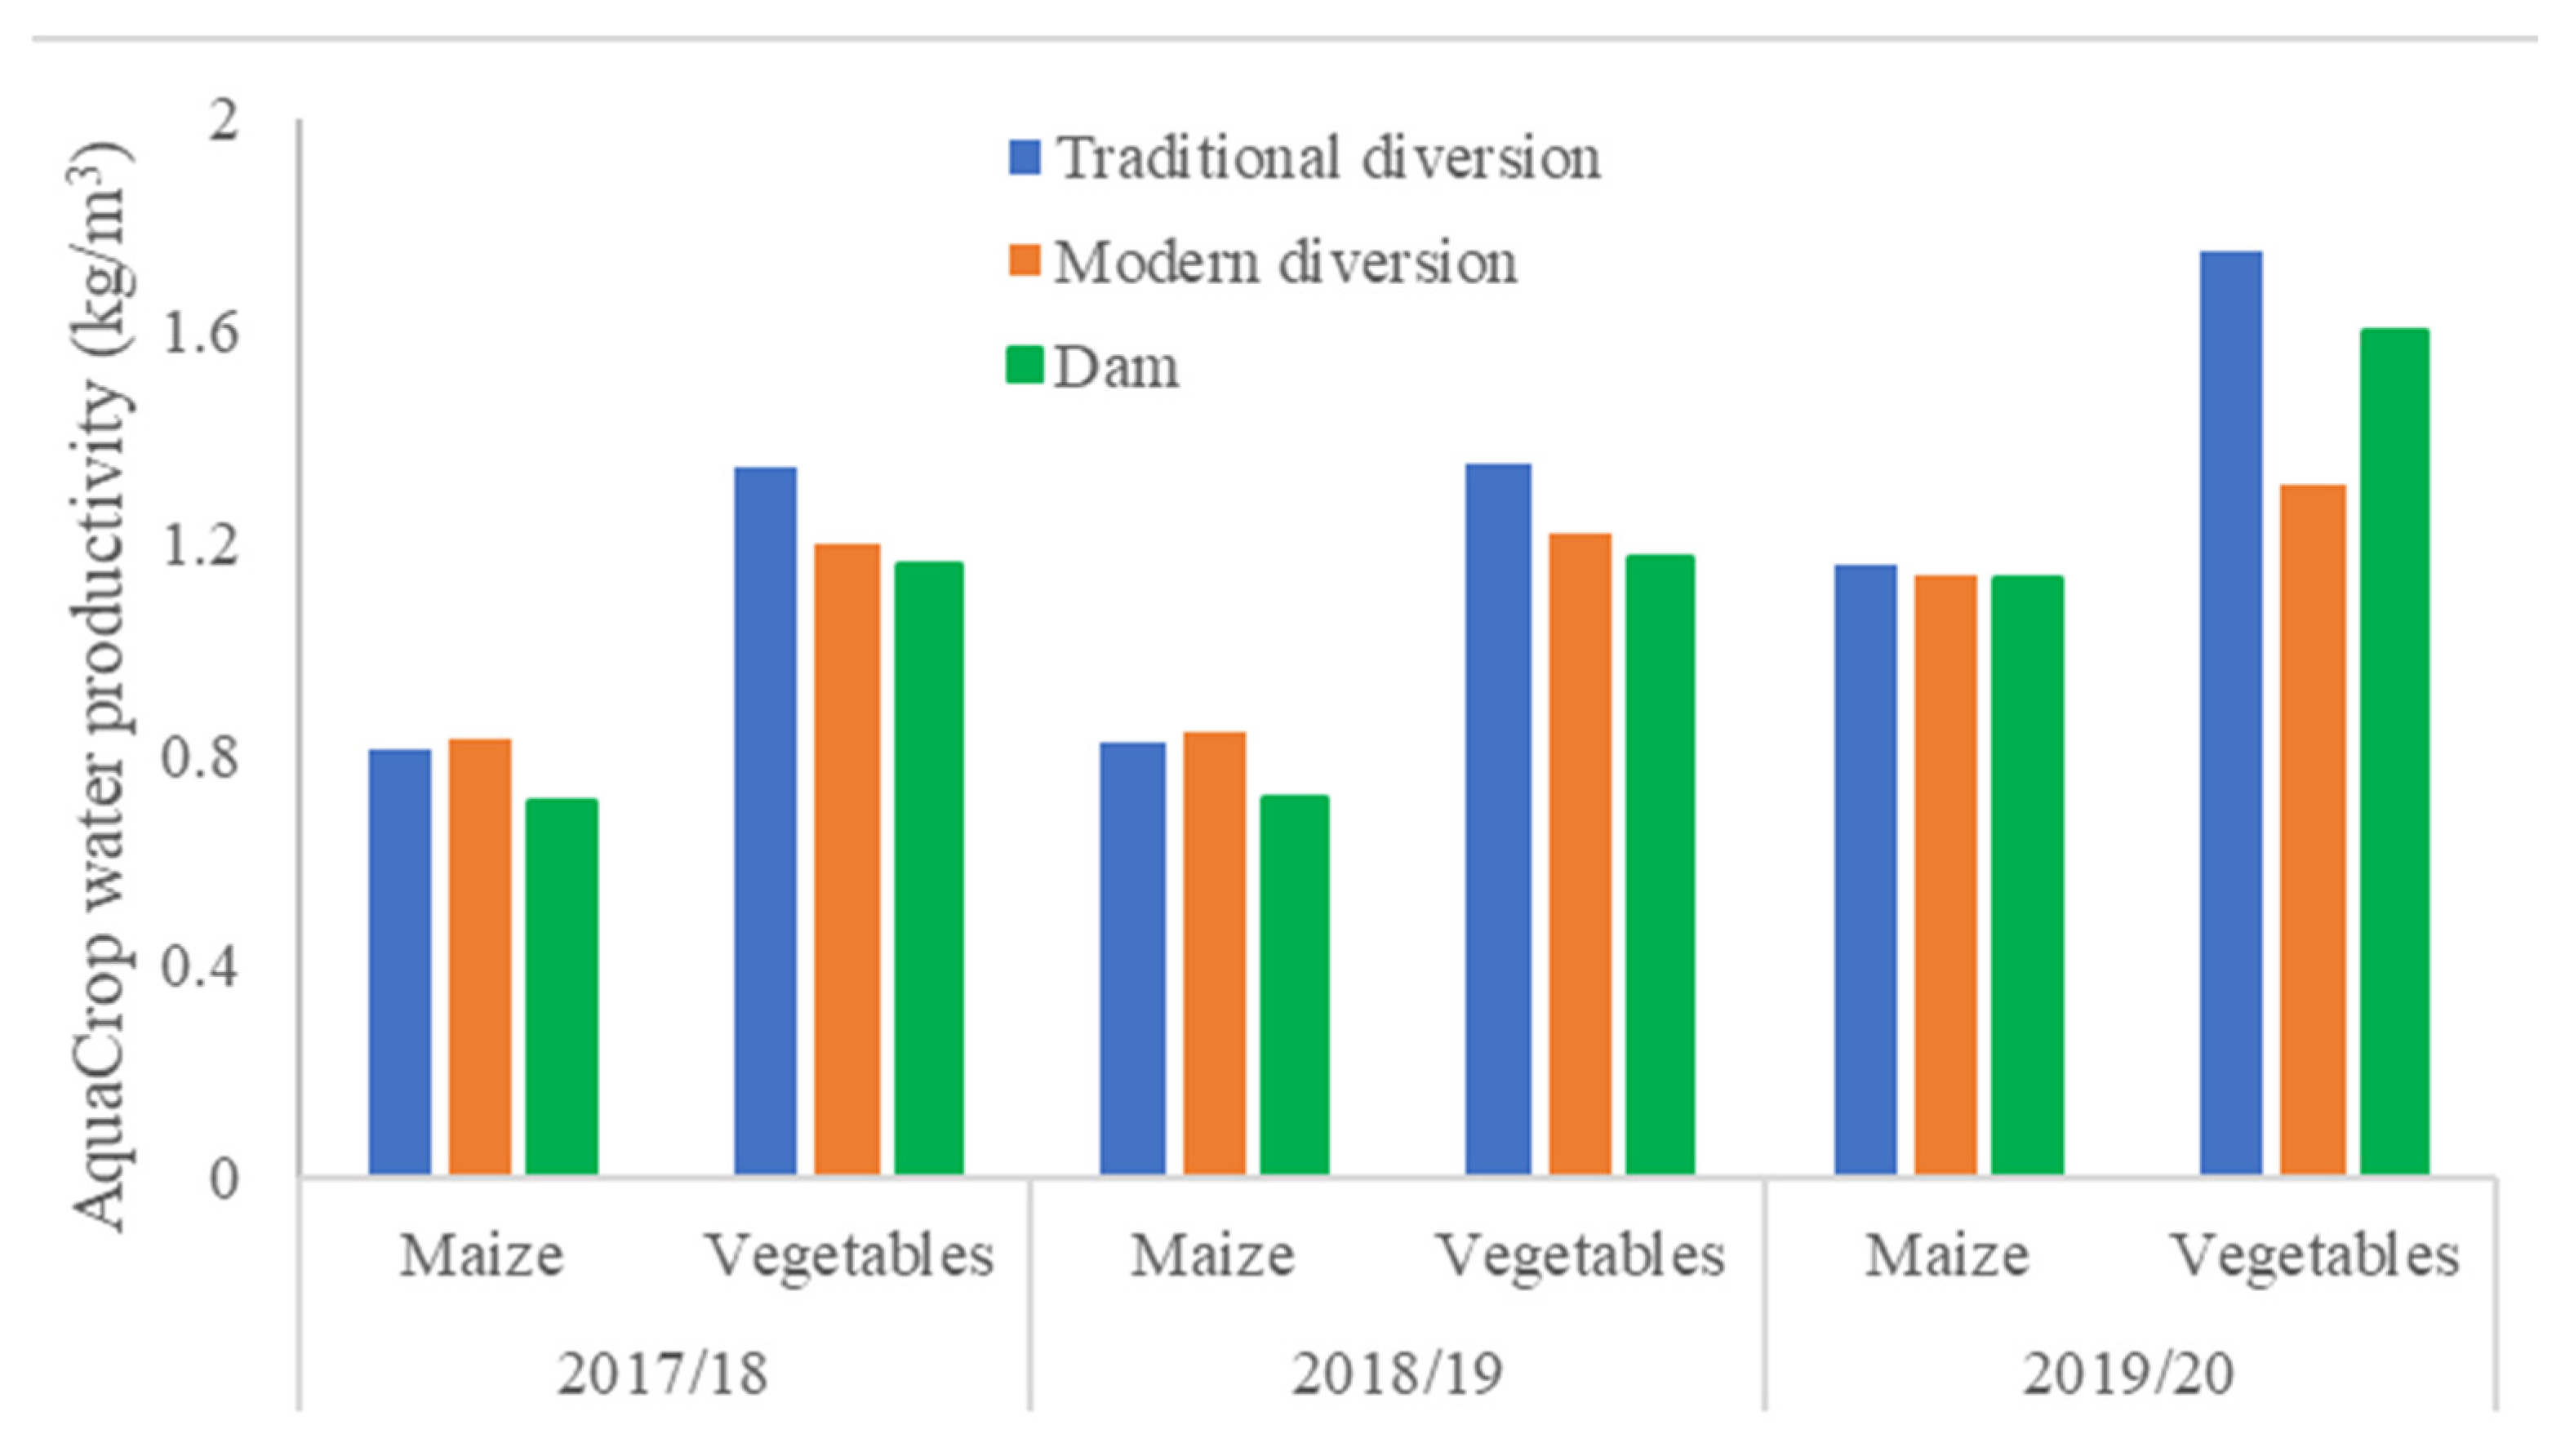
Aqua crop results
Figure 5 shows the water productivity for maize and vegetables across various irrigation schemes, including traditional diversion, modern diversion, and dams. The higher water productivity values observed in dam irrigation schemes compared to traditional and modern diversion schemes suggest that dams may offer more effective water management practices or better water availability, leading to higher maize productivity. Conversely, traditional and modern diversion schemes exhibit slightly lower water productivity values, indicating potential areas for improvement in water management practices to enhance maize crop productivity. Additionally, the model-based analysis revealed that traditional diversion irrigation schemes achieved higher water productivity for vegetables compared to both dam and modern diversion schemes. This suggests that traditional diversion systems possess more effective water management practices or better water availability for vegetable crops, leading to enhanced productivity. Conversely, dam and modern diversion schemes may exhibit lower vegetable water productivity values, indicating potential areas for improvement in water management practices.

4.2. Triple Collocation Analysis

Table 2 presents the ranks of maize and vegetables for all the irrigation schemes. Ranks 1, 2, and 3 were assigned to represent the results obtained from sensors 1, 2, and 3, respectively. In the traditional diversion irrigation scheme for maize, the highest weights were consistently observed in ranks 3, 2, and 1, respectively, indicating that sensor 3 yielded the highest weight, followed by sensor 2, and then sensor 1. However, for vegetables in the traditional diversion, the ranks remained consistent across sensors 1 and 2, suggesting similar performance in measuring vegetable weights. In the modern diversion and dam irrigation schemes for maize, the highest weight consistently came from sensor 2, indicating that sensor two consistently provided the highest rank for maize across both irrigation schemes. Conversely, for vegetables in the modern diversion and dam irrigation schemes, the lowest weight was obtained from sensor 2, indicating a contrasting trend compared to maize. These varying trends in weight measurements across different sensors and irrigation schemes underscore the importance of considering each sensor’s specific characteristics.
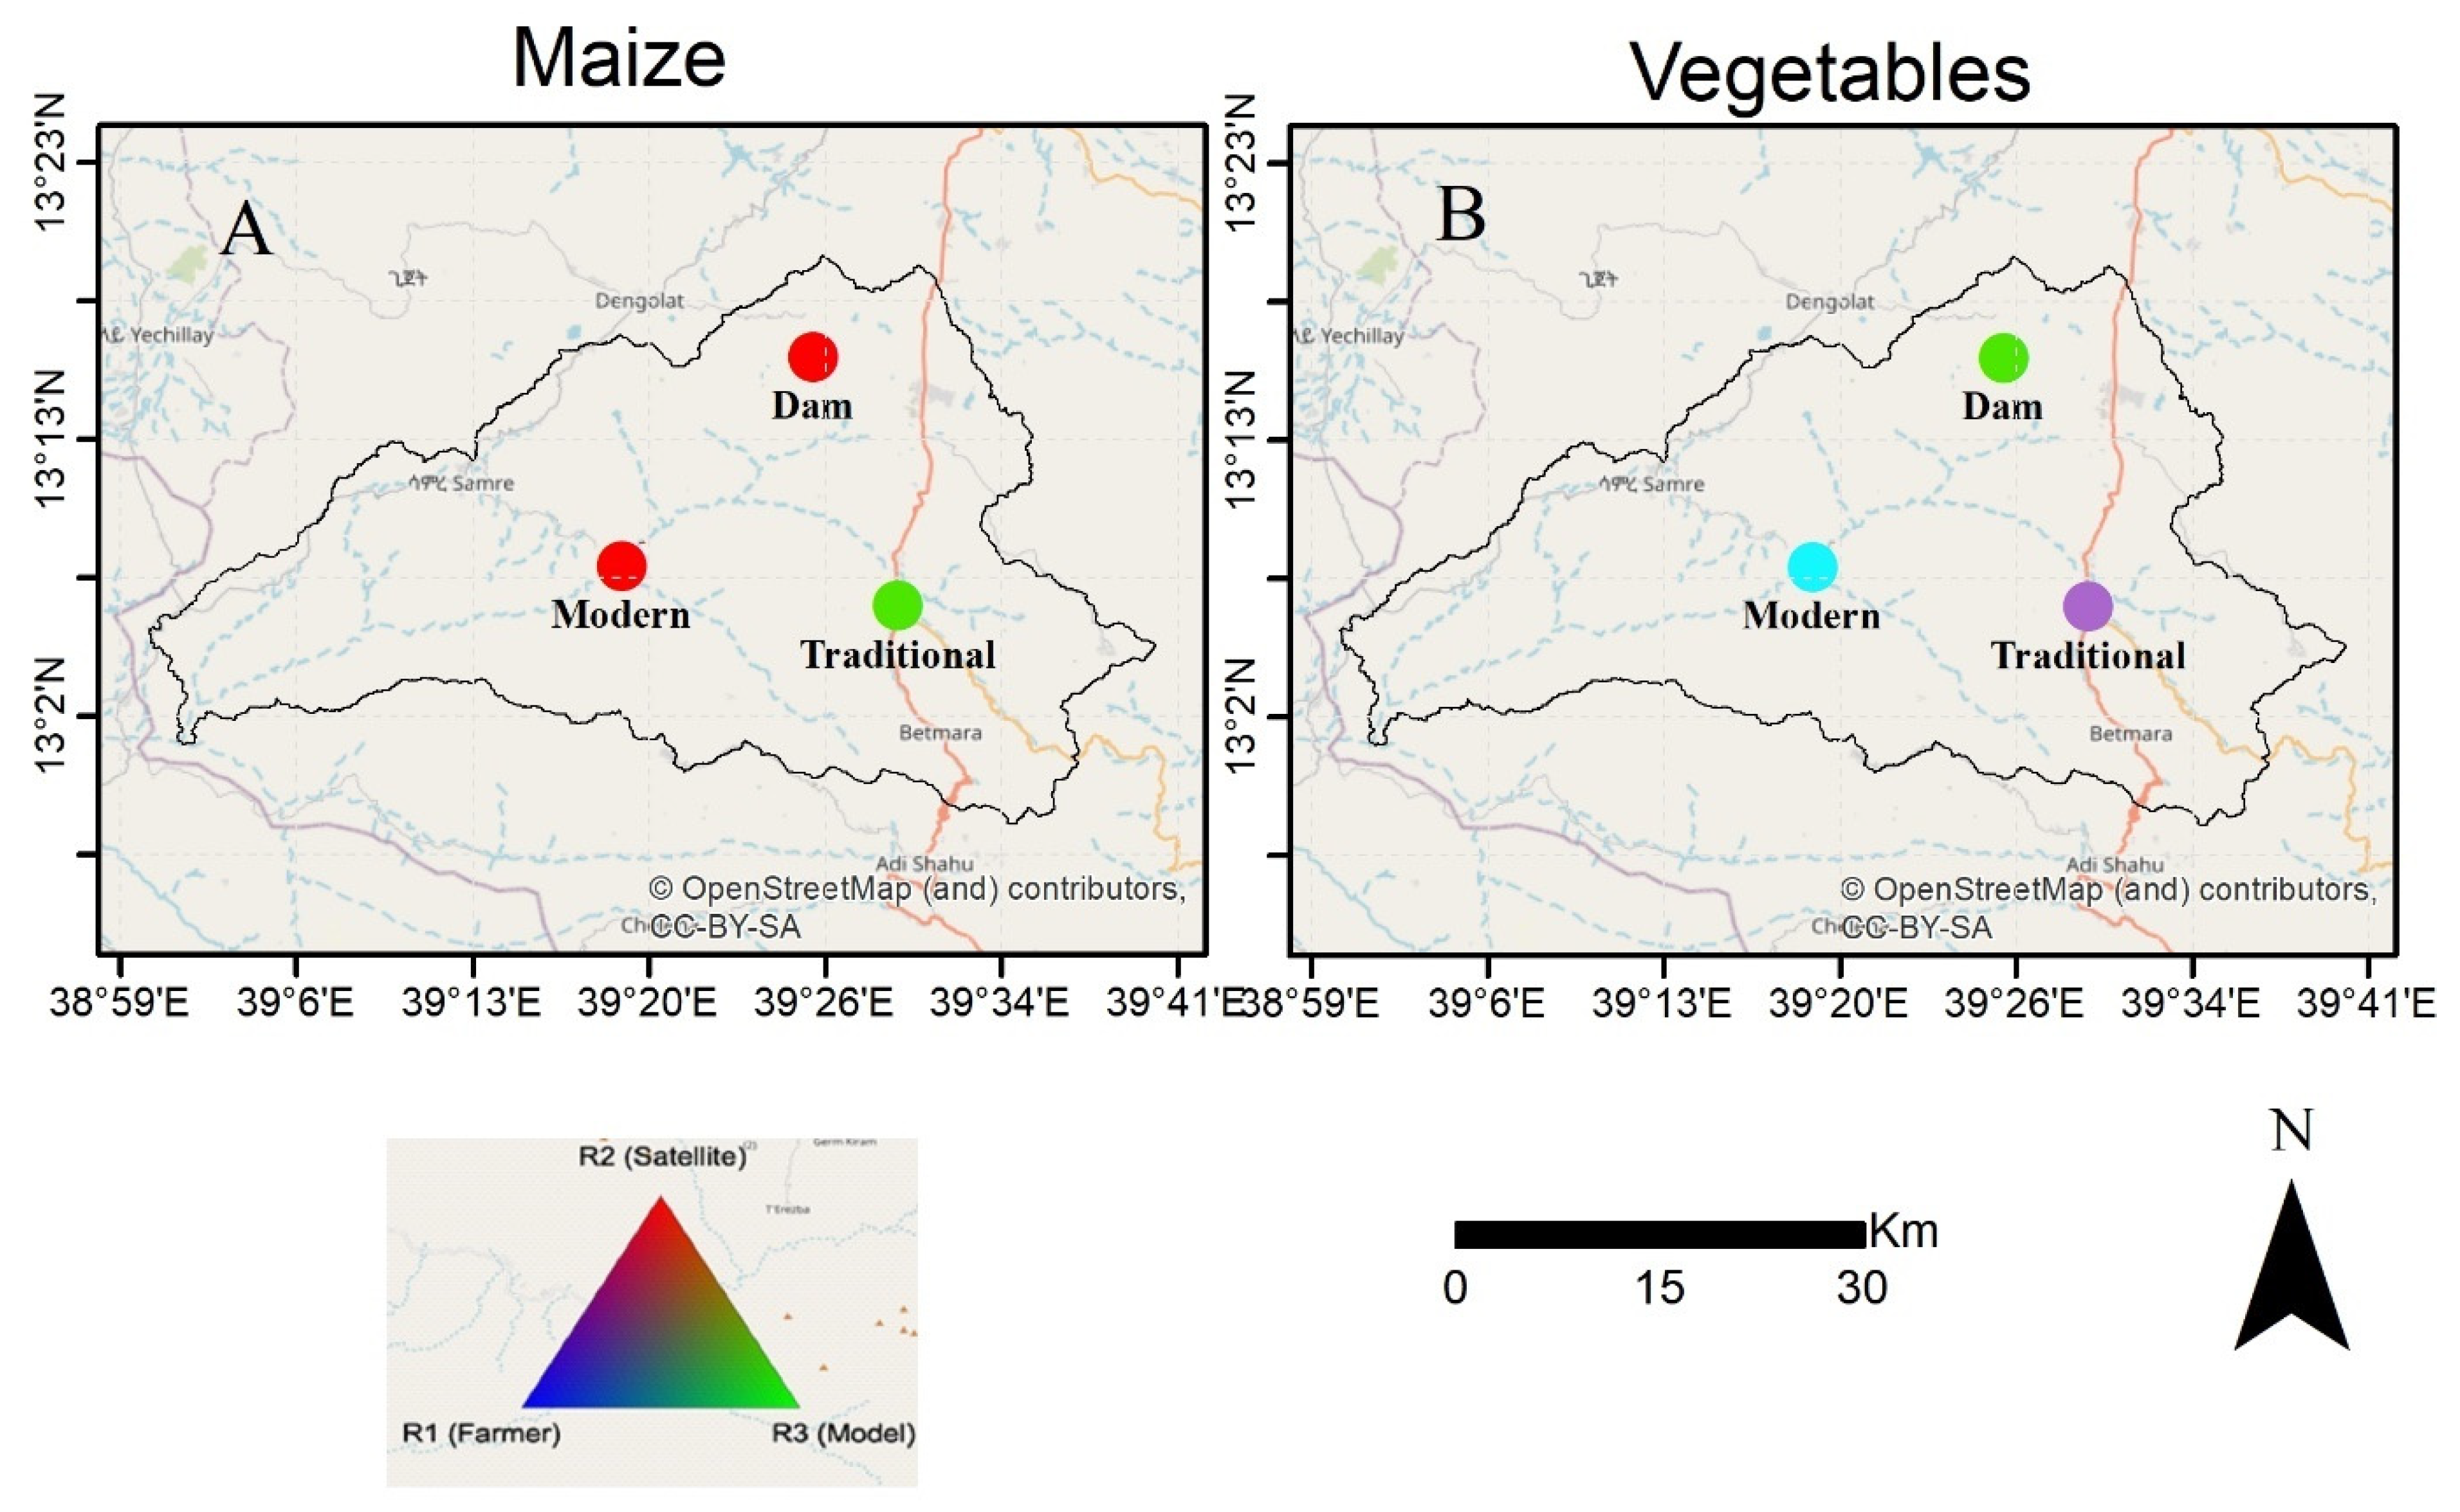
Figure 6A illustrates the mapping of the measurement systems with the highest CTC performance rankings at each irrigation scheme, providing valuable insights into the effectiveness and reliability of different data sources for assessing maize crop performance. For example, the model ranks first for the traditional diversion, while the satellite method ranks first for the dam and modern diversion. In each irrigation scheme, the vegetable measurement system with the highest triple collocation performance ranking is identified. For instance, in the traditional diversion scheme, both farmer in-situ and satellite data achieve the first rank. Conversely, the model holds the top spot in the dam irrigation scheme, while both farmer in-situ and model data rank first in the modern diversion irrigation scheme (Figure 6B).

5. Discussion

5.1. Evaluating the Crop Water Productivity

The study investigates the use of a triple-sensor collocation approach in evaluating irrigation scheme performance, focusing on crop water productivity across three irrigation system types: traditional and modern diversions, and dam-based irrigation schemes. Higher CWP values were obtained when utilizing remote sensing data compared to model-based and farmer in-situ data. Satellite data offer a broader, objective view of crop performance than traditional methods, enabling more effective monitoring and management of irrigation practices. Satellite imagery covers large geographic areas and provides frequent, consistent observations over time, allowing for a comprehensive understanding of crop conditions. Furthermore, satellite-based remote sensing techniques allow for continuous crop performance monitoring, enabling timely adjustments to irrigation strategies in response to changing environmental conditions. The higher CWP values from satellite data suggest more efficient water use and better crop productivity (Figure 4). Therefore, the performance of the satellite using the WaPOR database for this study was deemed crucial, as emphasized in previous studies, particularly for calculating crop water productivity (CWP) on major crops in both irrigated and non-irrigated seasons [16,17,18,19].
Model-based data utilize sophisticated algorithms and simulations to estimate WP*, considering a range of environmental factors and irrigation practices. While model-based data offer valuable insights into water productivity, the model may have difficulty accurately representing real-world conditions. However, the water productivity values obtained from the model (Figure 5) were relatively higher compared to those derived from the farmer in-situ data. In the previous study by [5], CWP was calculated using both field data analysis and the AquaCrop model. Their analysis involved calculating yield, crop water productivity (CWP), CWP based on evapotranspiration (ET), and economic water productivity (EWP) through field data analysis and a validated AquaCrop model. Their results indicated that the maize CWP from the field was low (1.12 kg of grain per m3 of water) due to inefficient water application and low soil fertility. The AquaCrop model results showed that changing the irrigation schedule could increase CWP(ET) to 1.35 kg/m3 and EWP to 3.94 birr/m3. However, the yield gap is primarily attributed to low soil fertility. In addition, [41] used the AquaCrop model to simulate potato growth in a hot semi-arid environment under diverse irrigation management practices. The treatments included full irrigation and various static and dynamic deficit irrigation management strategies. The analysis showed that biomass simulation was highly affected by normalized water productivity (WP*). The simulations of the calibrated model indicated that it could satisfactorily simulate total soil water content, volumetric soil water content, and tuber dry yield. Additionally, the model performed excellently in simulating total actual evapotranspiration and end-season water productivity. The performance of the AquaCrop model was reasonable and satisfactory, proving to be a reliable analytical tool for irrigation water management. Therefore, this finding aligns with the current study results. Farmer in-situ data often depend on subjective observations, which can introduce limitations such as human error and measurement inaccuracies. These factors may compromise the accuracy and reliability of the reported CWP values, suggesting relatively low water productivity levels (Figure 3), and indicating potential inefficiencies in irrigation schemes. Moreover, a previous study by [7] demonstrated that the effectiveness of irrigation schemes in explaining crop water productivity is frequently hindered by the variety of errors linked to farmer-reported yields. In summary, data from different sensors highlight the potential benefits of utilizing satellite-based monitoring systems to assess crop water productivity in all irrigation schemes for maize and vegetable crops. Compared to farmer in-situ and model-based data, the higher CWP values derived from satellite data suggest that satellite-based monitoring can offer more accurate and reliable assessments in agricultural practices. A previous study [15], evaluated water productivity using the WaPOR database in Ethiopia, analyzing the spatial variability of water, land productivity and irrigation performance over five cropping seasons (2015 to 2019). They applied a comprehensive set of indicators that included water consumption, uniformity, adequacy, and land and water productivity. Their study demonstrated that WaPOR provided effective results for assessing water productivity. However, their WaPOR results were complemented with observed field data to understand the production conditions better. In addition, [17] conducted a study to develop a framework for assessing irrigation performance using WaPOR data, focusing on a sugarcane estate in Mozambique. The WaPOR data on water, land, and climate are near real-time and spatially distributed, with the finest spatial resolution in 100 m. The WaPOR data were validated agronomically by examining the biomass response to water and then systematically used to analyze seasonal indicators from 2015 to 2018. Therefore, their finding concluded that WaPOR data were useful for assessing irrigation performance, including uniformity, equity, adequacy, and land and water productivity.

5.2. Estimation of the Best Sensors

The selection of the best sensors for estimating maize CWP varies based on the level of technological advancement and management practices within each irrigation scheme. Satellite excels in controlled environments, like dams and modern diversions, indicating that satellite data provides comprehensive and objective information that enables accurate crop performance and water productivity assessment. In contrast, the model-based analysis claims the first rank for estimating maize CWP in traditional diversion schemes (Figure 6A). This suggests that employing mathematical models to simulate crop-water interactions and predict CWP yields more accurate results in settings where water management practices are less modernized.
Similarly, model-based systems are ranked first for estimating vegetable CWP in dam irrigation schemes. This indicates that using mathematical models to simulate crop-water interactions and predict CWP yields more accurate results in settings where water management practices are highly regulated. Meanwhile, both satellite-based and farmer-reported analyses are more effective in traditional diversion schemes, where water management practices need to be more modernized. This implies that combining remote sensing techniques with on-the-ground observations yields the most accurate assessments of CWP for vegetables. Model-based systems and farmer in-situ data share the first rank for estimating vegetable CWP in modern diversion schemes (Figure 6B). This suggests that in modernized irrigation systems, where water diversion practices are more advanced, both approaches provide equally effective estimations of CWP. According to [24], triple collocation provided insights into the reliability of each method in representing actual values. They used three measurements to estimate rankings of landscape freeze observations derived from satellite, in-situ, and model. Their finding is that the model base is ranked highest in most locations, followed by satellite and in-situ products. Therefore, their study concludes that it can be used to identify the most accurate measurement system in a particular area. Generally, the performance of the triple collocation analysis for this study was found to be necessary, as highlighted in previous studies [23,24,25,26]. These approaches were crucial for validating landscape freeze retrievals, as well as for validating soil moisture and snow retrievals. In addition, these approaches were used to evaluate soil freeze or thaw datasets, and to assess sea ice or open water observations.

6. Conclusions

The study emphasizes the significance of employing a triple-sensor collocation approach, which in this case integrates remotely sensed, model-based, and farmer in-situ estimates of crop water productivity to evaluate the performance of small-holder irrigation schemes in Northern Ethiopia. Triple collocation permits the comparison of independent assessment methods and evaluates eventual errors and biases introduced by each evaluation technique. Categorical triple collocation analysis enhances the accuracy and reliability of data interpretation by integrating multiple data sources, such as farmer in-situ estimates, remote sensing observations, and model-based analyses. By triangulating information from these diverse sources, CTC mitigates the limitations associated with individual assessment methods. Furthermore, CTC can be used to identify the most accurate measurement sensors for CWP in each irrigation scheme. From Figure 6A, we observed that Sensor 2 (satellite) data performed best in the modern and dam irrigation schemes for maize. The AquaCrop model performed best in the traditional irrigation scheme. For vegetables (Figure 6B), AquaCrop performed best in the dam diversion scheme. However, the CTC model showed mixed ranking results in traditional and modern diversion schemes. For example, in the traditional diversion scheme, the ranking results are between farmer and satellite data, while in the modern diversion scheme, the ranking results are between farmer and model data.
The proposed approach can be recommended for evaluating the performance and water use efficiency of other small-scale and larger irrigation schemes in Ethiopia, and beyond. Moreover, it can be applied to any other region or area, provided due care is taken with the independent assessment tools, i.e., remote sensing data use, crop model application, and in-situ data collection, to accommodate differences in crop varieties, climatic conditions, soil characteristics, and irrigation practices. In addition, further research is recommended to evaluate crop water productivity by further conducting field experiments in the various irrigation schemes, using modern sensor and data communication technologies. Selected fields should be equipped with soil moisture sensors and compact weather observation systems to permit the monitoring of crop growth and water use. Irrigation water flows should also be monitored at the primary canal. Real crop yield mass measurements from the monitored farmlands should be conducted, allowing for the calculation of crop water productivity by comparing the yield to the total water input. By integrating these measurements, the research will provide more insights into water use efficiency in crop production, identifying opportunities for improving water productivity in irrigated agriculture. Also, to further improve the satellite-based assessment of water use efficiency in smallholder irrigation systems, it is recommended to use higher resolution satellite data (such as Planet Scope at 5 m, Sentinel-2 at 10 to 20 m, or Landsat 8/9 at 30 m) or data fusion techniques to better derive biomass, evapotranspiration, and crop water productivity [38,42].

Author Contributions

A.A.M. collected the data, analyzed the results, and wrote the draft article. Supervision: C.M.M., B.H.P.M. and D.T. Writing review and manuscript editing: A.A.M. and C.M.M. Software: A.A.M. and C.M.M. All authors have read and agreed to the published version of the manuscript.

Funding

This study was supported by the Dutch Organization for Internationalization in Education (Nuffic), the University of Twente, the Faculty of Geo-information Science and Earth Observation (ITC), and the Ministry of Science and Higher Education of Ethiopia (MoSHE) under the Ethiopian Educational Network to Support Agricultural Transformation (EENSAT) project (CF13198, 2016).

Data Availability Statement

Data will be made available on the Data Archiving and Networking Service (DANS) of the University of Twente, Enschede, The Netherlands.

Acknowledgments

The research teams extend their gratitude to Mahari Asfaw for their support in data collection. In addition, the EENSAT Mekelle team, and the Ethiopia National Meteorological Agency provided the climate data. Also, Bas V. Retsios provided us with a code for the triple collocation analysis.

Conflicts of Interest

The authors declare no conflict of interest.

Appendix A

Figure A1. Temperature and volumetric water content at different depths: (A) Gerebhiwane (5 June 2020–26 April 2021), and (B) Gojibere (19 May 2020–1 October 2020).
Water 16 02638 g0a1
Table A1. Physical soil properties.
Site NameDepth
(cm)
Soil TextureSaturation Point (% v)FC (% v)PWP (% v)AWC (m/m)Ksat (m/h)BD
(kg × 103/m3)
MC (% v)PD
(kg × 103/m3)
Gojibere0–20Silt loam47.530.713.10.180.01391.2114.32.61
20–4048.032.114.70.170.01121.2516.22.63
40–6048.433.516.30.170.09221.2718.52.65
60–8061.338.018.60.190.03211.3020.22.66
80–10060.139.021.30.180.02331.3218.52.66
Gereb
hiwane
0–20Silt loam59.938.420.50.180.02481.2711.52.63
20–40Silt clay57.039.925.20.150.01231.3112.72.60
40–6056.440.527.30.150.00951.338.452.66
60–80Clay55.940.728.30.300.00811.347.852.67
80–10055.641.029.50.110.00711.357.752.68
(% v): volumetric water content and saturated hydraulic conductivity (Ksat).
Validation of the AquaCrop model
Model validation was performed using observed soil physical analyses at five different depths from the field (Table A1) for Gojibere. These observations were compared with the default soil type settings in the AquaCrop model for maize and vegetables over three irrigation seasons. The evaluation parameters used to assess the AquaCrop model’s performance was evapotranspiration (ET) water productivity. The model’s performance was evaluated using statistical parameters, including prediction error [43]. The prediction error (Pe) is calculated by Equation (A1):
P e = S O O 100
where S are predicted, and O are observed data.
It was observed that the maximum and minimum errors in water productivity prediction for maize were 5% and 2.4%, respectively (Table A2). The best-calibrated AquaCrop model, with a prediction error of 0.7%, was obtained for vegetables during the 2019/20 irrigation season. It can be concluded that the water productivity results from the AquaCrop model, field experiments (observations), and modeling all have acceptable accuracy. Unfortunately, the outbreak of a civil war limited our ability to collect additional field survey data, which hindered the complete optimization of the model. As a result, we had to rely on the data we collected and our best estimates, judgment, and knowledge of local conditions.
Table A2. Validation results for ET water productivity and yield of maize and vegetables.
YearYield (ton/ha)DifferencePe (%)WP (kg/m3)DifferencePe (%)
MaizeObs.Sim.Obs.Sim.
2019/203.113.580.4715.10.851.140.022.6
2018/192.883.230.3512.10.800.840.045.0
2017/182.893.260.3712.80.800.830.022.4
Vegetables
2019/206.016.610.609.901.301.310.010.7
2018/194.975.500.5310.71.171.220.054.3
2017/184.955.460.5110.31.161.200.043.4
Obs: Observation and Sim: Simulation.
Figure A2. Photographs of various crops captured during the field survey; all images were taken on the same day by Mehari Asfaw.
Water 16 02638 g0a2
Python code for evaluation of Equation (5) and sensor ranking.
def computeTripleColocation ( triplets ) : Qhat = np . cov ( triplets ) R 1 = math . sqrt ( ( Qhat [ 0 , 1 ] * Qhat [ 0 , 2 ] / ( Qhat [ 0 , 0 ] * Qhat [ 1 , 2 ] ) ) R 2 = np . sign ( Qhat [ 0 , 2 ] * Qhat [ 1 , 2 ] * math . sqrt ( ( Qhat [ 0 , 1 ] * Qhat [ 1 , 2 ] ) / ( Qhat [ 1 , 1 ] * Qhat [ 0 , 2 ] ) ) R 3 = np . sign ( Qhat [ 0 , 1 ] * Qhat [ 1 , 2 ] ) * math . sqrt ( ( Qhat [ 0 , 2 ] * Qhat [ 1 , 2 ] ) / ( Qhat [ 2 , 2 ] * Qhat [ 0 , 1 ] ) ) rho = np . array ( [ R 1 , R 2 , R 3 ] ) ranks = np . argsort ( rho ) [ : : - 1 ]   #   [ : : - 1 ] for reversing the result rhosquare = np . square ( rho ) rhoeight = np . square ( rhosquare )   rhoeight = np . square ( rhoeight )   return R 1 , R 2 , R 3

References

  1. Hagos, E. Development and Management of Irrigation Lands in Tigray, Ethiopia. Ph.D. Thesis, Wageningen University, and UNESCO-IHE, Delft, The Netherlands, 2005; pp. 1–12. [Google Scholar]
  2. Haile, G.G.; Kasa, A.K. Irrigation in Ethiopia: A Review. Acad. J. Agric. Res. 2015, 3, 264–269. [Google Scholar]
  3. Teka, D. Multi-Scale Analysis of Surface Runoff and Water-Harvesting Dams in a Semi-Arid Region: A Case Study in Tigray (Ethiopia). Ph.D. Thesis, UCL—Université Catholique de Louvain, Ottignies-Louvain-la-Neuve, Belgium, 2014. [Google Scholar]
  4. Yohannes, D.F.; Ritsema, C.J.; Solomon, H.; Froebrich, J.; van Dam, J.C. Irrigation Water Management: Farmers’ Practices, Perceptions and Adaptations at Gumselassa Irrigation Scheme, North Ethiopia. Agric. Water Manag. 2017, 191, 16–28. [Google Scholar] [CrossRef]
  5. Villani, L.; Castelli, G.; Hagos, E.Y.; Bresci, E. Water Productivity Analysis of Sand Dams Irrigation Farming in Northern Ethiopia. J. Agric. Environ. Int. Dev. 2018, 112, 139–160. [Google Scholar] [CrossRef]
  6. Karimi, P.; Bastiaanssen, W.G.M.; Molden, D.; Cheema, M.J.M. Basin-Wide Water Accounting Based on Remote Sensing Data: An Application for the Indus Basin. Hydrol. Earth Syst. Sci. 2013, 17, 2473–2486. [Google Scholar] [CrossRef]
  7. Blatchford, M.L.; Mannaerts, C.M.; Zeng, Y.; Nouri, H.; Karimi, P. Status of Accuracy in Remotely Sensed and In-Situ Agricultural Water Productivity Estimates: A Review. Remote Sens. Environ. 2019, 234, 111413. [Google Scholar] [CrossRef]
  8. Letseku, V.; Grové, B. Crop Water Productivity, Applied Water Productivity and Economic Decision Making. Water 2022, 14, 1598. [Google Scholar] [CrossRef]
  9. Behailu, M.; Nata, T. Monitoring Productivity of Water in Agriculture and Interacting Systems: The Case of Tekeze/Atbara River Basin in Ethiopia. In Proceedings of the East Africa Integrated River Basin Management, Morogoro, Tanzania, 7–9 March 2005. International Water Management Institute Conference Papers (No. h037543). [Google Scholar]
  10. Araya, A.; Keesstra, S.D.; Stroosnijder, L. Simulating Yield Response to Water of Teff (Eragrostis Tef) with FAO’s AquaCrop Model. Field Crops Res. 2010, 116, 196–204. [Google Scholar] [CrossRef]
  11. Raja, W.; Kanth, R.H.; Singh, P. Validating the AquaCrop Model for Maize under Different Sowing Dates. Water Policy 2018, 20, 826–840. [Google Scholar] [CrossRef]
  12. Ranjbar, A.; Rahimikhoob, A.; Ebrahimian, H.; Varavipour, M. Assessment of the AquaCrop Model for Simulating Maize Response to Different Nitrogen Stresses under Semi-Arid Climate. Commun. Soil Sci. Plant Anal. 2019, 50, 2899–2912. [Google Scholar] [CrossRef]
  13. Vanuytrecht, E.; Raes, D.; Steduto, P.; Hsiao, T.C.; Fereres, E.; Heng, L.K.; Garcia Vila, M.; Mejias Moreno, P. AquaCrop: FAO’s Crop Water Productivity and Yield Response Model. Environ. Mode. Softw. 2014, 62, 351–360. [Google Scholar] [CrossRef]
  14. Vanuytrecht, E.; Raes, D.; Willems, P. Global Sensitivity Analysis of Yield Output from the Water Productivity Model. Environ. Model. Softw. 2014, 51, 323–332. [Google Scholar] [CrossRef]
  15. Alemayehu, T.; Bastiaanssen, S.; Bremer, K.; Cherinet, Y.; Chevalking, S.; Girma, M. Water Productivity Analyses Using WaPOR Database. In A Case Study of Wonji, Ethiopia; Water-PIP Technical Report Series; IHE Delft Institute for Water Education: Delft, The Netherlands, 2020. [Google Scholar]
  16. Blatchford, M.L.; Mannaerts, C.M.; Njuki, S.M.; Nouri, H.; Zeng, Y.; Pelgrum, H.; Wonink, S.; Karimi, P. Evaluation of WaPOR V2 Evapotranspiration Products across Africa. Hydrol. Process 2020, 34, 3200–3221. [Google Scholar] [CrossRef]
  17. Chukalla, A.D.; Mul, M.L.; Van Der Zaag, P.; Van Halsema, G.; Mubaya, E.; Muchanga, E.; Den Besten, N.; Karimi, P. A Framework for Irrigation Performance Assessment Using WaPOR Data: The Case of a Sugarcane Estate in Mozambique. Hydrol. Earth Syst. Sci. Discuss. 2022, 26, 2759–2778. [Google Scholar] [CrossRef]
  18. Gemechu, M.G.; Huluka, T.A.; van Steenbergen, F.; Wakjira, Y.C.; Chevalking, S.; Bastiaanssen, S.W. Analysis of Spatio -Temporal Variability of Water Productivity in Ethiopian Sugar Estates: Using Open Access Remote Sensing Source. Ann. GIS 2020, 26, 395–405. [Google Scholar] [CrossRef]
  19. Safi, A.R.; Karimi, P.; Mul, M.; Chukalla, A.; de Fraiture, C. Translating Open-Source Remote Sensing Data to Crop Water Productivity Improvement Actions. Agric. Water Manag. 2022, 261, 107373. [Google Scholar] [CrossRef]
  20. Shen, Y.; Li, S.; Chen, Y.; Qi, Y.; Zhang, S. Estimation of Regional Irrigation Water Requirement and Water Supply Risk in the Arid Region of Northwestern China 1989–2010. Agric. Water Manag. 2013, 128, 55–64. [Google Scholar] [CrossRef]
  21. Karam, F.; Nangia, V. Improving Water Productivity in Semi-Arid Environments through Regulated Deficit Irrigation. Ann. Arid Zone 2016, 55, 79–87. [Google Scholar]
  22. Gruber, A.; Su, C.-H.; Zwieback, S.; Crow, W.; Dorigo, W.; Wagner, W. Recent Advances in (Soil Moisture) Triple Collocation Analysis. Int. J. Appl. Earth Obs. Geoinf. 2016, 45, 200–211. [Google Scholar] [CrossRef]
  23. Li, H.; Chai, L.; Crow, W.; Dong, J.; Liu, S.; Zhao, S. The Reliability of Categorical Triple Collocation for Evaluating Soil Freeze/Thaw Datasets. Remote Sens. Environ. 2022, 281, 113240. [Google Scholar] [CrossRef]
  24. McColl, K.A.; Roy, A.; Derksen, C.; Konings, A.G.; Alemohammed, S.H.; Entekhabi, D. Triple Collocation for Binary and Categorical Variables: Application to Validating Landscape Freeze/Thaw Retrievals. Remote Sens. Environ. 2016, 176, 31–42. [Google Scholar] [CrossRef]
  25. Scott, K.A. Assessment of Categorical Triple Collocation for Sea Ice/Open Water Observations: Application to the Gulf of Saint Lawrence. IEEE Trans. Geosci. Remote Sens. 2019, 57, 2928452. [Google Scholar] [CrossRef]
  26. Lyu, H.; McColl, K.A.; Li, X.; Derksen, C.; Berg, A.; Black, T.A.; Euskirchen, E.; Loranty, M.; Pulliainen, J.; Rautiainen, K.; et al. Validation of the SMAP Freeze/Thaw Product Using Categorical Triple Collocation. Remote Sens. Environ. 2018, 205, 329–337. [Google Scholar] [CrossRef]
  27. Ataklti, Y.T. Assessing the Potential of Geonetcast Earth Observation and in Situ Data for Drought Early Warning and Monitoring in Tigray, Ethiopia. Master’s Thesis, University of Twente, Enschede, The Netherlands, 2012. [Google Scholar]
  28. WaPOR. FAO’s Portal to Monitor Water Productivity through Open Access of Remotely Sensed Derived Data. Available online: https://wapor.apps.fao.org/home/WAPOR_2/1 (accessed on 6 December 2022).
  29. Mohammedshum, A.A.; Mannaerts, C.M.; Maathuis, B.H.P.; Teka, D. Integrating Socioeconomic Biophysical and Institutional Factors for Evaluating Small-Scale Irrigation Schemes in Northern Ethiopia. Sustainability 2023, 15, 1704. [Google Scholar] [CrossRef]
  30. Gebremedhin, M.A.; Lubczynski, M.W.; Maathuis, B.H.P.; Teka, D. Deriving Potential Evapotranspiration from Satellite-Based Reference Evapotranspiration, Upper Tekeze Basin, Northern Ethiopia. J. Hydrol. Reg. Stud. 2022, 41, 101059. [Google Scholar] [CrossRef]
  31. Devices, D. STE, Water Content, EC and Temperature Sensors: Operator’s Manual, Version 6; Decagon Devices Inc.: Pullman, WA, USA, 2010. [Google Scholar]
  32. FAO. WaPOR Database Methodology: Version 2 Release; FAO: Rome, Italy, 2020. [Google Scholar]
  33. FAO. WaPOR Database Methodology: Level 1. Remote Sensing for Water Productivity Technical Report: Methodology Series; FAO: Rome, Italy, 2018. [Google Scholar]
  34. FAO. WaPOR Quality Assessment. Technical Report on the Data Quality of the WaPOR FAO Database Version 1.0; FAO: Rome, Italy, 2019. [Google Scholar]
  35. FAO. WaPOR Database Methodology: Level 2 Data Using Remote Sensing in Support of Solutions To Reduce Agricultural Water Productivity Gaps; FAO: Rome, Italy, 2020. [Google Scholar]
  36. Steduto, P.; Hsiao, T.C.; Fereres, E. On the Conservative Behavior of Biomass Water Productivity. Irrig. Sci. 2007, 25, 189–207. [Google Scholar]
  37. Raes, D.; Steduto, P.; Hsiao, T.C.; Fereres, E. Chapter 1 FAO Crop-Water Productivity Model to Simulate Yield Response to Water AquaCrop Reference Manual August 2022; FAO: Rome, Italy, 2022. [Google Scholar]
  38. Mohammedshum, A.A.; Maathuis, B.H.P.; Mannaerts, C.M.; Teka, D. Mapping Small-Scale Irrigation Areas Using Expert Decision Rules and the Random Forest Classifier in Northern Ethiopia. Remote Sens. 2023, 15, 5647. [Google Scholar] [CrossRef]
  39. Shanono, N.J.; Abba, B.S.; Nasidi, N.M. Evaluation of Aqua-Crop Model Using Onion Crop under Deficit Irrigation and Mulch in Semi-Arid Nigeria. Turk. J. Agric. Eng. Res. 2022, 3, 131–145. [Google Scholar] [CrossRef]
  40. Mannaerts, C.M.; Maathuis, B.; Wehn, U.; Gerrets, T.; Riedstra, H.; Becht, R. FAO’s Portal to Monitor Water Productivity through Open Access of Remotely Sensed Derived Data. 2018. Available online: https://afrialliance.org/knowledge-hub/papers/constraints-and-opportunities-water-resources-monitoring-and-forecasting-using (accessed on 1 July 2024).
  41. Ahmadi, S.H.; Reis Ghorra, M.R.; Sepaskhah, A.R. Parameterizing the AquaCrop Model for Potato Growth Modeling in a Semi-Arid Region. Field Crops. Res. 2022, 288, 108680. [Google Scholar] [CrossRef]
  42. Kallel, A.; Mura, M.D.; Fakhfakh, S.; Romdhane, N. Ben Physics-Based Fusion of Sentinel-2 and Sentinel-3 for Higher Resolution Vegetation Monitoring. IEEE Trans. Geosci. Remote Sens. 2023, 61, 3257219. [Google Scholar] [CrossRef]
  43. Abedinpour, M.; Sarangi, A.; Rajput, T.B.S.; Singh, M.; Pathak, H.; Ahmad, T. Performance Evaluation of AquaCrop Model for Maize Crop in a Semi-Arid Environment. Agric. Water Manag. 2012, 110, 55–66. [Google Scholar] [CrossRef]
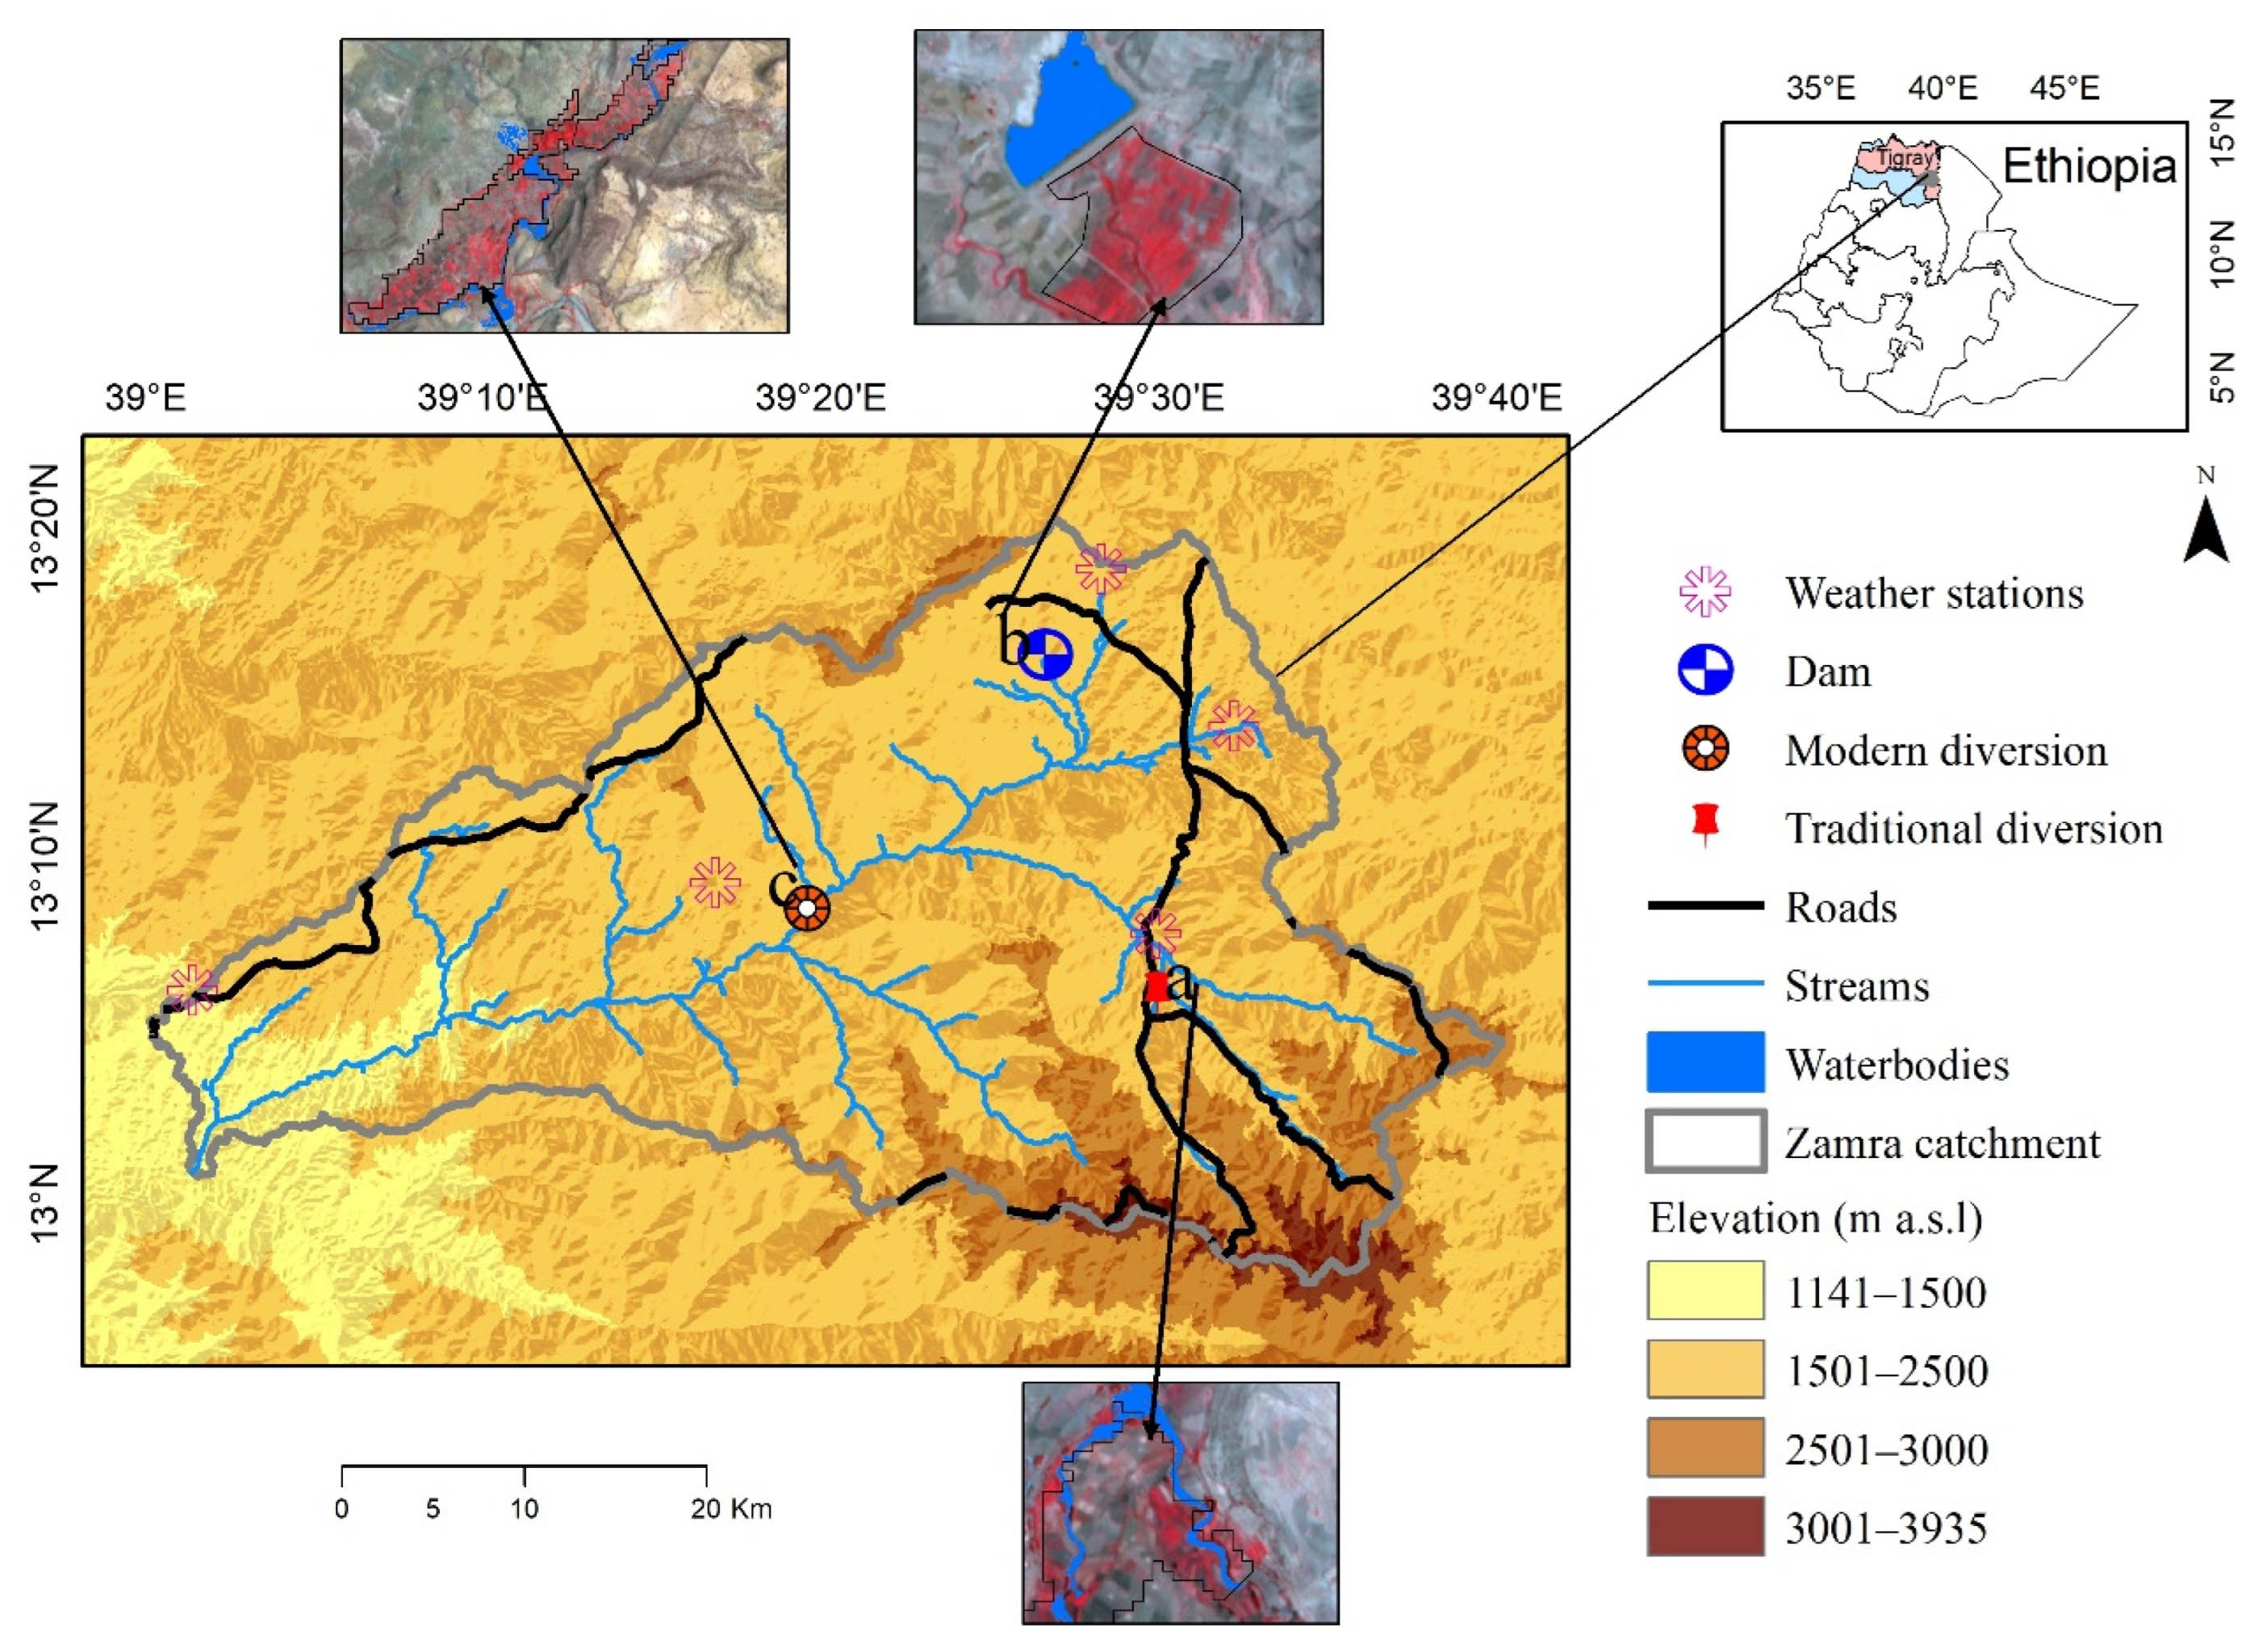
Figure 1. Location of the study area: (a) Traditional diversion, (b) Dam, and (c) Modern diversion.
Water 16 02638 g001
Figure 2. Overview of the approach for selecting the best crop water productivity estimation.
Water 16 02638 g002
Figure 3. Farmer estimation of crop water productivity during the three irrigation seasons.
Water 16 02638 g003
Figure 4. Crop water productivity from the WaPOR database for the three irrigation schemes (spatial resolution is 100 m).
Water 16 02638 g004
Figure 5. Comparison results of the AquaCrop model water productivity for maize and vegetables.
Water 16 02638 g005
Figure 6. Triple-sensor collocation rank for various irrigation schemes R1, R2, and R3 and mapped to blue, red, and green, respectively. If R1 and R3 are ranked the same, the color is cyan. If R1 and R2 are ranked the same, the color is purple. Ranked first for: (A) Maize and (B) Vegetables.
Water 16 02638 g006
Table 1. Average yield and water use for three irrigation schemes across three irrigation seasons.
Scheme TypeYearMaizeVegetables
Yield (kg/ha)Average Water Use (m3/ha)Yield (kg/ha)Average Water Use (m3/ha)
Traditional diversion2017/182843785057329800
2018/1918625622
2019/2020865594
Dam2017/182462518062377390
2018/1922504333
2019/2022294877
Modern
diversion
2017/181997522038707840
2018/1921334445
2019/2019733541
Table 2. Rank for maize and vegetables for all the irrigation schemes.
CropRankTraditional DiversionModern DiversionDam
Maize (Vegetables)R10.992 (1.000)0.996 (1.000)0.991 (0.960)
R20.998 (1.000)1.001 (0.992)1.008 (0.897)
R31.001 (0.999)0.999 (1.000)0.921 (1.031)
Disclaimer/Publisher’s Note: The statements, opinions and data contained in all publications are solely those of the individual author(s) and contributor(s) and not of MDPI and/or the editor(s). MDPI and/or the editor(s) disclaim responsibility for any injury to people or property resulting from any ideas, methods, instructions or products referred to in the content.