Article

Thickness and Structure of Permafrost in Oil and Gas Fields of the Yamal Peninsula: Evidence from Shallow Transient Electromagnetic (sTEM) Survey

1
SIGMA-GEO, 664039 Irkutsk, Russia
2
Institute of the Earth’s Crust, Siberian Branch of the Russian Academy of Sciences, 664033 Irkutsk, Russia
3
Arctic Research Center of the Yamal-Nenets Autonomous District, 629007 Salekhard, Russia
4
School of Subsurface Resource Management, Irkutsk National Research Technical University, 664074 Irkutsk, Russia
5
West Siberian Research Institute of Geology and Geophysics, 625000 Tyumen, Russia
*
Author to whom correspondence should be addressed.
Water 2024, 16(18), 2633; https://doi.org/10.3390/w16182633
Submission received: 8 July 2024 / Revised: 11 September 2024 / Accepted: 13 September 2024 / Published: 16 September 2024
(This article belongs to the Special Issue The Latest Research in Permafrost Hydrology)

Abstract

:
The Yamal-Nenets Autonomous District, especially the Yamal Peninsula located in the permafrost zone, stores Russia’s largest oil and gas resources. However, development in the area is challenging because of its harsh climate and engineering–geological features. Drilling in oil and gas fields in permafrost faces problems that are fraught with serious accident risks: soil heaving leading to the collapse of wellheads and hole walls, deformation and breakage of casing strings, gas seeps or explosive emissions, etc. In this respect, knowledge of the permafrost’s structure is indispensable to ensure safe geological exploration and petroleum production in high-latitude regions. The extent and structure of permafrost in West Siberia, especially in its northern part (Yamal and Gydan Peninsulas), remain poorly studied. More insights into the permafrost’s structure have been obtained by a precise sTEM survey in the northern Yamal Peninsula. The sTEM soundings were performed in a large oil and gas field where permafrost is subject to natural and anthropogenic impacts, and its degradation, with freezing–thawing fluctuations and frost deformation, poses risks to exploration and development operations, as well as to production infrastructure. The results show that permafrost in the western part of the Yamal geocryological province is continuous laterally but encloses subriver and sublake unfrozen zones (taliks) and lenses of saline liquid material (cryopegs). The total thickness of perennially frozen rocks is 200 m. The rocks below 200 m have negative temperatures but are free from pore ice. Conductive features (<10 Ohm﮲m) traceable to the permafrost base may represent faults that act as pathways for water and gas fluids and, thus, can cause a geohazard in the oil and gas fields (explosion of frost mounds, gas blow during shallow drilling, etc.).

1. Introduction

Cold regions cover one-quarter of the land and one-sixth of the globe together with high-latitude seas and oceans. The particular conditions of vegetation, ice dynamics, and permafrost in these regions, which are currently changing in response to global warming, require special studies in the search for approaches to industrial development.
The Yamal-Nenets Autonomous District in northernmost West Siberia, including the Yamal Peninsula, stores Russia’s largest petroleum resources. The petroleum potential of the peninsula has been explored and developed for more than fifty years, though the work is challenging because of the harsh high-latitude climate and permafrost. It is not the very presence but the heterogeneity of permafrost that poses problems to geological surveys and petroleum production in the area. Permafrost is subject to near-surface periglacial processes (thermokarst, frost heaving, etc.) and encloses unfrozen zones (taliks) beneath rivers and lakes, lenses of saline liquid permafrost (cryopegs), as well as occurrences of gas hydrates and free pressurized gas that may emit explosively. Furthermore, the increasing production-related loads from drilling and construction interfere with the natural temperature patterns in permafrost and induce various secondary geocryological processes.
The extent and structure of permafrost in West Siberia, especially in its northern part (Yamal and Gydan Peninsulas), remain insufficiently documented. The first evidence of the Yamal local geology till the late 1940s was only sporadic and limited to a generalized idea of Quaternary deposition and permafrost distribution. Most of the available data were collected in the 1970s–1980s [1,2,3,4,5,6]. Permafrost has been universally accepted to be continuous within the Yamal territory, but it is highly heterogeneous as to temperature, thickness, cryostratigraphy, vertical continuity, ice content, and salinity.
The permafrost’s thickness and structure in the region are poorly constrained by drilling, which is costly and mostly focuses on oil and gas reservoirs at depths of 2–3 km. Direct evidence has been limited to shallow depths of 10−50 m and temperature logs are available from no deeper than 100 m. According to predicted estimates [1,2,3,4,5,6], permafrost in the Yamal area may be from 200 to 500 m (mainly 200−300 m), presumably thicker in the more uplifted axial zone of Yamal and thinner near the Kara Sea. However, the subsurface structure to the 500 m depth has never been imaged before. In this respect, geophysical surveys are of special importance.
Seismic exploration revealed an intricate mosaic near-surface velocity pattern with a strong static component in the wavefield produced by numerous unfrozen zones of various shapes and sizes in permafrost [7].
In addition to the seismic surveys, the northern Yamal Peninsula was studied by shallow transient electromagnetic (sTEM) soundings [8,9,10].
The reported study was performed in a large oil and gas field where permafrost is degrading as a result of natural and anthropogenic impacts. The related freezing–thawing fluctuations and frost deformation within the field pose risks of engineering–geological disasters during exploration and development.
The aim of the mentioned studies refers to oil and gas exploration, as well as to studying in detail the internal structure of permafrost rocks. The studies allowed detailing of the model of the permafrost’s structure to a depth of 500 m in the central part of the Yamal Peninsula. The depth of the permafrost base, taliks location, cryopegs, and fault zones were mapped. At the same time, the northern part of the peninsula remained completely unexplored, although it is in this territory that massive ice deposits may appear. The authors of this paper tried to compensate for this shortcoming.
The new sTEM data from the area reported in this paper, combined with earlier evidence, provide an updated view of the permafrost’s thickness and structure to a depth of 500 m. Integrated sTEM, hydrogeological, geocryological, and logging data can shed new light on the structure of permafrost and its responses to natural and production-related effects.

2. Study Area

The study area is located in the northern Yamal Peninsula surrounded by the Kara Sea in the north and west and the Ob Gulf in the east. The survey focused on the upper 500 m of sediments within reservoirs of a large oil and gas field (Figure 1 and Figure 2A,B), which store economic amounts of gas at depths from 1000 to 3000 m. Oil and gas accumulated in a large NE-oriented anticline contoured from seismic reflectors in Cretaceous and Jurassic strata.

2.1. Geocryological Conditions of Northern Yamal

The study area falls within the eastern part of the Yamal geocryological province, according to the division of the West Siberian Plain along the permafrost top. The geocryological maps of West Siberia complied by A. Popov in 1953 [11], V. Baulin et al. in 1967 [12], and V. Trofimov et al. in 1987 [13] place it within a northern zone of continuous low-temperature heterogeneous syngenetic permafrost lying over epigenetic permafrost.
The mainly 200–300 m thick permafrost in the peninsula includes, from top to bottom, an ice-rich upper 5−7 m layer, 0.5 to 30.0 m thick lenses and layers of ground ice between 20 and 70 m, lenses of pressurized and non-pressurized saline liquid (cryopegs), as well as intra-permafrost accumulations of free and clathrate gas at 30 m and deeper. The frozen rocks are affected by hazardous periglacial processes of solifluction, thermal erosion, and frost heaving.
In general, the permafrost of the area is markedly thinner in the western, northwestern, and northern Kara Sea coast of Yamal than along the Ob Gulf coast, but is the thickest in the central part of the peninsula, where it reaches at least 300 m [1,2,3,4,5,6]. It locally has a two- or three-layer structure in a low-elevated flood plain and the Layda area, with zones of pressurized brines set into solid frozen ground, lying over more ductile sediments at warm negative temperatures free from evident ice inclusions.
The permafrost base is commonly traced according to the deepest evident or latent ice inclusions, but pore moisture in the permafrost of the Yamal geocryological province remains liquid to temperatures of −1.8 °C to −2.0 °C due to its salinity. The sediments are saline all over the Cenozoic section and are perennially frozen to depths of 200 m in the west and 400 m in the east of the Yamal geocryological province. Thus, the unfrozen sediments immediately beneath the permafrost base in the area have negative temperatures, while the 0 °C isotherm lies as deep as ~480–490 m [14]. The ice content decreases with depth in the series “ice-rich—ice-bearing—ice-poor sediments” correlated with the lithological series “sand—silty sand—clay silt—clay”.

2.2. Geocryological Conditions within the Studied Oil and Gas Field

The oil and gas field covered by sTEM soundings occurs in the zone of a continuous 250 m or locally 300 m thick permafrost under an active layer of 0.3–1.5 m or 2–5 m in river valleys. The cryostratigraphy consists of ~100 m thick continuously frozen sand and clay above, ~100 m of mainly frozen clay in the middle, and ~50 m of intercalated unfrozen and frozen sandy sediments below.
The permafrost temperature varies with depth, being −2.5 °C to −7.0 °C at the active layer base, depending on topography, −2 °C at the base of the upper layer (100 m), −2°C to −1 °C in the middle 100 m, and −1 °C to 0 °C in the lower layer. The average temperature gradient beneath the permafrost is 3.2 °C. Taliks occur under river valleys and lakes deeper than 1.5 m. The subriver taliks are 15–20 m thick; some sublake taliks are open and connected with unfrozen sediments below.
Shallow permafrost encloses ice wedges and layers of ground ice locally reaching tens of meters in thickness.

2.3. Local Geomorphology

The northern Yamal area (Figure 2B) is a terraced coastal plain on a swampy watershed surface, with elevations from 50 m above the sea level on watersheds to 10 m in river valleys. The flat surface topography impedes river and groundwater runoff, which increases soil moisture contents and produces swamps. The terrain is affected by thermokarst and thermal erosion features, frost cracks, pingoes, and aufeis
The drainage network consists of numerous large and small meandering rivers, rills, and lakes. The river incision reaches 10 m, and the banks are up to 20 m high. The abundant lakes are mainly of thermokarst and oxbow origin. Thermokarst (thaw) lakes differ in surface area and shape, and most often are no deeper than 2–3 m, though some have bottom pits reaching 5–7 m deep. Shallow thermokarst lakes freeze up, fully or partly, in the winter season. Many lakes have dried out and became so-called khasyreis.
The river and lake waters are mainly ultrafresh and have sodium bicarbonate major-ion chemistry. Relatively large rivers receive inputs of saline water from the Kara Sea tides to distances of 50 to 60 km.

2.4. Local Geology

The area belongs to the Yamal–Taz lithofacies region. According to the Quaternary division of Russia, the Yamal Peninsula is a Late Pleistocene glacial zone (ZSI1, Yamal region) [15,16]. Quaternary sand, clay, clay silt, silt, and peat deposited in floodplain, floodplain–terrace, and marsh environments, 100 to 200 m thick, lie over eroded Upper Cretaceous and Paleogene surfaces.
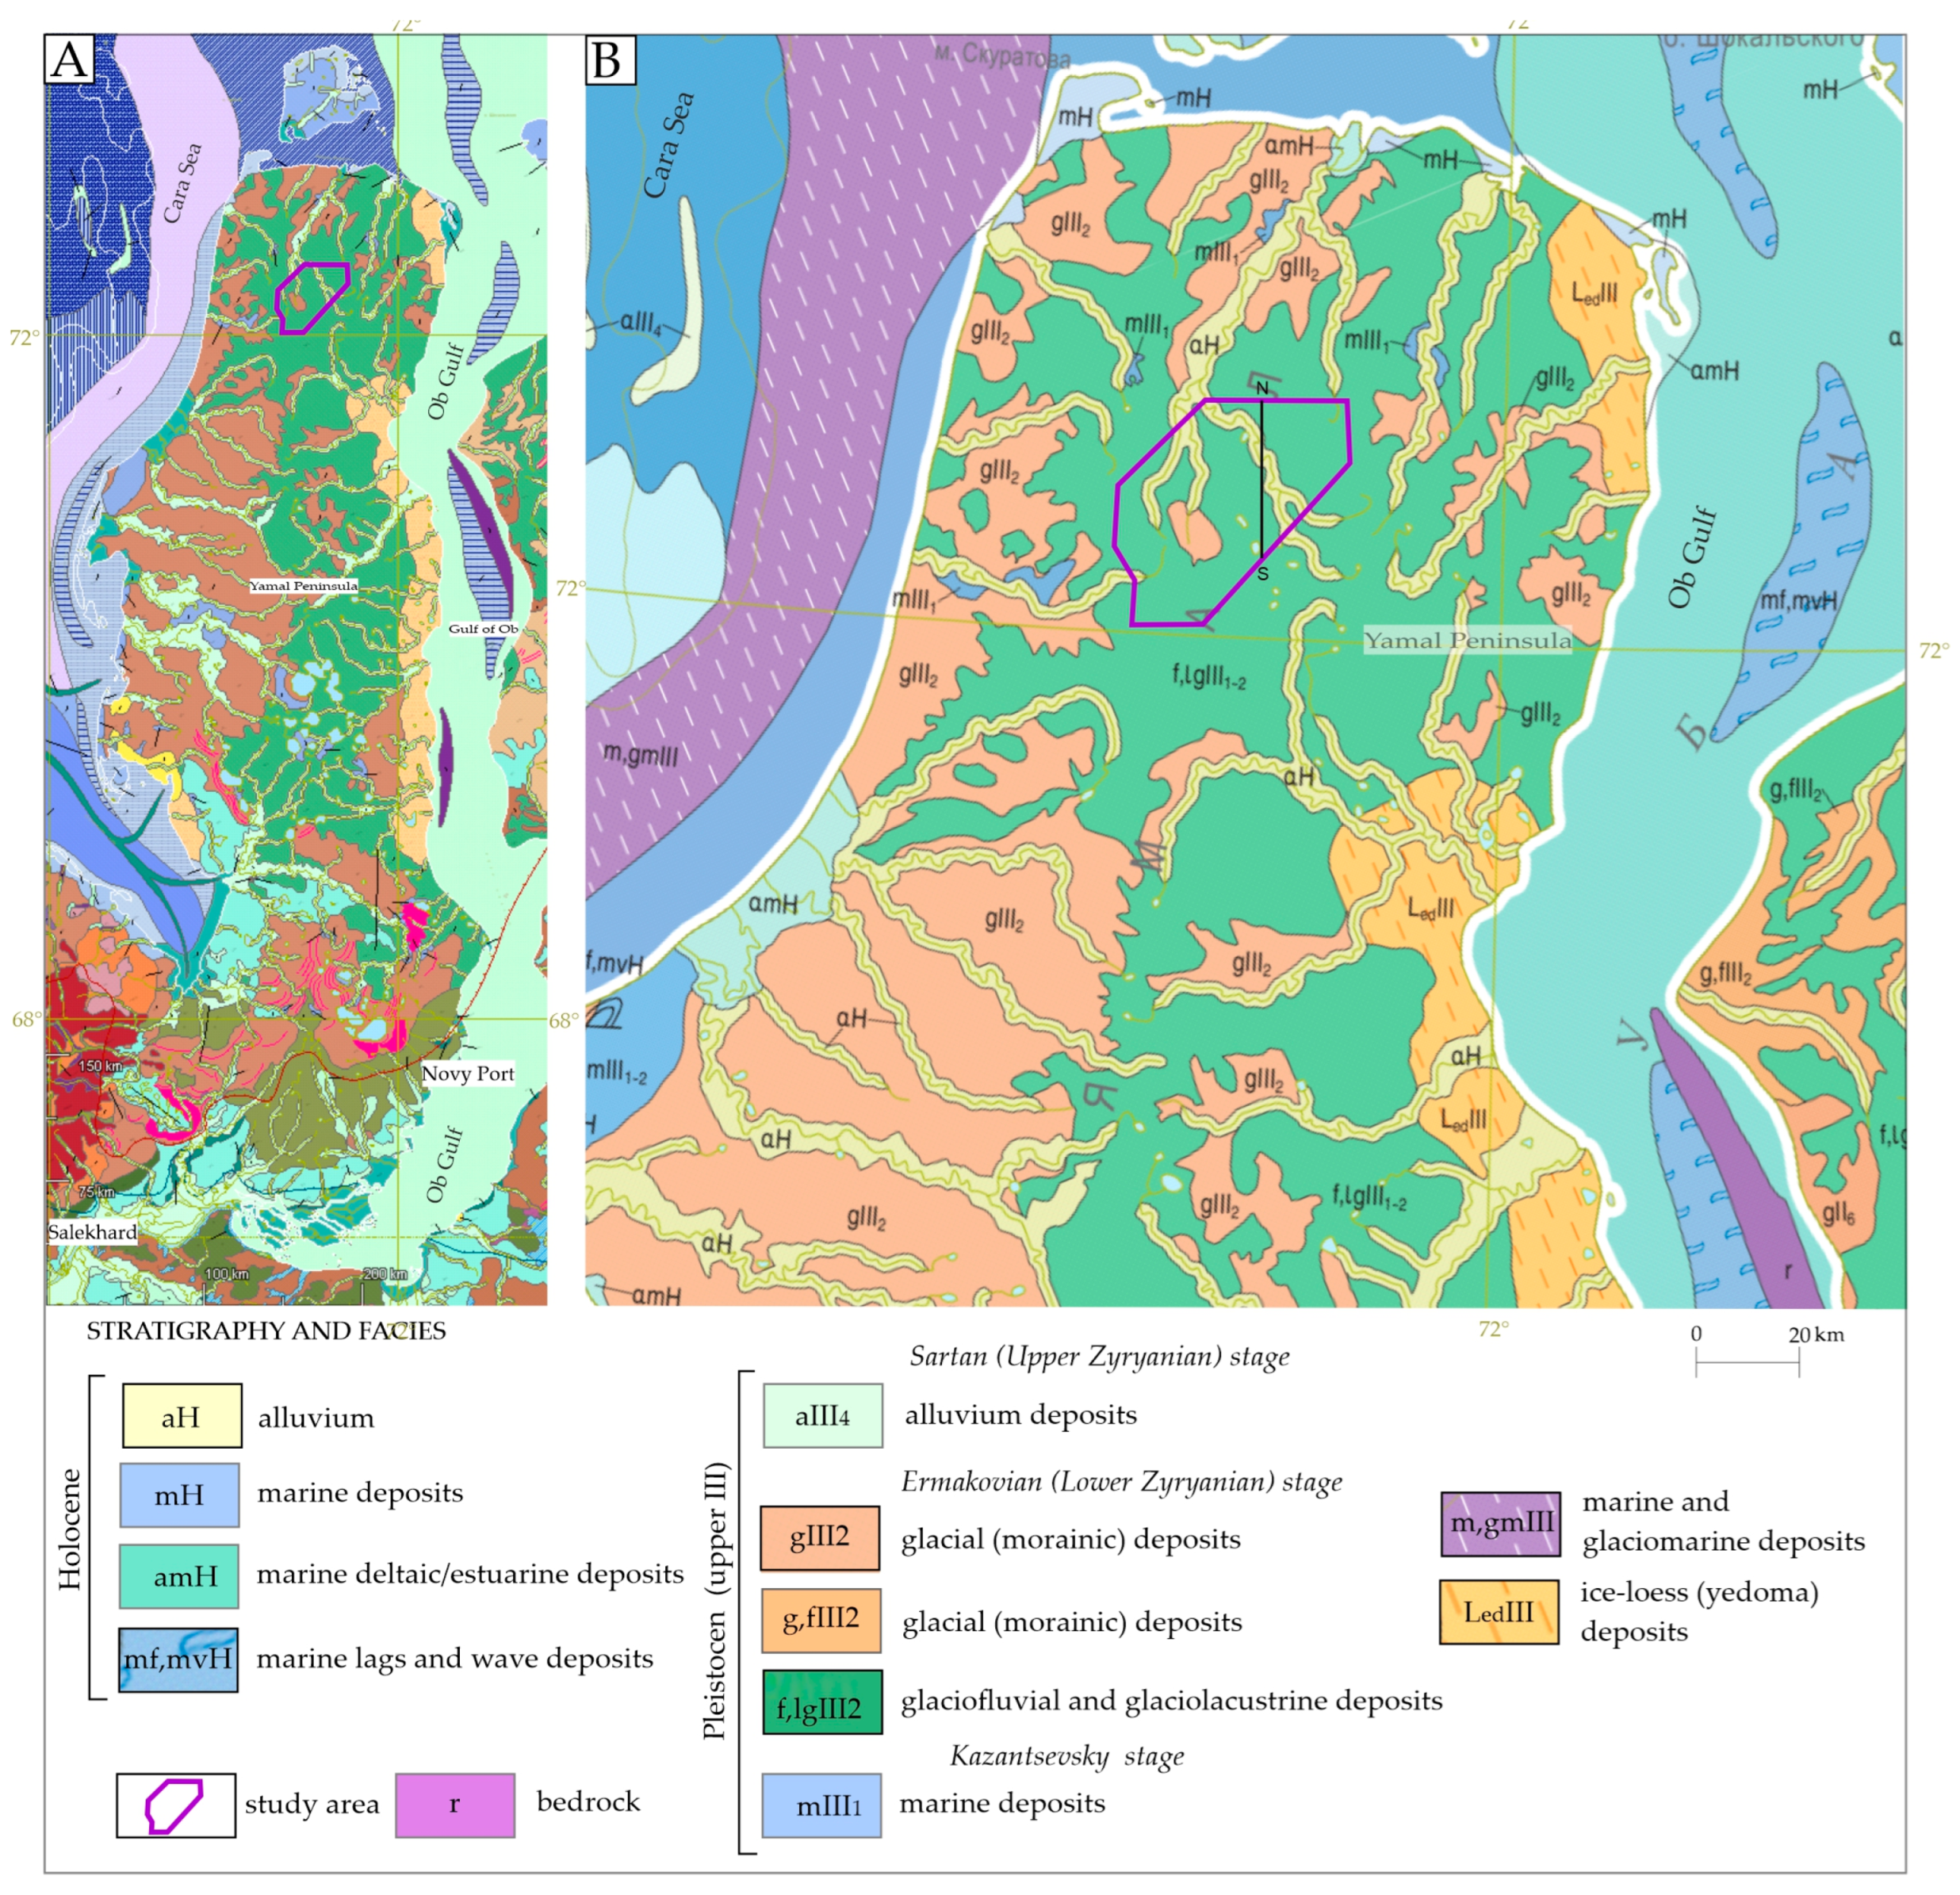
The 1:2,500,000 map of the Quaternary [15,16] displays widespread sediments deposited during the Ermakovian (Lower Zyryaninan) regional stratigraphic stage. The Late Pleistocene glaciofluvial, glaciolimnic, and glacial facies are sandwiched between Holocene alluvium above (Figure 3) and late Pliocene–Pleistocene marine silt and clay with sand intercalations below. The Pliocene rocks are lacustrine–alluvial, lacustrine, and marine silt, sand, and clay silt, presumably of the Novy Port Formation [15,16].

3. Materials and Methods

3.1. Transient Electromagnetic Method (TEM): Physics, Petrophysical Explanation, and Application

The transition of pore water to pore ice in freezing rocks causes changes in their structure and properties [17] detectable in geophysical fields [18,19,20,21,22,23,24,25].
The presence of heterogeneous permafrost in shallow sediments poses earthing, blasting, screening, and other problems to geophysical surveys, as well as to the processing and interpretation of seismic, dc resistivity, and gravity data.
Permafrost rocks greatly complicate seismic exploration. Seismic velocities in frozen rocks are significantly higher than in the host rocks. If there is a thawed layer on top (as is usually the case), it is a strong waveguide through which interference, many times greater in intensity than deep reflections, propagates almost without attenuation. Therefore, permafrost zones are characterized by several factors that are unfavorable for seismic exploration: low-velocity local thawing, strong waveguides in the upper part of the section, and high-velocity head waves. Due to the lack of a reliable solution to these problems, the use of seismic exploration for studying the upper part of the section is unfavorable.
A resistivity survey (direct current method, DC) requires grounding (galvanic contact with the earth) and becomes less efficient because of the screening effect from high-resistivity layers, e.g., permafrost. In the harsh Arctic climate, the resistivity surveys are feasible no more than two or three months in a year. Therefore, it is reasonable to consider the applicability of induction methods, which are free from the above limitations.
The TEM soundings are commonly run by multioffset transmitter–receiver systems with square ungrounded loops. The method has a number of advantages: precise contouring of targets; high resolution exceeding that in other resistivity methods; low sensitivity to anisotropy or near-surface heterogeneities; no need for galvanic grounding; operation in any climate and weather conditions, including in winter; and large penetration depth, e.g., systems with 100 m transmitter loops can penetrate 500 m deep in West Siberian permafrost areas. The latter two advantages are especially important for the Arctic. Furthermore, TEM soundings are advantageous over the DC resistivity methods that fail to resolve subsurface below the resistive screens. The high-resistivity features, such as permafrost reaching thousands of Ω∙m, pose no problem to TEM surveys, which can map the permafrost base and image the subpermafrost resistivity patterns. The near-surface surveys are called shallow TEM (abbreviated as sTEM).
The scope of work in the present study included a transient electromagnetic survey. Transient electromagnetic (TEM) sounding is a controlled-source method which samples transient responses of the sounded earth to transmitter current change [8]. The primary EM field is generated by switching the transmitter current off in a controlled way. The source signal corresponds to the Heaviside step function (pulse and pause); the sampling occurs during the pause, which has to be long enough for the transient process to complete: 10 ms for certain geological settings and rock conductivity. Once the primary field in the source dipole is switched off, the EM wave induces eddy currents within buried conductors. The eddy currents, in their turn, produce a secondary field (measured by the receivers) which decays with time in a complex way as a function of the conductivity and thickness of earth layers and migrates downward in a spiral, from the ground surface at the beginning of the transient process (t0) to progressively later times.
The prerequisites for the applicability of the TEM survey to permafrost areas are associated with the physics of permafrost itself [8,9]. At negative temperatures, free water converts to ice, and conduction is along films of unfrozen (mainly bound) water around mineral grains and ice. The presence of ice as a rock-forming mineral changes the electrical properties of rocks, while the resistivity range of permafrost increases as a function of chemistry and cryostructure, due to diverse interactions of unfrozen water with the mineral and ice components [26] (Figure 4).
The resistivity of both interstitial water and rocks also depends on the salinity of groundwater, while the resistivity of ice may vary as a function of temperature and the salinity of frozen electrolytes.

3.2. Instruments, Data Processing and Inversion

Shallow TEM soundings as part of this study were performed on a high-density network in the Yamal Peninsula in order to image the subsurface to a depth of 500 m. The system consisted of 100 m and 5 m long ungrounded square transmitter and receiver loops, respectively, at zero and 100 m offsets (recording by 3 receiver loops from each transmitter loop). The transmitter current reached 30 A, the receiver spacing was 100 and 300 m, and the profiles were 300 m apart. Pulse and pause durations were 20 and 10 ms, respectively; sampling rate varied from 25 ns for early decay times to 25.6 µs for late times.
The density of the 3D sounding grid was as high as 19.8 points per km2.
TEM soundings have been performed with a FastSnap multichannel digital telemeter system [27]. The field data were processed and the transients were inverted based on an integrated approach in the TEM Processing software [28], using diverse digital tools and automatic correction of processing errors during inversion.
An integrated approach to the processing and inversion of TEM data is an approach based on the use of a single method of digital processing of measured and theoretical (model) signals within a single physical observation. The main idea underlying the integrated approach is the automatic consideration during inversion of the distortions introduced by digital filters at the signal processing stage. The possibilities of minimizing interference in this case will be higher due to the use of a wider range of procedures, including those distorting the frequency response of the useful signal, but at the same time, increasing the signal-to-noise ratio (SNR) to the required level. To compensate for the introduced distortions and improve the reliability of the inversion result, the same “processing graph” that was used to obtain the practical curve should be automatically applied to the calculated response of the forward problem within the integrated approach. Thus, during the inversion, the observed and theoretical curves processed in the same way, i.e., transferred to a “single reference system”, will be compared, and the processing graph itself will be formed in each specific case based on the need and expediency of applying certain procedures.
The sTEM curves were inverted within the deterministic framework, with the thickness and resistivity of the model layers allowed to vary [8]. The 1D Earth responses from each sounding point were first processed by a forward algorithm designed at the Trofimuk Institute of Petroleum Geology and Geophysics (Novosibirsk) [29]. The forward solution was obtained with regard to the pulse and ramp (current turn-off) durations. The inversion was carried out by iterative adjusting of resistivity and layer thicknesses until the minimum misfit between the theoretical and field curves. No limitations for changes in layer resistivity were imposed. The inversion was performed taking into account induced polarization parameters such as the Cole–Cole complex frequency-dependent conductivity related to chargeability, relaxation time, and exponent. TEM inversion included evaluating the parameters of each layer’s electrical resistivity, layer thickness, and the chargeability parameter. The average inversion misfit did not exceed 5%. The results of the sTEM inversion were checked against resistivity logs for the boundaries of geological intervals and sTEM resistivity patterns.
The inversion yielded a 1D multi-layer geoelectric model for each TEM sounding point, and all 1D models were then combined in a 3D cube used to derive 2D resistivity sections and maps. The 3D cube was built by interpolating 1D models using the kriging method. The accuracy of the interpolation depends on the spacing between TEM sounding points and is 50 m along the profile and 150 m between profiles.

4. Results and Interpretation

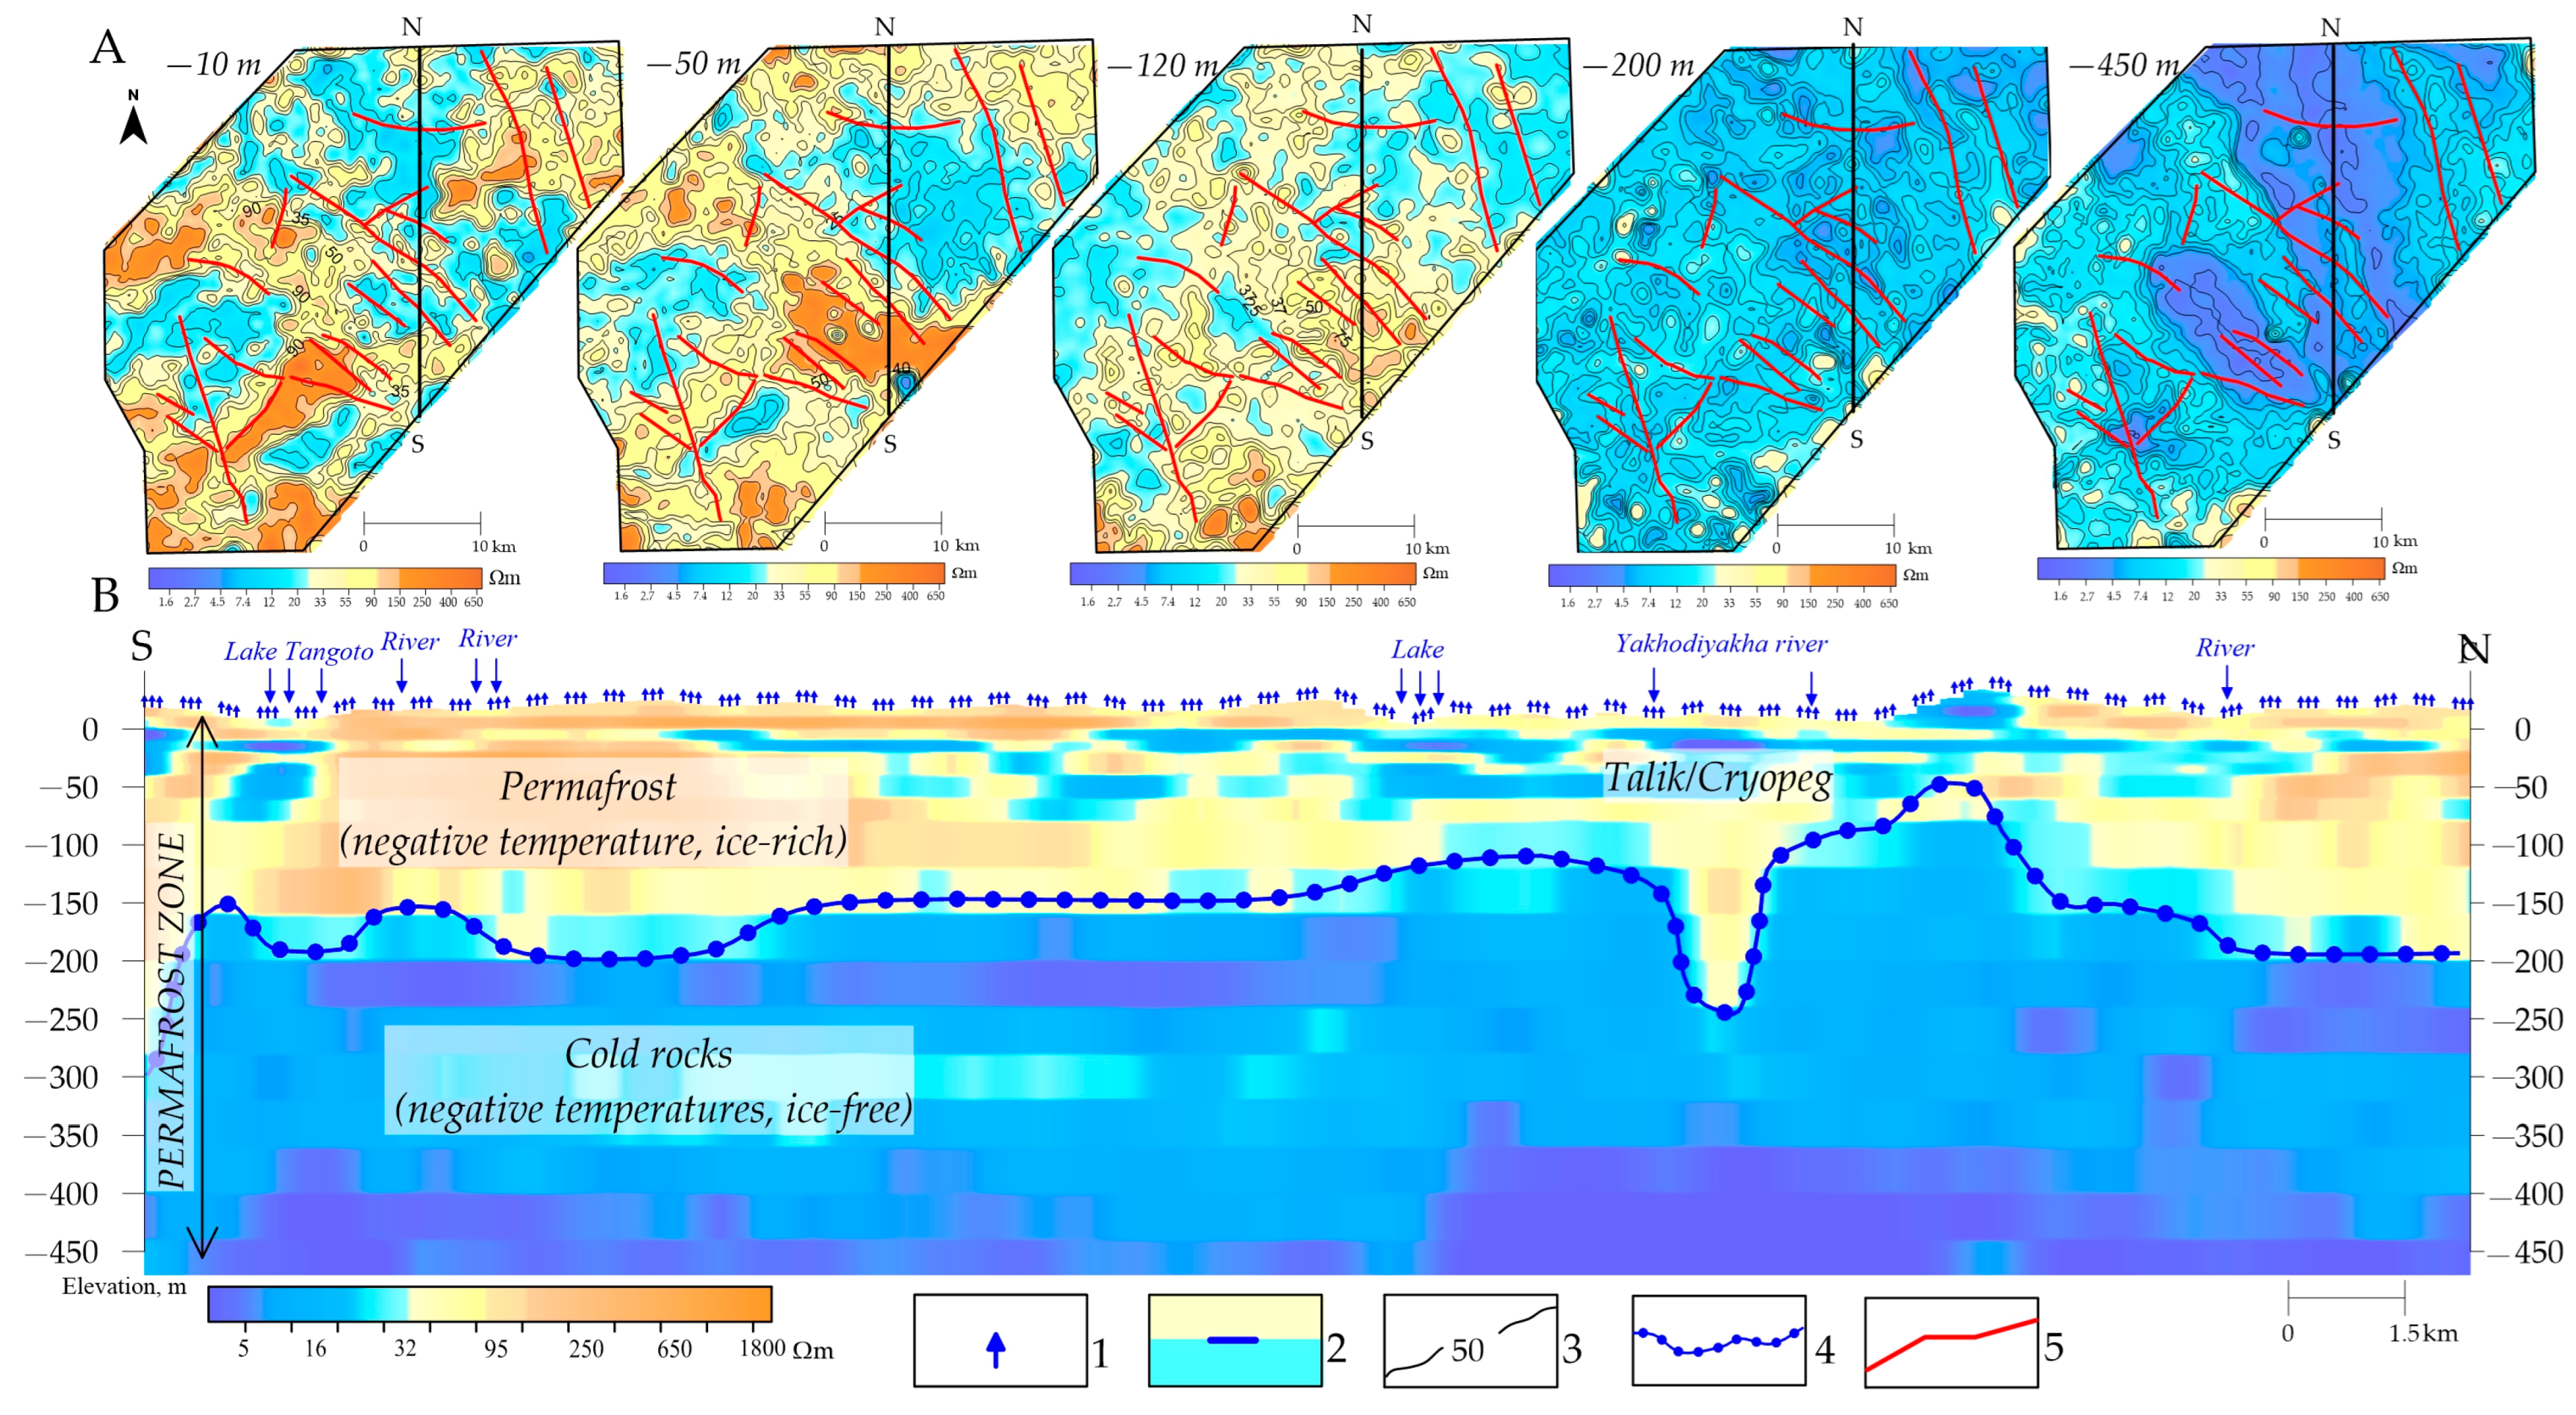
The sTEM data reveal a highly differentiated shallow subsurface to depths of about 500 m. The heterogeneous resistivity pattern records a complex structure of the permafrost (Figure 5B).

4.1. Permafrost Mapping

The upper ~200 m of rocks, varying in resistivity from 20 to 800 Ohm, are perennially frozen Quaternary and Paleogene sediments with ice layers and lenses.
Ice-rich permafrost is markedly more resistive than the host sediments, but the resistivity decreases down the section to 3 Ohm∙m.
The depth-dependent variations in permafrost properties are imaged in resistivity maps for different depth levels from −10 to −400 m asl based on sTEM data (Figure 5A). The maps show perennially frozen resistive rocks to depths of 150–200 m and a large zone of relatively low resistivity (10–25 Ohm∙m) at 10–50 m depths along a river, which may be due to the warming effect of water. The river banks accommodate numerous filled and dry lakes. The presumed unfrozen zones in the southwestern and northeastern parts of the study area are controlled by faults traceable from the reflector D (Cenomanian).
Previous TEM surveys in the Bovanenkovo oil–gas-condensate field [30] revealed wedge-like permafrost thinning in a fault zone, apparently because the temperature patterns of shallow sediments were disturbed by rapid heat and mass transfer through faulted rocks.
The active layer thickness, temperature, and structure of permafrost, as well as its very presence, can change within very short distances. Permafrost becomes sporadic at -200 m asl and almost disappears at depth levels between 230 and 450 m, where the rocks are at negative temperatures but are free from ice inclusions.
Thus, the subsurface to ~200 m depths is occupied by 20 to 800 Ohm∙m permafrost lying over ice-free cold rocks.
Below, to a depth of 450 m, the rocks are in a frosty state. They have a low temperature but do not contain ice. Thus, according to the data of the conducted studies, the contact between ice-saturated and ice-free rocks in the thickness of saline soils was mapped; that is, the depth of the base of the frozen rock layer of the cryogenic thickness was determined. It is remarkable that this does not apply to the depth of the 0 °C isotherm.
The permafrost is highly heterogeneous, both laterally and vertically. The resistive zone encloses low-resistivity (5–20 Ohm∙m) anomalies of various shapes and sizes at different depths, as well as 200–800 Ohm∙m features. The inferred depth to the permafrost base is likewise variable: 50 to 250 m.
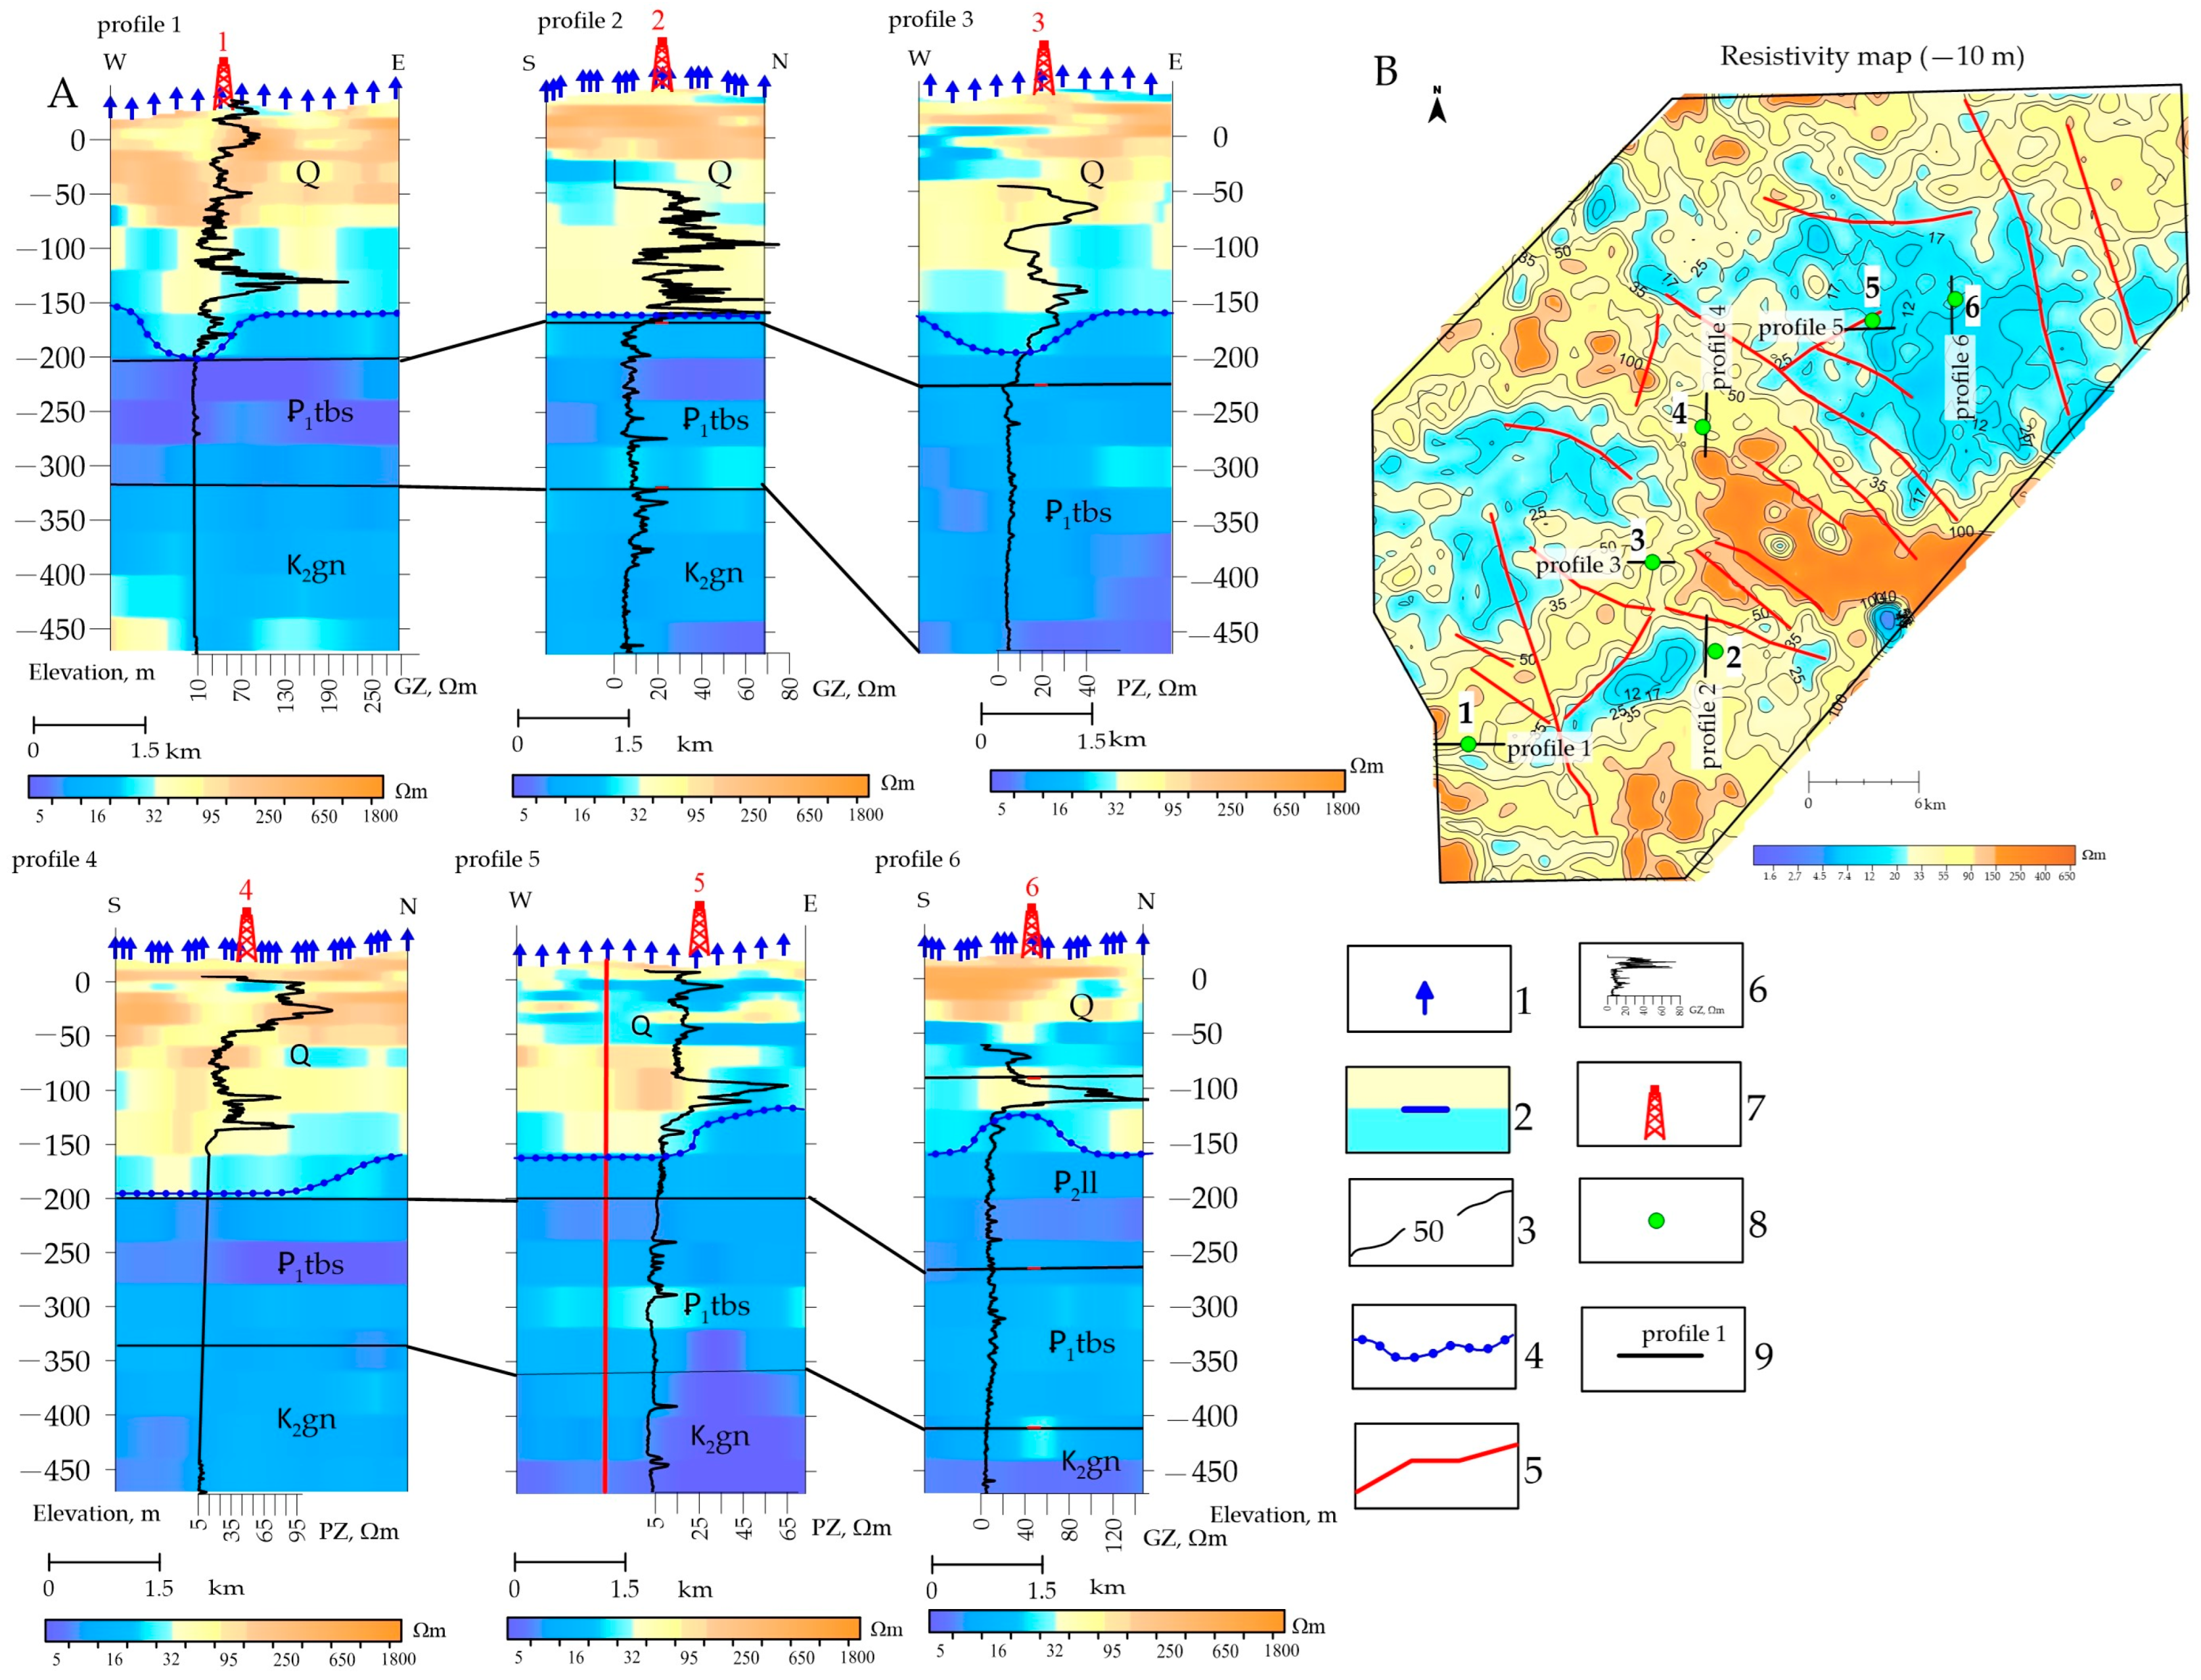
The physical–geological model of the study area was obtained with reference to resistivity logs within depths of 0–500 m, which were available for six wells only. The resistivity logs and the lithology of core samples confirm the extent of permafrost to a depth of ~250 m.
The relatively resistive (100–250 Ohm∙m) rocks reach 150–200 m depths corresponding to Quaternary clastic sediments with >700 mm voids produced by ice melting (Figure 6). The layer below this interval has a low resistivity of 5–10 Ohm∙m and consists of interbedded clay and siltstone that belong to the Paleogene Tibei-Sale Formation (Pgtbs) over the Upper Cretaceous Ganka Fm. (K2gn) of alternating clay, sandstone, and siltstone.
The resistivity pattern of permafrost reflects the variations in its temperature, thickness, cryostratigraphy, continuity, and ice contents, as well as the presence of unfrozen zones of taliks, cryopegs, etc.
Salinity is known to be another important control of rock properties in any lithology: temperature patterns, mass transfer, strength, strain, etc. The salinity dependence of different parameters correlates with the amount of unfrozen pore water.
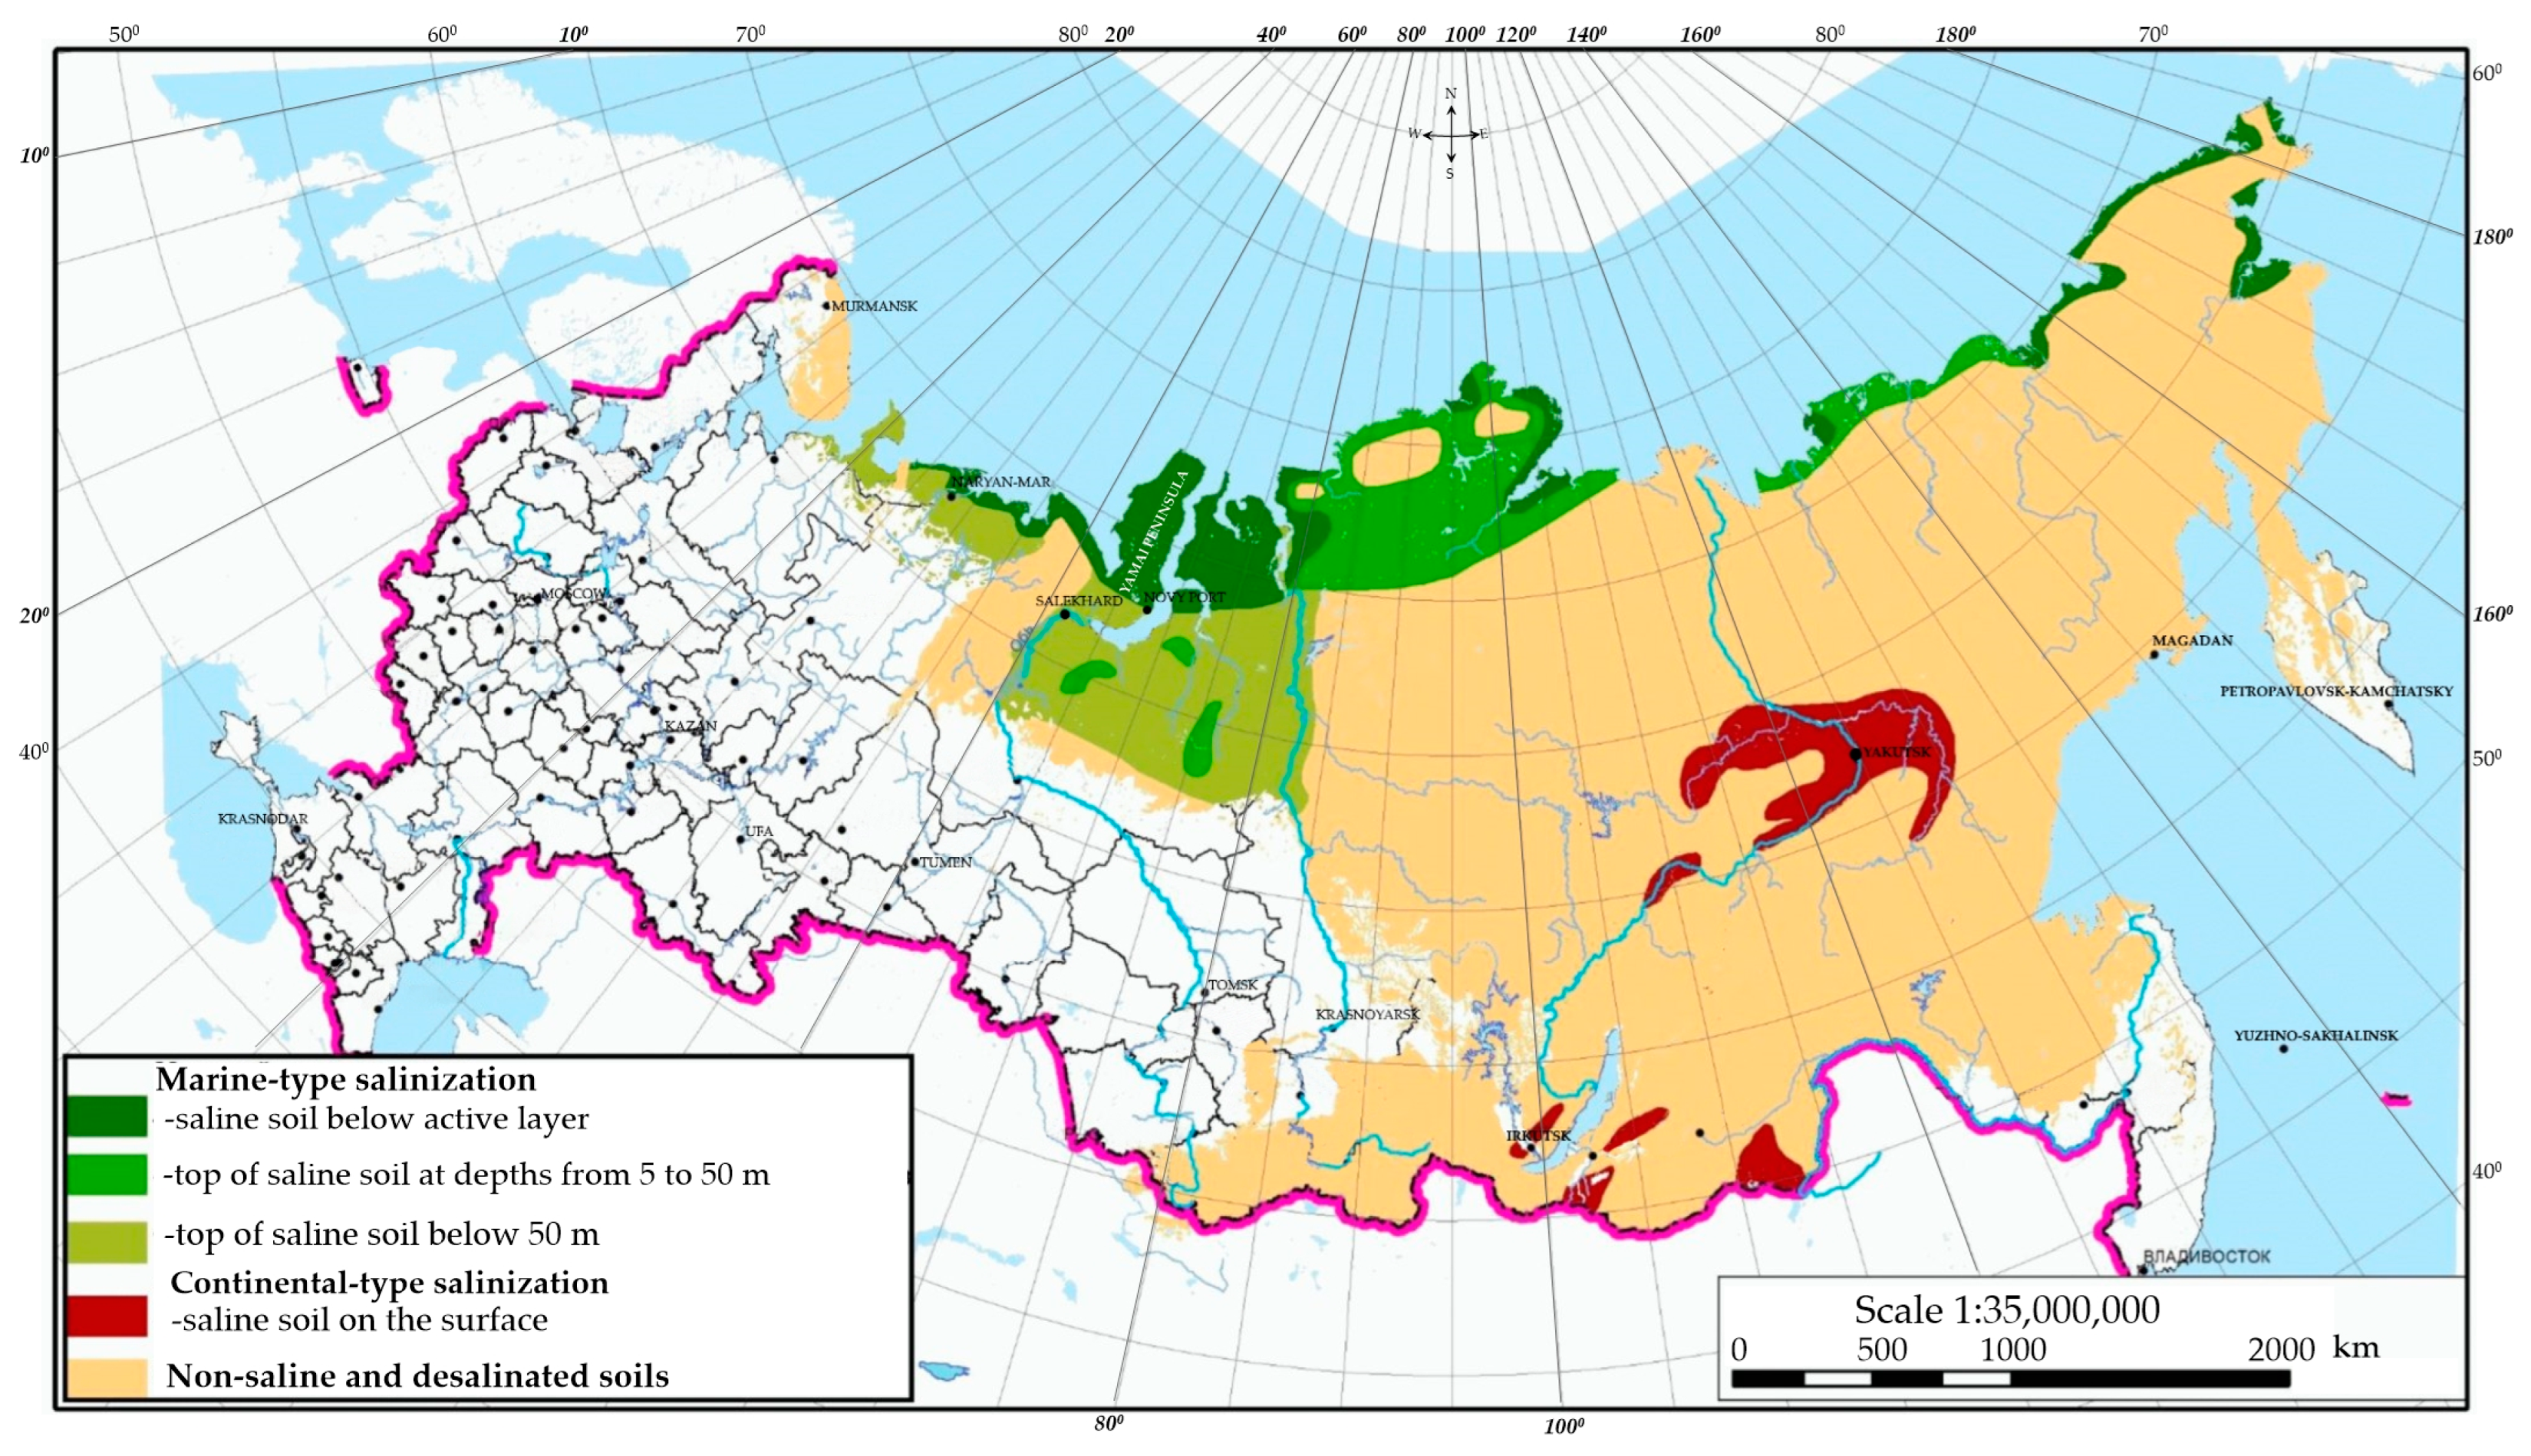
The zone of saline permafrost and cryopegs in the Yamal Peninsula is located north of the Novy Port latitude [31], where relatively high salinity spreads to the permafrost base (Figure 7).
Saline permafrost in the Arctic coast is typically formed by the freezing of sediments which were deposited in seas of normal or low salinity and then emerged during regression. Changes in the sea depth, temperature, and deposition environment, whereby the sediments could freeze from above, below, and on the sides, resulted in intricate freezing and salinity patterns [32].
On the other hand, cryoconcentration (expulsion of pore water upon freezing) produced lenses of highly saline water at warm negative temperatures (cryopegs). Specifically, cryopegs in the Yamal Peninsula result from the freezing of Pleistocene marine sediments which emerged above the sea level. Freezing involved river and sea spits and subriver and sublake taliks saturated with saline water. The same cold event caused the related formation of ground ice [33], which commonly has quite a low but highly variable salinity, according to data of major-ion chemistry [34,35]. Judging by the relative contents of major ions, the ground ice, cryopegs, and their host sediments in Yamal share a common origin [33].
Sediments can also become saline after deposition, when they submerge during high-stand periods (secondary or epigenetic salinization) and form saline permafrost during the following regression cycle [32].
The perennially frozen upper 150−250 m of sediments contain less salt than the concentration equilibrated with temperature, but there are higher-salinity cryopegs. The ice-free cold (<0 °C) sediments below 100−200 m, which were studied in more detail within the Bovanenkovo field [33], enclose thick ground ice. In some sections, the ground ice is sandwiched between saline mudrocks above and sand with cryopeg lenses below.
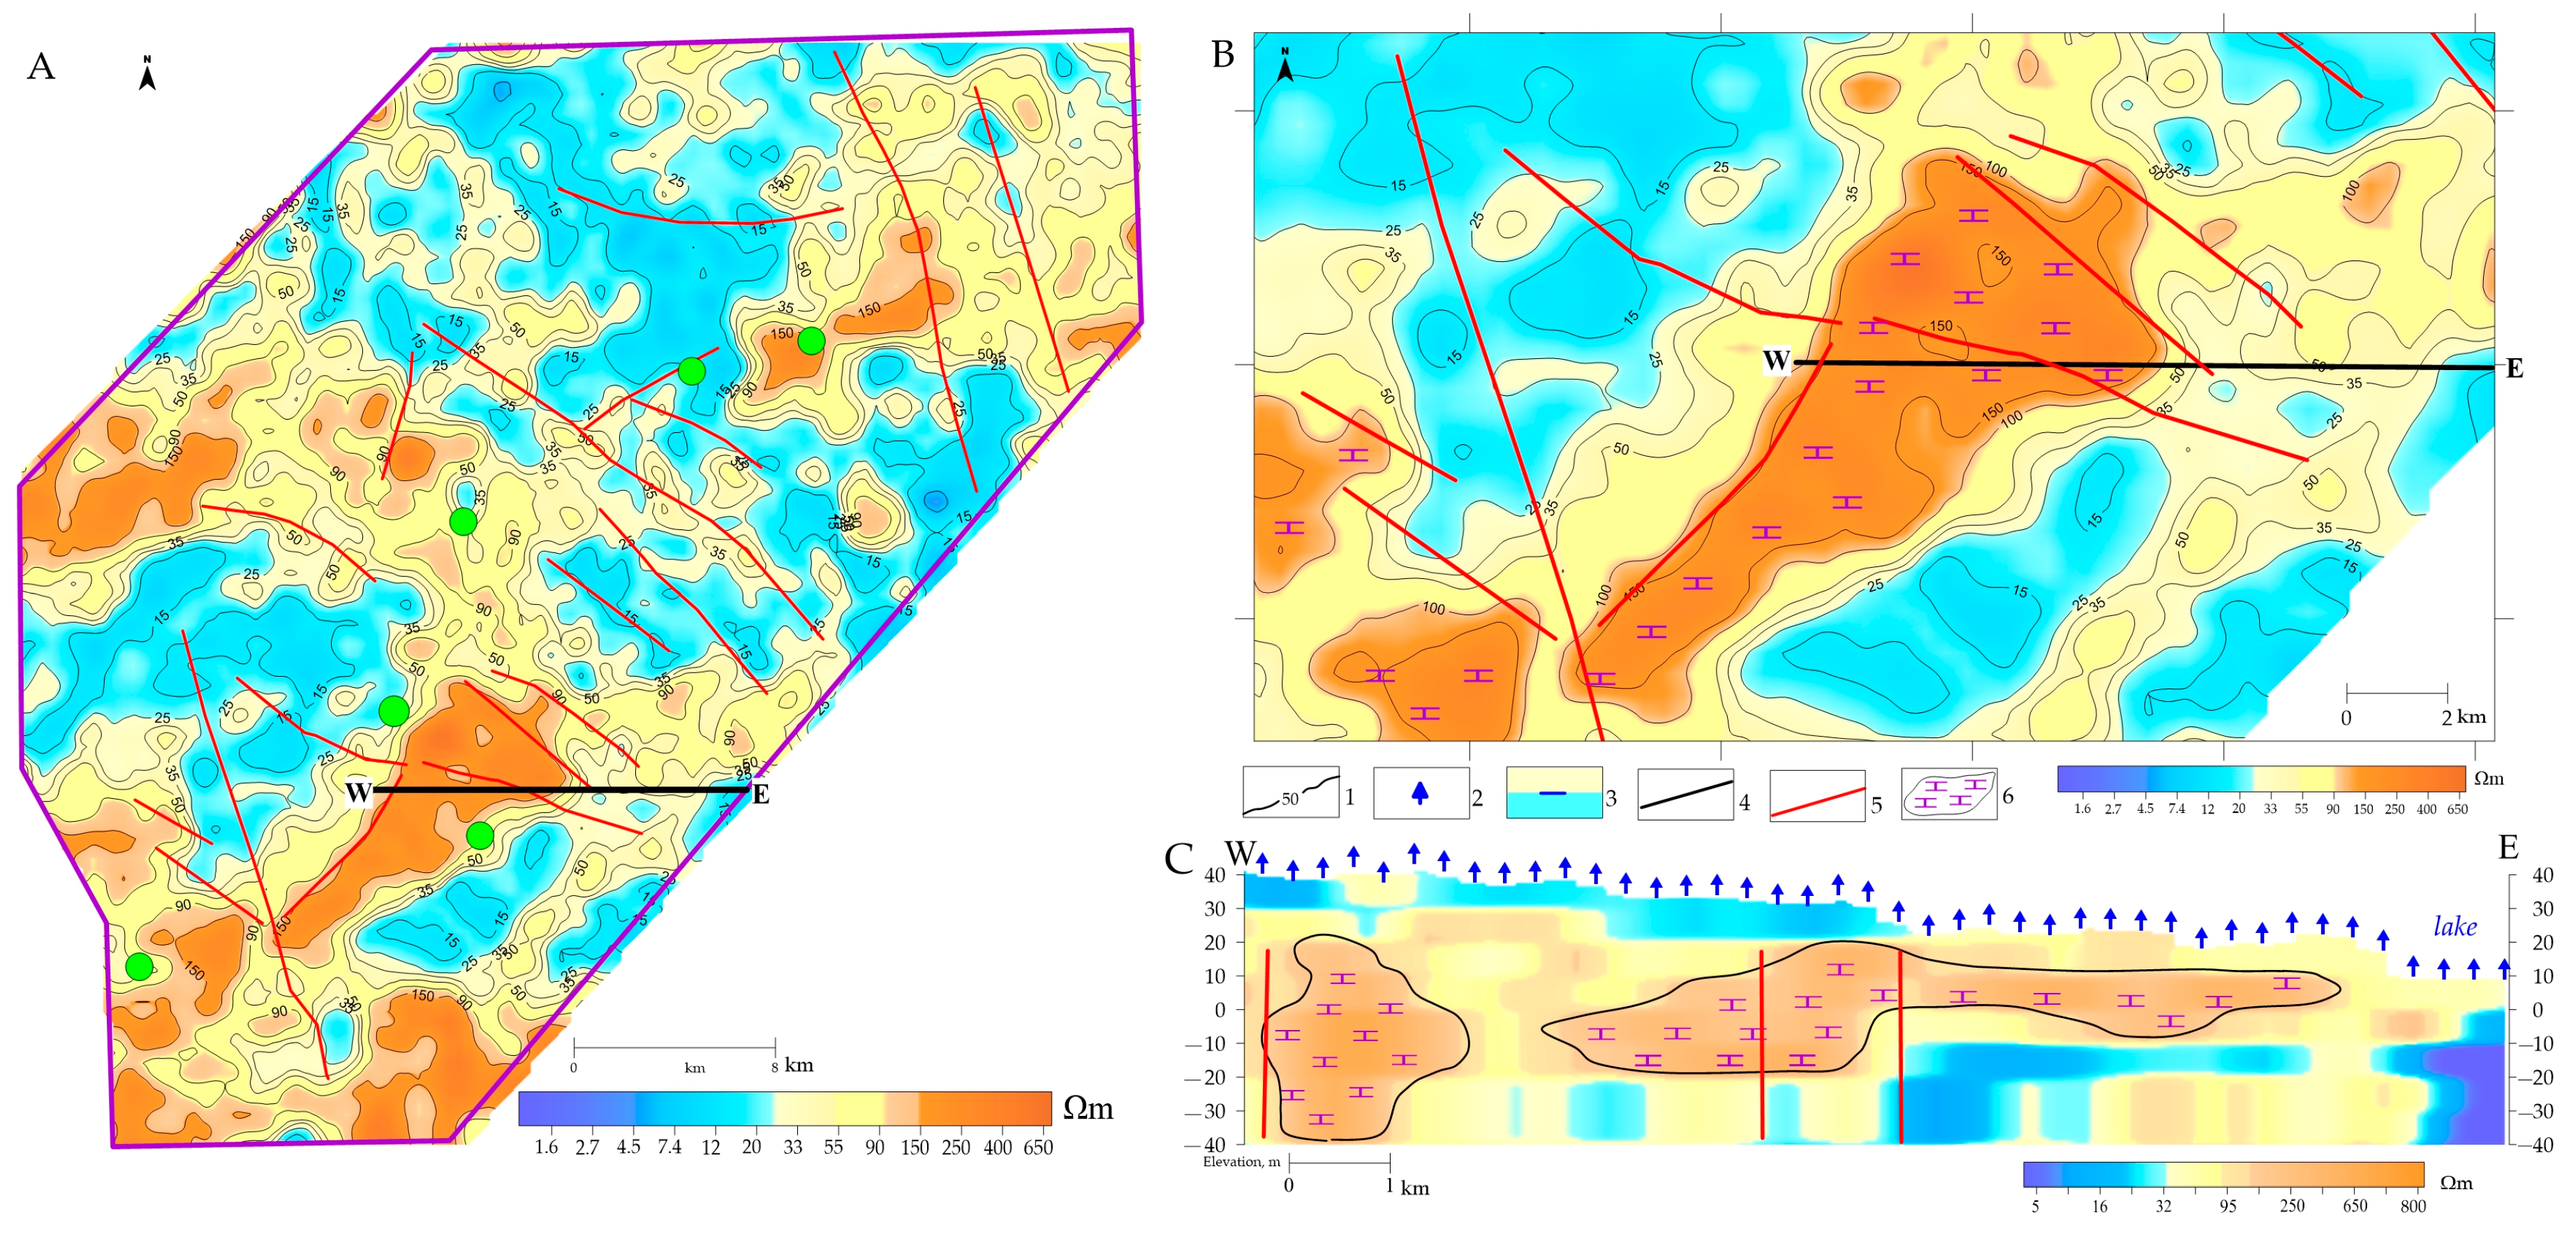
Thus, the revealed resistivity highs and lows within 200 m depths may be related to subriver or sublake taliks (10–20 Ohm∙m), cryopegs (to 5 Ohm∙m), vertical conductive features (to 20 Ohm∙m), and ground ice (to 1000 Ohm∙m) (Figure 5 and Figure 8).
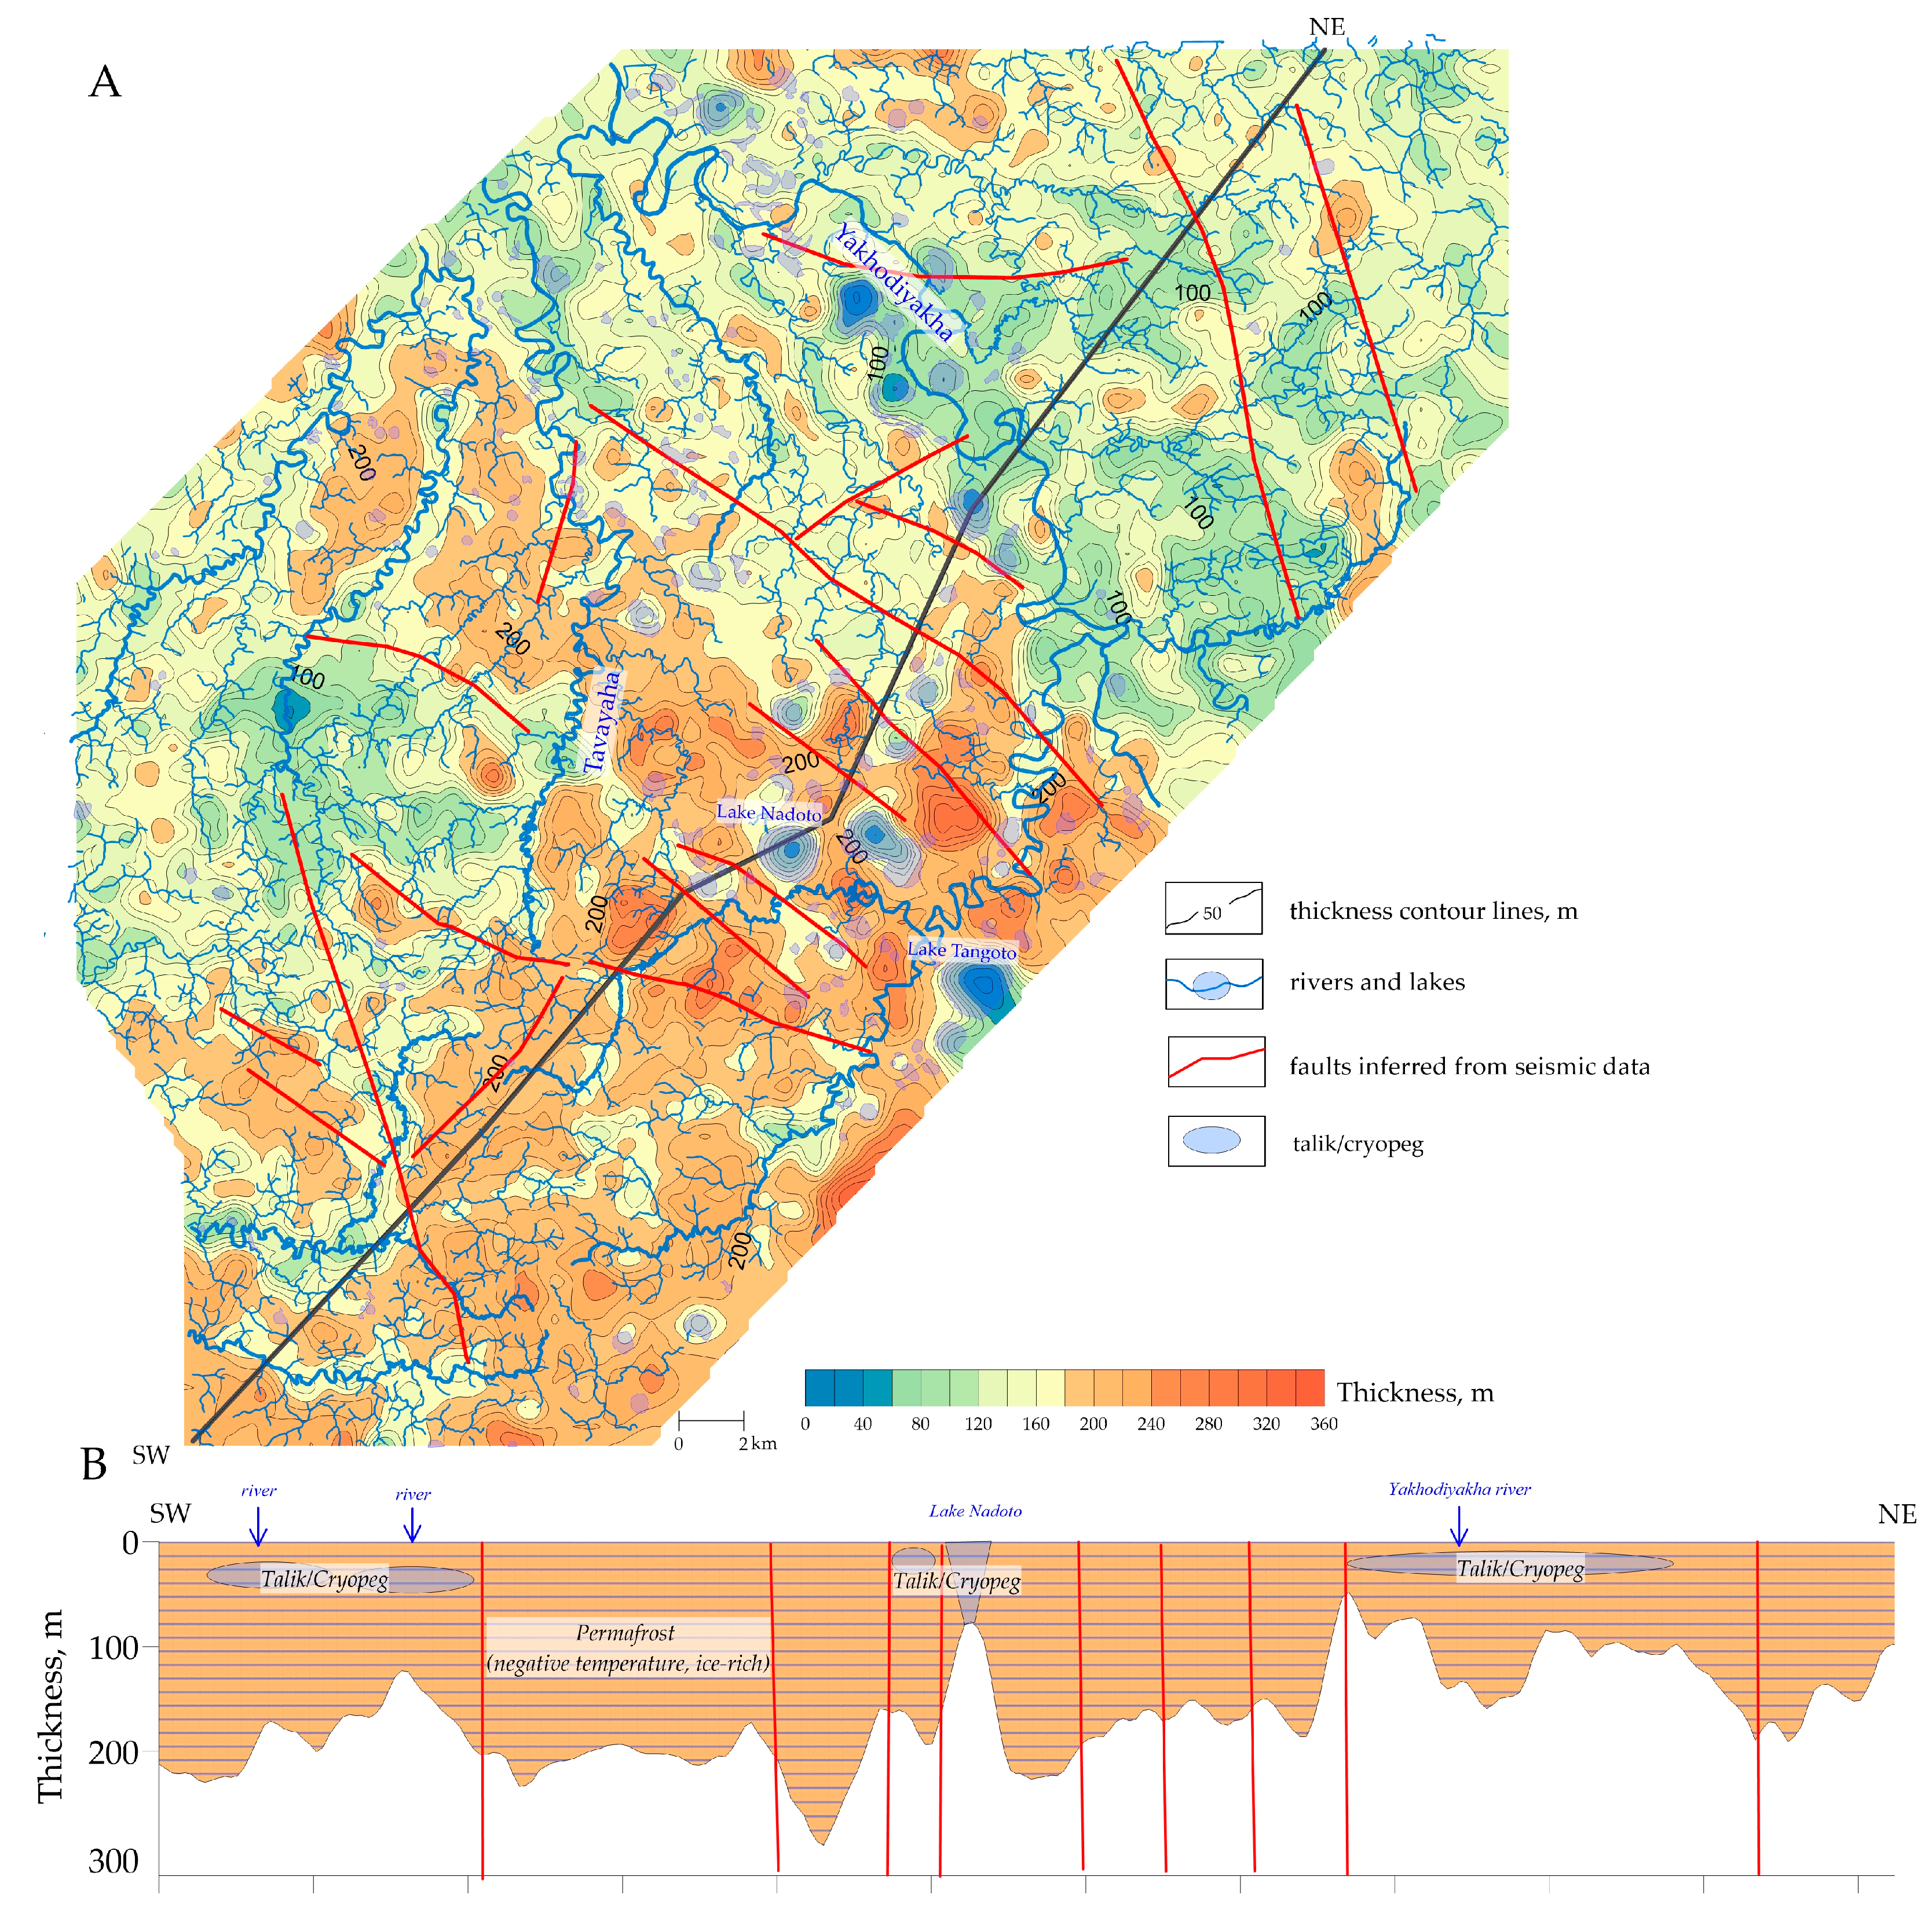
The collected sTEM data were used to map the permafrost thickness (Figure 9). The Yamal permafrost is the thickest (250–360 m) in the central and southern parts of the study area and the thinnest in zones of taliks. The permafrost in the large valley of the Yakhodiyakha River and the western part of the study area is 100–150 m thick. The zones of thicker permafrost are controlled by faults revealed on the top of the Cenomanian strata (Figure 9).

4.2. Taliks

The cryological and hydrogeological features of permafrost areas largely depend on the relative amounts and distribution of frozen and unfrozen rocks, which determine the continuity and lateral extent of permafrost [36].
Unfrozen rocks can be previously frozen and then thawed or never frozen originally, with temperatures above 0° or above the freezing point of saline pore water. Taliks can occur either above or below permafrost. In the former case, unfrozen rocks lie beneath the active layer and penetrate to different depths to the permafrost base.
Taliks in the study area of Yamal are numerous and diverse. Many taliks result from the warming effect of river and lake water (taliks of subestuary, sublake, and subriver types) [36]. Other taliks under lakes and rivers are produced by percolating water. Most of the taliks in the area occur beneath rivers and rills and appear in resistivity patterns as lens-shaped or often elongated zones of low resistivity (≤20 Ohm∙m) standing against more resistive permafrost.
The sTEM-based resistivity maps image long low-resistivity zones (5–20 Ohm∙m conductors) at 0 to −50 m asl corresponding to river valleys with abundant lakes of different sizes and shapes which cause a warming effect on permafrost (Figure 5).
The taliks of infiltration origin, often those beneath large lakes, produce almost vertical low-resistivity features piercing the permafrost or isometric 20–25 Ohm∙m anomalies. They are, for instance, large lakes such as Khonindato, Nadoto, etc., or groups of lakes (Neyto, Yambuto, Yaroto, etc.), up to 20 km across and 50 m deep, in the watershed and central parts of the peninsula, which either originated by melting of relict glaciers or have a tectonic origin.

4.3. Cryopegs

Cryopegs (liquid permafrost) are lenses of saline groundwater or brine which remain unfrozen and liquid at negative temperatures due to a high salinity of 30 to >300 g/L TDS. Cryopegs can be seasonal, confined within the active layer, or perennial intra-permafrost features. The salinity varies depthward and laterally, at a gradient of 15 to 90 g/L in the Yamal Peninsula.
As noted above, the zone of continuously saline permafrost and cryopegs in the Yamal Peninsula is located north of the Novy Port latitude [31]. Intra-permafrost lenses of saline water, 24 to 93 g/L, at negative temperatures (−6 to −8 °C) were tapped by drill holes in Pliocene–Quaternary sediments. The cryosaline water was formed in sediments deposited in marine environments.
Most of the cryopegs studied during this study are located at different depths in the western and southwestern parts of the peninsula as lenses connected neither with one another nor with ground waters. They are ubiquitous at depths of 0.5−3 to 8−10 m, or possibly deeper, within the Layda zone of the Kara Sea and Baidaratskaya Bay, as well as near the inlets of their tributary rivers. The lenses of saline water occur in cold organic-rich mud and clayey sand and silt, up to 1.5 m thick.
Furthermore, cryopegs are widespread in floodplains of medium-size rivers, either within beaches and spits or in central and back parts of the floodplains where they occur on the bottom of paleo-lakes and in dry parts of modern lakes. Boreholes drilled for bridge construction over the Seyakha (Mutnaya) River tapped isolated cryopegs beneath the riverbed. The floodplain cryopegs lie at depths from 3−5 m to 10−20 m or even 30 m beneath the Seaykha. Shallow cryopegs within river terraces are related to the bottom of modern and ancient drained lakes (khasyreys) or to sublake and subriver taliks [37].
The presence of cryopegs in the northern Yamal area has never been checked before, but they presumably appear in the new sTEM data at different depths within permafrost as low-resistivity (5 Ohm∙m or lower) lenses which have no evident relation to lakes or rivers (Figure 5). The low resistivity, possibly produced by high salinity, makes these lenses resolvable against the background of more resistive permafrost.

4.4. Ground Ice

The Yamal Peninsula is remarkable for the presence of abundant polygenetic ground ice reaching 10−15 km2 in surface area and at least 25−30 m in thickness. The largest bodies of ground ice occur within marine terrace III.
The origin of ground ice remains poorly constrained. Four main genetic types of ground ice were distinguished on the basis of the morphology and features of the host sediments (structure, bedding patterns, age): syngenetic subsea ice; syngenetic coastal ice; epigenetic segregated ice; and buried glacier ice [38,39].
The genesis of ground ice is often interpreted controversially, for different geological settings or even for ice within the same sections [40,41]. Many authors agree with the existence of intra-permafrost glacier ice and ground ice [42,43].
Ground ice in the valley of the Seyakha–Mutnaya River, within the Bovanenkovo oil–gas-condensate field, is among the best documented and structurally diverse deposits. It occupies hundreds of square meters and lies below all main geomorphological levels. This ice is mainly layered and its maximum measured thickness reaches 39.6 m.
Ground ice shows up in the sTEM-based maps as zones of >150 Ohm∙m resistivity revealed at depths from −10 to −50 m, which indicates high ice contents. The thickness of the detected ground ice zones ranges from 10 to 50 m (Figure 8).
Interestingly, the inferred zones of ground ice in the resistivity maps are obviously controlled by faults. The relation of ground ice to faults was reported for the Pai-Khoi area (Yugor Peninsula, northern Urals), where chains of ground ice lenses are often aligned with fault zones, in Middle and Late Pleistocene sediments of coastal plains and piedmonts at elevations from 0 to 500 m asl [44].
Therefore, the ≤100 m thick Late Pleistocene glacial sediments in the northern Yamal Peninsula enclose large bodies of relict (glacier?) ground ice. The underlying interglacial marine sediments and older rocks are likewise perennially frozen.

4.5. Low-Resistivity Anomalies Reaching Permafrost Base

Some low-resistivity anomalies beneath lakes detectable in the sTEM-based maps penetrate to the permafrost base and apparently correspond to fault zones (Figure 10). Many large, medium, and small rivers and lakes in West Siberia follow faults which were rejuvenated during Neogene–Quaternary tectonic movements [45]. The neotectonic activity still continues, and many topographic elements represent active faults, including gas-emitting ones. Such faults are known in the Novy Port, Taz, and many other gas and oil fields. The ongoing neotectonic motions are largely responsible for the coastline geometry of the Arctic islands and for the formation of lakes above fault intersections (e.g., lakes of the Neyto group) [30].

5. Discussion

The Arctic region is of great economic importance due to its rich mineral, fuel, and biological resources. It may become a center of future civilization progress though most exploration has been focused on oil and gas production. The significance of the Arctic petroleum and infrastructure development conducted by joint efforts of several countries has been internationally acknowledged. The discovered resources include 334 onshore and 26 shelf oil and gas accumulations, but Russia’s part in the development is yet to start.
The presence of permafrost, and especially its degradation in the recent decades, poses problems to petroleum exploration and production from the Arctic reservoirs. While global warming is progressing, the temperature of permafrost has been rising at a decadal rate of 0.1–0.4 °C, and the active layer is thickening correspondingly. The degradation of permafrost reduces the bearing capacity of foundation soils and causes damage to the civil and production infrastructure. The percentage of deformed buildings in some residential communities exceeds 90%.
At the same time, the structure of permafrost below the 50–100 m depths has been poorly constrained due to the shortage of reliable geophysical and drilling evidence. Drilling to depths below 100 m often faces accidents and instrumental losses associated with gas blows or other processes.
The main problems of exploration in high latitudes include as follows:
  • The distortion of seismic data by shallow features in permafrost [7];
  • Emergencies caused by warming-induced well collapse, ice plugs, and gas breakthrough during well cementing, etc.;
  • Damage to infrastructure from frost heaving, thermokarst, and other periglacial processes;
  • Explosive gas emission, including during drilling, due to the presence of pressurized free gas and gas hydrates prone to dissociation.
Permafrost has formed under the effect of numerous natural factors and thus has become heterogeneous in structure, thickness, temperature, and other parameters. The permafrost heterogeneity is recorded in resistivity patterns, though the geophysical data can be interpreted in different ways.
The high-resistive >1000 Ohm·m intervals obviously correspond to permafrost with ice wedges. The transition to unfrozen rocks appears as 5–10 Ohm·m features. Low resistivity in permafrost records lenses of liquid saline material (cryopegs), but the sources of less contrasting resistivity interfaces remain unclear as the drilling evidence is limited. The available boreholes penetrate to depths more than 3–4 km, and the respective studies focus mainly on the subsurface at these levels, while shallower sediments have received less attention. In fact, resistivity, acoustic, and temperature logging, as well as coring, are rarely performed in the depth interval within 500 m. Meanwhile, core samples would show the presence of ground ice and provide important insights into the permafrost structure due to correlation with geophysical data. However, no such correlation is as yet available.
Quasi-vertical zones of low resistivity apparently trace faults which may act as pathways for water and gas fluids rising from deeper sediments. The shallow vs. deep origin of the fluids can be determined from data on the composition of the released dissolved gases (hydrocarbons, hydrogen, etc.) and stable isotopes.
Gas emission from permafrost is a separate relevant issue. Permafrost contains numerous inclusions of free or clathrate gas, of various sizes and shapes. It can screen small gas accumulations and store gas in the form of small to large bubbles or gas hydrates at depths of a few hundred meters. The presence of gas in permafrost may pose problems to construction and drilling operations for exploration and development purposes. Furthermore, the knowledge of gas saturation in permafrost has safety implications.
The sTEM results, combined with other geophysical and geochemical data, can be used to estimate risks for the existing and planned infrastructure of the Yamal oil and gas fields. Mapping of zones with active fluids requires integrated geophysical data, including regional gravity, aeromagnetic, TEM, and 3D seismic surveys, in order to reveal vertical conduits of hydrocarbons (so-called gas tubes).
There are variations in the resistivity record of ice contents, as well as the lithology and salinity of rocks and fluids. However, interpretation of resistivity data may be ambiguous and requires checking against data from boreholes. This is an urgent problem though for the permafrost interval of the Yamal area, which has been poorly covered by drilling. Most of the existing boreholes aim instead at reservoir targets located deeper than 2–3 km depths, while the upper few hundred meters remain overlooked, and no core or log data are available. Therefore, the geophysical results can be improved as more boreholes are drilled, especially to strip and log the permafrost.
Further studies and joint interpretation of new geophysical data in terms of geocryology, with regard to chemical and isotope analyses of fluids, will clear up the permafrost structure in the Yamal Peninsula, as well as the structure of the deeper subsurface that affects the permafrost.

6. Conclusions

The permafrost of Arctic West Siberia has been studied systematically by transient electromagnetic (TEM) soundings since 2016, and the results were reported in a number of publications [8,9,10,46,47,48,49,50,51,52,53]. TEM data can faithfully image the heterogeneous structure of permafrost, with taliks of different genetic types, cryopegs, and faults, and constrain its thickness and extent. However, shallow TEM surveys covering the permafrost depth range to 500 m have been few in the Yamal Peninsula, though the available geological and geophysical studies have covered more than 4000 km2 of the peninsula’s territory and have no parallel in Russia and worldwide.
The reported sTEM data from northern Yamal (western part of the Yamal geocryological province) image continuous ~200 m thick permafrost with resistivity variations from 20 to 800 Ohm∙m. The frozen sediments lie over conductive (<1 Ohm∙m) cold rocks which remain free from pore ice though having negative temperatures.
The resistivity pattern of the sounded area is heterogeneous both laterally and in depth. Permafrost encloses taliks produced by the warming effect of surface water (sublake and subriver taliks) or by groundwater infiltrating from below, as well as lenses of saline water- and gas-saturated rocks and brines (cryopegs). Cold rocks below 200 m enclose tens of meters thick ground ice detectable from a high resistivity of >150 Ohm∙m. Additionally, there are vertical or steeply dipping low-resistivity (>10 Ohm∙m) features reaching the permafrost base. They follow the topographic structural elements and apparently represent fault zones which act as pathways for water and gas fluids.
Extending the knowledge of permafrost in the region requires geophysical surveys, including sTEM soundings, combined with hydrogeological and geocryological research and drilling to at least 200 m deep, with temperature logging and stratigraphic/lithological division.
Moreover, geophysical monitoring in the Arctic oil and gas fields can reveal zones of degrading heterogeneous permafrost, which can mitigate infrastructure risks and facilitate the choice of the best strategies for the placement of wells and pipelines.

Author Contributions

N.M.: Geophysical data interpretation, geological models of permafrost, and results; I.B.: physical background, methods, discussion, and conclusions; I.S.: geophysical data interpretation and imaging; A.S.: editing of the manuscript; A.N.: problem formulation; Y.A.: editing of the manuscript. All authors have read and agreed to the published version of the manuscript.

Funding

The study was funded by grant 22-17-20009 from the Russian Science Foundation (https://rscf.ru/project/22-17-20009/, accessed on 12 August 2024). The study, 22-17-20009, was supported by the government of the Yamal-Nenets Autonomous District.

Data Availability Statement

The authors included all relevant data to support the findings and conclusions of this study. The data are available in other formats on request to the corresponding author.

Acknowledgments

The work was conducted using equipment and infrastructure of the Center for Geodynamics and Geochronology at the Institute of the Earth’s Crust, Siberian Branch of the Russian Academy of Sciences (Irkutsk).

Conflicts of Interest

Authors Natalya Misyurkeeva, Igor Buddo, Ivan Shelokhov and Yuri Agafonov were employed by the company SIGMA-GEO. The remaining authors declare that the research was conducted in the absence of any commercial or financial relationships that could be construed as a potential conflict of interest.

References

  1. Baulin, V.V.; Chernyadyev, V.P. Permafrost conditions of Western Siberia and issues of their research in connection with the transfer of part of the river flow to the southern regions. Eng. Geol. 1979, 5, 23–28. [Google Scholar]
  2. Baulin, Y.I. Permafrost in Petroleum Provinces of the USSR; Nauka: Moscow, Russia, 1985; 176p. (In Russian) [Google Scholar]
  3. Trofimov, V.T. Spatial Variability of Engineering and Geological Conditions of the West Siberian Plate; Moscow University Press: Moscow, Russia, 1977; 280p. (In Russian) [Google Scholar]
  4. Trofimov, V.T.; Badu, Y.B.; Kudryashov, V.G.; Firsov, N.G. Yamal Peninsula (Engineering and Geological Essay); Moscow University Press: Moscow, Russia, 1986; 211p. (In Russian) [Google Scholar]
  5. Trofimov, V.T.; Badu, Y.B.; Dubikov, G.I. Cryogenic Structure and Ice Contents of Permafrost in West Siberia; Moscow State University Publishers: Moscow, Russia, 1980; 246p. (In Russian) [Google Scholar]
  6. Ershov, E.D. (Ed.) Geocryology of the USSR. West Siberia; Nedra: Moscow, Russia, 1989; 454p. (In Russian) [Google Scholar]
  7. Shelokhov, I.A.; Buddo, I.V.; Smirnov, A.S.; Piyankov, A.A.; Tatiyanin, N.V. Shallow velocity model from the transient electromagnetic method data: Results of application in Eastern and Western Siberia. Georesursy = Georesources 2021, 23, 60–72. [Google Scholar] [CrossRef]
  8. Misurkeeva, N.V.; Buddo, I.V.; Shelokhov, I.A.; Smirnov, A.S.; Agafonov, Y.A. Permafrost rocks structure within the north of Western Siberia from modern geophysical studies. In Proceedings of the the International Conference on Cryosphere Transformation and Geotechnical Safety in the Arctic, Salekhard, Russia, 8–12 December 2021; Abstracts, Conference Reports. Melnikov, V.P., Sadurtdinov, M.R., Eds.; pp. 296–299. (In Russian). [Google Scholar]
  9. Buddo, I.; Sharlov, M.; Shelokhov, I.; Misyurkeeva, N.; Seminsky, I.; Selyaev, V.; Agafonov, Y. Applicability of transient electromagnetic surveys to permafrost imaging in Arctic West Siberia. Energies 2022, 15, 1816. [Google Scholar] [CrossRef]
  10. Misyurkeeva, N.; Buddo, I.; Shelokhov, I.; Smirnov, A.; Nezhdanov, A.; Agafonov, Y. The structure of permafrost in northern West Siberia: Geophysical evidence. Energies 2022, 15, 2847. [Google Scholar] [CrossRef]
  11. Popov, A.I. Permafrost in West Siberia; Izd. AN SSSR: Moscow, Russia, 1953; 230p. (In Russian) [Google Scholar]
  12. Baulin, V.V.; Belopukhova, E.B.; Dubikov, G.I.; Shmelev, L.M. Geocryological Conditions of the West Siberian Plain; Nauka: Moscow, Russia, 1967; 214p. (In Russian) [Google Scholar]
  13. Trofimov, V.T.; Badu, Y.B.; Vasilchuk, Y.K. Geocryological Division of the West Siberian Plate; Nauka: Moscow, Russia, 1987; 222p. (In Russian) [Google Scholar]
  14. Podborny, E.E. Geodynamic and Geocryological Zoning of the Kruzenshtern, West Tambei, North Tambei, Malygi, and Tasi oil and Gas Fields; Research Report No 232119551/614-2010; TyumenNIIgiprogaz Ooo: Tyumen, Russia, 2010; 183p. [Google Scholar]
  15. Borisov, B.A.; Zastrozhnov, A.S.; Petrov, O.V. (Eds.) Map of Quaternary Sediments in the Russian Territory. Scale 1:2 500 000; VSEGEI: St. Petersburg, Russia, 2014; Available online: https://vsegei.ru/ru/info/quaternary-25002014 (accessed on 1 December 2023).
  16. Petrov, O.V.; Morozov, A.F. (Eds.) Map of Quaternary Sediments in the Russian Territory. Scale 1:2 500 000. Explanatory Note; VSEGEI: St. Petersburg, Russia, 2013; 220p. (In Russian) [Google Scholar]
  17. Ershov, E.D. General Geocryology; Moscow University Press: Moscow, Russia, 2002; 682p. (In Russian) [Google Scholar]
  18. Dzhurik, V.I. Forecast of changes in the elastic parameters of sand during transition from frozen to unfrozen state. In Soviet Geology and Geophysics; Allerton Press: New York, NY, USA, 1982; Volume 23, pp. 87–95. [Google Scholar]
  19. Voronkov, O.K.; Frolov, A.D. Physical properties of rocks at negative temperatures, In Petrophysics; Nedra: Moscow, Russia, 1992; Volume 3, pp. 43–65. (In Russian) [Google Scholar]
  20. Frolov, A. Electric and Elastic Properties of Frozen Rocks and Ice; ONTI PNC RAN: Pushchino, Russia, 1998; 515p. (In Russian) [Google Scholar]
  21. Omeliyanenko, A.V. Ground Penetrating Radar Surveys of Frozen Ground: Theoretical and Metodological Background. Ph.D. Thesis, Melnikov Permafrost Institute, Yakutsk, Russia, 2001; 359p. (In Russian). [Google Scholar]
  22. Zykov, Y.D. Geophysical Surveys in Permafrost; Moscow University Press: Moscow, Russia, 2007; 395p. [Google Scholar]
  23. Sudakova, M.S.; Vladov, M.L. Acoustic properties of water-saturated sand in the temperature range of –20 to +20° S: Experimental results. Part 2. Lomonosov Pedagog. Educ. J. Ser. 4. Geol. 2020, 2, 89–98. [Google Scholar]
  24. Clairmont, R.; Bedle, H.; Marfurt, K.; Wang, Y. Seismic attribute analyses and attenuation applications for detecting gas hydrate presence. Geosciences 2021, 11, 450. [Google Scholar] [CrossRef]
  25. Lenz, B.L.; Sawyer, D.E.; Phrampus, B.; Davenport, K.; Long, A. Seismic imaging of seafloor deformation induced by impact from large submarine landslide blocks, Offshore Oregon. Geosciences 2019, 9, 10. [Google Scholar] [CrossRef]
  26. Baulin, Y.I.; Bogolubov, A.N.; Zykov, Y.D. Geophysical Methods for Engineering Geological Studies of Frozen Fine-Grained Soils: Recommended Practice; Stroiizdat: Moscow, Russia, 1984; 32p. (In Russian) [Google Scholar]
  27. Sharlov, M.V.; Buddo, I.V.; Misyurkeeva, N.V.; Shelokhov, I.A.; Agafonov, Y.A. Transient electromagnetic surveys for high resolution near-surface exploration: Basics and case studies. First Break 2017, 35, 63–71. [Google Scholar] [CrossRef]
  28. Sharlov, M.V. An integrated approach to the processing and inversion of TEM data. Devices Syst. Explor. Geophys. 2017, 2, 24–36. [Google Scholar]
  29. Kaufman, A.A.; Morozova, G.M. Transient Electromagnetic (TEM) Surveys: Theoretical Background; Nauka: Novosibirsk, Russia, 1970; p. 123. (In Russian) [Google Scholar]
  30. Skorobogatov, V.A.; Stroganov, L.V.; Kopeev, V.D. Geological Structure and Gas and Oil Content in Yamal; Nedra: Moscow, Russia, 2003; pp. 58–76. [Google Scholar]
  31. Dubikov, G.I.; Ivanova, N.V. Saline frozen soils and their distribution in the territory of the USSR. In Saline Frozen Soils as Foundations of Engineering Structures; Nauka: Moscow, Russia, 1990; pp. 3–9. (In Russian) [Google Scholar]
  32. Brouchkov, A.V. Saline Permafrost in the Arctic Coast: Origin and Engineering Geological Features. Ph.D. Thesis, Lomonosov Moscow State University, Moscow, Russia, 1998. (In Russian). [Google Scholar]
  33. Streletskaya, I.D. Distribution and Formation of Saline Frozen Soils and Cryopegs of the Northwestern Yamal Peninsula: Case Study of the Bovanenkovo Gas Condensate Field. Candidate Thesis, Research and Development Institute for Construction Engineering, Moscow, Russia, 1991; 21p. (In Russian). [Google Scholar]
  34. Dubikov, G.I.; Koreisha, M.M. Relict segregated ice in the Yamal Peninsula. Izv. AN SSSR. Ser. Geogr. 1964, 5, 58–65. [Google Scholar]
  35. Vtyurin, B.I. Ground Ice in the USSR Territory; Nauka: Moscow, Russia, 1985; 214p. (In Russian) [Google Scholar]
  36. Romanovsky, N.N. Taliks in Permafrost and Their Classification; Bull. Moscow University: Moscow, Russia, 1972; pp. 23–34. (In Russian) [Google Scholar]
  37. Kritsuk, L.N. Ground Ice of West Siberia; Nauchnyi Mir: Moscow, Russia, 2010; 351p. (In Russian) [Google Scholar]
  38. Shpolyanskaya, N.A.; Streletskaya, I.D.; Surkov, A.V. Cryolithogenesis in Arctic shelf (recent and relict). Earth’s Cryosphere 2006, 10, 49–60. [Google Scholar]
  39. Shpolyanskaya, N.A. The permafrost-ecological characteristic of the western sector of the Russian Arctic shelf. Trans. Komi Sci. Cent. Ural. Branch Russ. Acad. Sci. 2014, 3, 12–17. (In Russian) [Google Scholar]
  40. Leibman, M.O.; Vasiliev, A.A.; Rogov, V.V.; Ingolfsson, O. Massive ground ice studies on Yugorsky peninsula, using crystallographic methods. Kriosfera Zemli 2000, 4, 31–40. [Google Scholar]
  41. Vasilchuk, A.C.; Vasilchuk, Y.K.; Budantseva, N.A. Pollen spectra of massive ice of Yerkutayakha river valley, southern Yamal Peninsula. In Proceedings of the 4th Conference of Geocryologists of Russia; Moscow, Russia, 7–9 June 2011; Volume 1, pp. 297–305. (In Russian). [Google Scholar]
  42. Badu, Y.B.; Trofimov, V.T.; Vasil’chuk, Y.C. Main distribution patterns and types of stratified ground ice deposits in the northern West Siberian Plate. In Formation Ice of the Cryolithozone; IM SO USSR Academy of Sciences: Yakutsk, Russia, 1982; pp. 13–24. (In Russian) [Google Scholar]
  43. French, H.M.; Harry, D.G. Observations on buried glacier ice and massive segregated ice, western Arctic coast, Canada. Permafr. Periglac. Process. 1990, 1, 31–43. [Google Scholar] [CrossRef]
  44. Belova, N.G. Massive Ice Beds of the South-Western Coast of the Kara Sea; MAKS Press: Moscow, Russia, 2014. [Google Scholar]
  45. Samokhin, A.A. Cenomanian gas and oil traps in northern West Siberia (types and prediction of location). Neftegazov. Geologiya. Teor. I Prakt. 2011, 6, 1–15. [Google Scholar]
  46. Misyurkeeva, N.V.; Buddo, I.V.; Agafonov, Y.A.; Smirnov, A.S.; Zharikov, M.G.; Kulinchenko, A.S. 3D TEM and sTEM results from Arctic West Siberia. In Proceedings of the Conference “Geomodel 2017”, Gelendzhik, Russia, 11–14 September 2017. [Google Scholar]
  47. Misyurkeeva, N.V.; Buddo, I.V.; Shelokhov, I.A.; Vakhromeev, A.G. New data on fluid dynamic processes in the Arctic Zone of West Siberia: Evidence from TEM, STEM Electromagnetic and CMP Seismic Studies. In Proceedings of the Conference Tyumen 2019, Tyumen, Russia, 25–29 March 2019; pp. 1–6. (In Russian). [Google Scholar]
  48. Misyurkeeva, N.V.; Buddo, I.V.; Smirnov, A.S.; Shelokhov, I.A. Shallow transient electromagnetic method application to study the Yamal Peninsula permafrost zone. In Proceedings of the Conference Geomodel 2020, Gelendzhik, Russia, 7–11 September 2020. [Google Scholar]
  49. Rybalchenko, V.V.; Trusov, A.I.; Buddo, I.V.; Abramovich, A.V.; Smirnov, A.S.; Misyurkeeva, N.V.; Shelokhov, I.A.; Otsimik, A.A.; Agafonov, Y.A.; Gorlov, I.V.; et al. Integrated studies during petroleum exploration and development: From permafrost mapping to groundwater exploration for drilling and operation. Gazov. Promyshlennost’ 2020, 807, 68–76. [Google Scholar]
  50. Misurkeeva, N.V.; Buddo, I.V.; Shelokhov, I.A.; Smirnov, A.S.; Agafonov, Y.A.; Nezhdanov, A.A.; Tokareva, O.V. The Structure of The Permafrost Section from High-Density Transient Electromagnetic Method (TEM) Data Within The Yamal Peninsula. In Proceedings of the ProGREss’21, Sochi, Russia, 1–3 November 2021; Volume 2021, pp. 1–6. [Google Scholar] [CrossRef]
  51. Selyaev, V.A.; Buddo, I.V.; Misyurkeeva, N.V.; Agafonov, Y.A.; Sharlov, M.V. Modern Technique for Studying Permafrost Rocks by Electromagnetic Methods on The Yamal Peninsula. In Proceedings of the ProGREss’21, Sochi, Russia, 1–3 November 2021; Volume 2021, pp. 1–6. [Google Scholar] [CrossRef]
  52. Misyurkeeva, N.V.; Buddo, I.V.; Kraev, G.N.; Smirnov, A.S.; Nezhdanov, A.A.; Shelokhov, I.A.; Kurchatova, A.A.; Belonosov, A.Y. Periglacial Landforms and Fluid Dynamics in the Permafrost Domain: A Case from the Taz Peninsula, West Siberia. Energies 2022, 15, 2794. [Google Scholar] [CrossRef]
  53. Buddo, I.; Misyurkeeva, N.; Shelokhov, I.; Chuvilin, E.; Chernikh, A.; Smirnov, A. Imaging Arctic Permafrost: Modeling for Choice of Geophysical Methods. Geosciences 2022, 12, 389. [Google Scholar] [CrossRef]
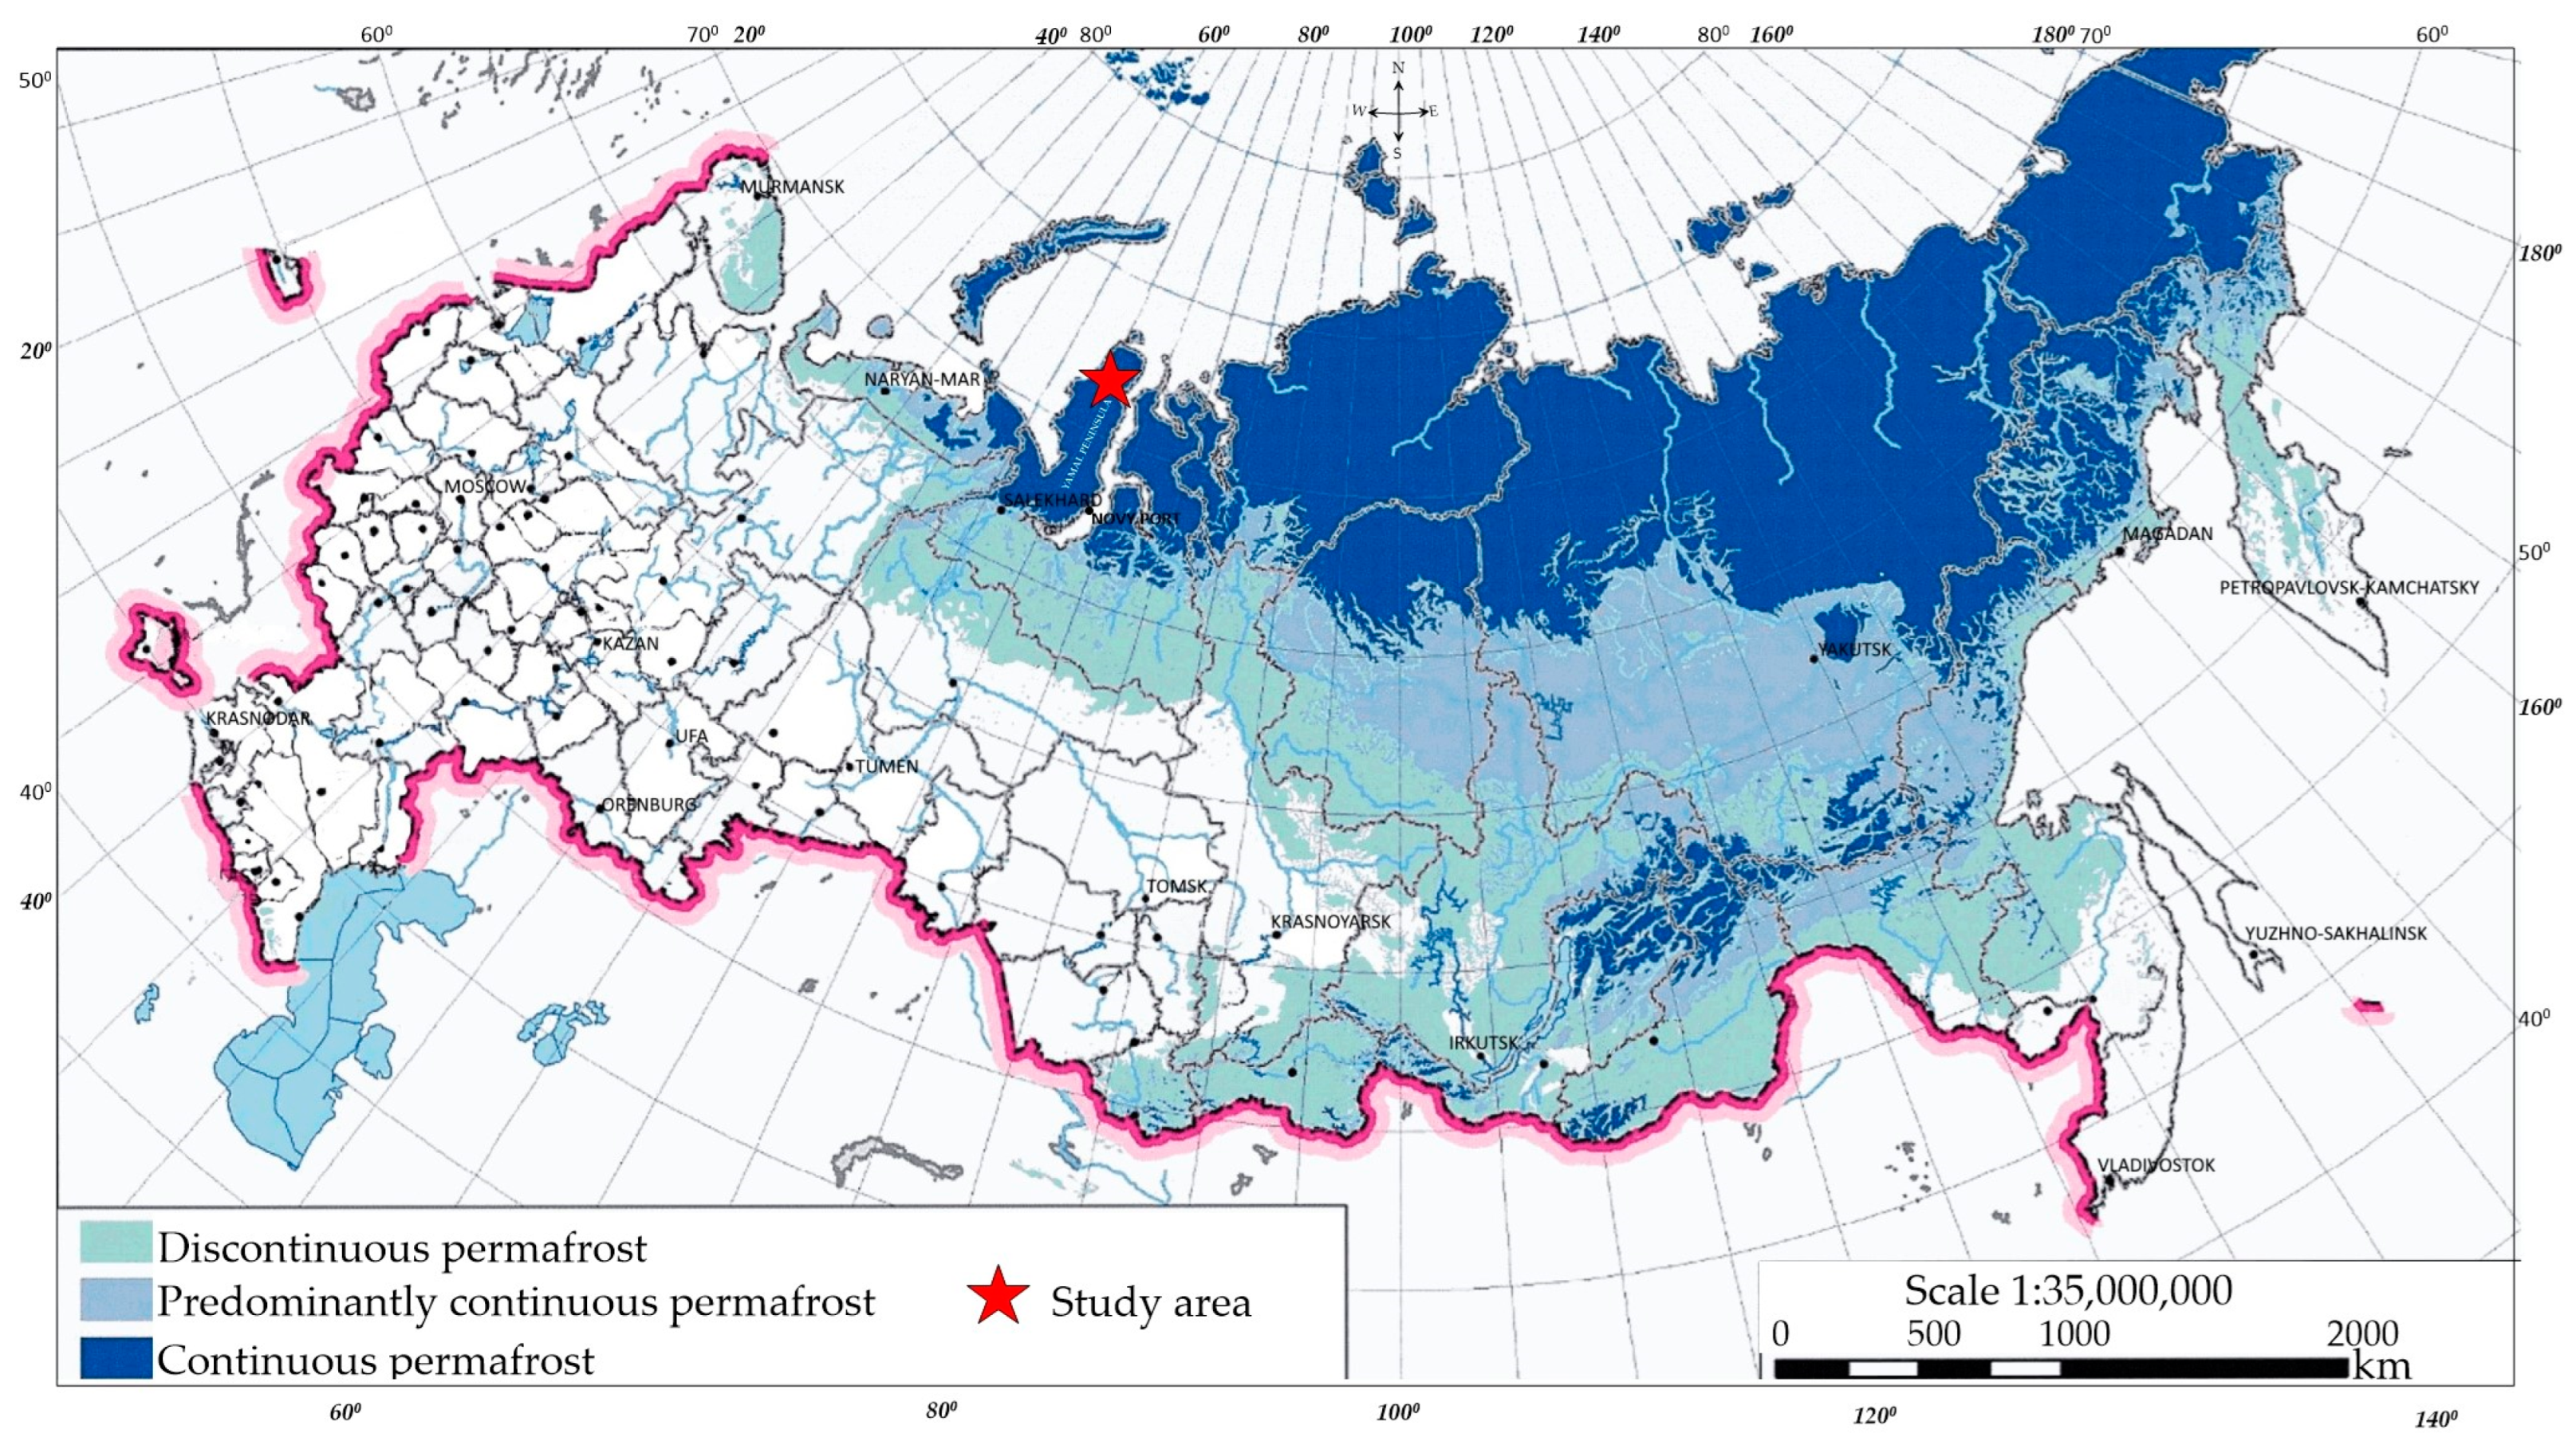
Figure 1. Areas of TEM studies (red stars) in the geocryological map of Russia [6].
Water 16 02633 g001
Figure 2. Location map of study area. (A): satellite image; (B): terrain map.
Water 16 02633 g002
Figure 3. Fragments of 1:2,500,000 (A) and 1:2,000,000 (B) map of Quaternary deposits [11,12].
Water 16 02633 g003
Figure 4. Approximate temperature dependences of resistivity for different lithologies: frozen soft sediments with massive cryostructure and water-saturated (>5%) unfrozen sediments [26].
Water 16 02633 g004
Figure 5. (A): Resistivity maps for different depth levels. (B): Example resistivity cross-section for the Yamal Peninsula. 1 = sTEM stations; 2 = resistivity layers, Ω·m; 3 = resistivity contour lines, Ω·m; 4 = permafrost base inferred from sTEM data; 5 = faults inferred from seismic data.
Water 16 02633 g005
Figure 6. (A)—sTEM data correlated with resistivity logs. (B)—Resistivity map. 1 = sTEM stations; 2 = resistivity layers, Ω·m; 3 = resistivity contour lines, Ω·m; 4 = permafrost base inferred from sTEM data; 5 = faults inferred from seismic data; 6 = resistivity logs; 7, 8 = wells (1–6) in cross-section and map, respectively; 9 = sTEM profile across the wells. Other symbols are explained in text.
Water 16 02633 g006
Figure 7. Map of saline soils in Russia, after [29].
Water 16 02633 g007
Figure 8. Resistivity pattern of shallow subsurface at −10 m ((A)—small scale and (B)—enlarged) asl levels and a fragment of cross-section along profile WE (C). 1 = resistivity contour lines, 2 = sTEM stations; 3 = resistivity layers, Ω·m; 4 = profile line; 5 = faults inferred from seismic data; 6 = ground ice inferred from sTEM data.
Water 16 02633 g008
Figure 9. sTEM-based map of permafrost thickness (A); permafrost thickness along the SW-NE profile (B).
Water 16 02633 g009
Figure 10. Resistivity pattern of permafrost in northern Yamal. (A,B): fragments of resistivity maps for depths of −10 m (A) and −50 m (B); (C): satellite image (a fragment); (D,F): fragments of sections across lakes Tangoto (D) and Nadoto (F); (E,G): satellite images of lakes Tangoto (E) and Nadoto (G). 1 = resistivity contour lines, 2 = sTEM stations; 3 = resistivity layers, Ω∙m; 4 = permafrost base inferred from sTEM data; 5 = faults according to the geological map; 6 = faults inferred from seismic data; 7 = profile line.
Water 16 02633 g010
Disclaimer/Publisher’s Note: The statements, opinions and data contained in all publications are solely those of the individual author(s) and contributor(s) and not of MDPI and/or the editor(s). MDPI and/or the editor(s) disclaim responsibility for any injury to people or property resulting from any ideas, methods, instructions or products referred to in the content.