1. Introduction
Fluctuating winds and random waves are the main environmental loads of marine structures. In their propagation processes, the combination of wind and waves leads to wind–wave joint propagations [
1], causing joint wind–wave actions on marine structures.
In wind–wave joint propagation processes, the fluctuating air pressure caused by fluctuating wind near the water surface will change the wave surface shape during the propagation. The alteration of wave surface shape will also impede or disturb the wind speed near the water surface [
2,
3]. This significant interaction between wind and waves is called wind–wave coherence. This coherence significantly changes wave height, wave period, average wind speed and wind fluctuating parameters during wind–wave joint propagation. However, these changes are complicated and the laws governing them can hardly be determined [
4,
5]. So far, no clear mathematical model has been formed to describe this coherence.
In recent years, scholars have carried out various related studies on the wind–wave joint actions of various ocean engineering structures as they have gradually come to understand the relevance of scientific issues linked to wind–wave joint actions on marine structures. For example, there are some elastic dynamic model studies [
6,
7,
8,
9,
10] and numerical simulation studies [
11,
12] on cross-sea bridge structural systems, such as foundations and towers, under the actions of wind, waves, current and their combination; simulations of wind–wave actions on offshore platform structures [
13,
14]; and experimental and numerical studies of wind–wave joint actions on marine fan structures [
15,
16,
17,
18]. According to some experimental studies, the interaction between wind and waves has a significant influence on the wind–wave joint action effect on marine structures. Some of these studies also demonstrate how related types of structures’ dynamic reactions are impacted by variations in the coupling between wind and waves. As some studies have shown, the interaction effect between wind and waves amplifies the structural load responses. The complexity and uncertainty of the interaction between wind and waves are reflected in these studies, as are the differences between wind–wave joint effects and individual wind and wave effects on structures. A portion of the research results show the coherence effect between wind and waves and its influence on structural wind–wave actions; however, it is unclear what the specific influencing factors and influencing laws of this coherence effect are.
Under wind–wave joint actions, the wind and wave loads of marine structures are usually calculated separately. The wave force is calculated based on the incident wave parameter values and the hydrodynamic coefficients of a structure. The fluctuating wind speed and wind resistance coefficient of the structure are used to compute the fluctuating wind force. Then, under a wind–wave joint action, the linear superposition of the independently calculated wind and wave forces is determined by taking the combined wind–wave force. Although this method of independent calculation and linear superposition is simple and convenient and suitable for rapid calculation in engineering, the coherence between wind and waves is ignored in this method of independent calculation, which results in inconsistence with the reality. On the one hand, when wind and waves strike simultaneously, the maximum structural response generated by wind and the maximum response caused by wave action may not always occur at the same time. The simple superposition of the two forces may lead to a relatively conservative result or amplify the result; on the other hand, under the wind–wave coherence effect, the wave surface morphology affects the wind speed fluctuation near the water surface, which further influences the wind-induced force on the structural component near the water surface. At the same time, the wave impact action on the structure is affected by the fluctuating wind speed near the water surface, as the incident wave surface morphology in front of the structure is affected by the fluctuating wind speed near the water surface. This means that the fluctuating wind speed can changes the wave impact force and the wave climbing effect on the structure.
Therefore, wind–wave coherence should be properly taken into consideration to reflect the actual situations of wind–wave joint actions on marine structures. The main influence factors and their influence laws regarding wind–wave coherence in the random wind–wave joint propagation process should be studied to establish a wind–wave coherence mathematical model. In this way, a theoretical basis can be provided for designs of marine structures under wind–wave actions, structural design theories and methods can be improved, the safety of structures can be ensured, and a cost-effective situation can be achieved.
2. Numerical Simulation Method for Wind–Wave Joint Propagation
It is necessary to carry out research to explore the main factors related to random wind–wave coherence and their influence laws before a random wind–wave coherence model is built. Therefore, under wind–wave synchronous propagation, it is important to monitor and obtain the series of fluctuating wind speed time histories and synchronous wave surface time histories under varying possible influencing factors. In actual marine environmental monitoring, it is difficult to accurately obtain data on synchronous wind–wave propagation in large quantities, and it is challenging to explore the influence rules of various influencing factors based on the control variate method. Therefore, obtaining data on synchronous wind speed and wave surface time histories is a feasible method to simulate the synchronous propagation of fluctuating wind and random waves by means of numerical simulation.
It should be noted that there are horizontal, vertical and transverse pulsating winds in actual wind fields, in which horizontal pulsating wind is usually dominant. The relationship between spatial 3D wind fields and multidirectional waves is extremely complex. According to the research idea from simple to complex, this study mainly studies the coherence effect between a horizontal wind speed and an orthokinetic random wave. Further consideration of the wind–wave coherence effect under the interaction between vertical or lateral fluctuating wind speeds and random waves can be taken as a further study. In addition, the study of the wind–wave coherence effect in this paper aimed to serve the calculations of wind–wave synchronization actions for marine structures, especially pillar infrastructures. Horizontal pulsating wind speed has a direct effect on such structures. Therefore, our simulation mainly focused on the horizontal wind speed under the wind–wave coherence condition and did not consider the vertical fluctuation.
Based on the CFD software Fluent (Version number: 2022R1), a comparative analysis of numerical random wave generation was carried out to determine a reasonable and practical random wave numerical flume. On this basis, the simulation methods for synchronous fluctuating wind in the air phase of a numerical flume were studied under the condition of random wave forward propagation. The definition method for the water and gas interface at the flume inlet as well as the algorithm model of the interaction between water and gas in the propagation process were studied. Based on these, a feasible, accurate and effective numerical flume for random wind–wave synchronous propagation was established, offering a platform for the study of wind–wave coherence effects. The wind–wave joint numerical flume was specifically implemented as follows.
2.1. Numerical Flume Geometry Model and Meshing
A two-dimensional numerical flume was established, as shown in
Figure 1. The flume’s top and bottom sections were configured as the water phase and the air phase, respectively. The water phase was used as the random wave simulation carrier, and the fluctuating wind simulation carrier was used in the air phase. From left to right, the flume consists of a velocity inlet, a propagation area, a wave suppression area and an outlet.
In wave propagation processes, the length of the numerical flume should match the length required for the propagation of a certain number of waves. Based on the wave elements of second-order nonlinear Stokes waves, the simulated wavelength is estimated according to the dispersion relationship, which is subsequently followed by water depth, wavelength and period in wave propagation [
19]. The length of the flume is 400 m, and the total height is 60 m. The height of the water phase with a significant wave height is 40 m (in a wave simulation, the virtual wave depth can be set to exceed the water phase height of the flume). In wave simulations, the virtual wave depth can be adjusted to surpass the flume’s water phase height, reaching 20 m. There are two considerations in determining the size of a numerical flume. One is that pulsating wind and random waves must have enough space to interact. At a given maximum wavelength, a 400 m distance is sufficient for wind–wave interaction. The 60 m tank height is also sufficient for wind–wave interaction. The second consideration is to improve the efficiency of simulation calculation under the condition of satisfying reasonable accuracy.
The regular rectangular shape of the two-dimensional wave flume geometric model necessitated its meshing by structured grids, which encrypted the wave surface area with significant water–gas interaction. The impact of grid density on the simulated findings was examined by creating several density grid models and simulating the calculations under identical operating conditions. Based on second-order Stokes waves, with the wave parameters of a 2 m wave height, a 4.4 s period and a 40 m water depth, three grid density schemes, coarse, medium and fine, as shown in
Table 1, were used to carry out numerical simulations of the same regular waves. The numerical wave surface time histories under each grid scheme were recorded, as shown in
Figure 2. The average wave height of the wave surface in the stable stage of the time history curve was calculated and compared with the theoretical target wave height.
Table 1 shows the grid parameters of the three meshing schemes and the corresponding error values of the simulated wave heights and the theoretical wave heights. According to the results, the wave height error values of the medium and fine meshing scheme were less than 3% and were close to each other, revealing that the mesh effect tends to converge. Considering the calculation accuracy and efficiency, the medium meshing scheme was chosen for numerical calculations. The mesh sizes of the encrypted area were
= 0.2 m (length) and
= 0.1 m (height), the mesh sizes of the nonencrypted area were
= 0.2 m and
= 0.2 m, and the total grid number was 333,833.
2.2. Random Wind and Wave Generation Method for the Numerical Flume
2.2.1. Random Wave Generation Method
Below the water surface of the numerical flume, a random wave is generated at the inlet boundary and propagates from left to right by defining the velocity values of the water quality point at the inlet, that is, the velocity inlet wave generation method. The water quality point velocity time histories and synchronous wave surface time history data are used as the input. A random wave spectrum is used to construct the random wave surface and water quality point velocity time histories. In terms of wave spectrum selection, the improved JONSWAP spectrum is adopted [
19]; its power spectrum function expression is
with
where
is the significant wave height,
is the spectral peak period,
is the mean period,
is the spectral peak frequency,
is the spectral peak elevation factor and
is the peak shape parameter. When the circular frequency
is used to represent the wave spectrum,
is converted to the spectrum
[
20].
The harmonic synthesis method was used to transform wave spectra to wave surface and water quality point velocity time histories [
20]. According to random wave theory, a random wave can be regarded as a linear superposition of multiple simple harmonics, and the time history of a random wave can be obtained by using this linear superposition method. The random wave spectrum
is divided into
intervals according to
, where
is the frequency interval and
is the representative frequency of the interval. Then, the amplitude of the
i-th harmonic is
. Therefore, the expression of the cosine wave corresponding to the interval can be obtained, and then the time history of the random wave surface can be expressed as the superposition of
cosine waves, that is,
where
and
are the frequency and the initial phase of the
i-th component wave, respectively, and
denotes a random number distributed in the range of
. A water velocity time history can be calculated by a similar method. Based on the wave spectrum, the wave surface time history calculated by the harmonic synthesis method can define the change in the water–gas interface with time at the flume inlet, and the water velocity time history calculated synchronously can provide the input values for the fluid velocity of the water at the flume inlet so as to build the random wave generated at the flume inlet and propagated in the direction of the flume outlet.
2.2.2. Fluctuating Wind Generation Method
The fluctuating wind field in the flume is generated by the fluctuating wind speed time history above the water surface at the flume inlet. At the flume velocity inlet boundary, horizontal (along the x-axis) pulsating wind speeds are given. As shown in
Figure 1, the time histories of the varying wind speeds at various elevations above the water’s surface at the inlet ought to be distinct from one another. Therefore, the part above the water surface of the velocity inlet is divided into segments along the height, and the wind speed value at the center of each section is used to represent the overall wind speed of this section. The more discrete wind speed segments are, the closer the simulated wind speed is to the real situation. However, in addition, based on the grid division, the more discrete wind speed segments are, the more computing resources are consumed. The wind speed inlet boundary is divided into 10 sections along the height. Then, the average wind speed and the fluctuating wind speed at the height position of the section are superimposed to provide the wind speed time history for each section. The average wind speed at each height position is yielded according to the exponentially distributed gradient wind speed, and the fluctuating wind speed at each height position is derived from the fluctuating wind speed spectrum.
In this calculation, the Kaimal spectrum is selected as the fluctuating wind speed spectrum, and its horizontal pulsating wind speed expression is
with
where
is the vertical height of the simulated point;
is the average wind speed of the simulated point, which is calculated from the given basic wind speed and the exponential law wind speed profile;
is the rough length of the ground, which can be 0.01 on the sea surface; and
is the Karman coefficient. The same conversion technique that is used for wave spectra may also be applied to wind spectra expressed in circular frequencies. Based on the fluctuating wind velocity spectrum, the fluctuating wind velocity time histories at the wind speed inlet are calculated by the harmonic synthesis method. The specific process is as follows.
The wind speed inlet boundary is divided into 10 sections along the height, and the number of sections determines how many times the wind speed fluctuates in the simulation. The fluctuating wind speeds of the simulated points in the wind field are related to each other, that is, the fluctuating wind speed of each simulated point is not only controlled by the wind speed self-power spectrum of the simulated point, but also affected by the wind speed cross-power spectrum between the simulated point and the other simulated points. Therefore, the overall wind speed spectrum matrix at the inlet is established according to the self-power spectra at each simulation point and the cross-power spectra between each simulation point, as shown below:
where
is the number of simulated points. The diagonal elements of the power spectrum matrix are the wind speed self-power spectra of each simulated point, and the nondiagonal elements denote cross-power spectra between two points. The cross-power spectrum is calculated as follows:
where
and
are the wind speed self-power spectra at simulated points
and
, respectively, and
represents the wind speed correlation function between two simulated points. The calculation expression is
where
and
are the average wind speed at simulated points
and
, respectively; the spatial coordinates of
and
are
and
, respectively; and
is a attenuation coefficient, whose value is 10 [
21]. When the formula is applied to two-dimensional studies, such as this study in the
x-
z plane, the
y coordinate can be neglected.
To obtain the time history of the fluctuating wind speed at each point, this study applied Cholesky decomposition to the matrix
, that is,
where
is a lower triangular matrix, namely,
The frequency range
is divided into
intervals, and the fluctuating wind speed time history of each point is simulated by harmonic synthesis on different frequencies, that is,
where
is the frequency spacing,
is the representative frequency in the frequency interval and
is a random phase angle distributed in the range of
.
can be calculated based on the following formula:
2.3. Numerical Flume Calculation Settings
The boundary configuration of the numerical flume model is shown in
Figure 1. The left boundary of the flume is set as a velocity inlet. The velocity inlets are located above and below the water’s surface, and they produce the varying wind speeds and random waves, respectively, marking the left boundary of the flume. The right boundary of the flume is set as a pressure outlet; the bottom of the flume is set as a nonslip wall boundary; the top of the flume is set as a pressure boundary.
The volume of fluid (VOF) two-phase flow algorithm model was selected for handling the interaction between the air phase and the water phase in the flume. The SST turbulence model was adopted. The SIMPLE algorithm was selected to solve transient problems in unsteady states. The maximum iteration number was set to 20, the time step was set to 0.05 s and the total calculation time was set to 500 s, with considering the wind-wave interaction processes, calculating convergence, calculating time cost and other factors.
A sufficient distance is needed for wind and waves to interact adequately. At the water surface at a 300 m distance from the inlet, a virtual wave height meter was set up to monitor the wave surface time history during the combined wind–wave propagation. At the same time, a virtual anemometer was installed at different heights of the air phase at a 300 m distance from the inlet to monitor the fluctuating wind speed time history at different heights from the water surface during the combined wind–wave propagation.
2.4. Wind and Wave Simulation Effects of the Numerical Flume
2.4.1. Random Wave Simulation Effect
Based on the above random wave numerical construction method, a wave frequency interval of 0.3~3 rad/s, a wave depth of
, a spectral peak frequency of
rad/s and a significant wave height of
were set for individual random wave simulations according to actual wind and wave observation data [
1,
22] and the feasible range of numerical simulation.
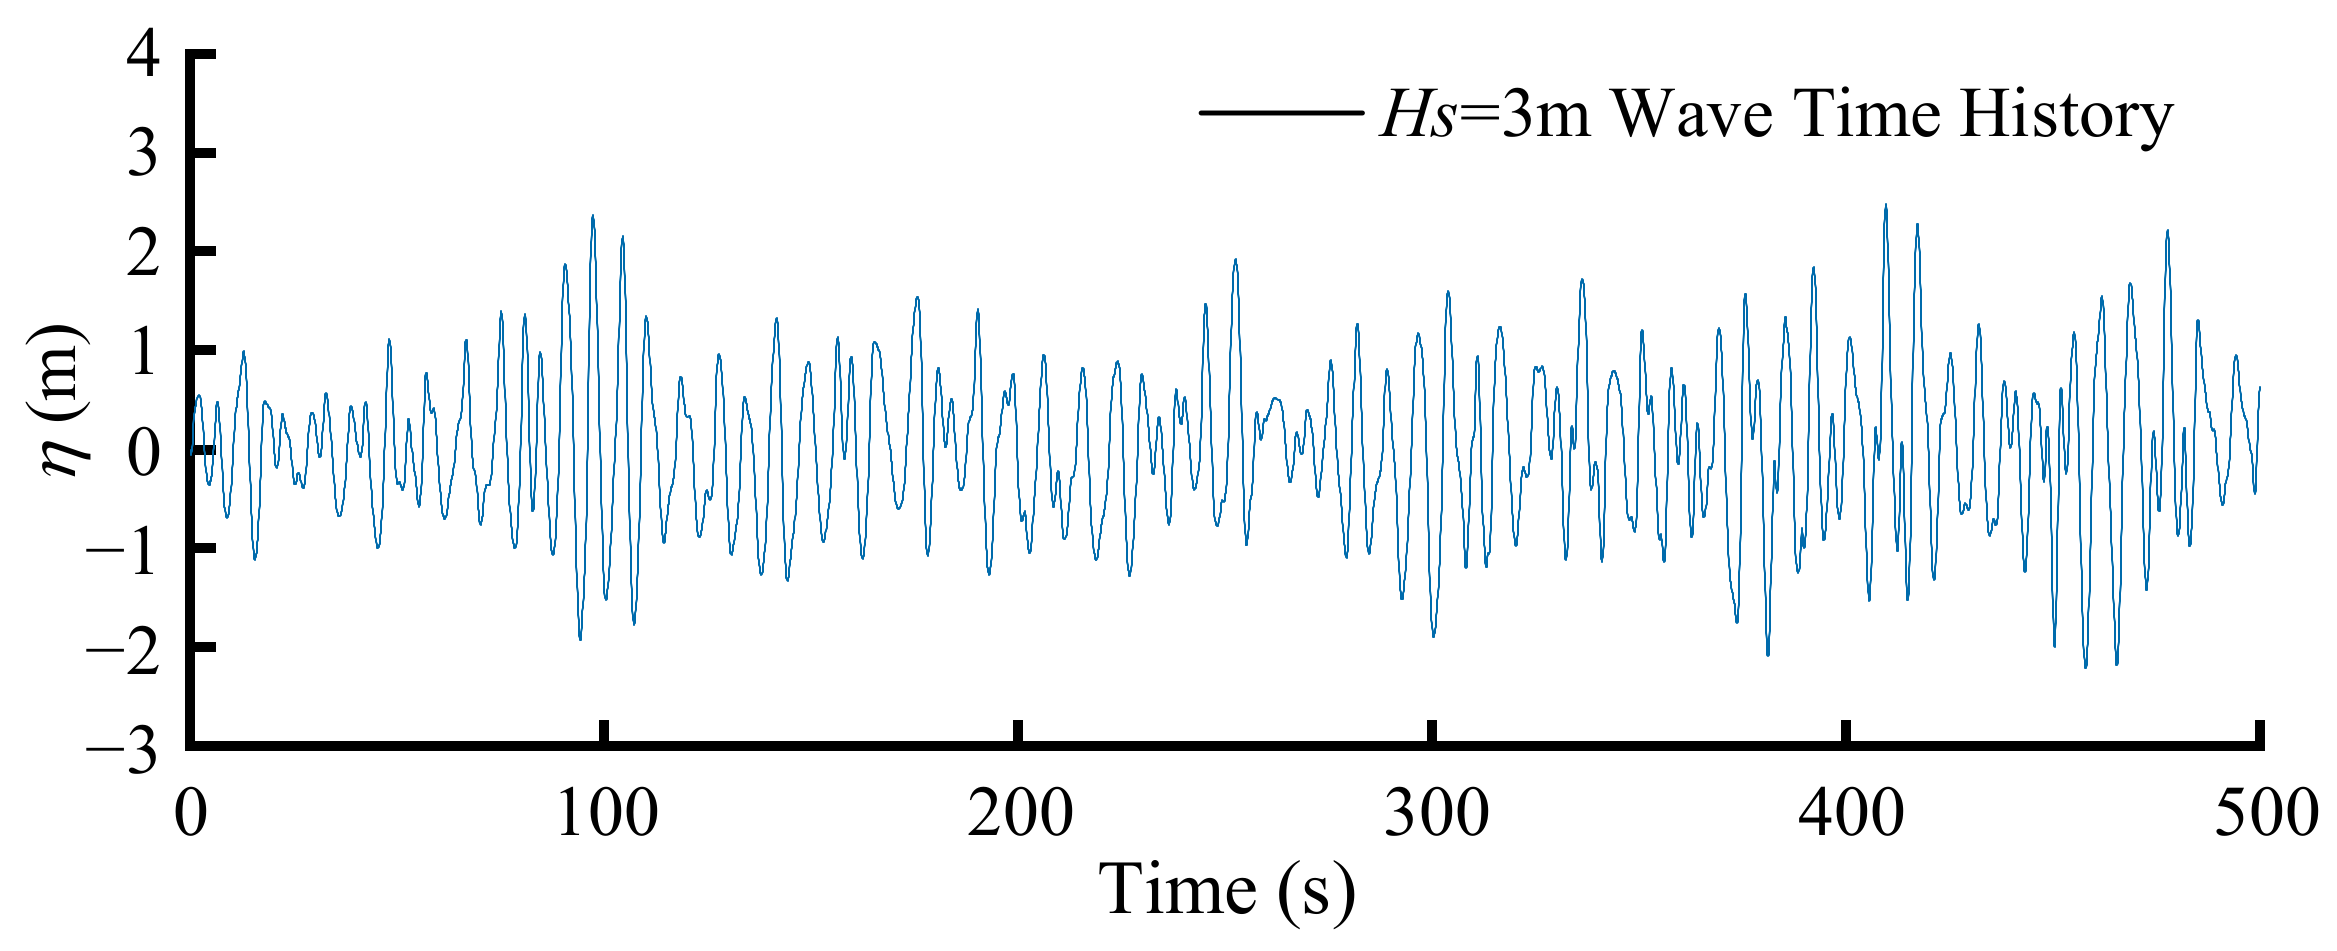
The monitoring data on wave surface time history in the simulation process are shown in
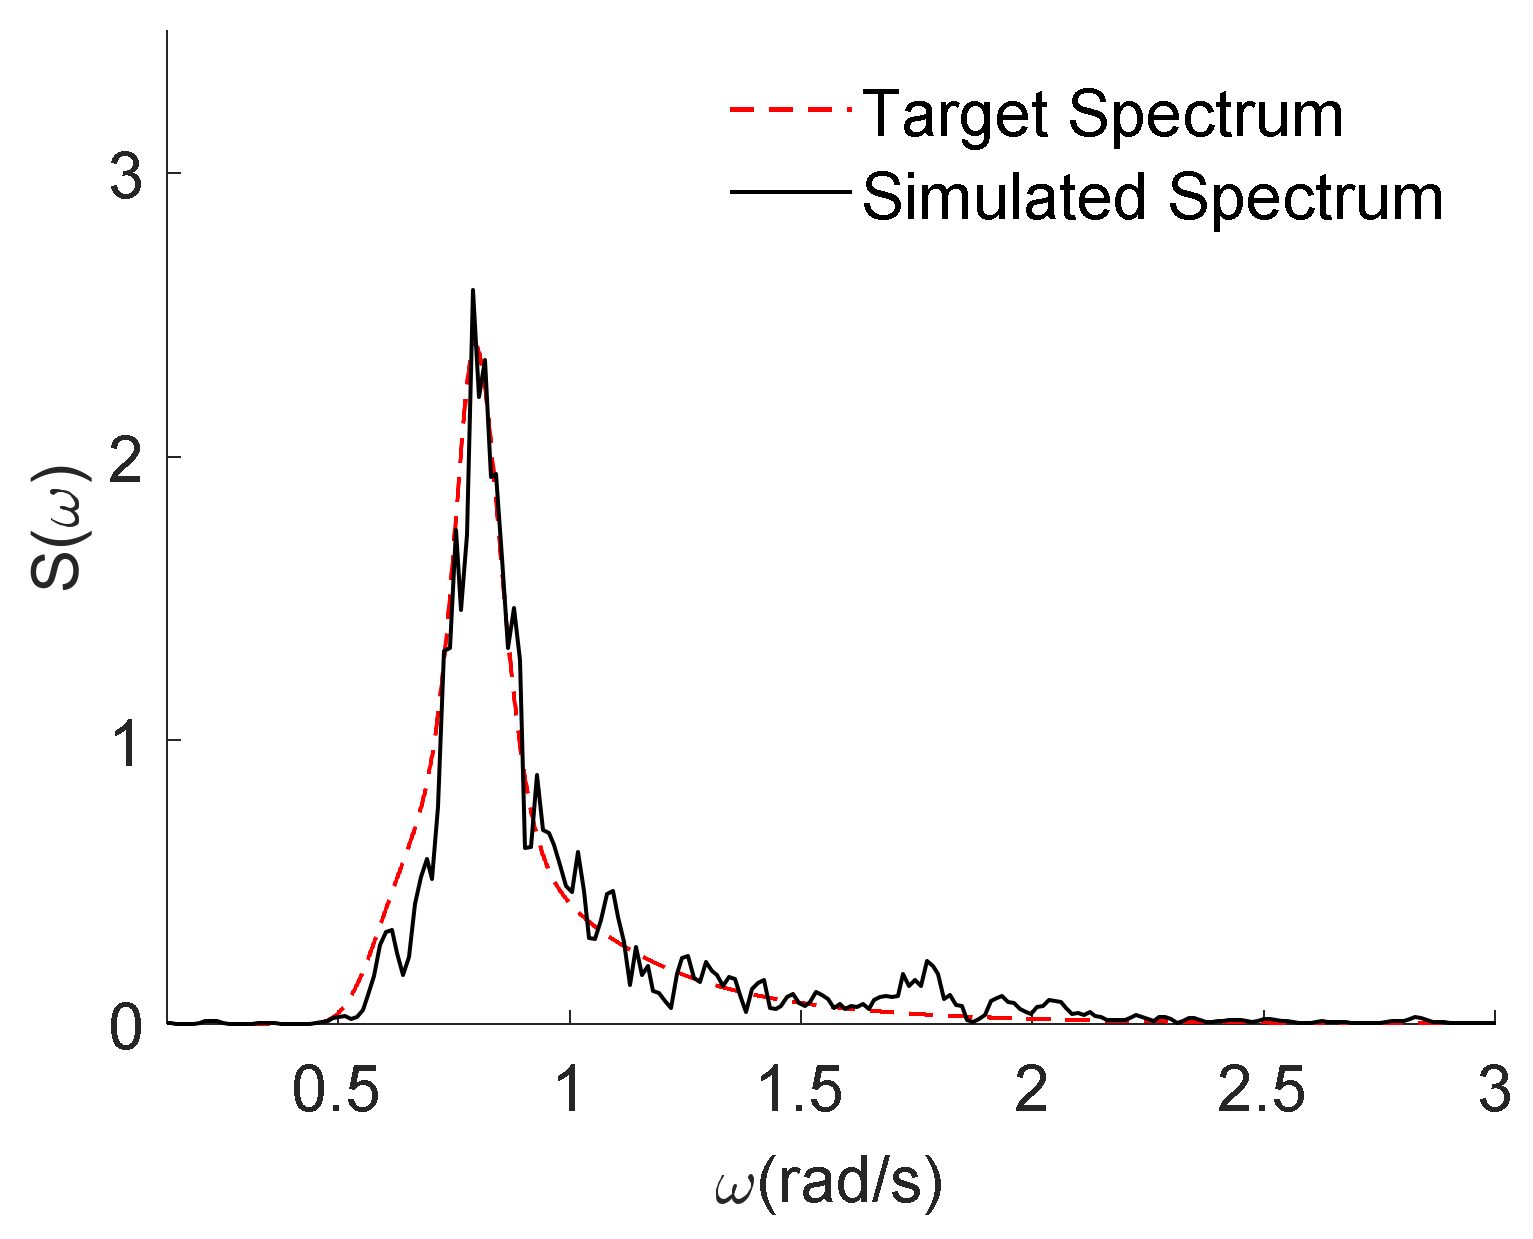
Figure 3. The numerical simulation random wave power spectrum was obtained by applying the Fourier transform to these time history data, and it was compared with the theoretical wave spectrum, as illustrated in
Figure 4. The simulated wave spectrum distribution is in line with the theoretical target spectrum. The peak frequency position of the simulated spectrum is consistent with that of the theoretical spectrum. It demonstrates that the numerical flume can be effectively applied to random wave simulation.
2.4.2. Fluctuating Wind Simulation Effect
Based on the above fluctuating wind numerical construction method, a basic wind speed of
was selected according to the actual wind and wave observation data [
1,
22] and the feasible range of numerical simulation, and an individual fluctuating wind field was simulated when there was no wave.
The wind speed monitoring point was set at
, with
representing the distance from the monitoring point to the static water surface.
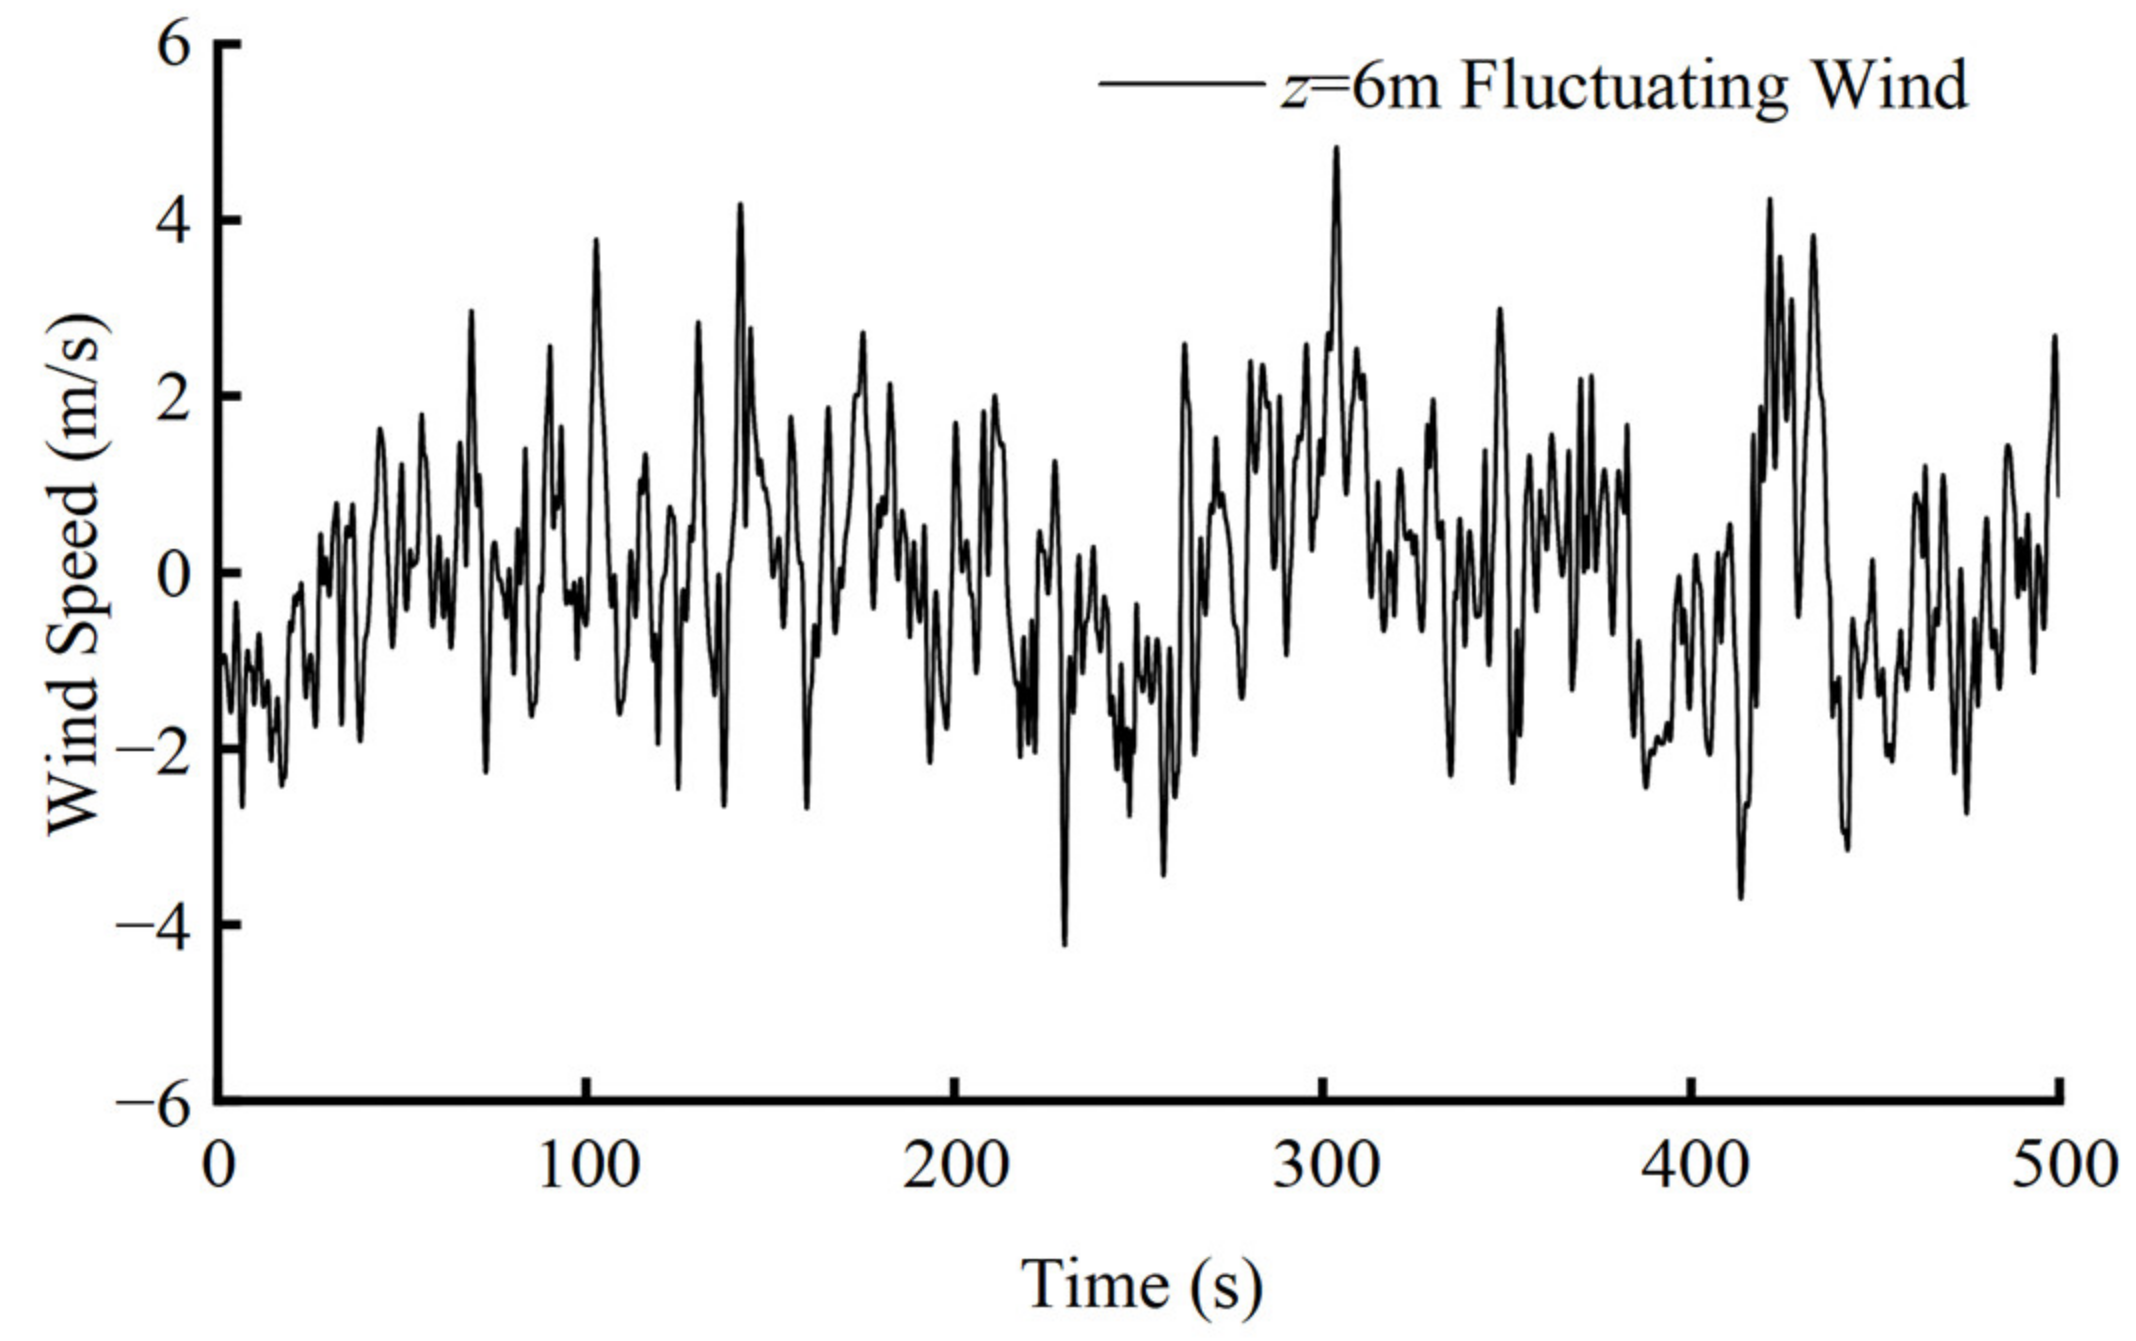
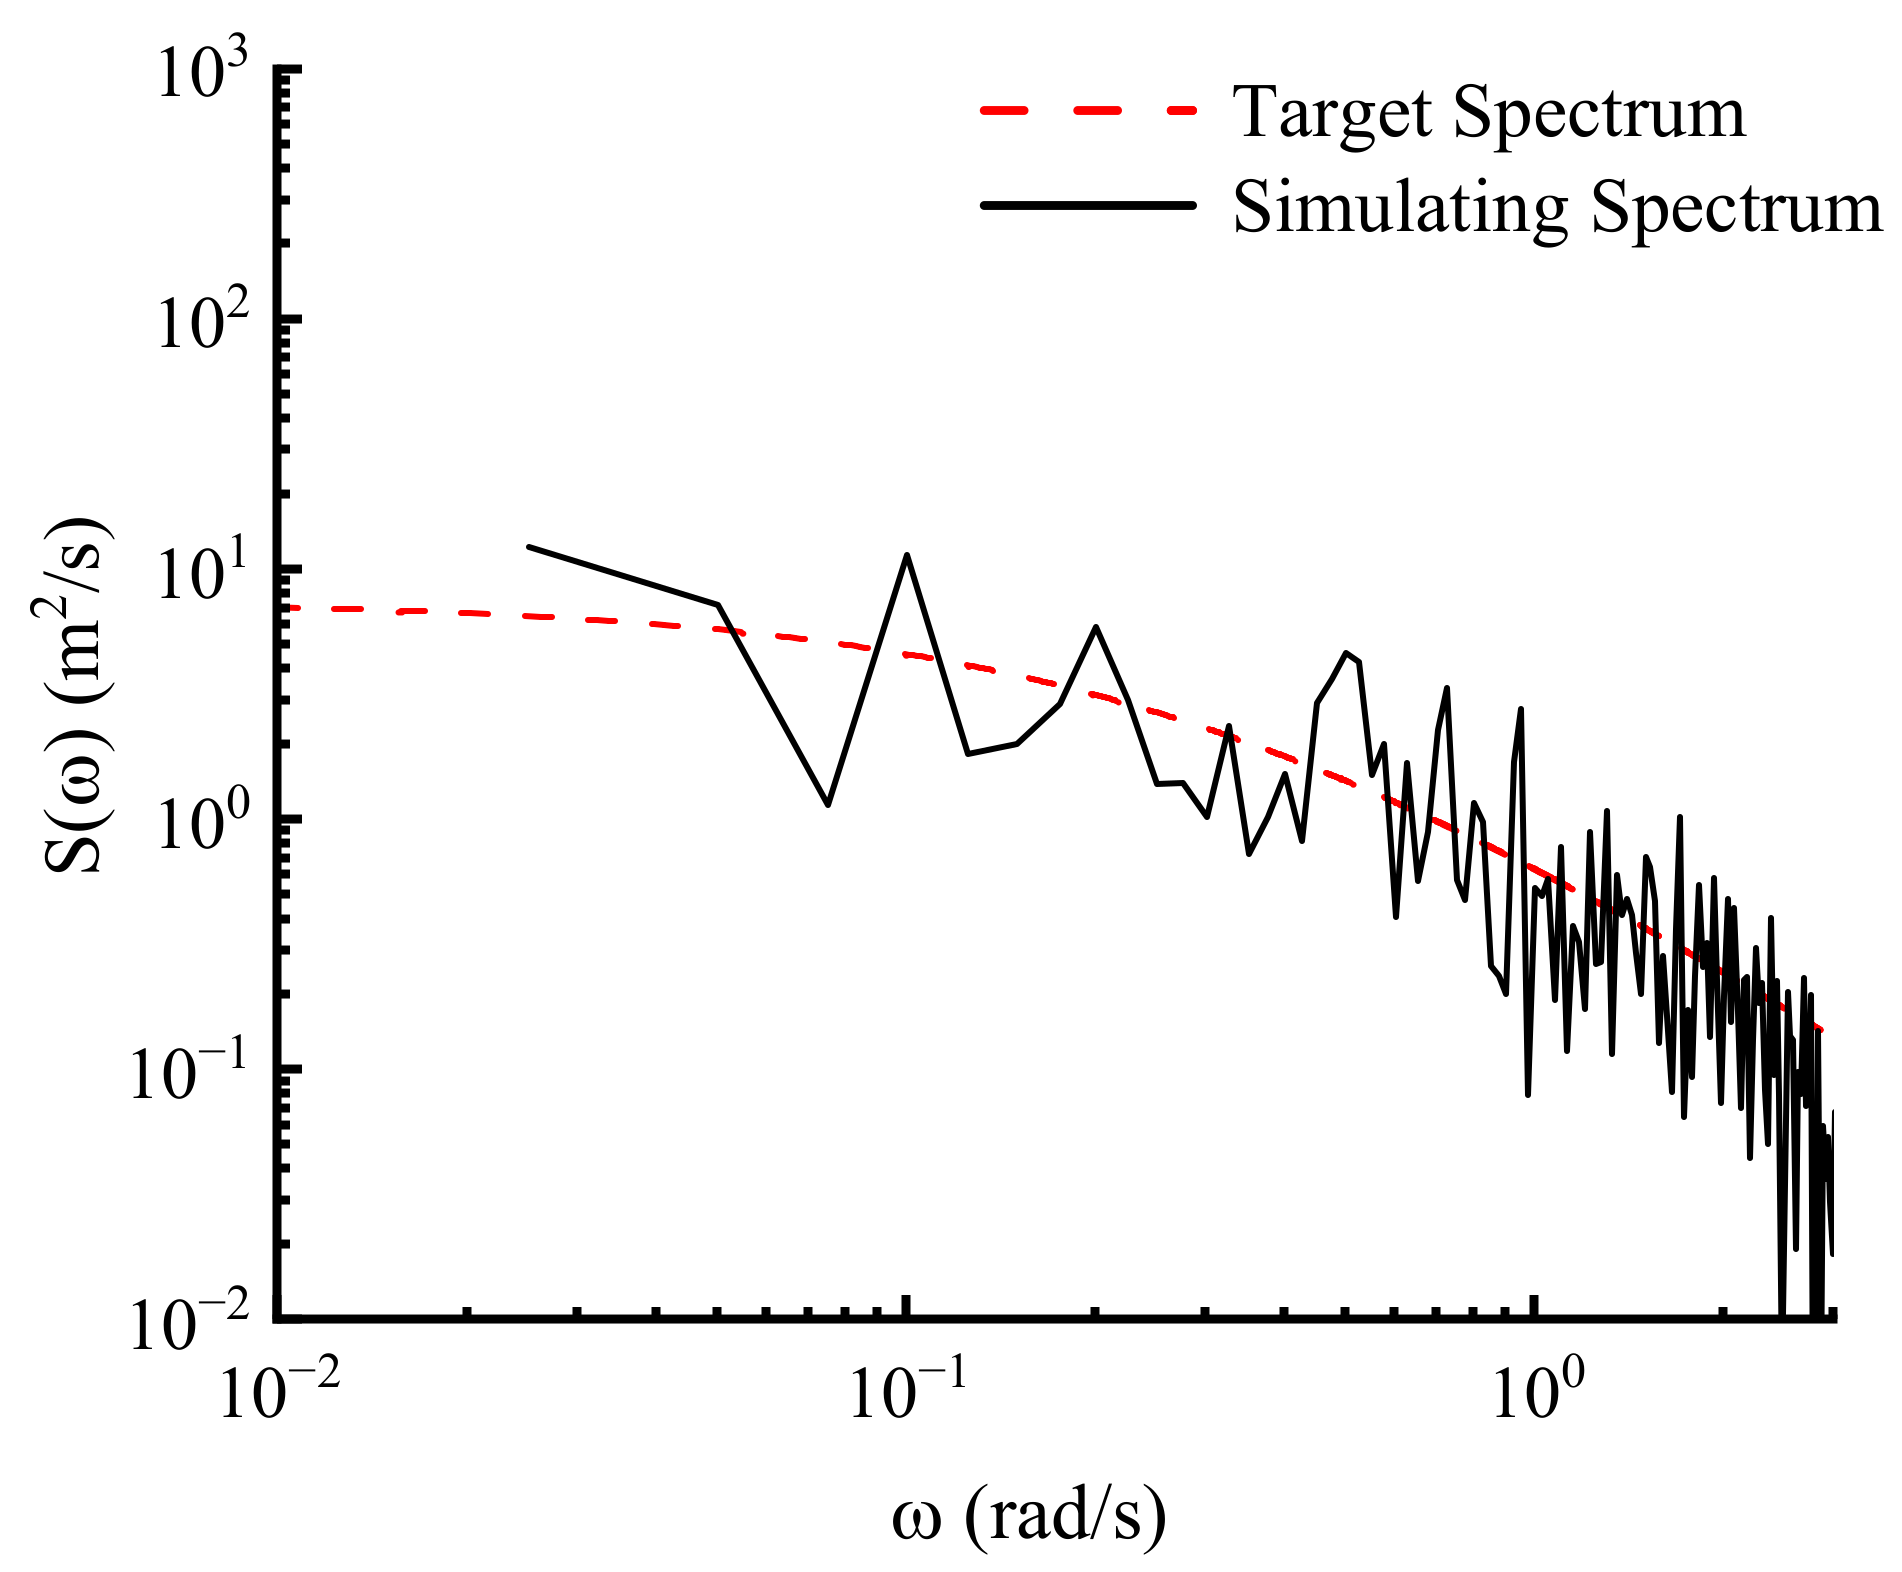
Figure 5 shows the fluctuating wind speed time history at the monitoring point. The power spectrum density of the numerically simulated fluctuating wind speed was obtained by applying the Fourier transform to the time history data. This was compared with the theoretical wind speed spectrum, as shown in
Figure 6. The energy distribution of the simulated fluctuating wind speed spectrum agrees with the theoretical target spectrum distribution, which indicates that the established numerical flume can effectively carry out the numerical simulation of fluctuating wind.
3. Origin of the Random Wind–Wave Coherence Function
In the process of constructing the fluctuating wind speed power spectrum matrix to solve the wind speed time history of each point in the fluctuating wind field, Equations (9) and (10) were used to calculate the wind speed cross-power spectrum between two points in the power spectrum matrix. Equation (10) was applied to describe the spatial coherence of the fluctuating wind speeds between two wind speed positions.
In the process of wind–wave joint propagation, the influence of the wave surface on the wind speed should also be considered when solving the fluctuating wind speed above the water surface based on the coherence between wind and waves. The influence of fluctuating wind speed near the water surface on the wave surface should also be considered when solving the random wave surface. To obtain the wind speed time history and the wave surface time history, considering the coherence between wind and waves, a wind–wave combined field power spectrum matrix composed of wind speed self-spectrums, wind speed cross-spectrums, a wave spectrum and wind–wave cross-spectrums was established by referring to the construction method of the fluctuating wind field power spectrum matrix. The wind speed self-spectrums, wind speed cross-spectrums and the wave spectrum in the combined wind–wave power spectrum matrix can be obtained from existing theories, but it is difficult to seek the wind–wave cross-spectrums. Therefore, the wind–wave coherence function was used to characterize the coherence between the fluctuating wind speed and the random wave surface; then, this coherence function, along with the matching wind speed self-spectrum and wave spectrum, established the cross-spectrum between the fluctuating wind speed and the wave surface. Thus, it was possible to establish a complete wind–wave combined power spectrum matrix. The mathematical process is as follows.
The fluctuating wind speed spectrum matrix of
is expanded by adding
n + 1 rows and
n + 1 columns, then filling the additional rows and columns with the wind–wave cross-spectrum and the wave spectrum. The wind–wave combined power spectrum matrix
is as follows:
where the diagonal element
(
) is the wind speed self-spectrum of at the position of node
; the nondiagonal element
(
) is the wind speed cross-spectrum between the positions of nodes
and
; the diagonal element
(
) is the random wave spectrum
; and the nondiagonal elements in row
and column
are the wind–wave cross-spectra, for example,
is the wind–wave cross-spectrum between the wind speed of node
and the wave surface. There is a relationship for wind–wave cross-spectra, that is,
. The time history of the fluctuating wind speed at nodes above the water surface and the time history of the wave surface at the water surface can be obtained by Cholesky decomposition and harmonic synthesis calculation of this combined wind–wave spectrum matrix. The wind speed and wave surface time histories are obtained based on the coherence between wind and waves.
The wind speed self-spectrum and wind speed cross-spectrum in the matrix can be calculated based on the fluctuating wind spectrum theory, and the wave spectrum can be calculated according to the random wave spectrum theory. For the wind–wave cross-spectrum
between the wind speed of a certain node and the wave surface, the proposed calculation expression is as follows:
where
and
represent the wind speed self-spectrum and the wave spectrum, respectively, and
is defined as the wind–wave coherence function between the fluctuating wind and the random wave surface.
represents the coherence between the fluctuating wind speed at a position above the water surface and the wave surface in the process of wind–wave combined propagation.
This paper aimed to establish a reasonable and accurate wind–wave coherence function, , by studying the main factors behind the coherence of wind and waves in the process of random wind–wave combined propagation and their influence laws. A coherence function expression, which is composed of the correlation terms of wind speed position height, wave frequency, wave height, etc., was established.
4. Coherence Analysis of Random Wind and Waves
4.1. Wind Speed Position Height Influence
According to the characteristics of regular synchronized propagation of random winds and waves, the rough conclusion can be made that the closer the location of fluctuating wind speed to the water surface, the greater the chance and intensity of mutual contact and interaction between winds and waves. So, conversely, the further the location of fluctuating wind speed is from the water surface, the lower the chance and intensity of mutual contact and interaction between winds and waves.
Therefore, this study firstly assumed that the fluctuating wind speed position height from the wave surface is a major influence factor with respect to wind–wave coherence. On this basis, the correlation law between the wind-wave coherence and the wind speed position height would be studied.
Numerical simulations of the joint propagation of fluctuating winds and random waves were conducted based on the established numerical flume for the joint propagation of random winds and waves. To investigate the coherence between the wave and wind speeds at different heights from the wave surface, monitoring points were set up along the numerical flume at the water surface and at different heights to obtain the time histories of the random wave surface and the fluctuating wind speeds at different heights from the wave surface. Then, numerical simulation time histories, together with theoretical wind and wave power spectra, were utilized to calculate the wind and wave coherence for wind speeds at different heights to analyze and verify the rule of the wind–wave coherence and the wind speed position changes. The specific process was as follows.
Based on the random waves in the numerical flume and the fluctuating wind speed simulations in
Section 2.2, random waves and fluctuating winds were generated by simultaneous simulations at the flume velocity inlet. The given conditional parameters for fluctuating wind speeds and random waves were as follows: the basic wind speed at the base height of the fluctuating wind speed (
) was 12.8 m/s, the significant wave height of random waves was
, the spectral peak frequency was
and the water depth was
.
When focusing on fluctuating wind speeds at different heights above the water surface,
indicates the monitoring location of the wind speed, where
is the horizontal distance from the monitoring point to the flume inlet and
is the vertical distance from the monitoring point to the wave surface. For random waves, the wave surface location (
) is defined as one significant wave height location above the still water surface. Monitoring points for fluctuating wind speed were set up at heights of
= (300, 2), (300, 4), (300, 6), (300, 8) and (300, 10) to synchronize the wave surface situation when
. Taking the wind speed monitoring data at (300, 4) as an example, the synchronized wind speed and wave surface time histories are shown in
Figure 7.
The wind speed time history at each altitude is combined with the wave surface time history; then, the correlation spectrum
between the wave surface and the wind speed at each altitude can be calculated by the Matlab CPSD cross-power spectrum algorithm. Moreover, according to the given conditional parameters in the numerical simulation, the corresponding theoretical wind speed power spectrum
can be calculated through the fluctuating wind speed Kaimal spectrum, and the corresponding theoretical wave power spectrum
can be determined through the random wave JONSWAP spectrum. Then, with the numerical wind–wave cross-power spectrum and theoretical wind and wave self-spectrum values, the numerical wind–wave coherence values
are calculated by the following equation:
Taking the circular frequency
as the horizontal coordinate, based on different wind speed position heights
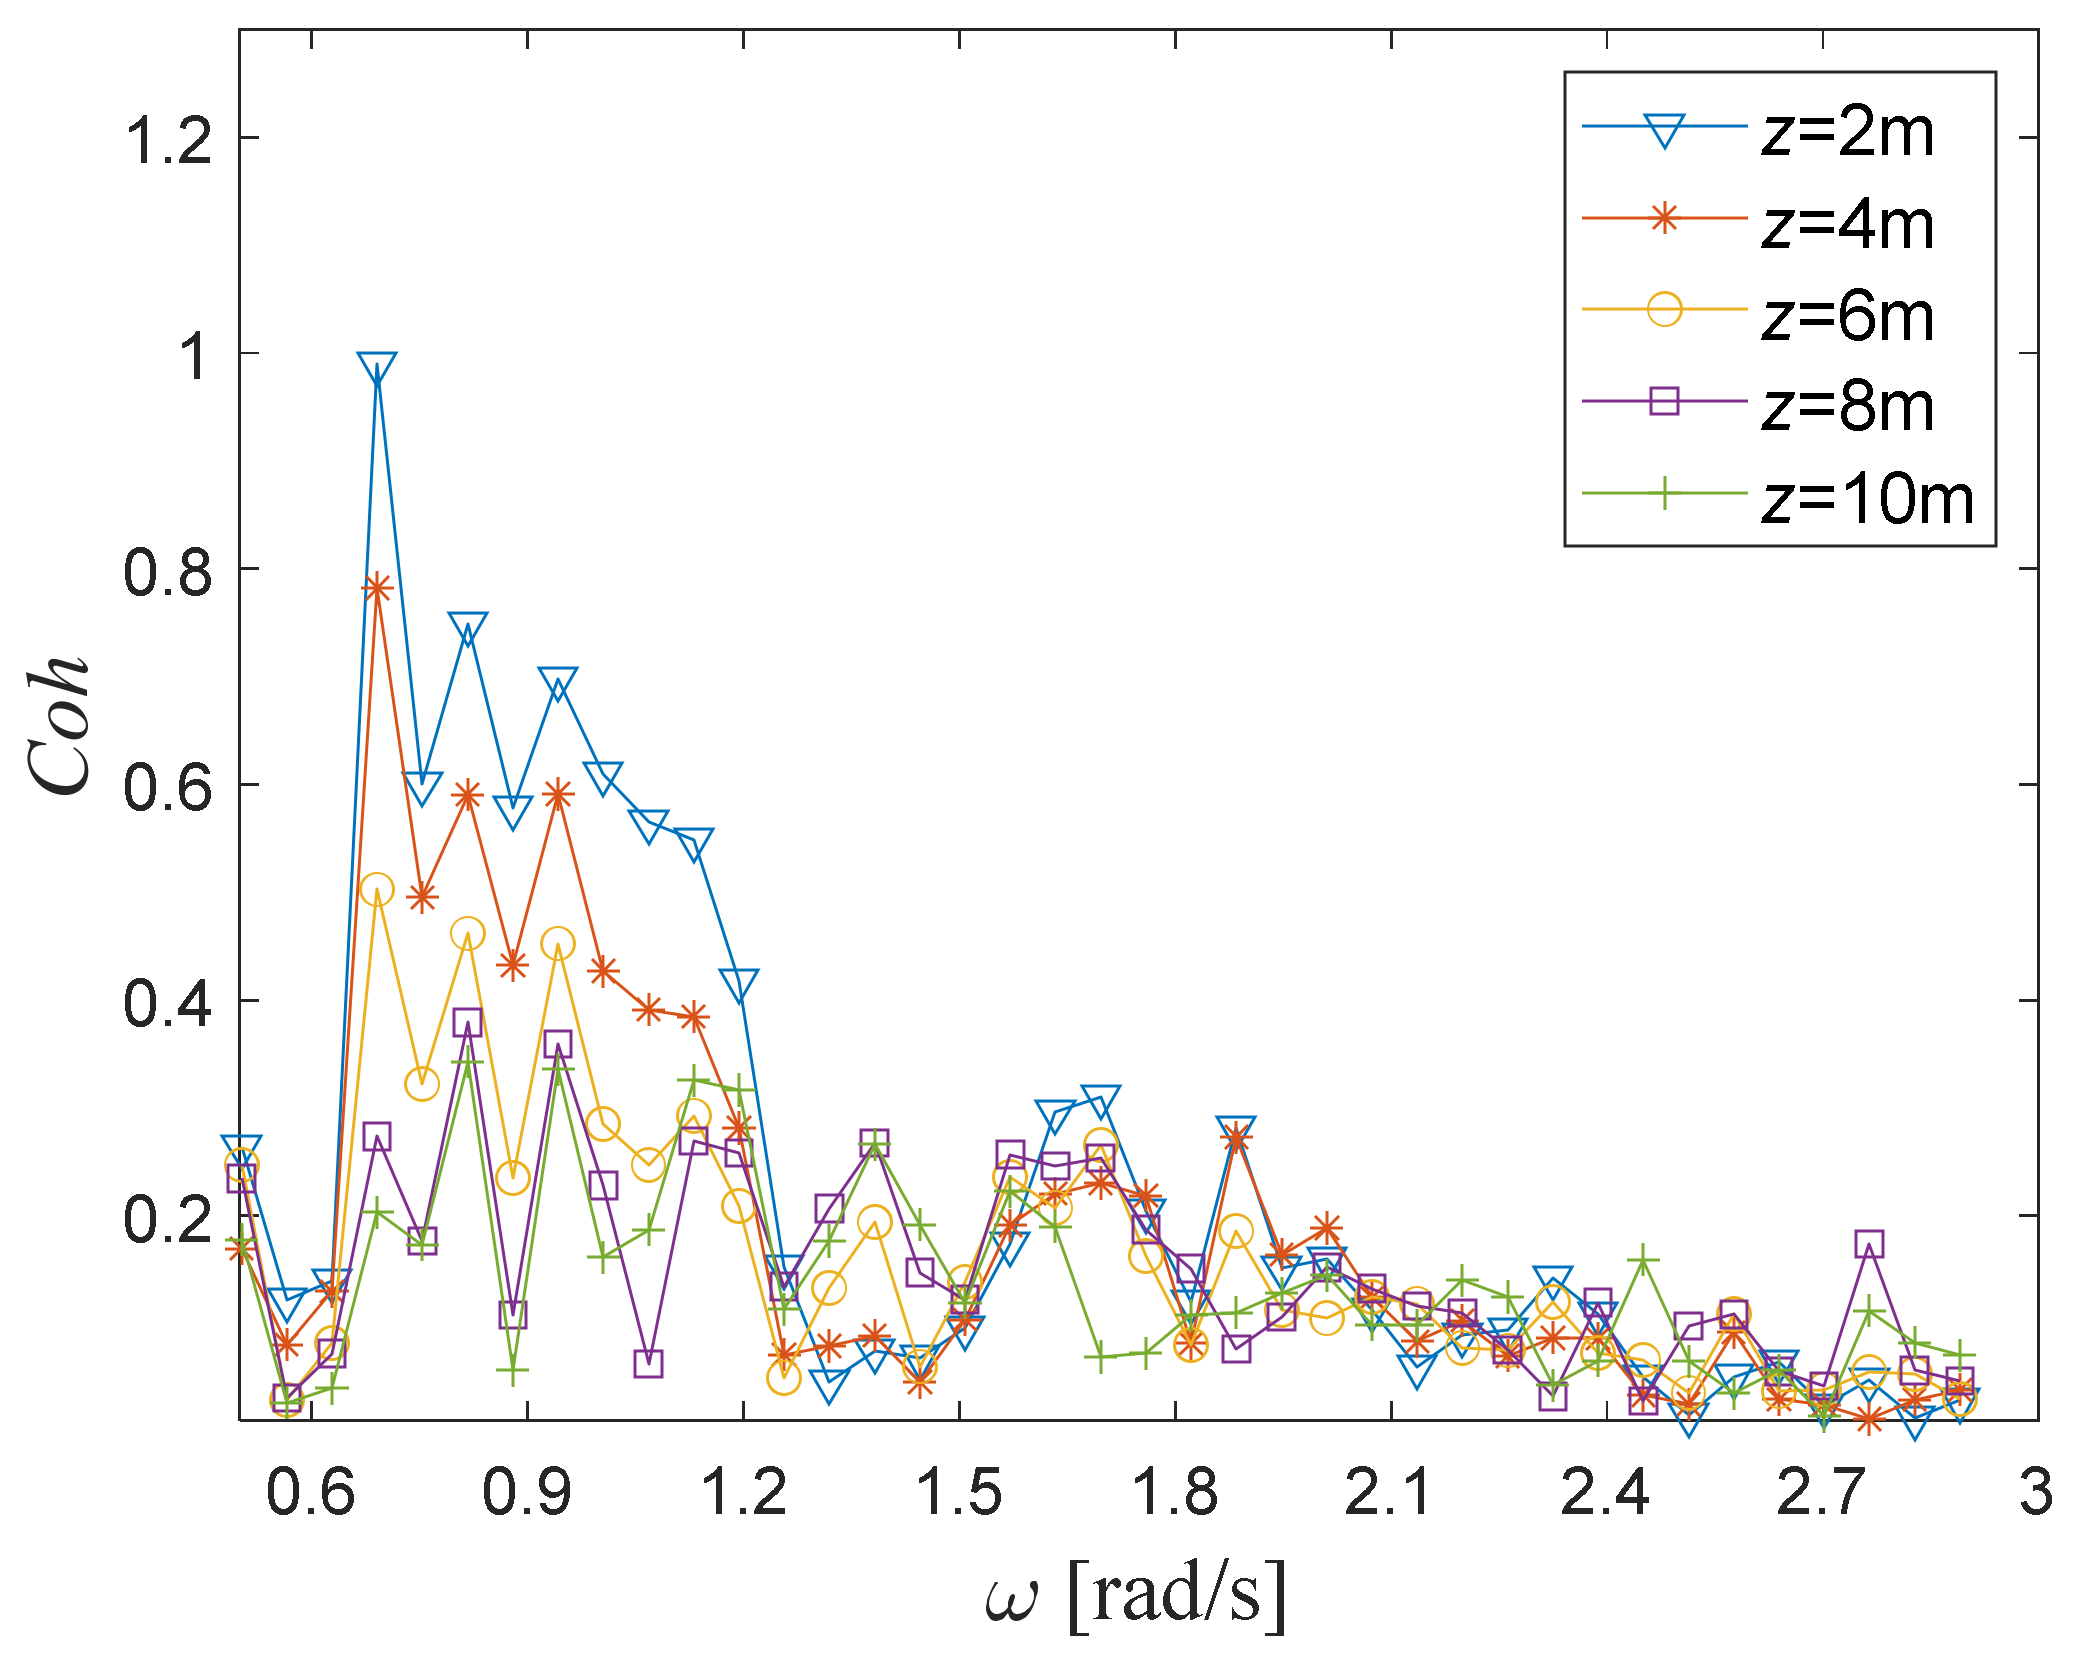
z, the scatter curves of the wind–wave coherence values at each height are shown in
Figure 8. The corresponding rules for wind–wave coherence values are as follows.
The first is the trend of coherence values with frequency. With a higher frequency, the overall coherence size rises first and then declines. Particularly, when the frequency approaches the corresponding peak of the random wave spectrum, or specifically about 0.7~1 rad/s, the coherence values are significantly larger than those of other frequency bands.
Next, we explain the relationship between coherence values and the wind speed position height. Higher fluctuating wind positions mean significantly lower corresponding coherence values, and lower position heights lead to larger coherence values. For example, as shown in
Figure 8, the coherence values at the 2 m position height are obviously larger than that under other heights.
In addition, it can be seen from
Figure 8 that there is a relatively small peak of the coherence curve at roughly twice the value of the given wave spectrum peak frequency (for example, at position 1.6
if the peak frequency is 0.8
). We estimate the reasons as follows. Random wind and waves have a high probability of mutual interference effects at the superior frequency of waves. This mutual interference causes the gas near the water surface to conform to the wave front. The characteristics of the fluctuating wind speed tend to the wave characteristics, such as wavelength and period. In this case, when a double-frequency wave interacts with the wind speed, the wavelength and the period of the pulsating air are multiplied by the wavelength and the period of the wave front. If the peak of the wind speed meets the peak of the wave surface again, the wind-wave interaction effect would be enhanced. Therefore, the coherence effect is larger at this frequency, showing a certain peak phenomenon.
In summary, the wind–wave coherence rises and then falls with higher frequency, and the peak frequency of the change curve is close to that of the random wave spectrum. In addition, the wind–wave coherence gradually drops as the wind speed position rises, that is, closer wind and waves show greater coherence.
4.2. Wave Height Influence
Significant wave height is a vital parameter of random waves, which directly characterizes how much a wave surface moves up and down during wave propagation. During combined wind–wave propagation, a higher wave height leads to a larger mutual contact surface between the wave surface and the air; further, greater mutual stimulation and mutual interference between wind and waves results in stronger wind–wave interaction. Obviously, wave height significantly affects the interaction between wind and waves. Therefore, the significant wave height of random wave is a major influence factor of wind–wave coherence. Based on this, qualitative and quantitative studies on the influence of significant wave height on wind-wave coherence would be carried out.
Based on the established numerical flume of random wind–wave joint propagation, numerical simulations of the joint propagation of fluctuating wind and random waves with different significant wave heights were carried out. During the simulations, the time history of the wave surface was recorded at appropriate surface locations along the numerical flume, and wind speed monitoring points were set at different heights of the air phase along the flume to monitor the time histories of fluctuating wind speeds. Based on the numerical calculation data of wave surface and wind speed time-histories, as well as the theoretical wind speed and wave surface power spectrums, the wind-wave coherence function values under different significant wave heights were calculated. Furthermore, the variation of the coherence function value with the significant wave height was analyzed. The specific process was as follows.
The numerical simulation’s working condition of wind–wave joint propagation was set according to actual data on ocean wind and waves [
1]. The wave peak frequency, water depth and basic wind speed at the reference height (
= 10 m) were set at
= 0.8 rad/s,
and 12.8 m/s, respectively, along with the different significant wave heights of
= 1, 2, 3, 4, 5 and 6 m.
Particularly, the wave surface and wind speed time histories under different wave heights should be noted. The wave surfaces were monitored at of the flume, and the wind speeds were synchronously monitored at of the flume.
With the monitored wave surface and wind speed data, the same calculation method for wind–wave coherence as in
Section 4.1 was used for corresponding coherence values for different significant wave heights. Taking the circular frequency
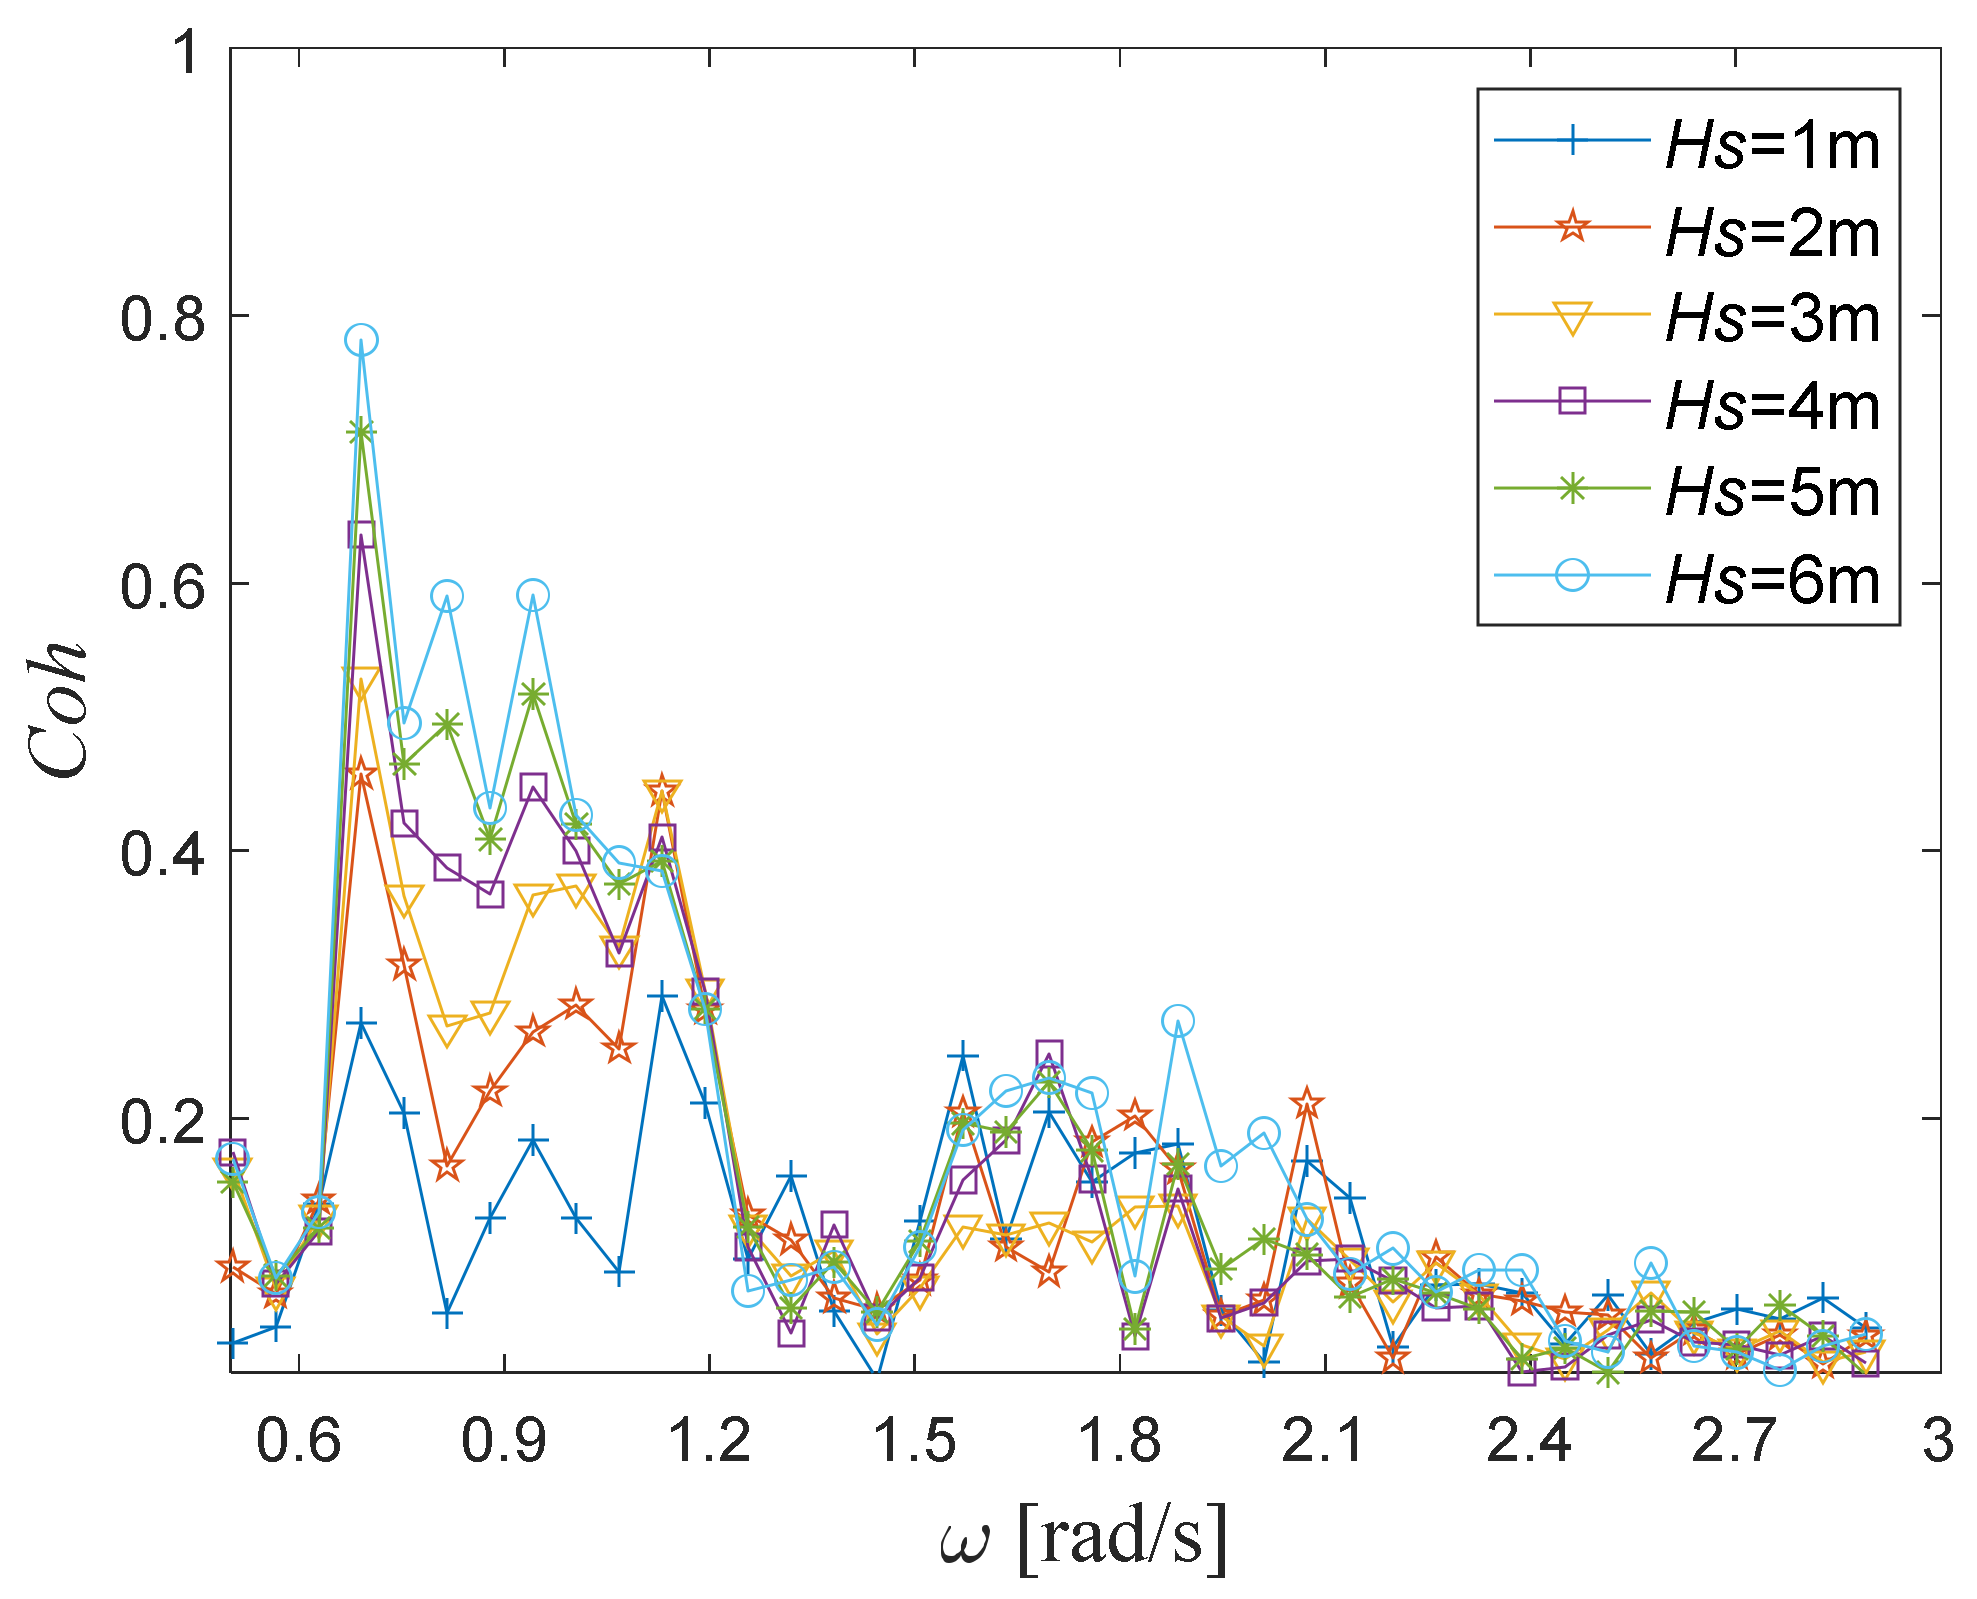
as the horizontal coordinate, the scattering curves of wind–wave coherence values at different significant wave heights are shown in
Figure 9. The trends of wind–wave coherence values are as follows.
The first is the trend of coherence values with frequency. Like the coherence trend in
Section 4.1, the coherence values also rise first and then drop as the frequency increases. When the frequency is close to the peak frequency of the random wave spectrum of about 0.7~1 rad/s, the coherence values are significantly greater than those of other frequency ranges.
The second is the trend of coherence values with significant wave heights. The coherence values under different significant wave heights vary greatly. That is, the higher the significant wave height, the greater the coherence values, as shown in
Figure 9. Specifically, the coherence values at the height of 6 m are significantly greater than those of other wave heights.
In summary, wind–wave coherence increases first and then decreases with higher frequencies, and the peak frequency of the change curve is close to the peak frequency of the random wave spectrum. Significant wave height has a strong effect on wind–wave coherence, which indicates that a higher wave height means greater wind–wave coherence.
4.3. Wave Peak Frequency Influence
From
Figure 8 and
Figure 9, according to the influence of wind speed position height and significant wave height on wind–wave coherence, the frequency value corresponding to the wind–wave coherence curve peaks, i.e., the peak frequency, is close to the spectral peak frequency of the corresponding random wave. In other words, the coherence values within a certain frequency range close to the wave spectrum peak frequency are significantly larger than those within the other frequency ranges. Therefore, the peak frequency of the coherence value curve
corresponds to the wave spectrum peak frequency, which can be confirmed by the numerical simulation of the wind–wave joint propagation under different random wave spectral peak frequencies along with the calculation and analysis of the coherence values based on the simulation data.
Based on the stochastic wind–wave joint numerical flume and the general range of wave spectrum peak frequencies, four working conditions of this numerical simulation were set according to different wave spectrum peak frequencies, i.e., = 0.4, 0.8, 1.2 and 1.6 rad/s. Other major parameters of the wind–wave fields were set as follows: the basic wind speed at the base height ( = 10 m) was 12.8 m/s, the significant wave height was = 4 m and the water depth was .
Here, the time histories of both wave surfaces and wind speeds at a certain height above the water surface under different spectral peak frequencies should be noted. The wave surfaces were monitored at the position of the flume, and the fluctuating wind speeds were synchronously monitored at the position.
Using the wave surface and wind speed data from monitoring, the same calculation method for wind–wave coherence as in
Section 4.1 was adopted for the wind–wave coherence values with different wave spectrum peak frequencies. Taking the circular frequency
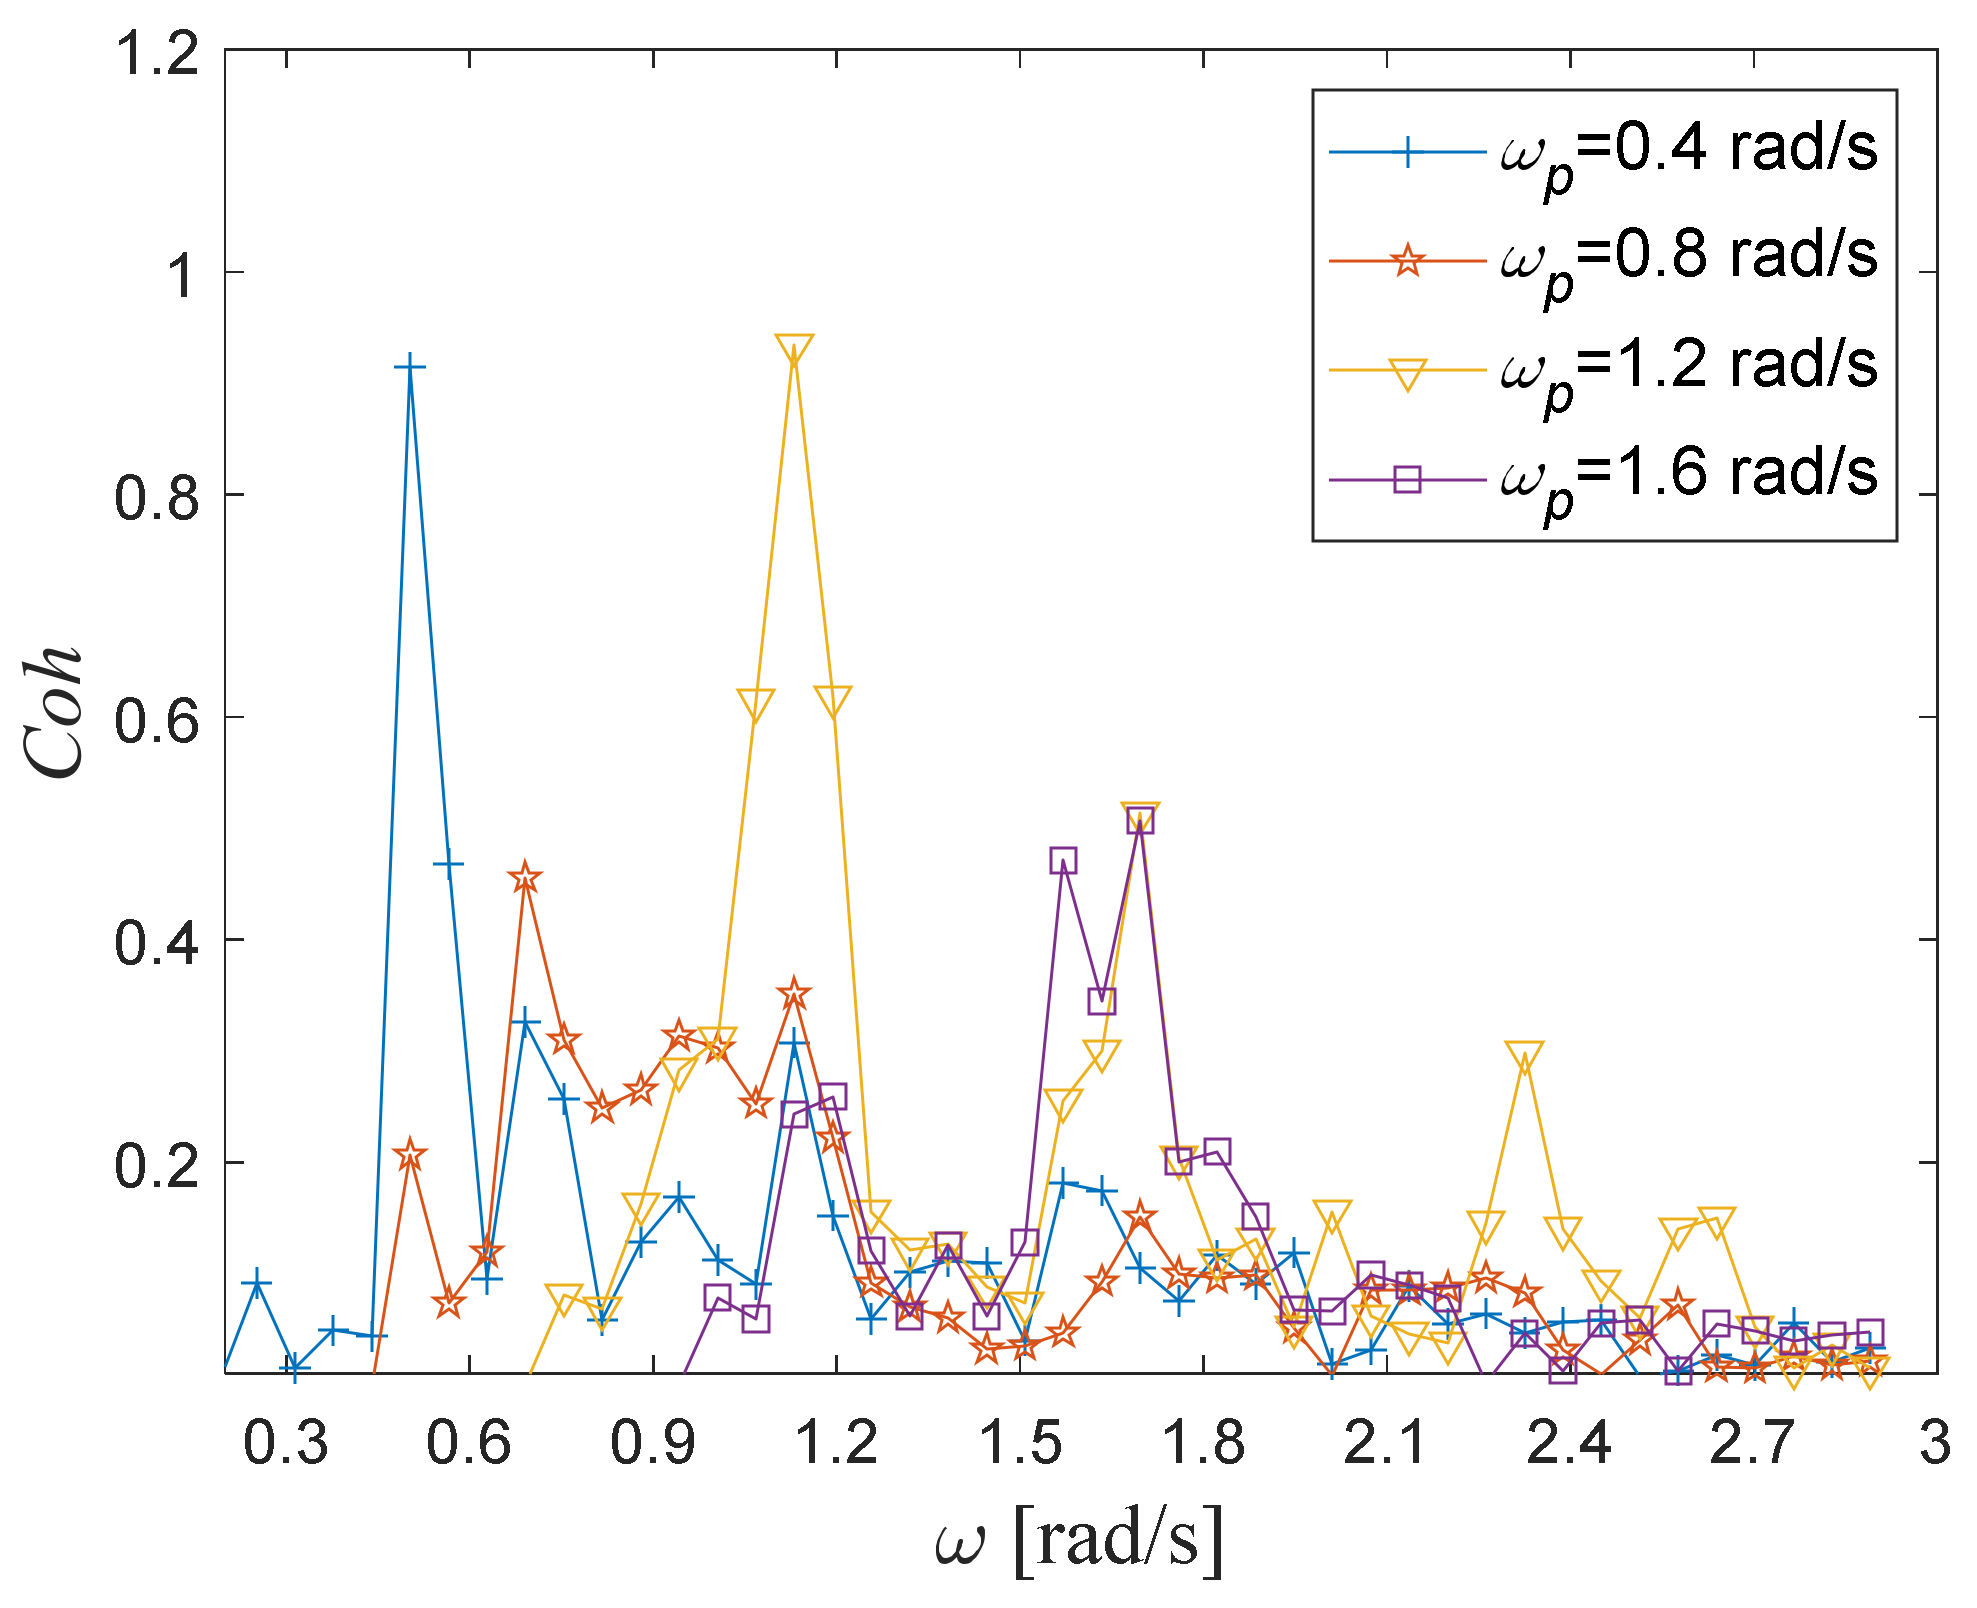
as the horizontal coordinate, the scattering curves of wind–wave coherence values with different wave spectrum peak frequencies
are shown in
Figure 10. The variation trends of wind–wave coherence values are as follows.
With different frequencies along the horizontal axis, the coherence value curves of different wave spectrum peak frequencies demonstrate a significant maximum in a certain frequency band, i.e., there is a significant peak frequency on the coherence value curve. Positioned to observe the peak frequencies of the coherence value curves under different spectral peak frequencies, the peak frequencies of the coherence values curves are generally varied for different wave spectral peak frequencies, and the peak frequency is close to its corresponding wave spectrum peak frequency. This conclusion confirms that the wave spectrum peak frequency significantly affects the wind–wave coherence, and the maximum value of the wind–wave coherence effect occurs at approximately the same frequency as the wave spectrum peak frequency.
4.4. Basic Wind Speed Influence
In addition, the potential influence of the basic wind speed of fluctuating wind on wind–wave coherence was considered. With fixed random wave parameters, i.e., a significant wave height , a spectral peak frequency and a water depth of random waves , fluctuating winds with different basic wind speeds of 5, 10, 15 and 20 were set. Then, the joint propagation numerical models of fluctuating winds with different basic wind speeds and a fixed random wave were established for this study. The wave surfaces were monitored at the position of the flume, and the fluctuating wind speeds were synchronously monitored at the position. The numerical wind-wave coherence values under each basic wind speed condition were calculated by the numerical monitoring data.
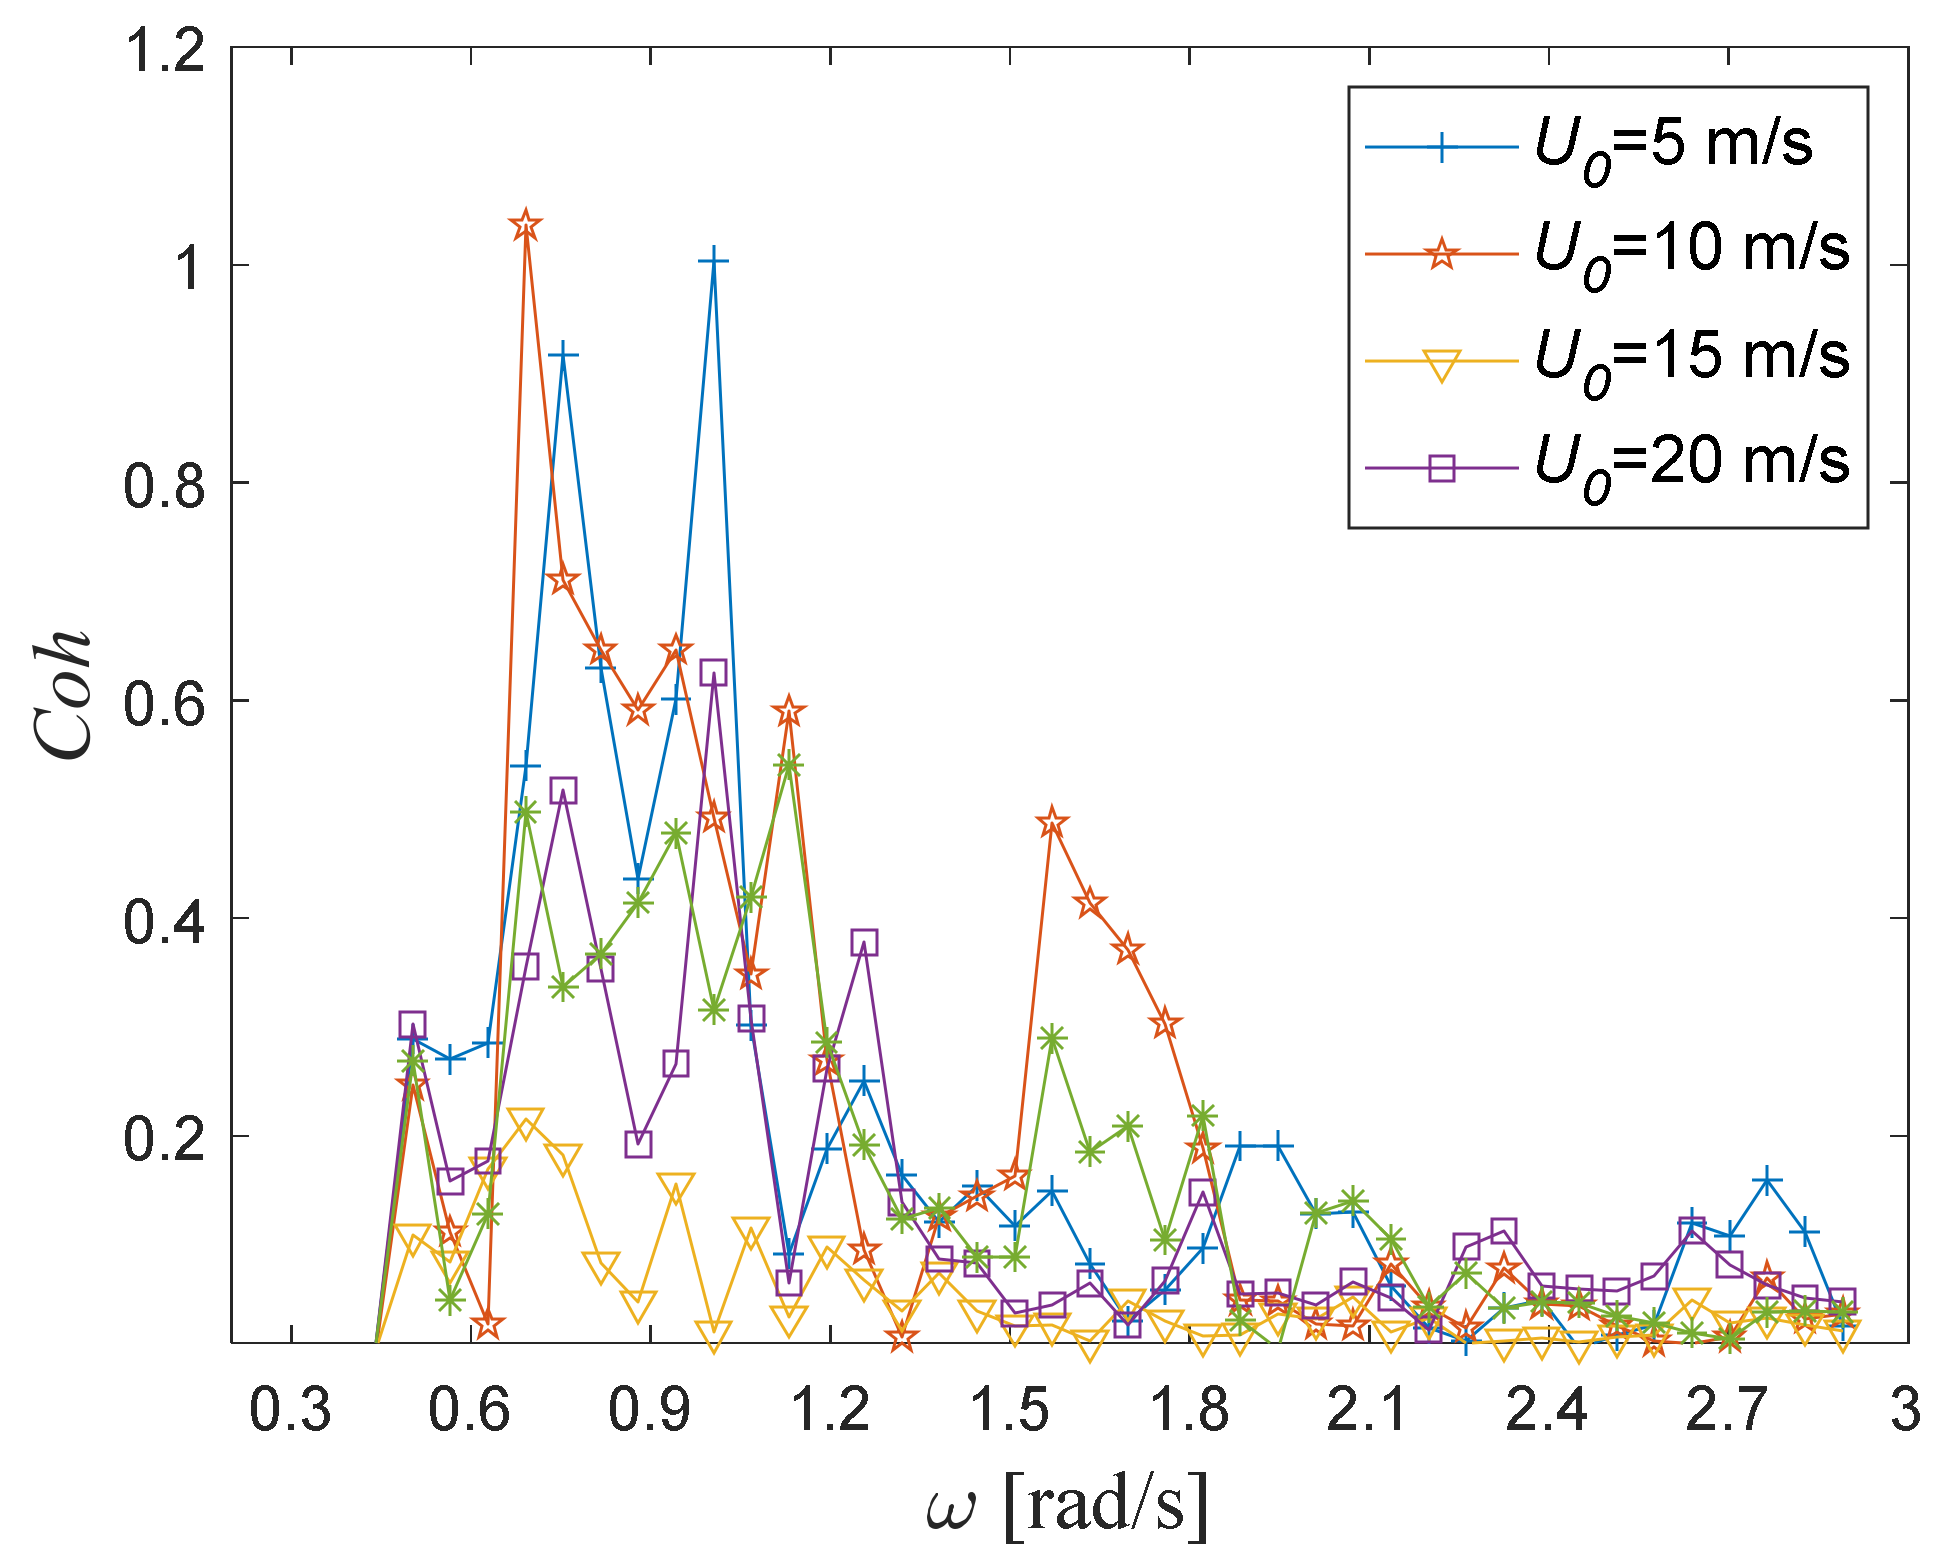
With different frequencies, the wind–wave coherence values under different basic wind speeds are shown in
Figure 11. Within the basic wind speed range of 5~20
, the coherence values between wind and waves did not show significant magnitude differences. Under synchronous wind and wave propagation, the major influencing factor on the coherence effect between random wind and waves is the pulsation component of wind speed, while the average basic wind speed has little influence.
5. Wind–Wave Coherence Function Construction
From the above calculations and analyses, the coherence function for wind–wave coherence was established with the wind–wave coherence value as the function value, the circular frequency as the independent variable, and the wind and wave parameter values as the parameters. To be noted, firstly, should be between 0 and 1, as it is the coherence of the two time history data, where 0 indicates no correlation and 1 indicates complete correlation. In addition, the application of in Equation (16) shows that its function value must be dimensionless.
Through the numerical simulation of wind–wave joint propagation and wind–wave coherence analysis, the wind–wave coherence value is less affected by the average wind speed but is mainly related to the wave spectrum peak frequency
, the height
of the wind speed position from the wave surface, and the significant wave height
. The rules for each influencing factor on the coherence value are different, so the expression of the wind–wave coherence function
is developed by separating variables, that is,
The concrete expression of the coherence function is established by drawing up the expressions of , and . It can be seen that the changing form of as is determined by , and affect the overall value of . To satisfy the basic property of , the values of , and should be between 0 and 1. To satisfy the basic property that the function value of is dimensionless, the values of , and should be dimensionless quantities.
Firstly, the expression of
is determined. This function describes the variation trend of wind–wave coherence with circular frequency
under wave spectrum peak frequency
. From the analysis, the wind–wave coherence values increase sharply at first and then decrease slowly as the frequency
changes rise. The wind–wave coherence values have an obvious extreme value, and the wave peak frequency
directly affects the corresponding frequency of this extreme value. Moreover, the change curves show that the corresponding frequency of this extreme value is basically consistent with the wave spectrum peak frequency
. According to the above change laws of the coherence values, the influence characteristic of
, the value range of
and the dimensionless condition of
, the following function expression of
can be proposed.
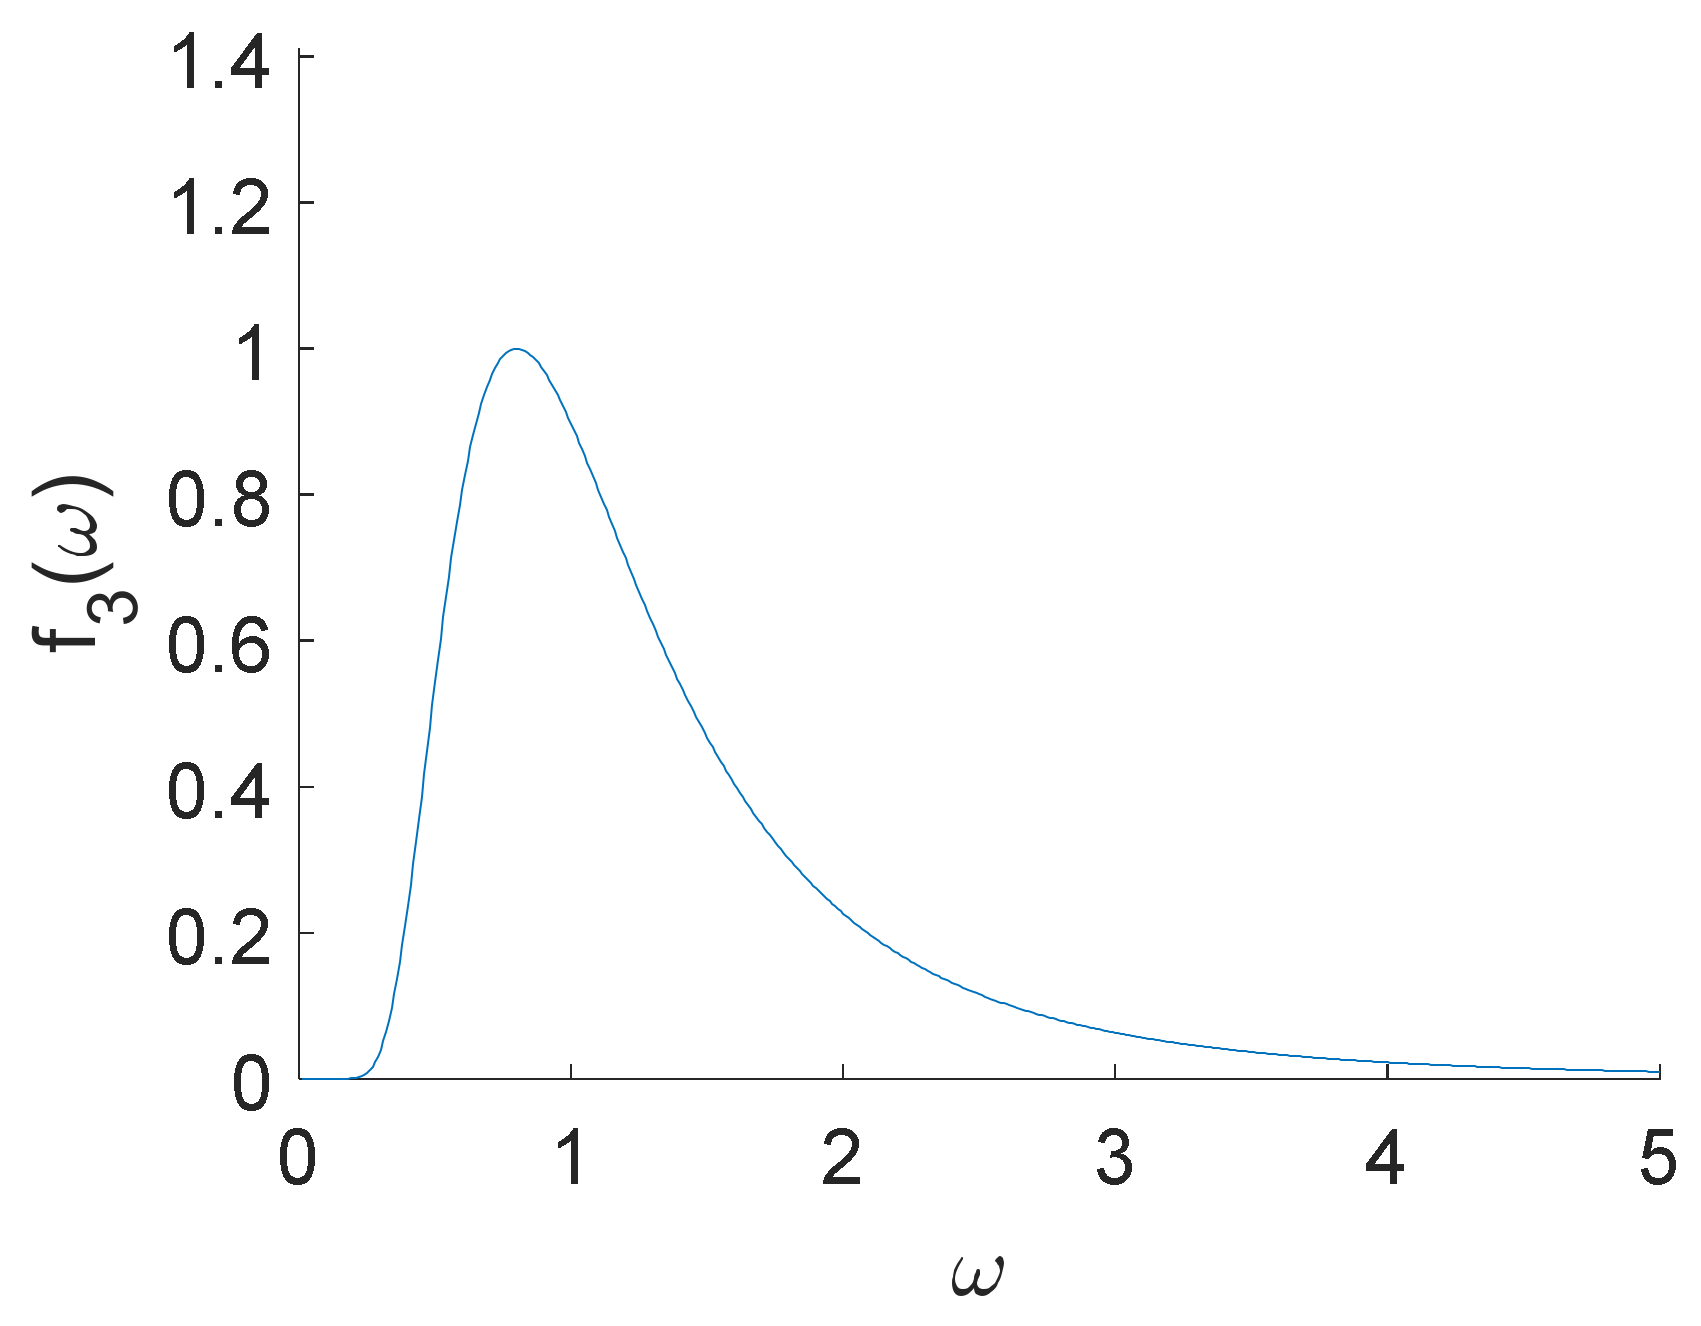
With a higher frequency
, the function curve of Equation (19) is shown in
Figure 12.
and
in the formula are function curve shape parameters, which control the curve rise-and-fall form. The values of
and
are set on the condition that the function curve matches the numerical calculation data, that is, the mean square value of the error between the numerical values and the function values is minimal. The specific method is as follows. According to the principle of Equation (17), the numerical values of wind–wave coherence values
at
at all wind speed position heights of
= 2, 4, 6, 8 and 10 m under all significant wave heights of
= 1, 2, 3, 4, 5 and 6 m are obtained from the numerical simulation results. The value of
in Equation (18) is pre-set at a constant of 0.5, and
and
are taken as undetermined parameters. By all numerical values
,
and
are calculated according to the following conditions.
After calculations with the minimum mean square value of 0.0278, and .
The function expression Equation (19) has the following properties. Firstly, the function curve changes as
rises, as shown in
Figure 12, which is consistent with the previous conclusion that the coherence value first increases sharply and then decreases slowly with increasing frequencies. Next, from the derivative of the function
, the function takes the maximum value of 1 when
, that is, the corresponding frequency of the maximum value of the function is the wave spectrum peak frequency, which is also consistent with the previous numerical analysis conclusion about peak frequency. Moreover, the value range satisfies
. Finally, the function value is dimensionless.
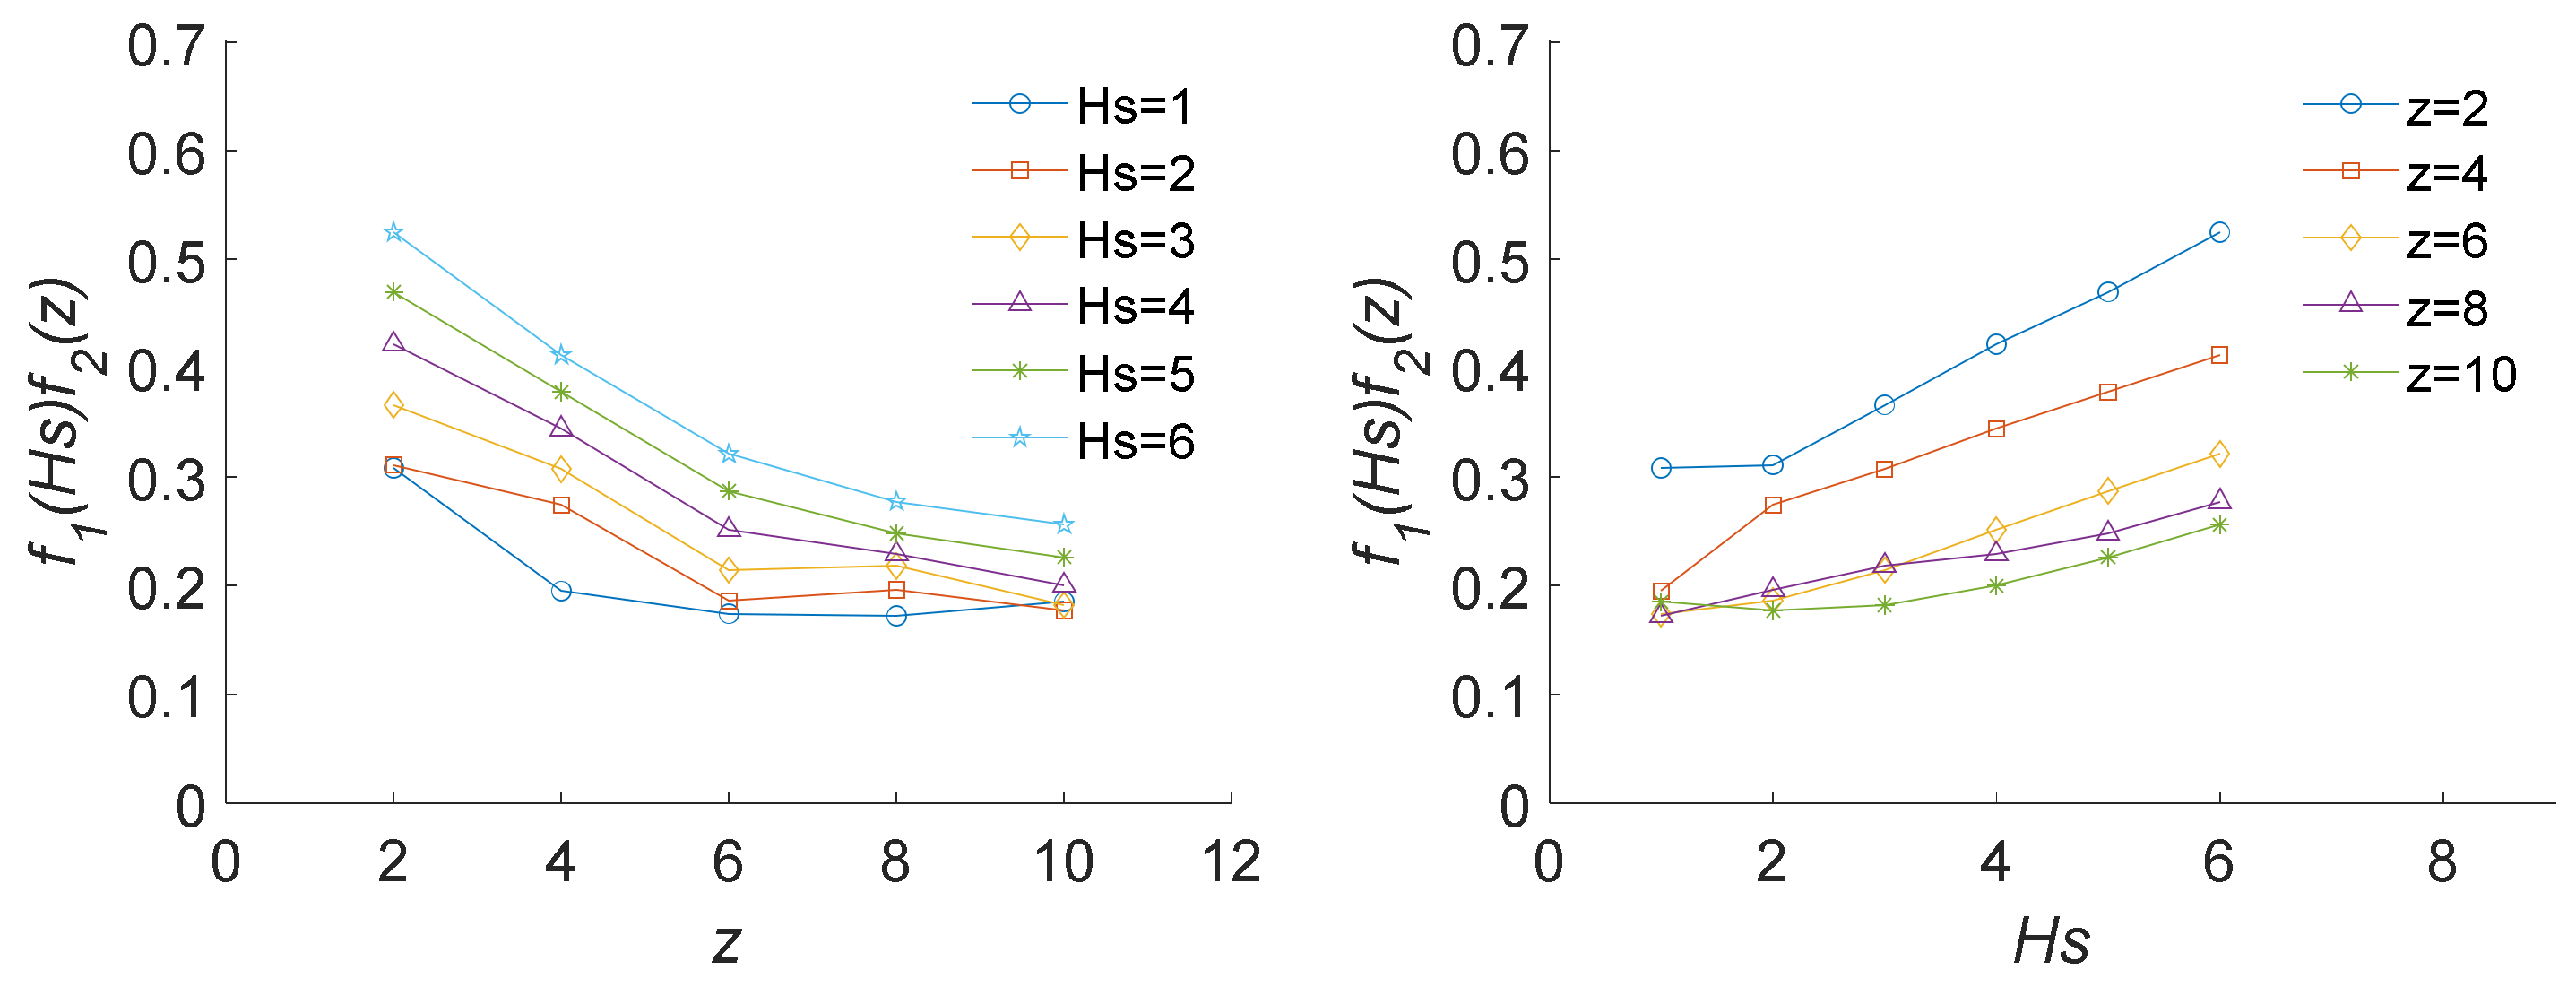
In the following, the expression of would be determined. The function of is to adjust the value at each frequency value with different significant wave heights and wind speed position heights. Specifically, the numerical values of the function, i.e., , are calculated first; then, the function expression of can be obtained by fitting these numerical data. The specific process is as follows.
The numerical wind–wave coherence values
and the calculated values of
according to Equation (19) are taken together to calculate the numerical values
under different working conditions of
= 1, 2, 3, 4, 5 and 6 m and
= 2, 4, 6 and 8 m. Based on the predefined coherence function expression, Equation (18), the minimum mean square value of the error between
and
is used as the basis to judge the
value. With an increasing series value
, for
frequency points, when
is taken for different working conditions of and .
For different working conditions
and
, the numerical scatter diagram of
is shown in
Figure 13, and its change characteristics are as follows. Firstly, with a higher wind speed position height
,
generally shows an exponential downward trend. Secondly, with a higher significant wave height
,
generally increases. Thus, the fitting expression of
is set as
where
,
and
are undetermined fitting parameters and
(10 m) is the standard height of the basic wind speed. The fitting values of
,
and
are also set based on the fitting method of the least mean square value of the errors. For all
and
working conditions, the numerical values of
are taken. By the following equation:
the results are
,
and
.
Firstly, Formula (22) is consistent with the trend that the coherence value changes with the significant wave height and the wind speed position height. In addition, the function value is dimensionless. Thirdly, within the ranges of and , the function values meet the coherence value range of 0~1.
By substituting Equations (19) and (22) into Equation (18), the expression of the wind–wave coherence function
is
where the shape parameters are
and
and the significant wave height and wind speed position influence parameters are
,
and
. Therefore, from the above function development process, this function satisfies the conditions of dimensionlessness and the values being between 0 and 1.
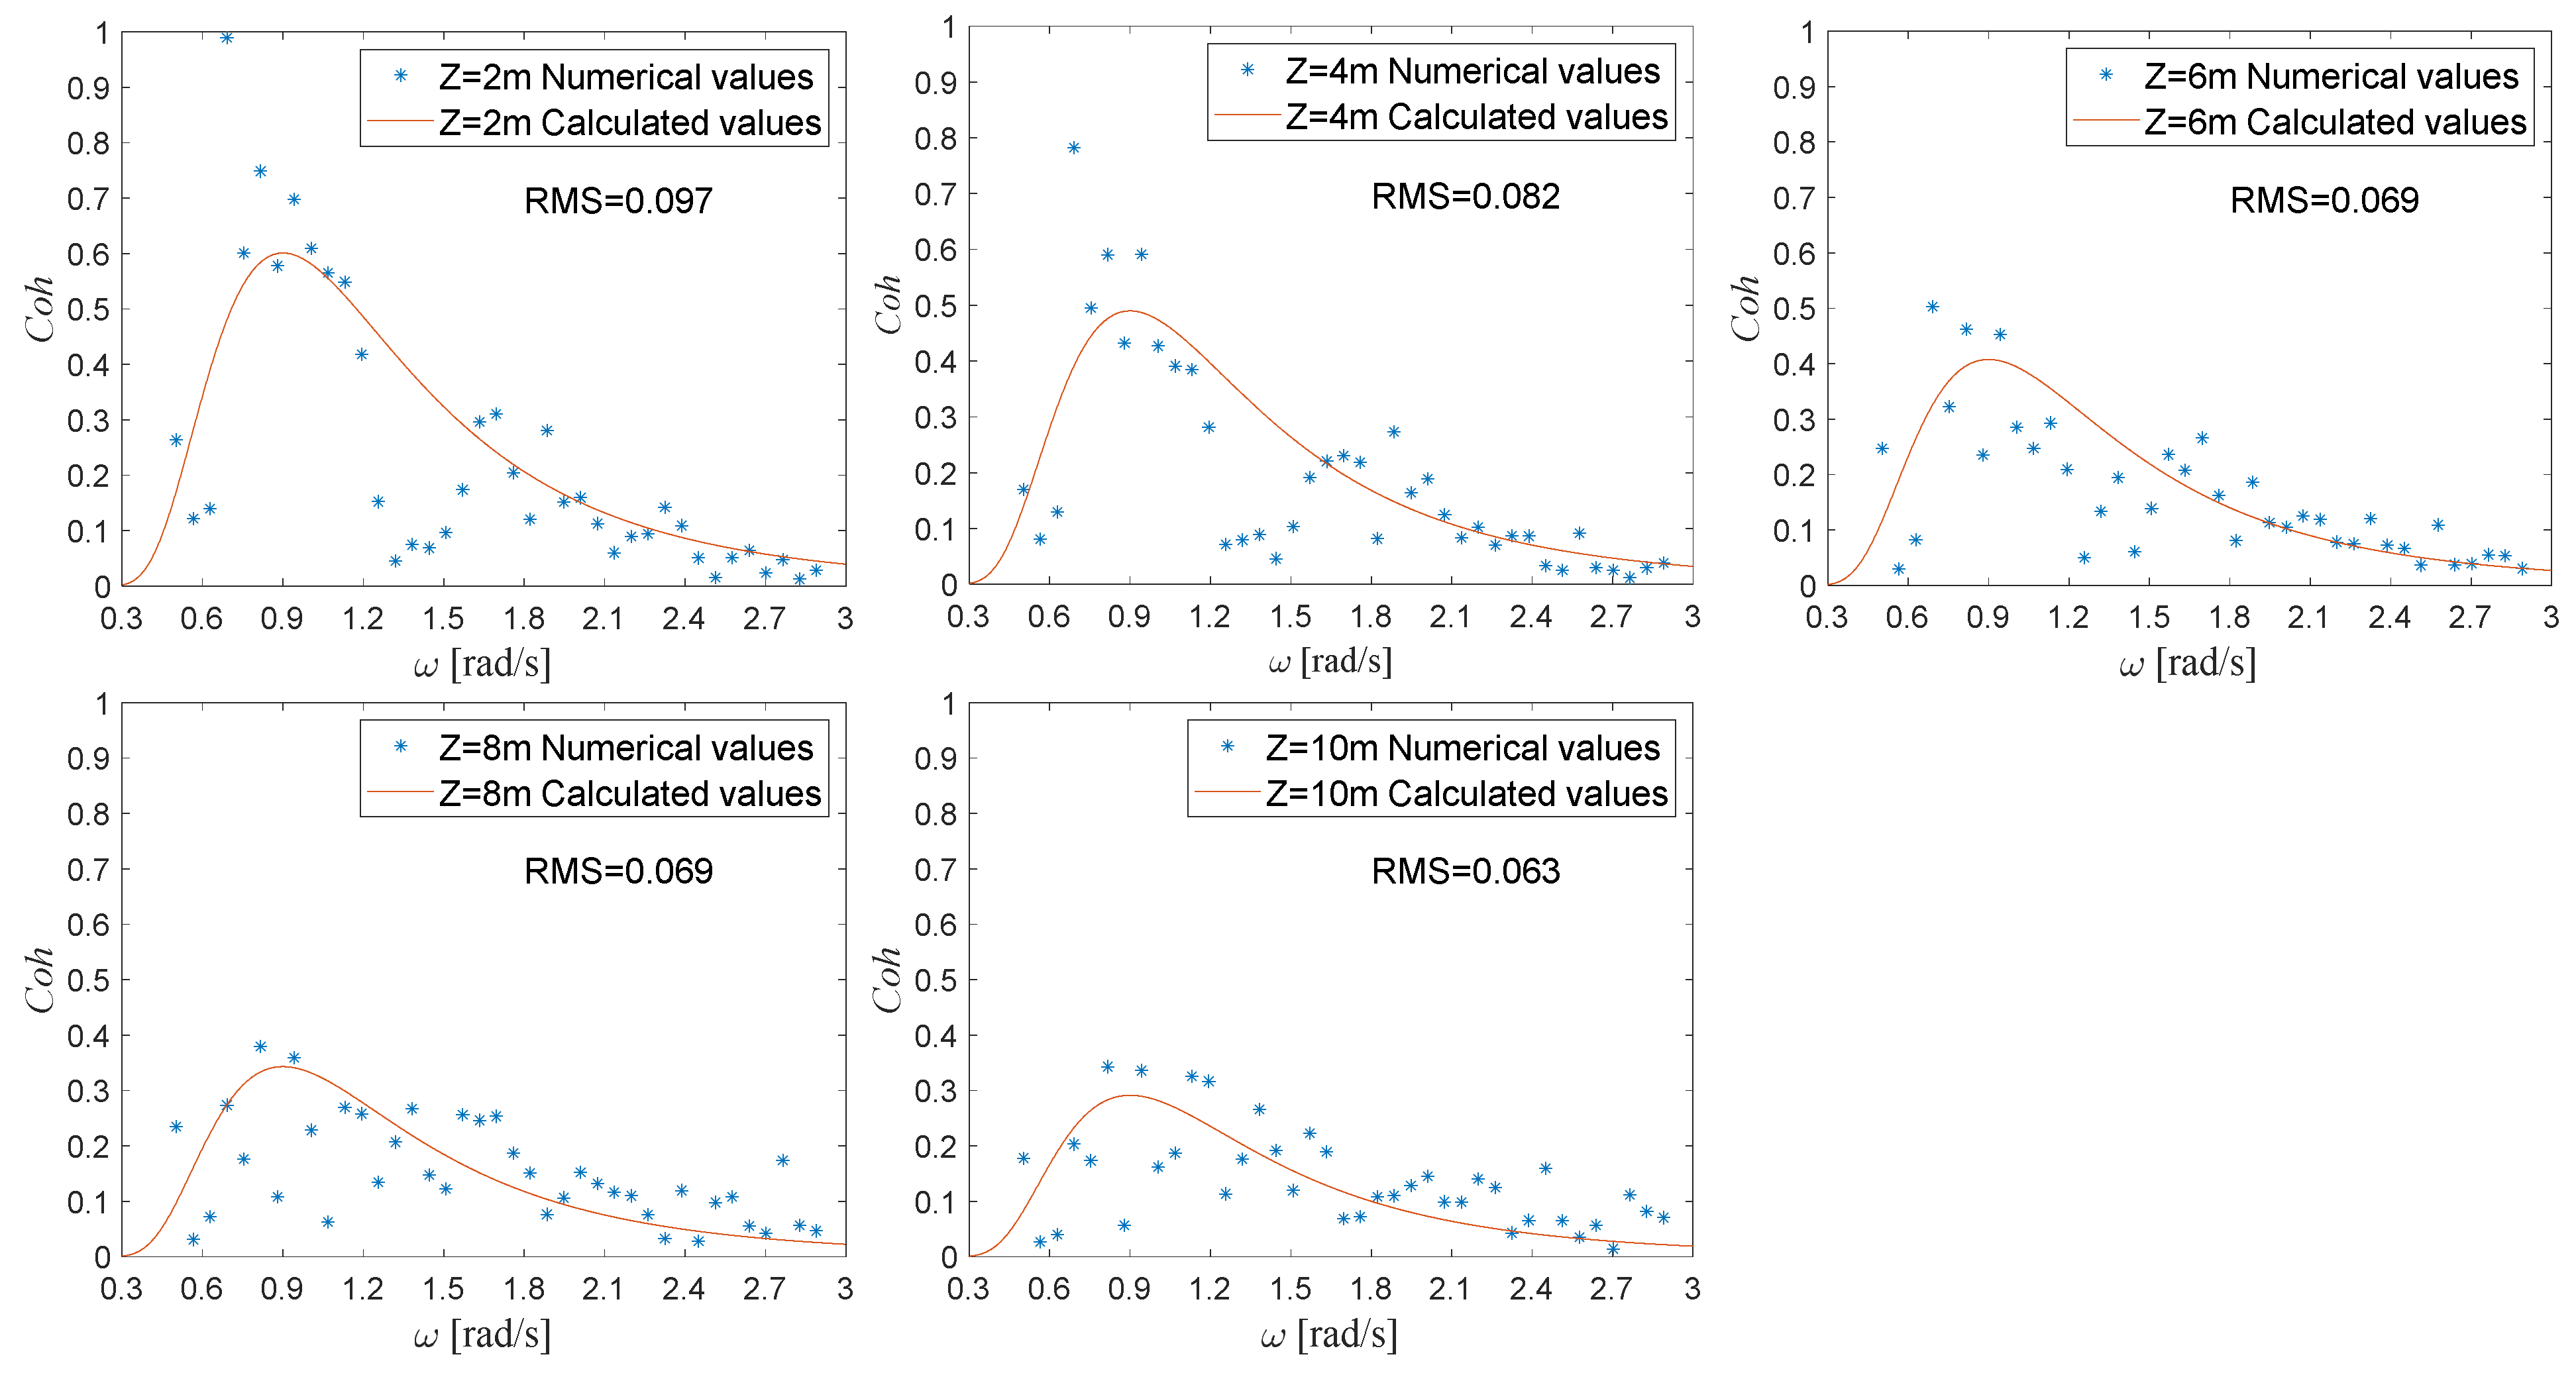
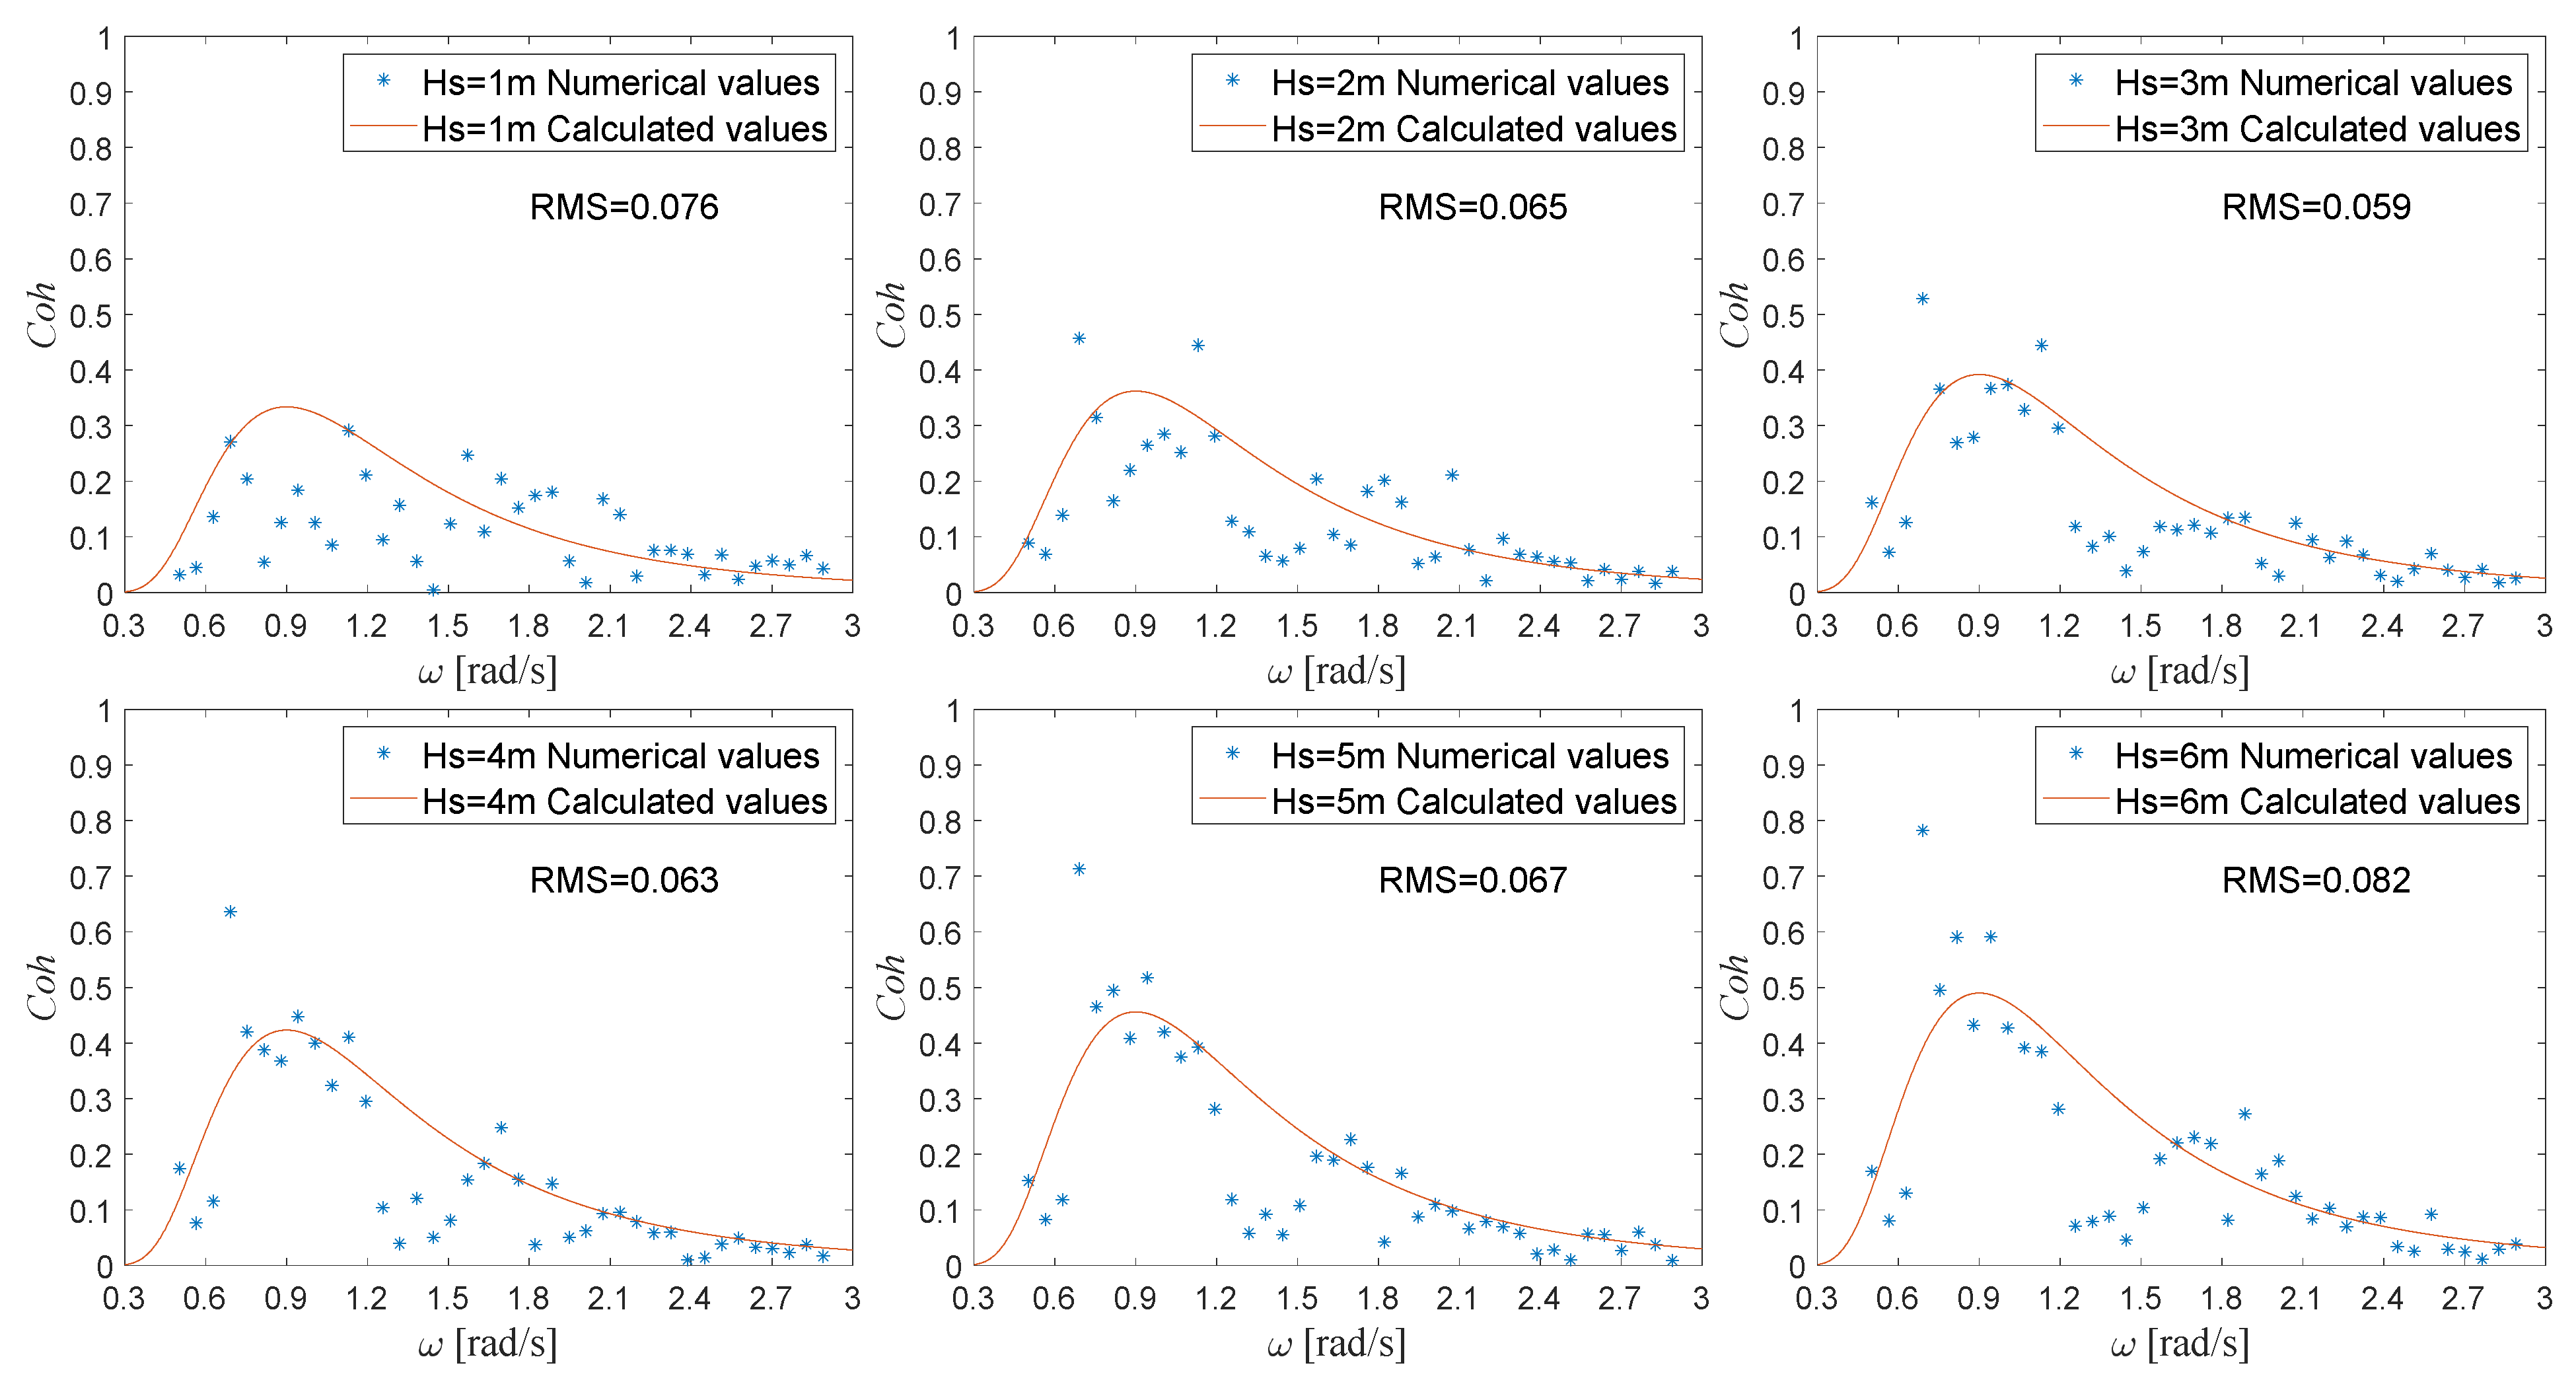
Figure 14 and
Figure 15, respectively, show the comparison between the calculated value curves of the coherence function shown by Equation (24) and the corresponding numerical simulation values under the different wind speed position heights and the different significant wave heights. Typically, the function curves agree with the numerical scatter values. That is, both the calculated curves and the numerical scatter values rise rapidly then fall slowly with higher frequencies, and the coherence values reach their maximum values when the frequency increases to the wave spectrum peak frequency. It can be seen from
Figure 14 that, with a higher wind speed position height, both the calculated and numerical values of the coherence values are smaller, which accords with the law that greater wind speed position height lead to smaller wind–wave coherence. Moreover, from
Figure 15, the calculated and numerical values of the coherence values increase with higher significant wave heights, which conforms to the law that the higher the wave height, the greater the wind–wave coherence.
On the other hand, it can be seen from the numerical three-point chart that there is a relatively small peak of the coherence values at roughly twice the value of the given wave spectrum peak frequency. This phenomenon has been described in
Section 4.1. However, this phenomenon is not reflected in the established coherent function expression. First, considering that this coherence peak value is relatively small compared with the coherence value at the wave spectrum peak frequency, it is not considered in the general trend of the coherence values. Second, if this phenomenon is considered, it is expected that the corresponding coherence function will be constructed in segments. Therefore, to maintain the simplicity and integrity of the established coherent function, we do not consider this phenomenon in the function for the time being.
In addition, in
Figure 14 and
Figure 15, the root mean square (RMS) values between the calculated values and the numerical values are set to define the error accuracy under each working condition. For all working conditions, the RMS values between the calculated values and the numerical values are within the range of 0.05~0.1. Compared to a traditional coherence value range of 0~1 between two signals, this error accuracy is acceptable.


