Article

Projecting Irrigation Water and Crop Water Requirements for Paddies Using WEAP-MABIA under Climate Change

Civil Engineering Programme Area, Faculty of Civil Engineering, Universiti Teknologi Brunei, Jalan Tungku Link, Gadong, Bandar Seri Begawan BE 1410, Brunei
*
Author to whom correspondence should be addressed.
Water 2024, 16(17), 2498; https://doi.org/10.3390/w16172498
Submission received: 18 June 2024 / Revised: 21 July 2024 / Accepted: 24 July 2024 / Published: 3 September 2024
(This article belongs to the Special Issue Impacts of Climate Change on Water Resources: Assessment and Modeling)

Abstract

:
Monitoring future irrigation water demand as a part of agricultural interventions is crucial to ensure food security. In this study, the impact of climate change on paddy cultivation in Brunei is investigated, focusing on the Wasan rice scheme. This research aims to project irrigation water requirement (IWR) and crop water requirement (CWR) or the main and off season using the WEAP-MABIA model. Historical data analysis over the past 30 years and future projections up to 2100 are employed to assess potential impacts. An ensemble of statistically downscaled climate models, based on seven CMIP6 GCMs under shared socioeconomic pathways (SSPs) (SSP245, SSP370, and SSP585), was utilised to project the IWR and CWR. Using downscaled CMIP6 data, three future periods were bias-corrected using quantile delta mapping (QDM) for 2020–2046 (near future), 2047–2073 (mid future), and 2074–2100 (far future). The WEAP-MABIA model utilises a dual crop coefficient approach to evaluate crop evapotranspiration (ETc), a critical factor in computing IWR. Results indicate that changes in future temperatures will lead to higher average ETc. Consequently, this results in elevated demands in irrigation water during the off season, and it is especially prominent in high-emission scenarios (SSP370 and SSP585). While the main season experiences a relatively stable or slightly increasing IWR trend, the off season consistently shows a decreasing trend in IWR. Moreover, the off season benefits from substantial rainfall increases, effectively reducing IWR despite the rise in both maximum and minimum temperatures. This study also highlights some recommendations for implementing possible improvements in irrigation management to address the effects of climate change on rice cultivation in the region. Future investigation should focus on enhancing crop yield predictions under climate change by integrating a dynamic crop growth model that adjusts for changing crop coefficient (Kc) values.

1. Introduction

The ongoing rise in the temperature of the earth’s surface persists, with a documented increase in global temperature of 1.1 °C being observed during the period spanning from 2011 to 2020 compared to the time frame between 1850 and 1900, resulting in extreme hydrometeorological events such as heavy rainfall [1]. A previous study anticipated an increase in the future rainfall trend in Brunei [2]. This might potentially have adverse effects on rice cultivation, as recent studies have indicated that rice is susceptible to both intense rainfall and fluctuations in temperature [3,4]. To ensure national food security, the Department of Agriculture and Agrifood (DoAA) introduced high-yielding paddy varieties that are drought-tolerant and reduce crop failure in rain-fed rice production areas. One such variety is ‘Sembada 188’, which requires supplementary irrigation under the weather conditions of Brunei Darussalam. In addition to this, the DoAA promotes sustainable technologies like alternate wetting and drying (AWD) to farmers through Farmers Field School [5]. The aim is to enhance the productivity and resilience of Brunei’s rice sector against climate change. Although some rice fields in the district are still suffering from water scarcity, Imang Dam’s ongoing expansion has improved irrigation at agricultural sites [6]. A previous study on the Wasan rice scheme identified numerous challenges faced by the farmers and the overall impact on economic diversification and food security [7]. One of the primary challenges is that farmers encounter a major challenge of water insufficiency, and water availability significantly impacts crop yield and quality in rice farming [7,8]. It is highly advised to implement the efficient management of irrigation techniques, fertilisation methods, and land use in order to maintain food security amidst the challenges posed by climate change [9].
A key factor in water balance is rainfall and crop evapotranspiration (ETc), which eventually determine the irrigation amount for a healthy crop condition. Crop water requirements (CWR) and ETc are related as they both refer to the same amount of water. However, crop evapotranspiration represents water losses through the process of evapotranspiration, while crop water requirement indicates the quantity of water needed to compensate for these losses during the growing period. Therefore, it is vital to compute crop evapotranspiration to prevent crop failure. It has been studied that climatic variables such as rainfall and temperature influence water availability for irrigation, and a decline in the rainfall amount and rise in temperature can influence the evapotranspiration rate, leading to a higher crop water requirement [10,11].
The most widely used approach to determining irrigation water requirements and crop water requirements is through the water balance model. Decision Support System for Agrotechnology Transfer (DSSAT v4.8.2) software and AQUACROP version 7.1 (a crop growth model developed by the Food and Agriculture Organisation) typically need other inputs, such as genetic traits and fertiliser management, to estimate the irrigation water requirement (IWR). Acquiring genomic data over an extended period is challenging. Alternatively, WEAP can simulate the IWR using only meteorological, soil, and irrigation data. This approach eliminates the need for costly and time-consuming field observations. The practical use and availability of scenario analysis have led to the wide use of WEAP for water resource management and planning [12]. A number of studies on the WEAP application look at how to simulate the environmental flow essential for maintaining the health and functionality of rivers, wet land, and other aquatic ecosystems [13], as well as how climate change affects water resources by considering factors such as land use, climate, and irrigation [14], and how to improve planning and decision making for water resources by evaluating water supply management and strategies [15]. For studies related to agriculture, many researchers have used the built-in MABIA method in WEAP [12,13,14,15,16], a water balance model that simulates the inflow and outflow of water in the root zone, whereby the important components involved are effective rainfall, irrigation, surface runoff, percolation, evapotranspiration, and capillary rise. WEAP-MABIA has been applied in various studies, such as computing irrigation water requirements, assessing the spatial temporal variation in a soil water budget [16], analysing the impact of climate change on water resources, water irrigation management, crop production [17], and adopting irrigation strategy management [18]. The WEAP-MABIA approach was utilised to estimate the anticipated crop and irrigation water needs in a study undertaken by Allani et al., and they discovered a mean rise in yearly evapotranspiration (ETo) by 6.1% and a decline in annual precipitation by 11.4%, resulting in a 24% reduction in inflow for cereals under future climate scenarios [19]. In another study, the MABIA module was used to determine the crop water requirements and irrigation water requirements in the Indian state of Chhattisgarh [20]. Moreover, a study used WEAP to assess the effects of alternate wetting and drying (AWD) on the water use and resources in irrigated rice production in the Philippines. AWD is a water-saving technique that involves periodically drying the rice fields between irrigation events. They reported that the simulated AWD implementation during the dry season reduces water requirements while also increasing water availability in the irrigation system [18]. The studies by Olabanji et al. applied WEAP-MABIA to assess the potential increase in water demands in the Olifants catchment of South Africa based on climate change projections from the CORDEX regional climate models driven by six global climate models (GCMs) for two CMIP5 emission scenarios [17].
This study aims to build on this by integrating downscaled CMIP6 data, which have higher spatial and temporal resolution compared to CMIP5. Additionally, this integrated approach using the latest climate and socio-economic data based on CMIP6 may help capture the socio-economic influences on climate projections [21], providing a more holistic view of future water demand. Furthermore, this study includes the variation of two growing seasons across future periods, enhancing the temporal specificity and predictive accuracy of the assessment by considering both growing seasons to understand how different parts of the year may be affected by climate change.
This study represents a pioneering effort in understanding the irrigation water and crop water requirements of paddies in Brunei, as no previous studies have focused on this topic. This study utilises output from an ensemble of Coupled Model Intercomparison Project 6 (CMIP6) to depict climate change scenarios and their influence on crop water needs and irrigation water requirements (IWR) through the implementation of the MABIA module embedded in WEAP. CMIP6 is a project that coordinates climate model simulations of past, current, and future climates, which includes experiments and standards to help understand and predict climate changes [22]. This paper would like to address the following research questions: how do changes in temperature affect crop water requirements, and how does rainfall contribute to the fluctuations in irrigation water requirements for paddies? Additionally, this study seeks to gain some insights on implementing appropriate irrigation strategies based on the research outcomes.

2. Materials and Methods

2.1. Study Area

The climate in Brunei Darussalam is hot and humid, receiving an average rainfall of 3000 mm annually with a mean annual temperature of 28.7 °C. There are two distinct rainy periods that typically occur between the months of October and January, which are influenced by the northeast monsoon, and between May and July as a result of the southwest monsoon. These wet periods often coincide with the occurrence of two planting seasons for paddies.
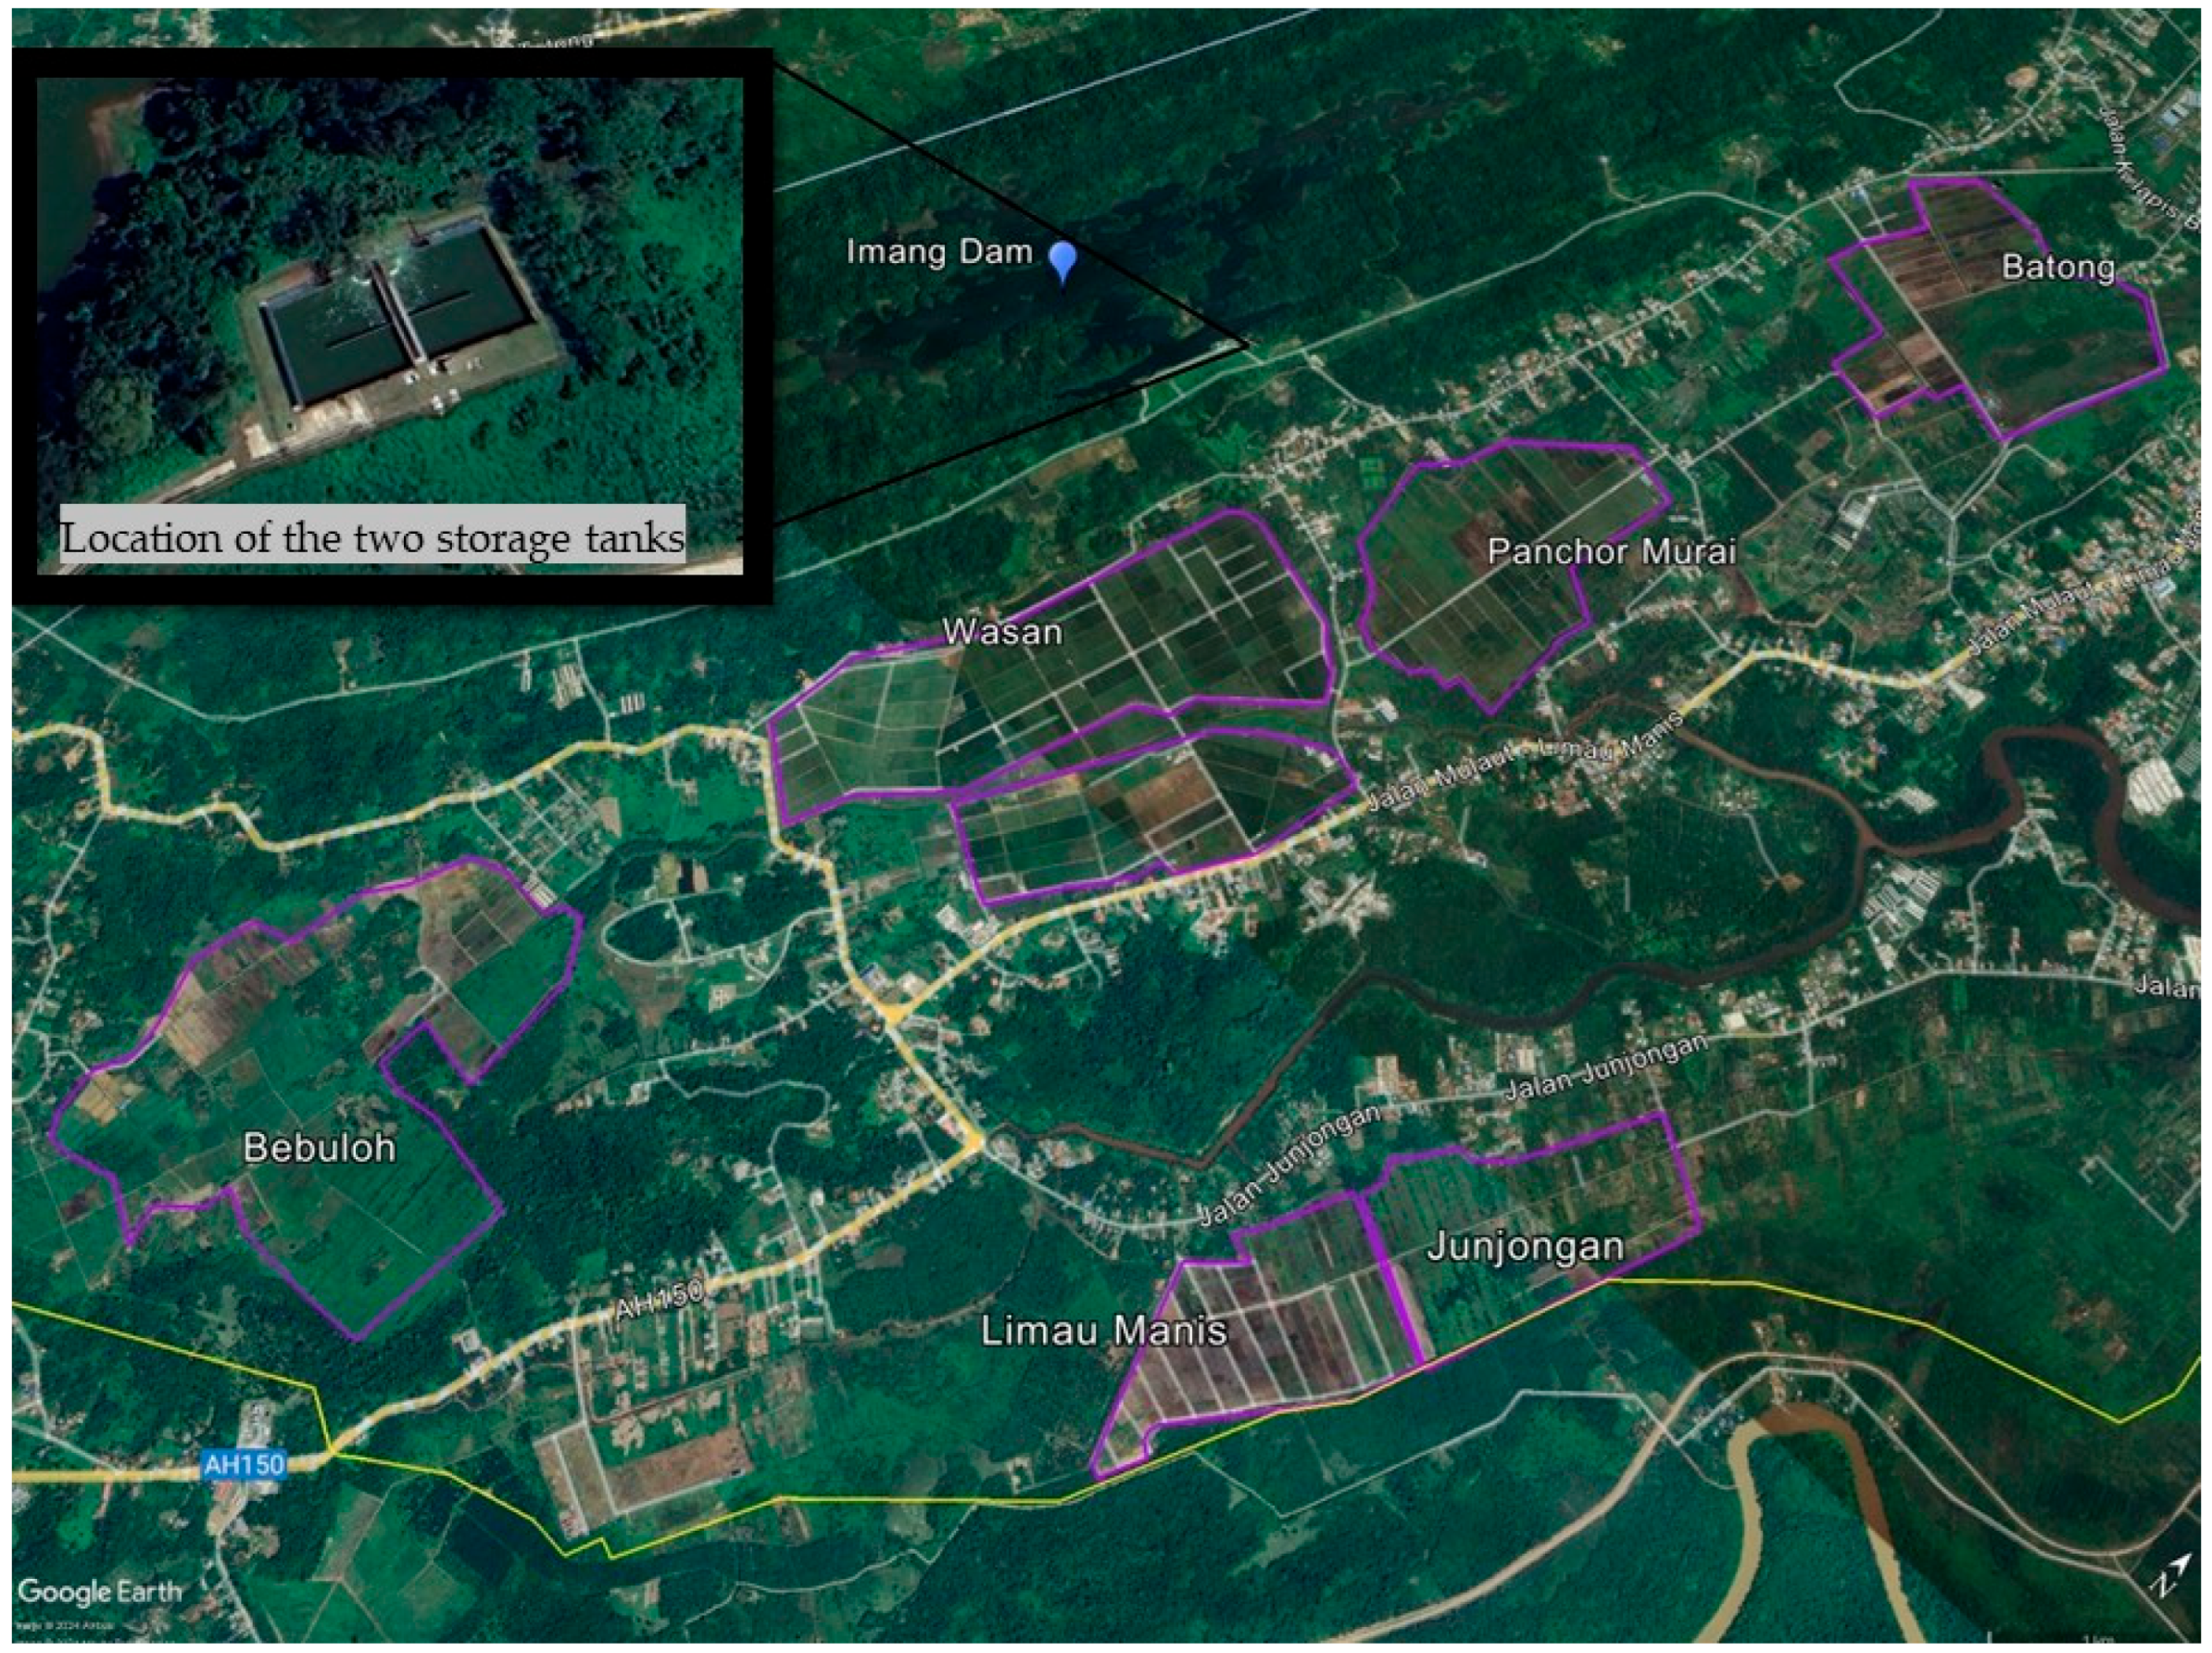
Figure 1 shows the paddy cultivation areas in the Brunei Muara district, comprising Panchor Murai, Batong, Bebuloh, Wasan A and B, Junjongan, and Limau-Manis, are collectively located at an approximate latitude of 4.78° N and a longitude of 114.71° E. Among these, Wasan, situated at approximately 4.80° N latitude and 114.65° E longitude, is the largest paddy field. Two storage tanks, each with a capacity of 5000 cubic metres, store 10,000 cubic metres of water from the Imang Dam, which is then discharged and piped to Wasan and other paddy fields [8]. The water requirement for paddies is estimated at 10 mm/day, and the daily demand is estimated at about 515.1 L/s (after a 50% reduction factor is applied to allow for natural rainfall and non-production areas). The farmers encounter difficulties with inefficient irrigation systems, causing uneven water distribution across paddy fields, particularly those situated far from water sources. Additionally, inadequate irrigation practices during dry seasons and the effects of climate change exacerbate water scarcity, hindering crop growth and yield.

2.2. Statistical Downscaling with Quantile Delta Mapping

The selection of the CMIP6 models in Table 1 was based on their availability under the r1i1p1f1 initial conditions at a daily time step, as well as their performance in a previous study on downscaling precipitation in Brunei by Rhymee et al. [2]. These models were chosen based on several criteria, including the inclusion of various parameters such as precipitation, maximum and minimum temperatures, availability at a daily time step, and the presence of both historical runs and future scenarios. These factors were considered essential for this research as a sub-model of climate change prediction [2]. In the case of Brunei, there was an absence of solar radiation data, and the CMIP6 General Circulation Models (GCMs) lack daily near-surface relative humidity, with previous studies commonly relying on the monthly dataset of relative humidity derived from CMIP6 [23,24]. Consequently, the objective of this investigation revolved around utilising daily rainfall and the maximum and minimum temperatures to downscale these climatic predictors. Multiple linear regression was employed by taking into account the relationship between the predictors from seven GCMs and the observed climatic parameters. Further information regarding the procedures and statistical equations developed for the calibration and validation of the statistical downscaling model can be found in Rhymee et al. [2]. The shared socioeconomic pathways (SSPs) SSP245, SSP370, and SSP585 were the CMIP6 scenarios selected for the MME, which are available online at https://esgf-node.ipsl.upmc.fr/search/cmip6-ipsl/ (accessed on 20 May 2022). The differences between these scenarios are primarily driven by their socioeconomic assumptions. These assumptions result in different amounts of greenhouse gas emissions and subsequent global warming. SSP245 and SSP370 anticipate a moderate implementation of climate protection measures, whereas SSP585 assumes a lack of strong climate protection measures. These differences in socioeconomic assumptions lead to different levels of global warming and other climate effects [21,25].
Climate models provide information about the changes in precipitation and maximum and minimum temperatures; however, their simulation exhibits a bias from the observed values. The downscaled data frequently display overestimations and underestimations in relation to the observed data. These errors originate from the bias present in the daily data of downscaled GCM data due to the reduced resolution of GCM data. Therefore, it is important to bias correct the climate models prior to applying them to impact studies. In this study, the bias correction of the MME of temperature and rainfall was conducted by applying quantile delta mapping (QDM). The implementation of QDM was performed in R-programming using R-package MBC (version 0.10-6) (https://cran.r-project.org/web/packages/MBC/index.html, accessed on 20 May 2022) [26]. QDM is a method in the field of quantile mapping (QM), which corrects the biases in climate model simulations by adjusting the distribution of model-simulated variables to match the observed distribution. QDM focuses on preserving the differences in quantiles between observed and projected data to accurately represent climate change signals [26,27]. In contrast, QM aims to match the distributions of historical and future data. Despite the effectiveness of QM in reducing bias, it has been noted to impact the projected trends of future models; therefore, Cannon et al. introduced the quantile delta mapping technique to address this issue [26]. In Canada, QDM has shown to be more precise in simulating daily maximum and minimum temperatures using CMIP6 models, as indicated by a lower Root Mean Square Error (RMSE) value of 0.5 compared to the Scaled Distribution Mapping (SDM) results [28].

2.3. WEAP-MABIA

The MABIA module is embedded in WEAP and is used to simulate daily irrigation requirements, crop growth, evaporation, and transpiration. The crop evapotranspiration (ETc), or simply crop water requirements, is calculated based on the dual crop coefficient approach in Equation (1). The dual crop coefficient consists of Ke, which accounts for evaporation from the surface beneath the crop canopy and considers both dry and wet soil surface conditions. On the other hand, the basal crop coefficient, Kcb, is used to calculate ETc when the soil surface is dry but still retains enough moisture for transpiration.
E T c = K e + K c b E T o .
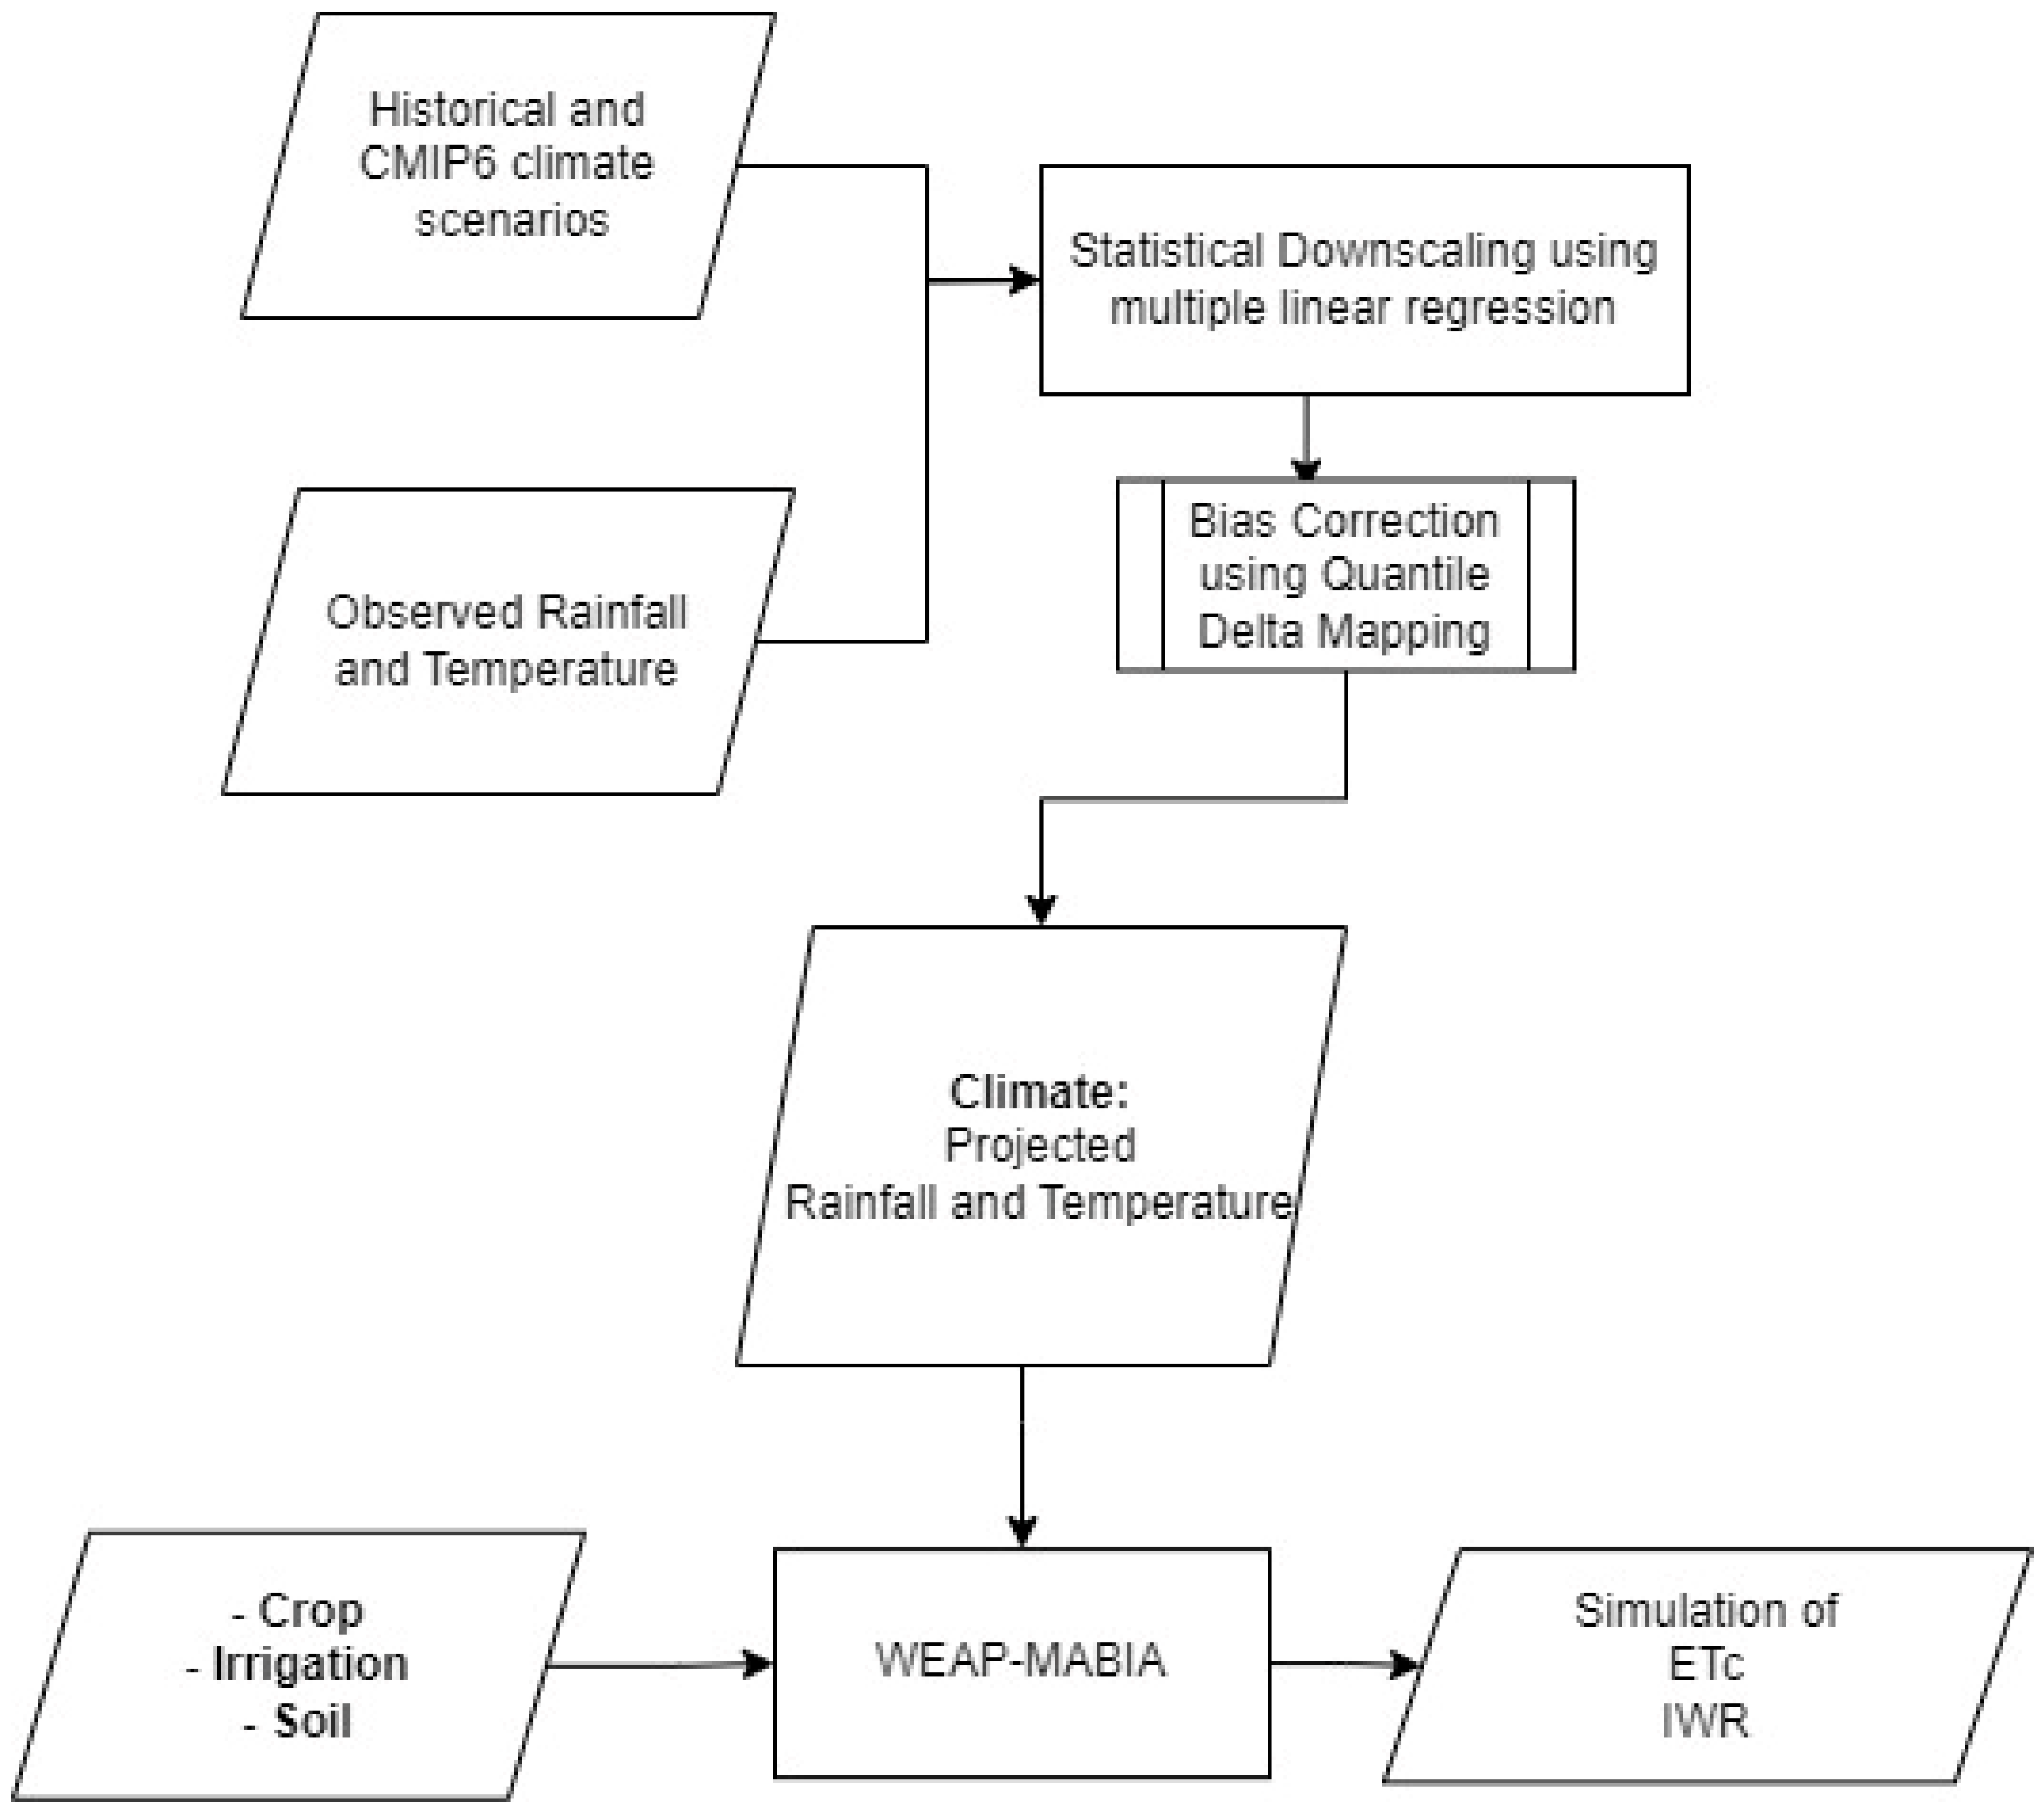
Reference evapotranspiration (ETo) represents the amount of water that evaporates from a reference surface. This reference surface is a theoretical grass reference crop, and it closely resembles a vast expanse of green, well-watered grass with a consistent height. It actively develops and gives total shade to the ground [29]. Estimating the ETo in WEAP necessitates the use of climatic factors including temperature, humidity, wind velocity, and solar radiation using the Penman–Monteith equation based on Allen et al.’s Crop evapotranspiration—Guidelines for Computing Crop Water Requirements—FAO Irrigation and Drainage Paper 56 [29]. However, given the limited data available, particularly the absence of solar radiation measurements, the Hargreaves method can be used to calculate the ETo using the minimum necessary data: the minimum and maximum temperature [30]. WEAP-MABIA enables the computation of ETo using different sets of data availability. This ranges from a limited dataset consisting solely of maximum and minimum temperatures to a comprehensive dataset that includes temperature, relative humidity, solar radiation, and wind speed. In this study, the use of downscaled projections of the minimum and maximum temperature was the minimum input requirement for estimating ETo. Other important inputs include daily rainfall, as well as crop characteristics, soil, and irrigation, which are required in WEAP-MABIA to quantify the irrigation water requirement based on the water balance in the soil. Figure 2 summarises the sequential steps involved in computing the ETc and IWR under climate change.

2.3.1. Climate

Daily historical and future climate data (i.e., rainfall and maximum and minimum temperatures) were used as the input to the WEAP model, in which the maximum and minimum temperatures were used for computing daily reference evapotranspiration (ETo) and rainfall was used for evaluating irrigation water needs. Historical climate data from 2004–2019 were obtained from the Brunei Meteorological Department, and the statistically downscaled climate data were driven by the CMIP6 outputs (2020–2100) under the three SSPs. The following future climate scenarios were considered in this study: the near future period (2020–2046), the mid future period (2047–2073), and the far future period (2074–2100).

2.3.2. Crop

Considering Brunei Wawasan 2035’s vision of self-reliance in food production, the crop of interest in this study is the nation’s staple food: paddy. The transplanting of rice is practiced, and it takes about 120 days to cultivate paddy rice in Brunei. The planting months are taken as November–January for the main season and May–August for the off season. Paddy yield records in Brunei Muara for both the main and off seasons spanning from 2005 to 2019 were obtained from the Department of Agriculture and Agrifood (DoAA). Other relevant crop parameters for rice were based on Allen et al. [29], which was built into the “crop library”. Table 2 provides the crop parameters specific to tropical rice that were used for this study.
The basal crop coefficients correspond to the initial, mid-stage, and end-stage as Kcb initial, Kcb mid-stage, and Kcb end-stage, respectively. These Kcb values are fundamental for calculating crop evapotranspiration.
The depletion factor refers to the portion of the total available water that can be drained from the root zone before moisture stress is triggered. The variation in crop sensitivity to water shortages differs across each crop stage.
The rooting depth is the depth of the roots in the soil profile. During early crop growth, roots maintain a constant depth, which indicates the minimum rooting depth. The root zone expands linearly until it reaches maximum depth.

2.3.3. Soil

As an alternative to entering data on water holding capacity values at field capacity and wilt point, water holding capacity refers to the ability of the soil to store water that is available for plant use. The MABIA method in WEAP allows for taking an average over multiple soil profiles (sampling sites) and soil horizons (layers) using the pedotransfer function (PTF). In this study, the average water holding capacity was based on two soil profiles with four soil horizons. Wasan possesses primarily clay soil that crackles, and it is characterised by its inherent low permeability and vulnerability to structural harm. This attribute proves advantageous for the growth of rice as it aids in diminishing drainage and upholding flood conditions [31,32]. And, in this study, a pedotransfer function based on particle size distribution was applied to determine the average soil capacity.

2.3.4. Irrigation

The irrigation practice in Brunei is surface irrigation, which requires continuous flooding throughout most of the growing period of 120 days. Rice is extremely sensitive to water shortages, particularly during the flowering stage, and it is essential to maintain flooding up until 7–10 days before harvest. The flooding is discontinued during this period to avoid increased disease risk, reduced air circulation, and potential damage to the ripe grains [33]. In WEAP-MABIA, the ponding depth can only occur if the soil root zone is fully saturated, and irrigation is only triggered when the ponding depth is below the target depth. As recommended by the International Rice Research Institute (IRRI) [33], standing water between 50 and 100 mm should be maintained, especially during the development stage. Once the ponding depth reaches the target depth, it will exceed its capacity, and any excess rainfall or irrigation will be discharged as runoff. Therefore, the irrigation water requirement (IWR) is estimated based on the decrease in surface storage.

3. Results

3.1. Projection of Climate Models

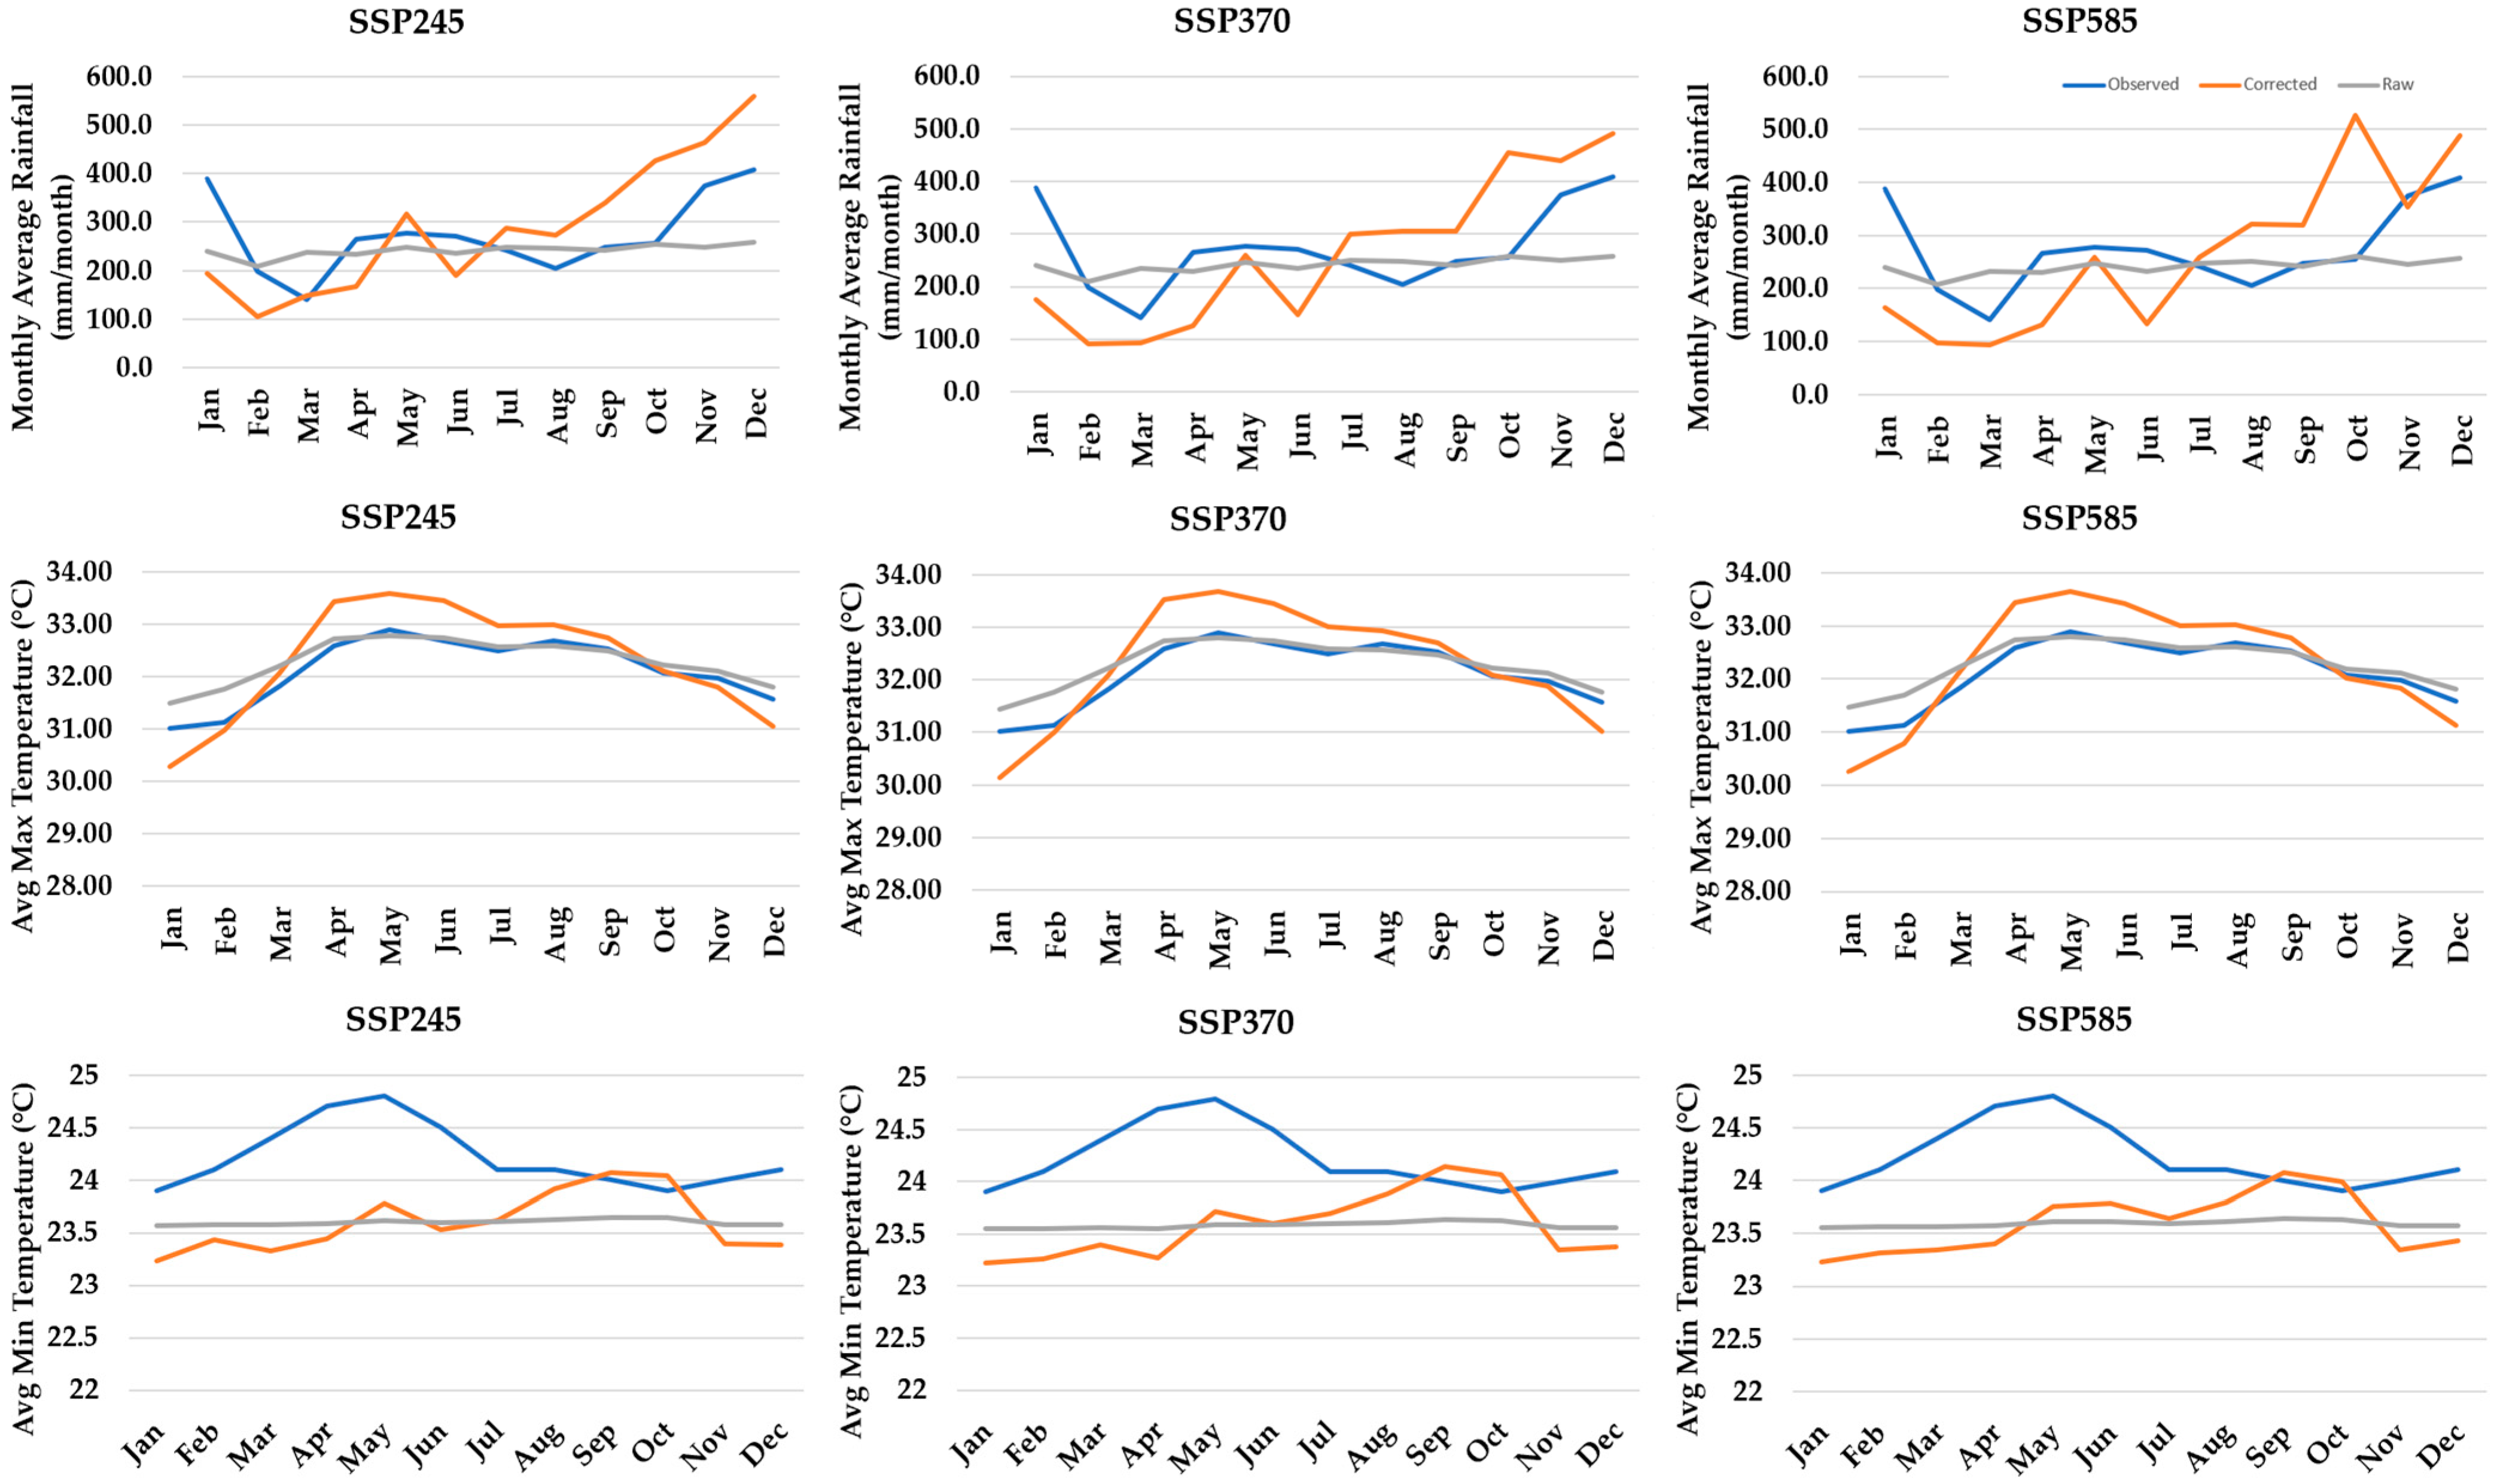
The statistically downscaled CMIP6 rainfall and temperature data were adjusted using quantile delta mapping. Figure 3 displays the bias-correction result, indicating that the ensemble monthly historical CMIP6, after bias adjustment, generally matched the observed precipitation and temperatures. Table 3 compares the overall performance of the raw and bias-corrected climate models relative to the observed time series during the validation period. The metrics used for assessing the models were the standard deviation (SD), mean, percent bias (PBias), and coefficient of determination (R2).
The SSP245 model demonstrates the best overall performance among the rainfall models, with an R2 value of 0.6, indicating a relatively strong ability to explain the variance in observed data. Its mean rainfall prediction of 289.5 mm is closest to the observed mean of 272.75 mm, and its PBias of +6.1% suggests a slight overestimation. However, an SD of 139.33 indicates that it overestimates the variability compared to the observed SD of 80.45. On the other hand, the raw SSP models show poor performance in terms of SD (around 13), which is significantly lower than the observed SD, reflecting their inability to capture the variability in rainfall data accurately. These models also have lower R2 values (0.4–0.44) and higher negative PBias (around −11.5%), indicating consistent underestimation.
For maximum temperature, the raw SSP models (SSP245, SSP370, and SSP585) exhibited excellent performance with R2 values of 0.97 to 0.98, indicating high accuracy in explaining the variance in observed data. These models have very low PBias (−0.005%), suggesting negligible bias, and their means (32.29 °C) are close to the observed mean (32.12 °C). However, their SDs in the raw model (around 0.43–0.45) were lower than the observed SD (0.63), indicating an underestimation of variability. The adjusted SSP models have higher SDs (around 1.09–1.13), which overestimate the observed variability but maintain the same high R2 and low PBias values, indicating accurate central tendency predictions.
The minimum temperature models generally perform poorly in terms of R2, with values ranging from −0.03 to −0.20, indicating a weak ability to explain the variance in the observed data. All models consistently underestimated the mean minimum temperature, with predicted means of 23.6 °C compared to the observed mean of 24.2 °C. The raw SSP models (SSP245, SSP370, and SSP585) have very low SDs (0.03), failing to capture the observed variability (SD = 0.31). Among the adjusted models, SSP245 and SSP585 had SDs of 0.29 and 0.28, respectively, which were closer to the observed SD, making them slightly better in terms of capturing variability. However, the PBias for all models was around +2.5%, indicating a consistent positive bias and overestimation.
Overall, the bias-corrected rainfall model improved compared to the raw model indicated by their R2 values and mean. There was a legible PBias for both the raw and adjusted maximum temperature, with both models exhibiting high R2. Although the minimum temperature of the raw and bias-corrected models generally performed poorly, the bias-corrected models showed closer SDs to the observed values. On the other hand, the raw models for minimum temperature lacked the ability to capture the observed variability based on their SD.
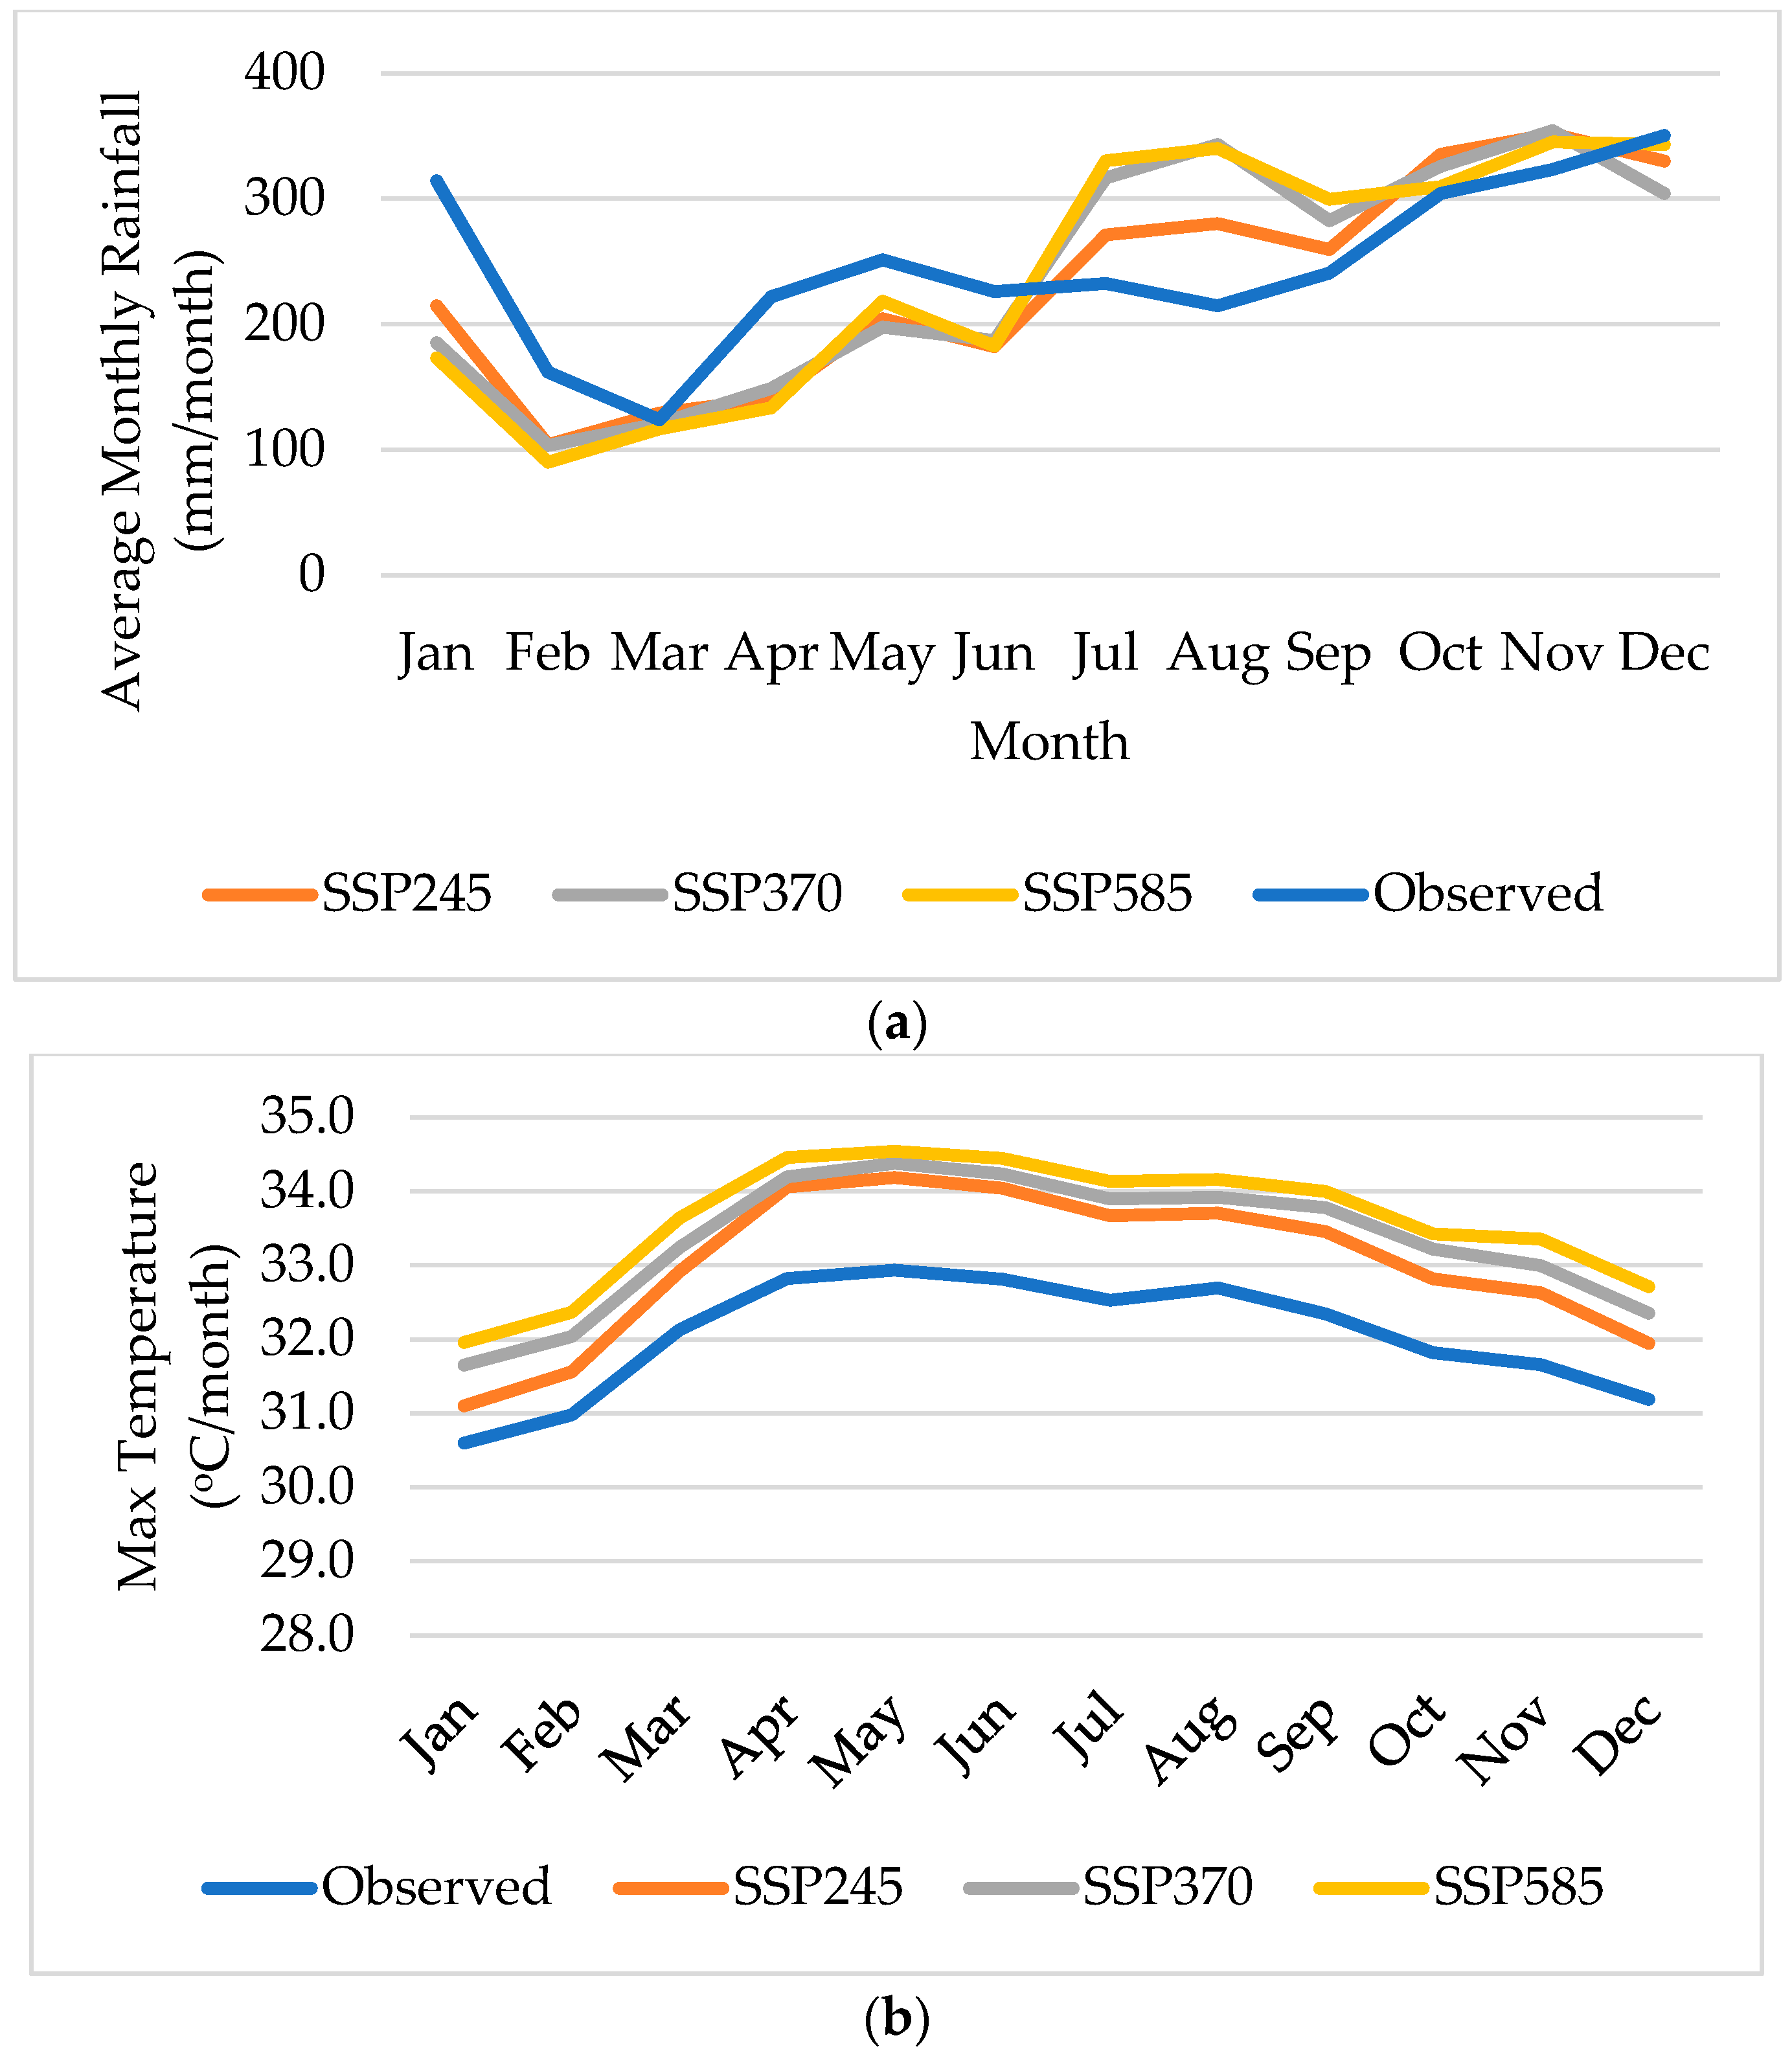
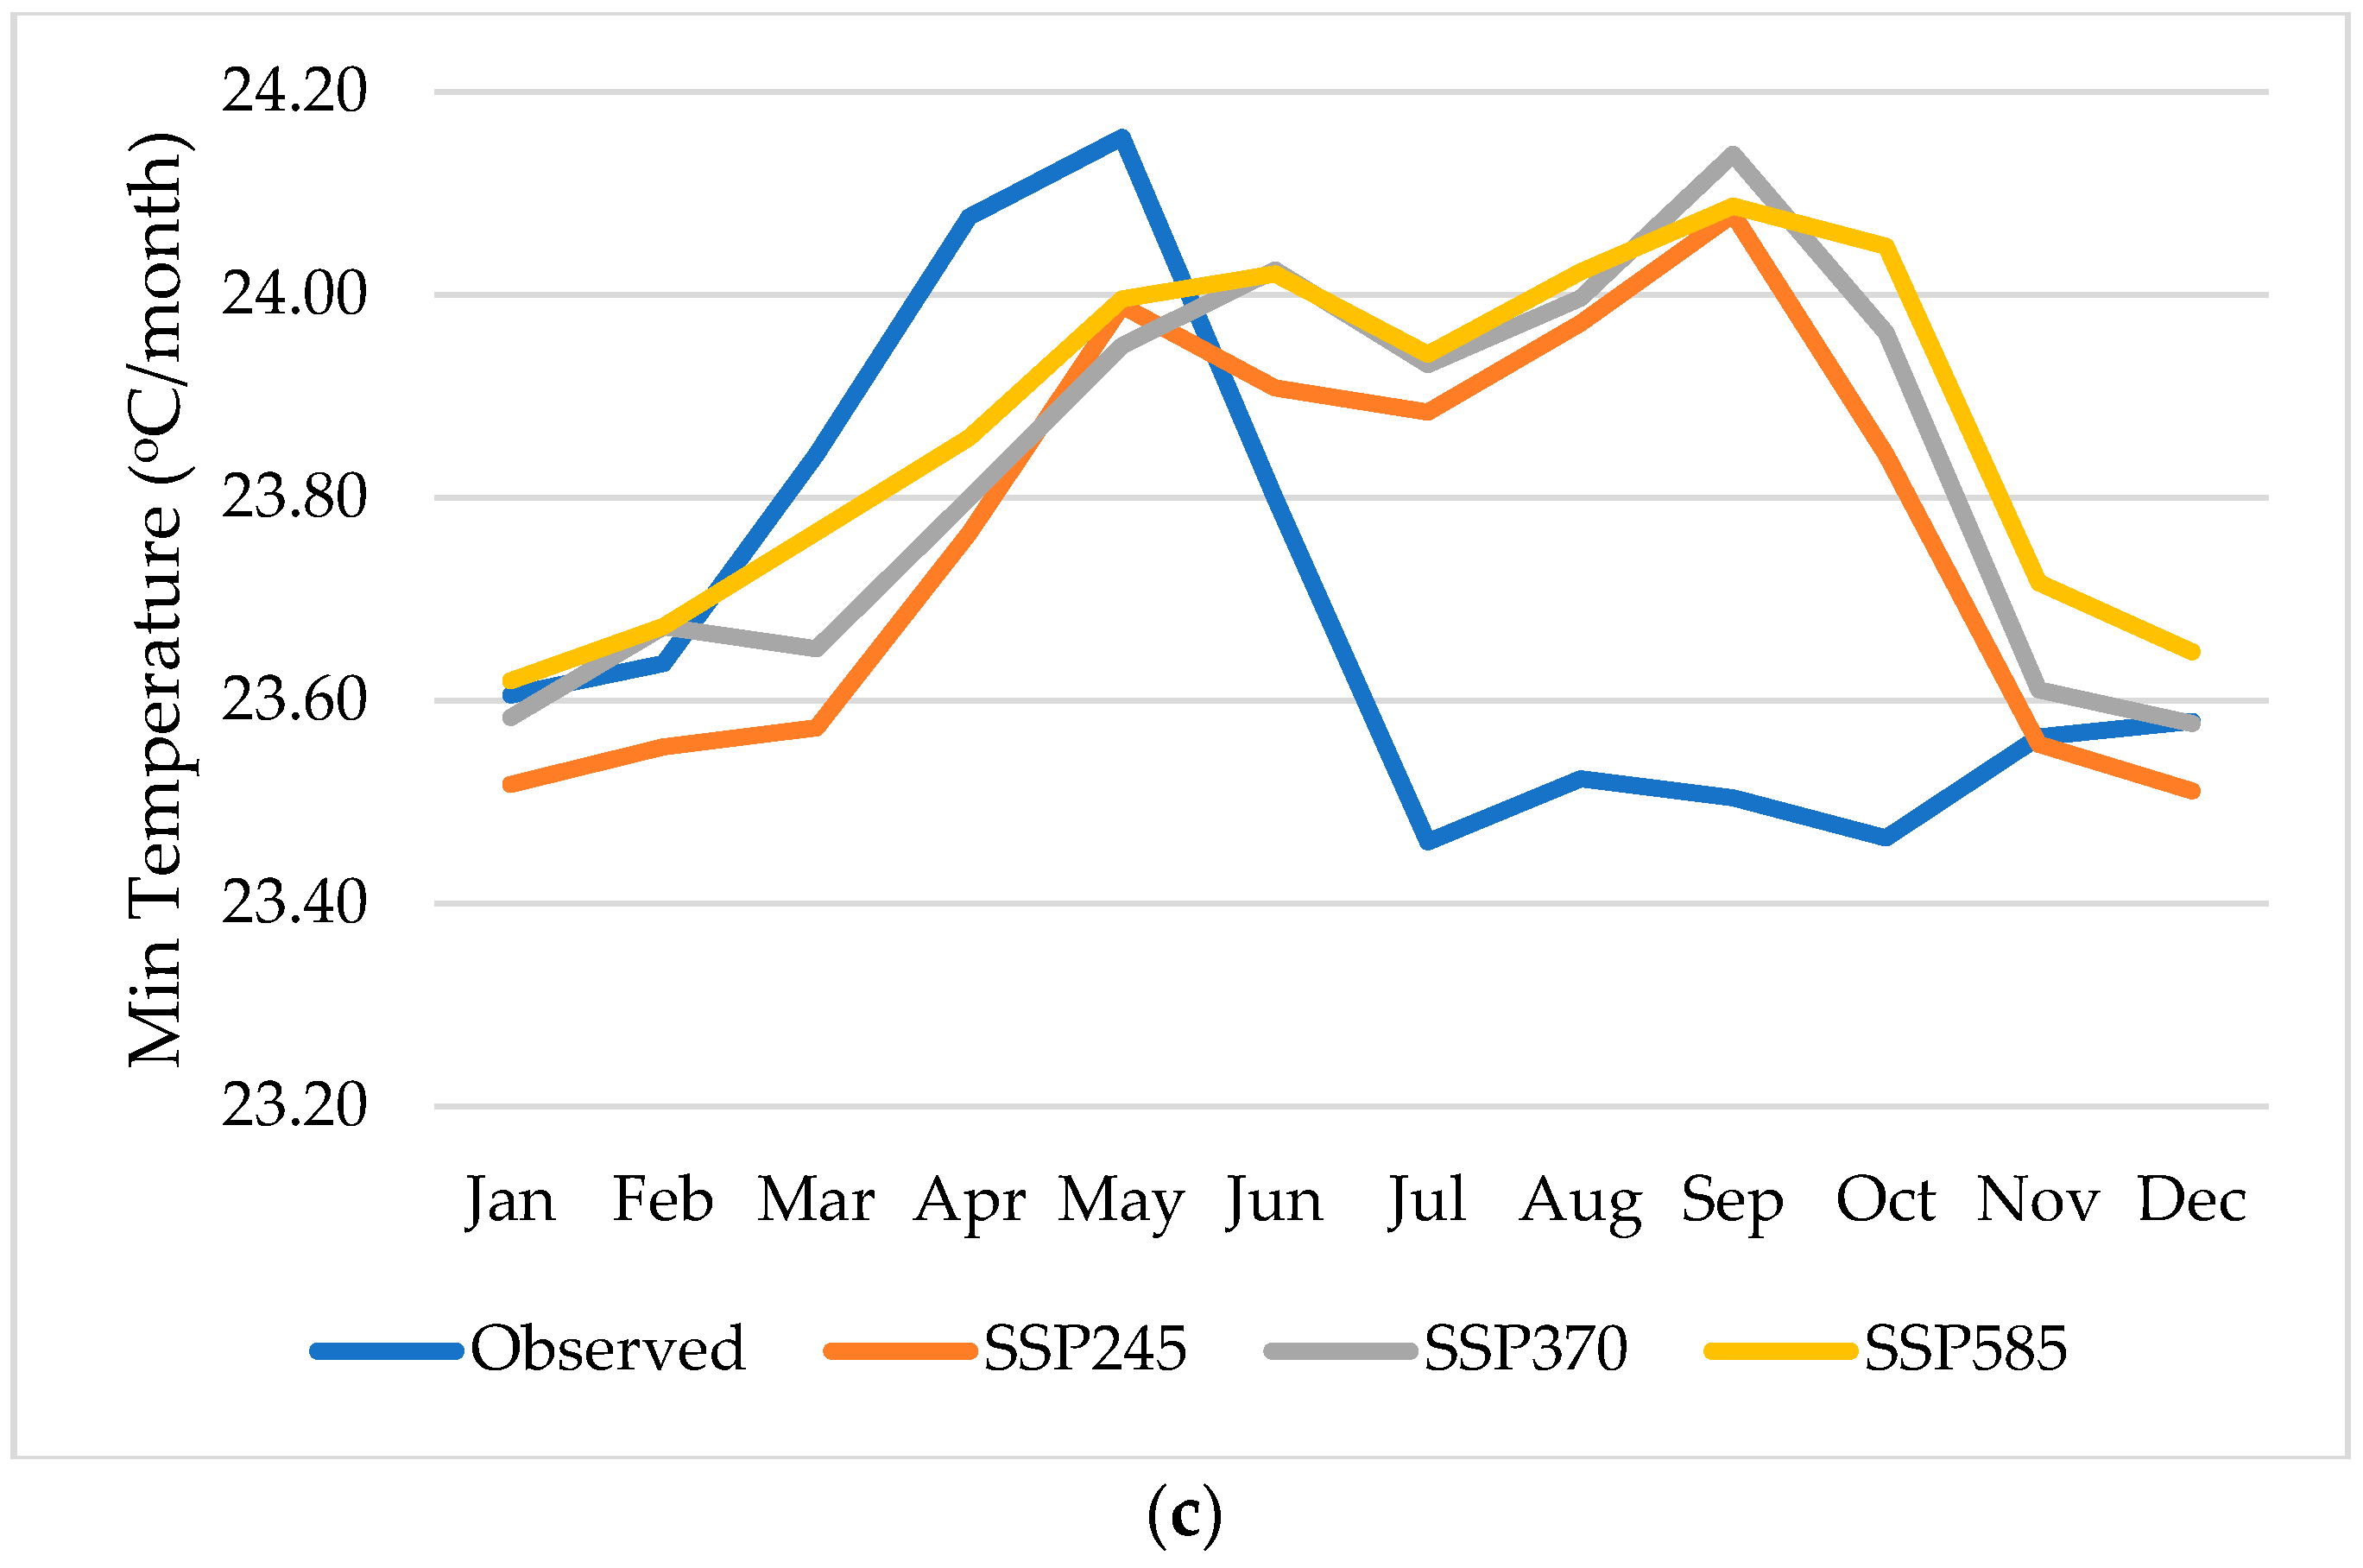
The projections of climate models (2020–2100) relative to the observed (1979–2019) are shown in Figure 4a–c. It can be seen in Figure 4a that significant changes in rainfall patterns can be found in the middle of the year, starting from July to November, where heavier rainfall is expected in the future. In contrast, the current wet month, January, might experience a decline in precipitation. A rising future maximum temperature is observed relative to the historical temperature (Figure 4b), with the average maximum temperature reaching 34 °C, especially between April and September, which overlaps with the off season. As in Figure 4c, the average minimum temperature will have more significant changes, where an increase in the average minimum temperature between 0.4 °C and 0.6 °C is seen starting from July to October under all scenarios, while the rest of the months it remains closer to that which was observed. Overall, a rise in both the average minimum and maximum temperatures is anticipated in the off season.

3.2. Annual Climate Scenarios for Main Season and off Season

The projected climate models were categorised into three future periods: near future (2020–2046), mid future (2047–2073), and far future (2074–20100). In Table 4, the main season receives average rainfall between 780 mm and 909 mm annually during the near future period, while the off season receives between 790 mm and 875 mm of rainfall per year. In the mid future period, the main season’s mean annual rainfall increases between 898 mm/year and 1031 mm/year, and the off season between 903 mm/year and 986 mm/year. The mean rainfall of the main season within the far future period is around 1000 mm/year on average under all SSPs, and the mean rainfall further increases up to 1439 mm/year, especially under SSP370 and SSP585, in the off season.
Table 5 shows that the mean annual maximum temperature during the near future period under the three scenarios is 30.9 °C, 20.8 °C, and 30.9 °C for SSP245, SSP370, and SSP585, respectively. In contrast, the off season has a mean annual temperature of 32.9 °C (SSP245) and 32.7 °C (SSP370 and SSP585). The mean annual temperature increases further by 1.0 °C, 1.4 °C, and 1.7 °C for the main season under SSP245, SSP370, and SSP585, respectively, and 1.1 °C, 1.2 °C, and 1.4 °C for the off season under SSP245, SSP370, and SSP585, respectively. In the far future period, the main season’s annual mean temperature increases by 0.7 °C (SSP245) to 1.8 °C (SSP585). The highest mean annual maximum temperature of the off season is predicted to increase by 2 °C under SSP585 in the mid future period, reaching up to 36.1 °C. Overall, these findings suggest that the main season will experience more pronounced temperature increases compared to the off season, with SSP585 showing the highest rise in both seasons.
Table 6 provides the average value of the annual minimum temperature expected during the near future time frame under three distinct scenarios, namely SSP245, SSP370, and SSP585. These scenarios yield mean temperatures of 22.8 °C, 22.7 °C, and 22.6 °C, respectively. Conversely, during the off season, the mean annual temperature amounts to 23.1 °C for SSP245 and 23.0 °C for SSP370 and SSP585. Furthermore, for the main season, the mean annual temperature rises by 0.9 °C, 0.9 °C, and 1.0 °C under SSP245, SSP370, and SSP585, respectively. Similarly, for the off season, the mean annual temperature increases by 1.0 °C, 0.9 °C, and 1.0 °C under SSP245, SSP370, and SSP585, respectively. In the far future period, the main season will experience an increase in the annual minimum temperatures, ranging from 24.2 °C (SSP245) to 24.7 °C (SSP585). Notably, the highest mean annual minimum temperature during the off season is projected to escalate by 1.2 °C under SSP585, commencing in the mid future period and ultimately reaching a maximum value of 26.7 °C.

3.3. Reference Evapotranspiration and Temperatures

Table 7 below shows the changes in the average reference evapotranspiration (ETo) for the three future periods for both growing periods. The off season has a higher ETo compared to the main season. The difference in ETo values between the two seasons is attributed to their minimum and maximum temperatures, where both temperatures in the off season are greater than the temperatures in the main season. In general, both the main and off season are showing an increasing trend in average ETo along with an increasing pattern in maximum and minimum temperatures over time. Based on this finding, it is anticipated that future crop water requirements will rise in response to an increase in ETc.

3.4. Crop Water Requirements and Excess Rainfall

Table 8 (Table S1, Supplementary Materials) displays the crop water requirement as crop evapotranspiration (ETc) values. Overall, the average ETc in the off season is greater in comparison to the main season for all future periods. The highest seasonal crop water requirement is found during the off season of the far-future period, ranging from 773 mm to 798 mm under SSP245 and SSP585, respectively. This is due to the higher ETc values. These higher ETc values during the off season of the far-future period can be attributed to the increased temperatures occurring between May and August, leading to higher evaporation rates and greater water demand by the crops. Additionally, the higher temperatures during this period may also result in increased crop stress and a greater need for irrigation to meet the water requirements. Similarly, a study being implemented in the Tanjung Karang Rice Irrigation Project in Malaysia also found that the ETc is lower in the wet main season than in the dry off season due to future rising temperatures [34]. Another finding in Indonesia revealed that the ETc for paddy rice is expected to increase due to the higher temperatures; consequently, crop water requirements will increase in the future [11].
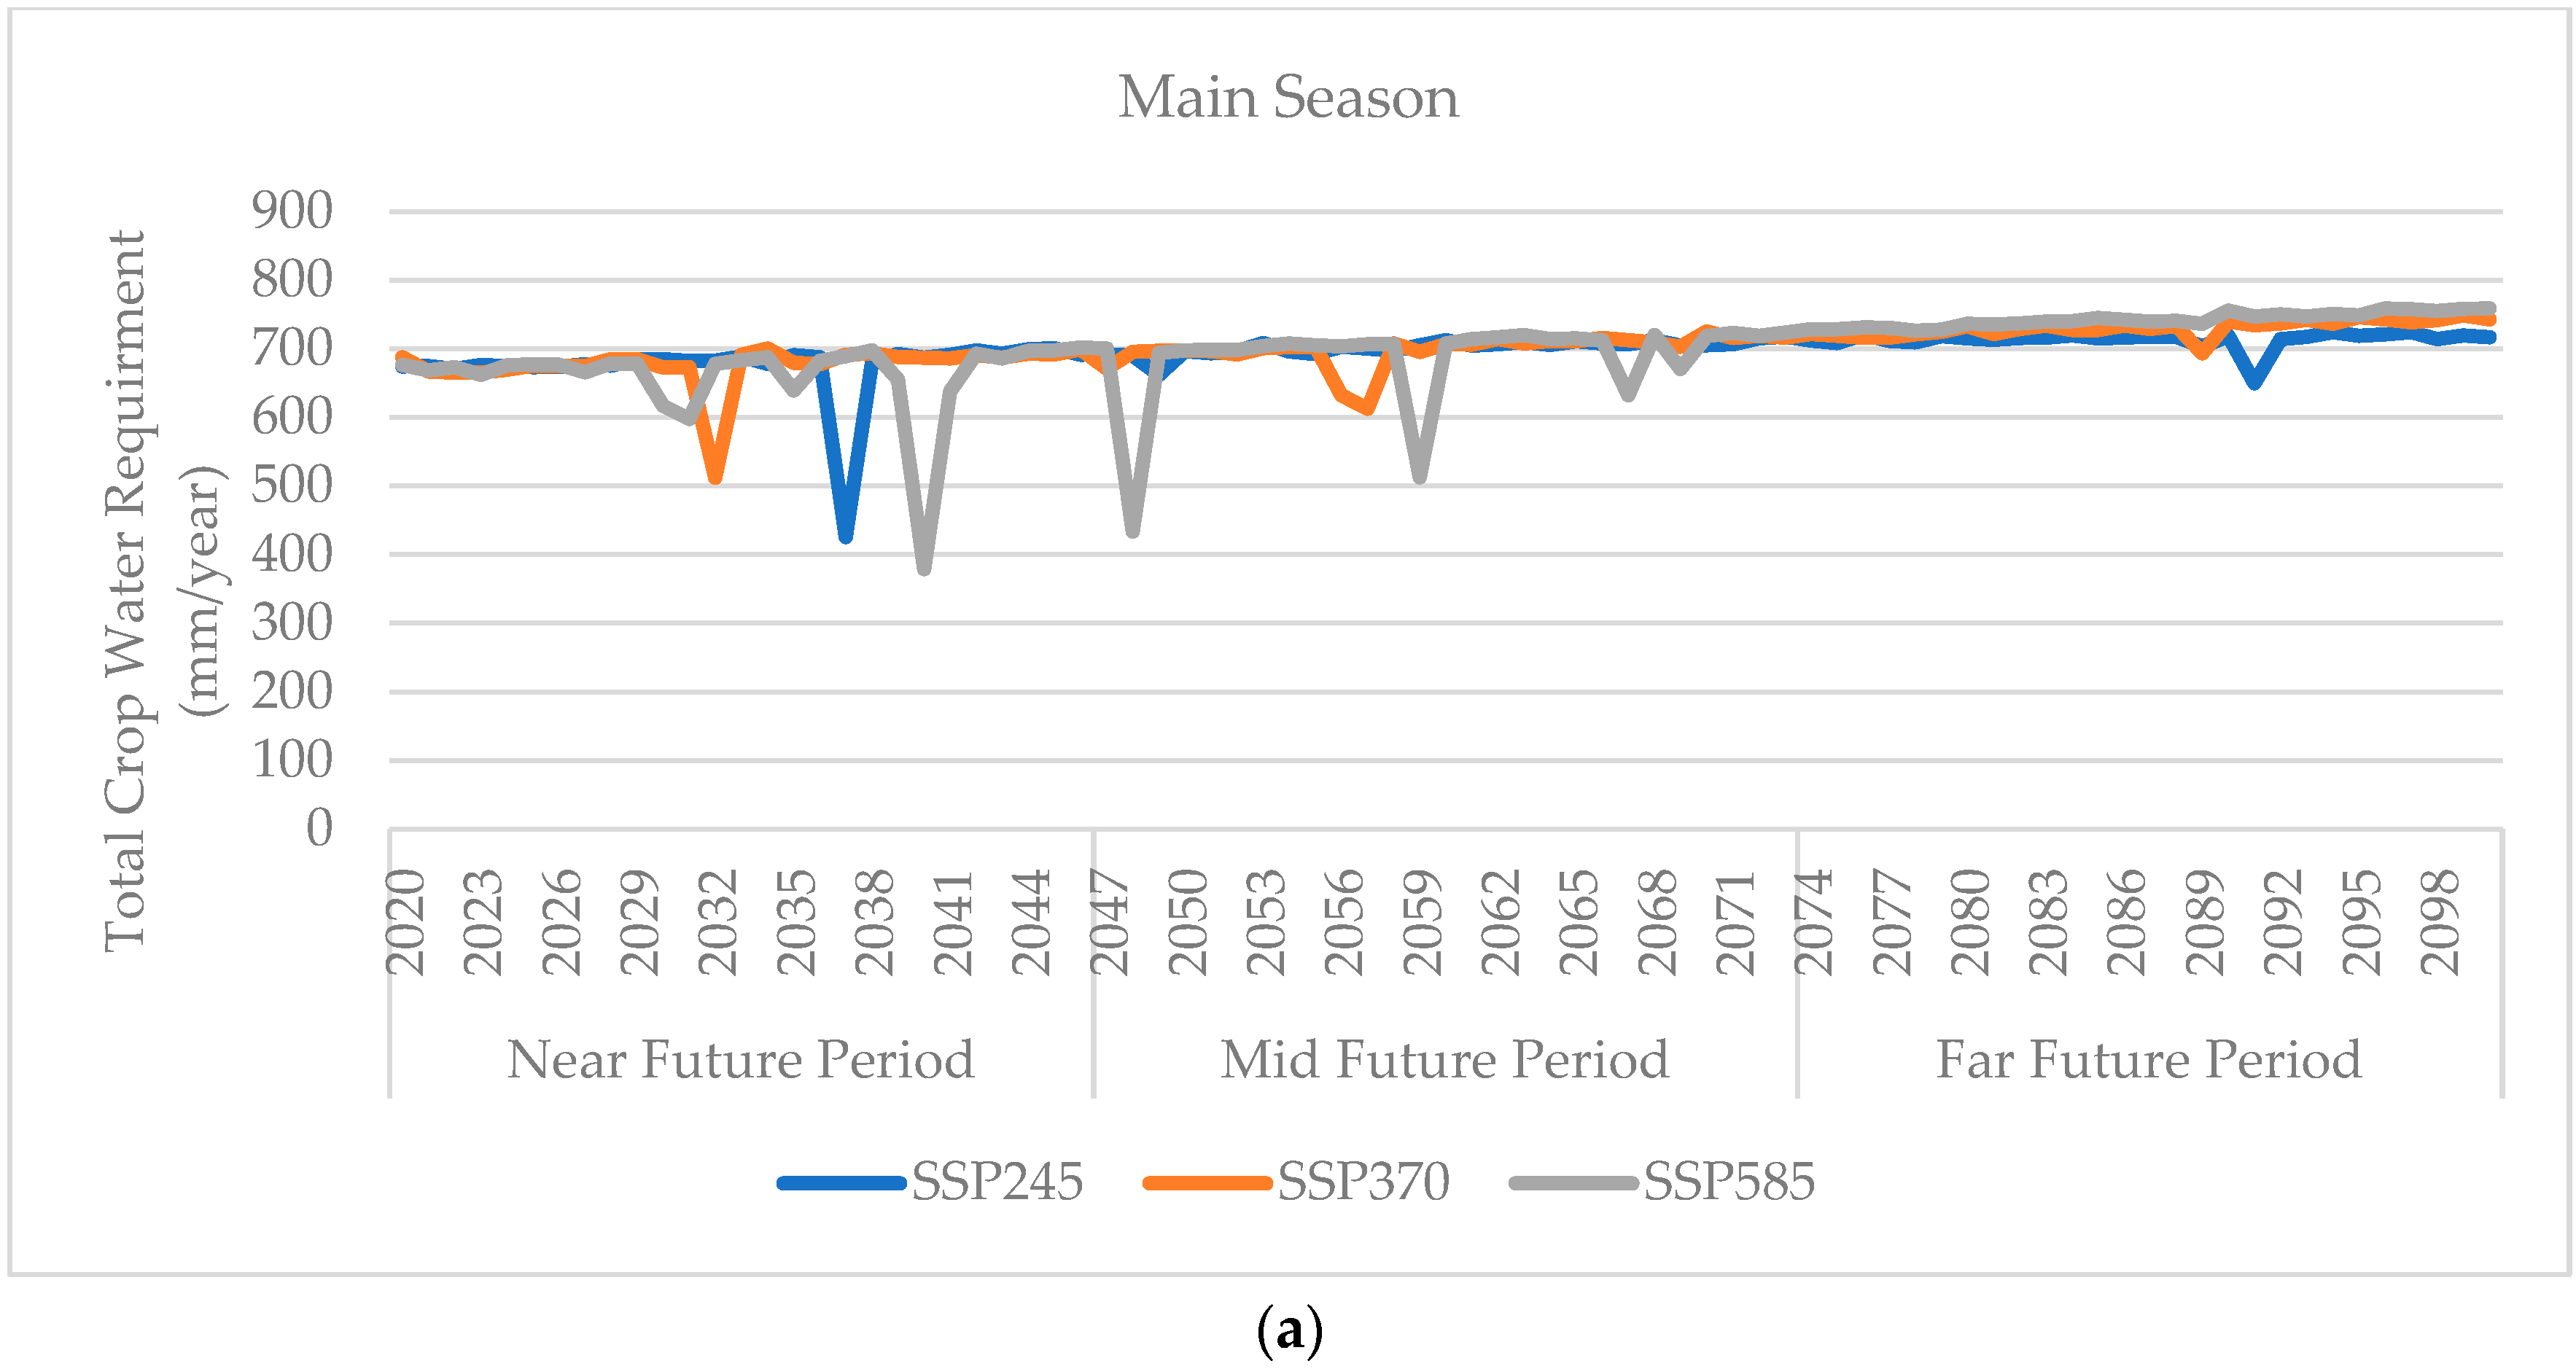
Figure 5 shows the total crop water requirement annually for (a) the main season and (b) the off season. The lowest total crop water requirement for the main season is 513 mm/year in 2032 under SSP245, 426 mm/year under SSP370, as well as 379 mm/year, 433 mm/year, and 513 mm/year in the 2040, 2048, and 2059, respectively, under SSP585. As for the off season, the total crop water requirement shows more frequent variation than the main season. The total crop water requirement of the off season has more variation than the main season, especially during the mid future period under SSP245 and SSP370. This variation is mostly a reduction in the crop water requirements, reaching a minimum of below 600 mm/year (as low as 392 mm/year in the near future).
The percentage of excess rainfall compared to average rainfall is presented in Table 9 (Table S2, Supplementary Materials). This ratio explains the portion of rainfall falling on paddy fields that is unavailable for crop production in terms of ETc consumption, as it will be part of the runoff and other losses. For both the main and off seasons, the excess rainfall of the near future period has a smaller ratio, ranging from 13% to 26% (main season) and from 12% to 17% (off season). The smaller ratio indicates that more rainfall is consumed to meet ETc, thus lowering the irrigation requirement. An increase in the ratio change for the mid and far future periods was seen, with a maximum ratio that reaches up to 35% and 45% for the main season and off season, respectively.

3.5. Irrigation Water Requirements under Climate Scenarios

The average irrigation water requirement for both the main and off seasons is summarised in Table 10 (Table S3, Supplementary Materials). A lower average ETc combined with heavier rainfall during the main season (Figure 4a) may have led to a higher excess rainfall ratio, which is consequently reflected in the lower IWR for the main season in Table 10. The average IWR increases across the three future periods under SSP370 and SSP585, except for SSP245, where the IWR will decrease slightly towards the far future. Lower rainfall and higher temperatures in the early growing stage (May to June) of the off season, as seen in Figure 4b, cause the higher IWR amount in the off season. This finding coincides with the study by Rowshan et al., in which they revealed that the IWR in Malaysia is higher during the off season (January–June) but less during the main season (July–December) due to the major contribution from the rainfall in the main season [34].
Despite the higher amount of IWR for the off season, a declining trend was observed in the changes in the future IWR over the baseline period (in the parentheses) presented in Table 10. A potential rise in the future IWR during the main season is anticipated at 43%, 37%, and 31% for the near future period under SSP245, SSP370, and SSP585, respectively. On the other hand, the off season’s future IWR has a much smaller difference with the baseline IWR, and there will be a reduction in future IWR by 8% and 5% in the far future under SS370 and SSP585, respectively. This reduction might be attributed to the abundance of rainfall at the end of the 21st century.
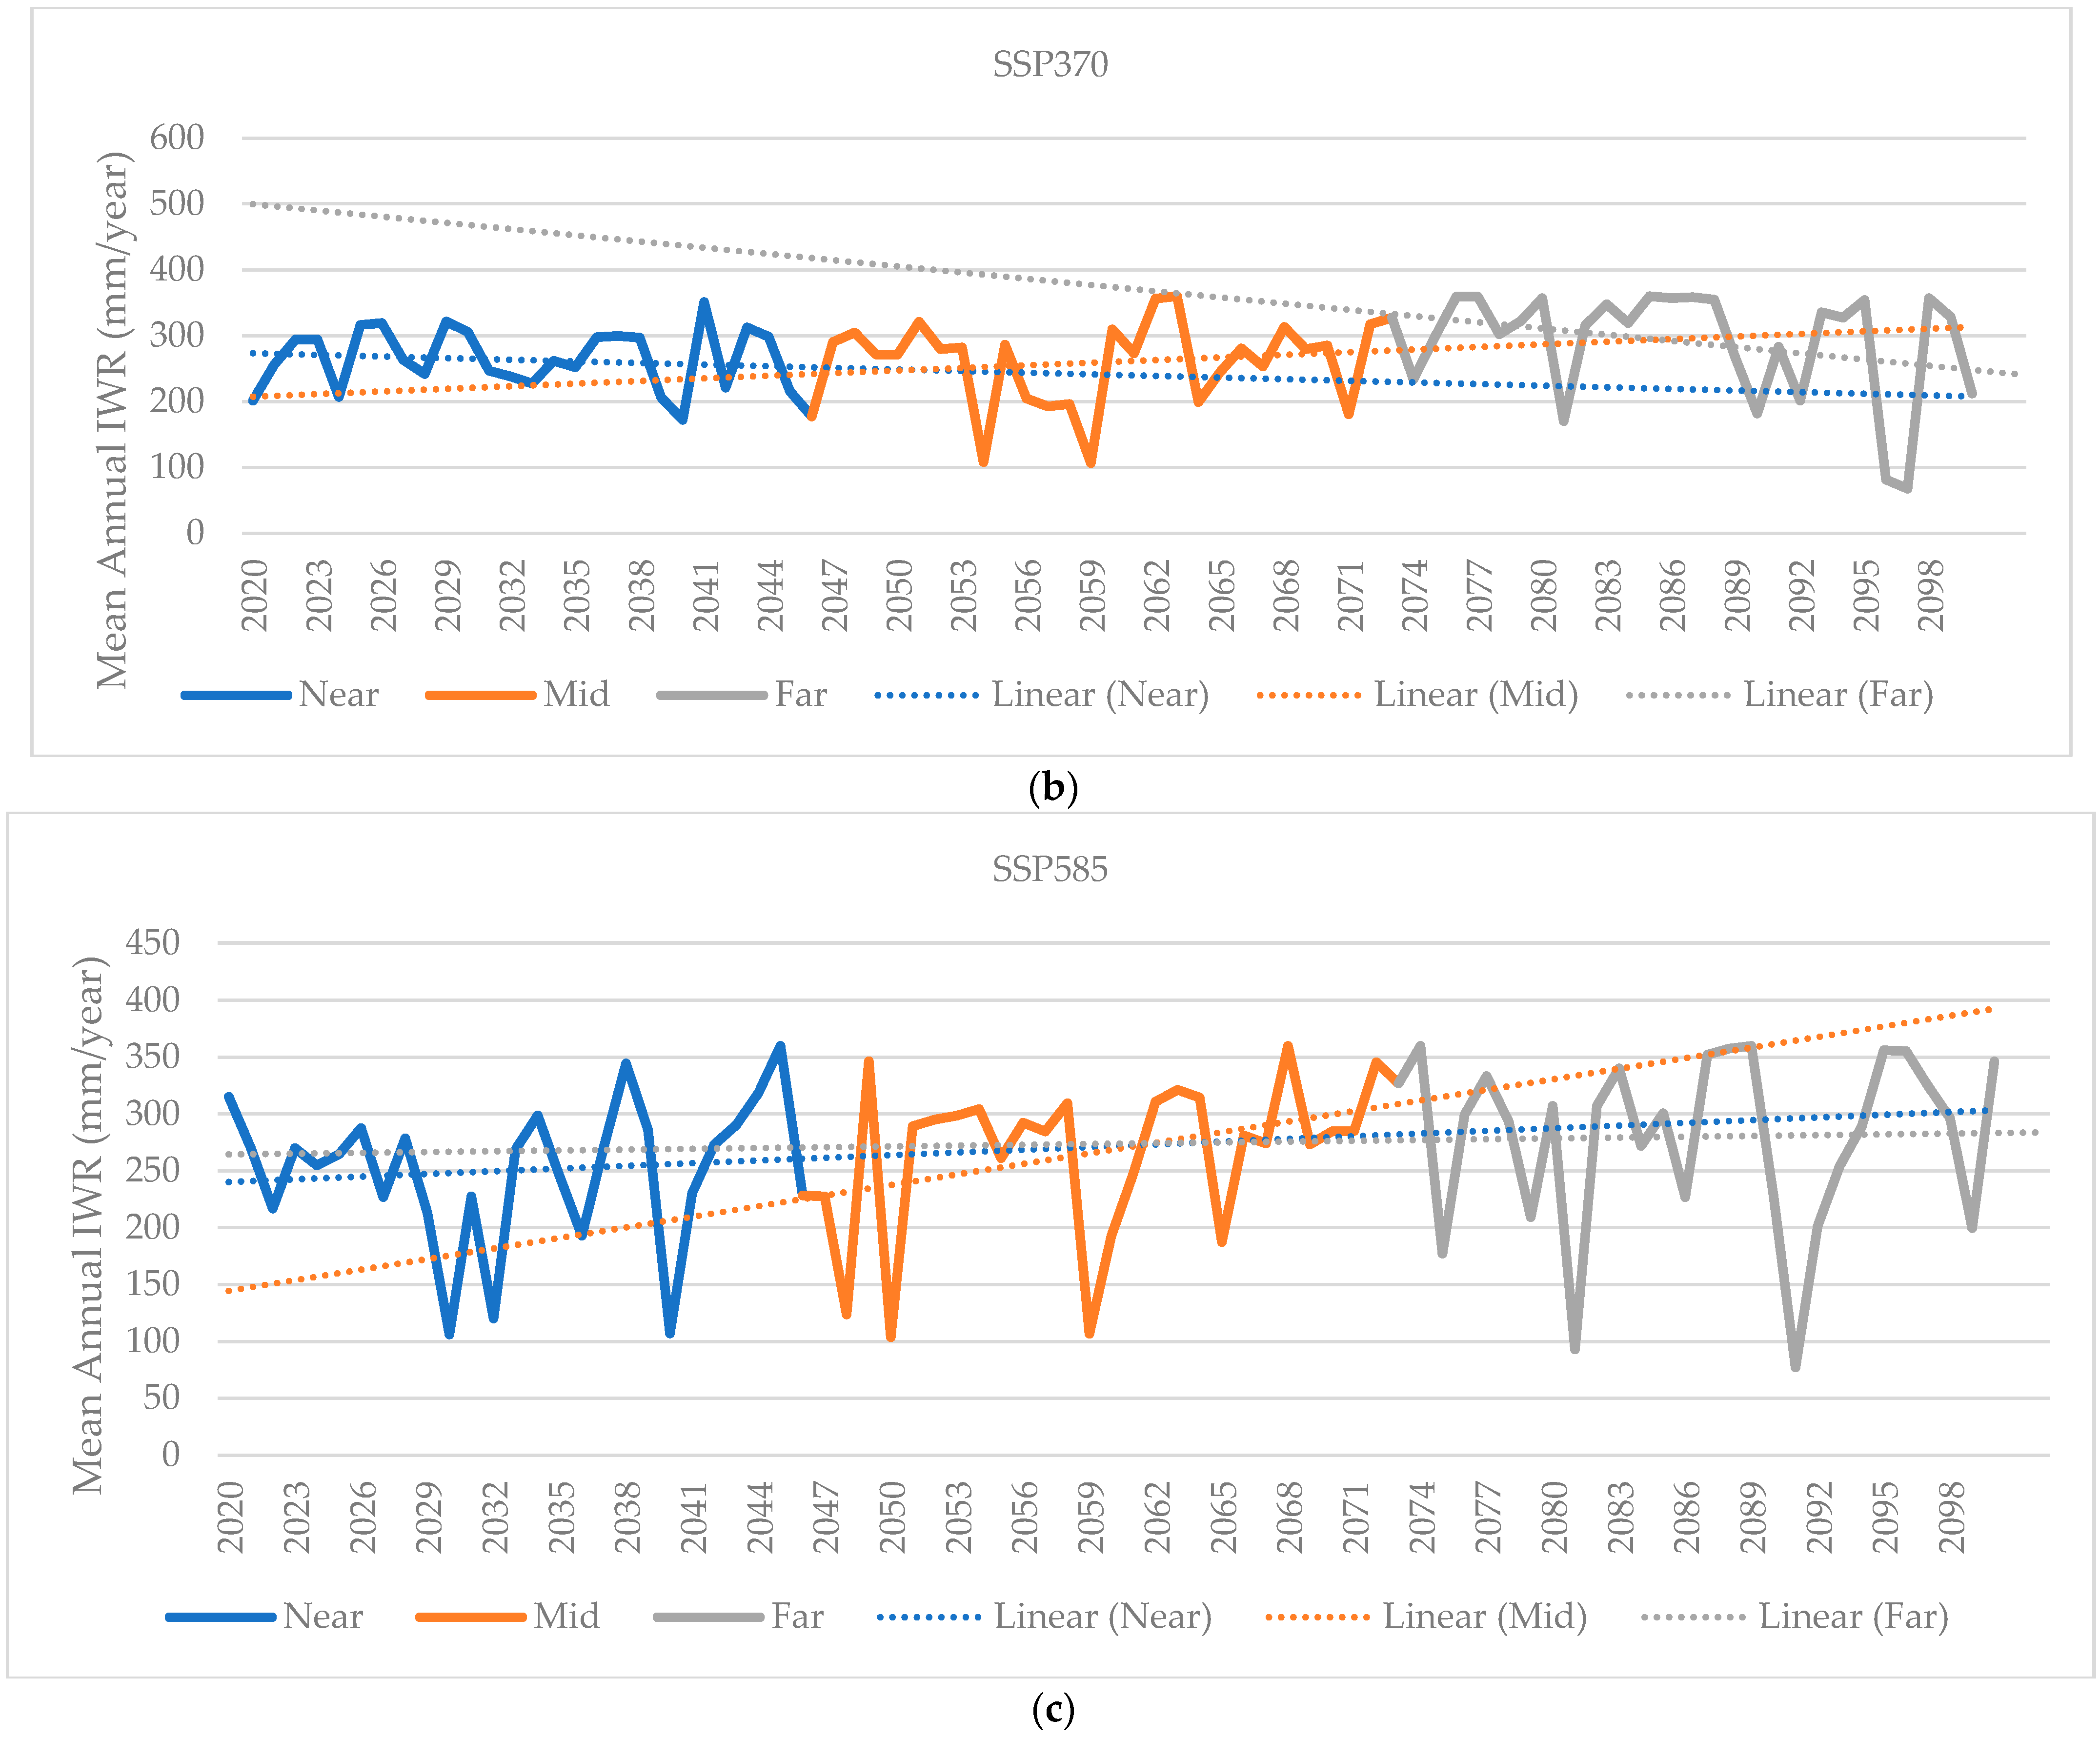
Figure 6a,b presents the annual trend of the predicted mean irrigation water requirement for the main season throughout the near future, mid future, and far future periods. Under the SSP245 scenario, an upward yearly trend is observed for the near and mid future periods, but the annual mean IWR has a declining trend within the far future period. The mean annual IWR under SSP370 started off with a steady trend during the near future period, and the annual trend of IWR increases in the mid future but decreases towards the end of the century. The annual mean IWR of the main season under SSP585 shows an increasing trend under SSP245 and SSP370. A steady trend in IWR during the far future period is observed, possibly due to the higher average rainfall under SSP585 and the therefore more excess rainfall to compensate for evapotranspiration. This could lead to potential waterlogging and increased runoff.
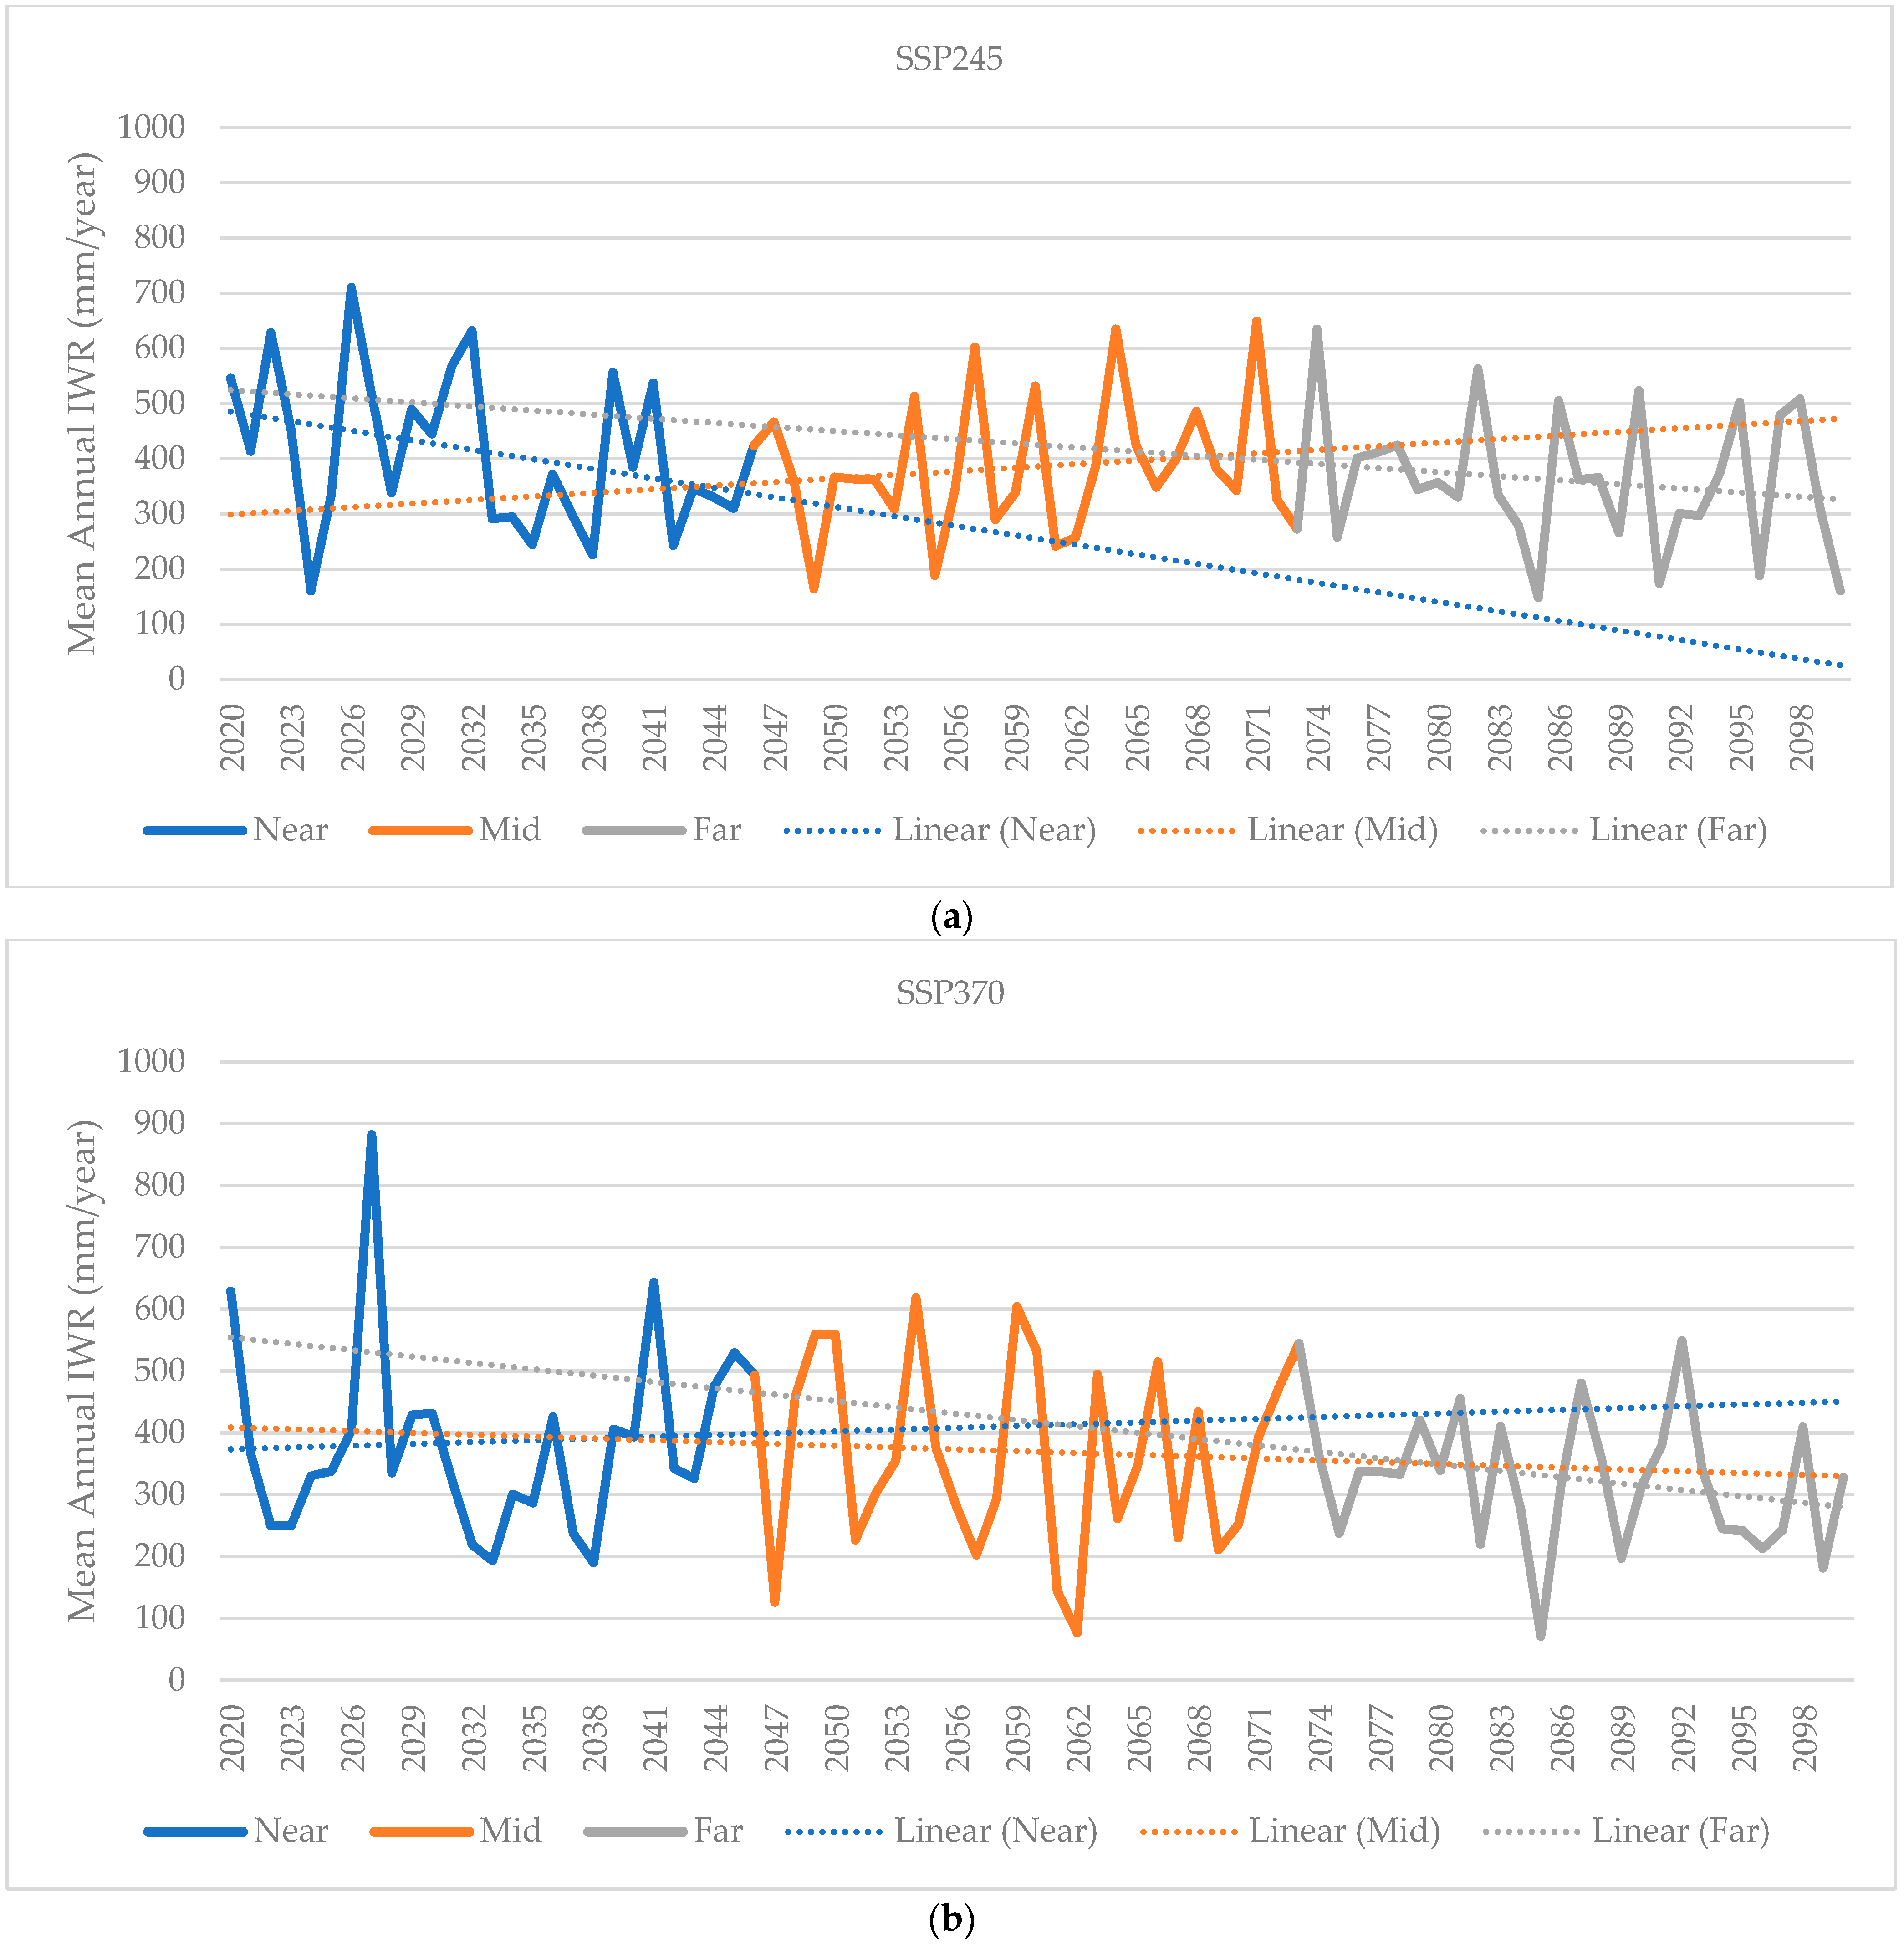
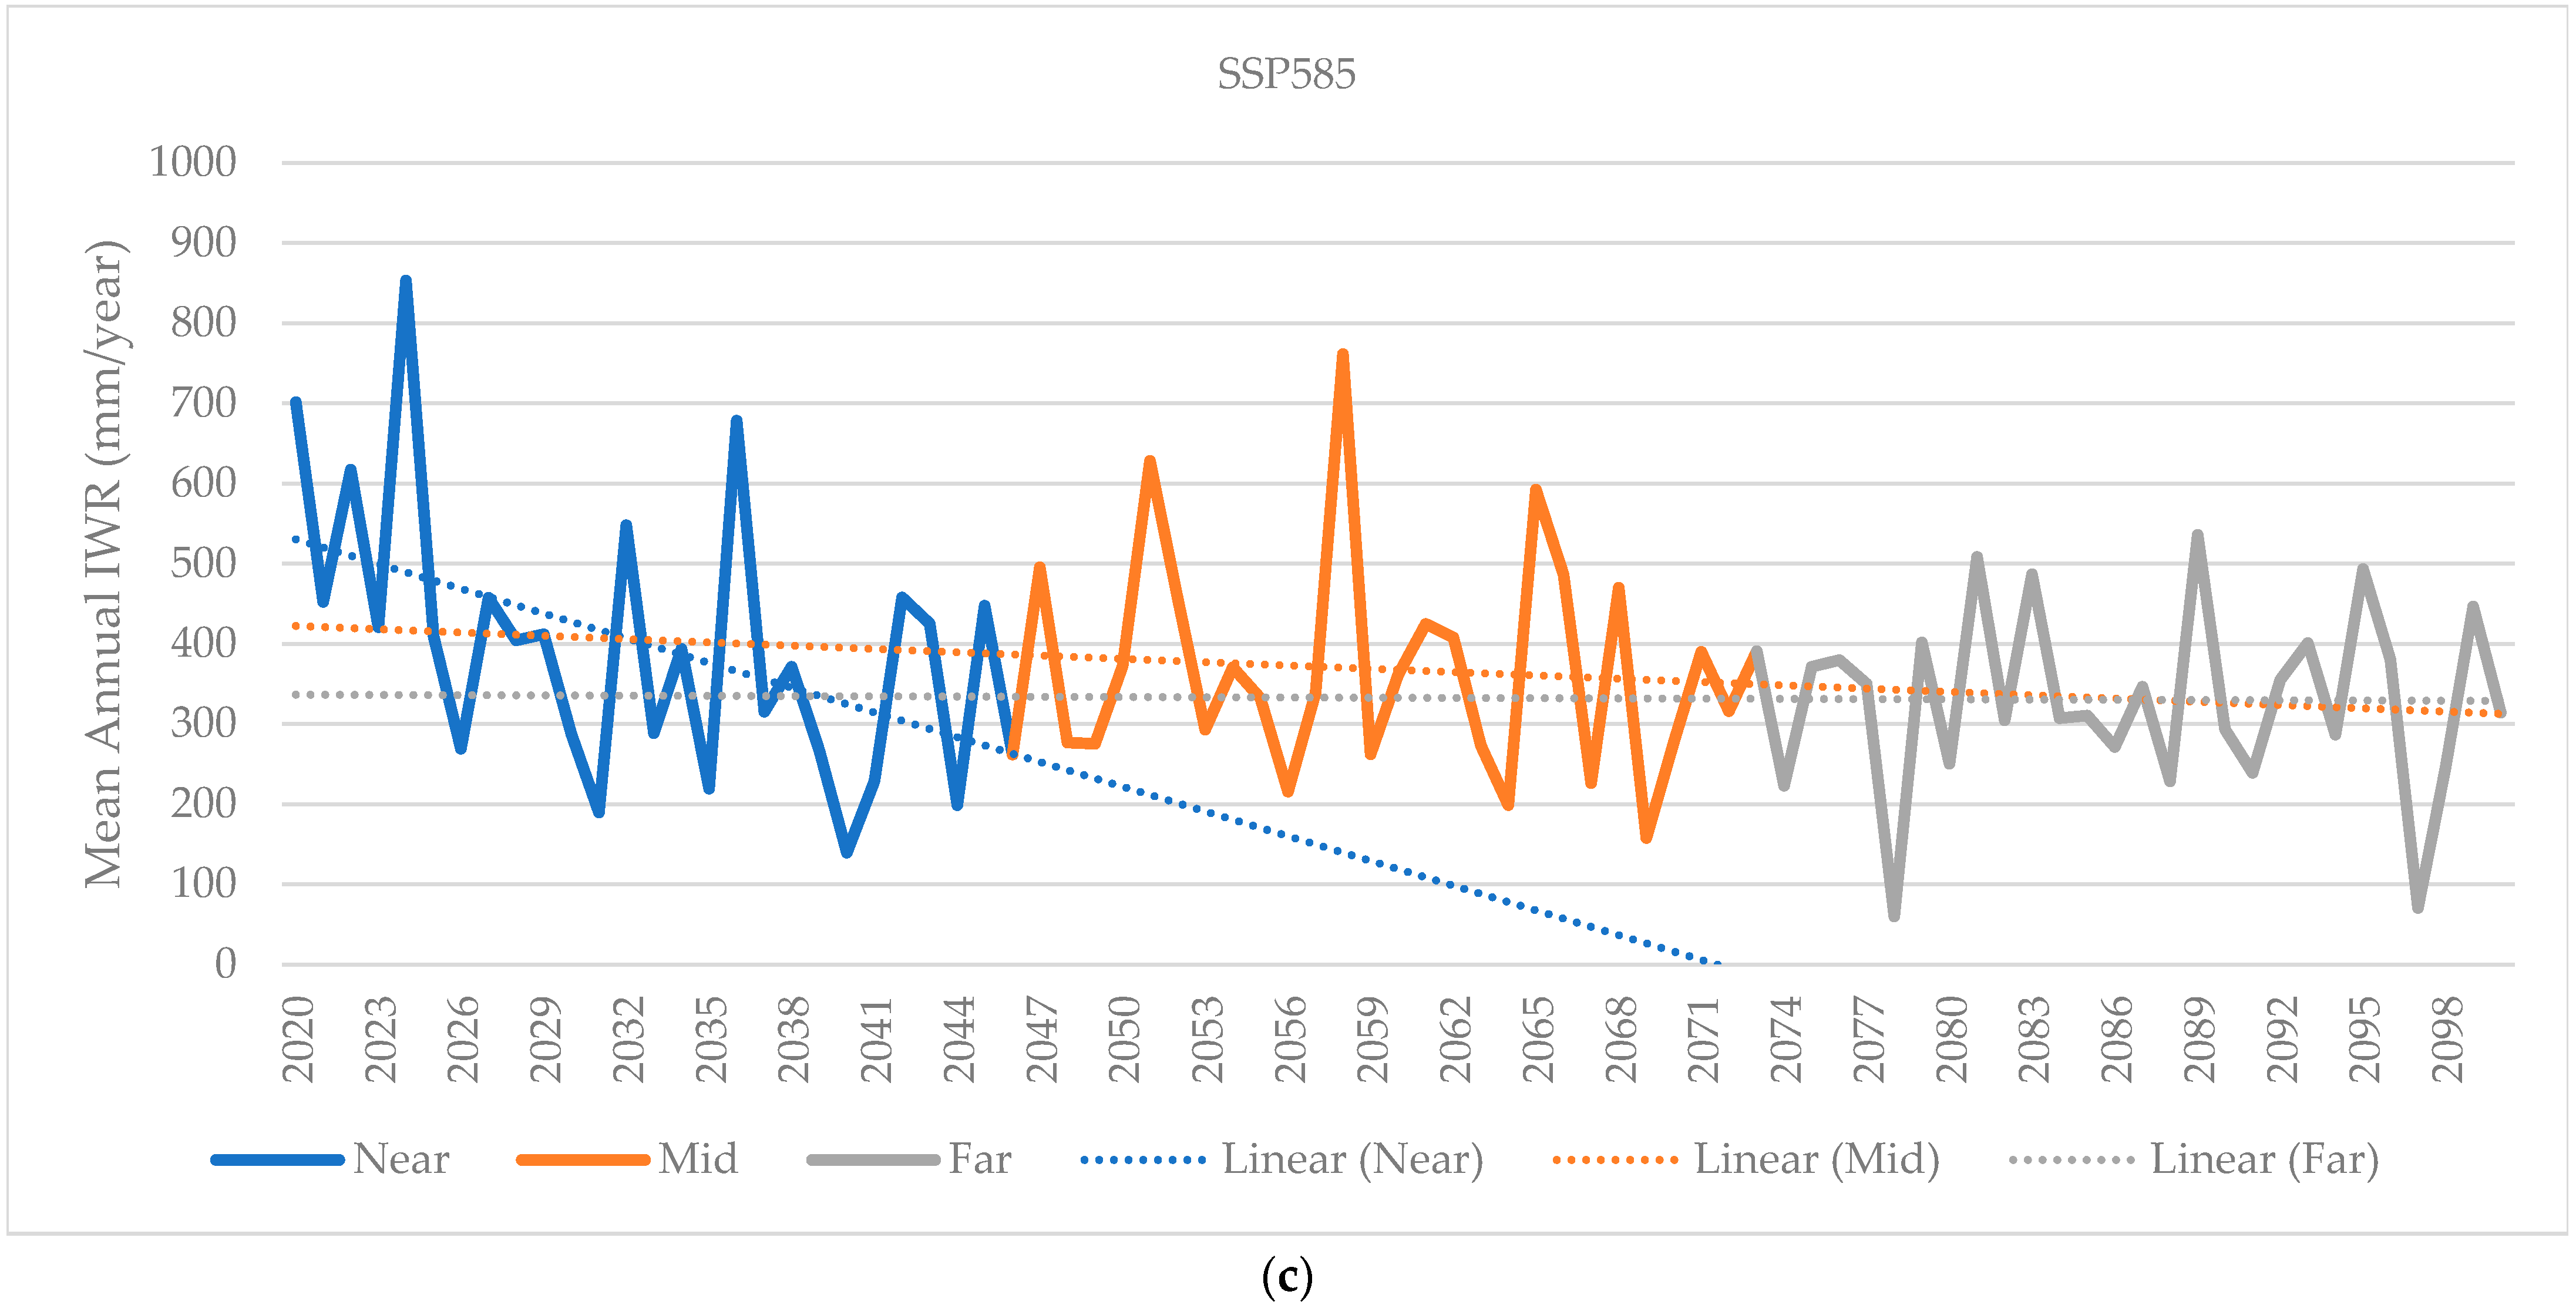
Most of the mean annual irrigation water requirements of the off season, as shown in Figure 7a,b, show a declining trend under all scenarios in comparison to the main season. The mean annual IWR during the mid-future period under SSP245 expects an increasing trend.

4. Discussion

A range of potential future impacts on the IWR across different SSPs can be seen for the main and off seasons. Under SSP245, Brunei experiences moderate temperature increases and significant rainfall increases, leading to a moderate 37% increase in the main-season IWR and a substantial off-season IWR decrease by 5% due to the more effective rainfall. SSP370 shows higher temperature rises, with main-season maximum temperatures reaching 33.7 °C and increased rainfall. This results in a 51% main-season IWR increase that is driven by higher evapotranspiration, while the off-season IWR decreases by 8% owing to substantial rainfall. SSP585 presents the highest temperature increases (up to 34.3 °C for the main season) and significantly elevated rainfall, leading to a 50% increase in the main-season IWR and a 5% decrease in the off-season IWR.
Moreover, a similar study was conducted in the Bhadra and Tungabhadra (TB) command areas, where it focused on estimating the CWR and IWR for using CROPWAT based on climate scenarios (SSP245 and SSP585) [35]. In the Bhadra and TB areas, the irrigation water requirement (IWR) exhibits varying trends, with some months experiencing decreases while others show increases. In contrast, Brunei consistently experiences increases in the main-season IWR across all SSPs. Additionally, the Bhadra and TB study revealed that the average monthly irrigation requirements under SSP245 are higher than those under SSP585, and this was attributed to the higher precipitation projections associated with SSP585 [35]. Conversely, the results for Brunei indicate the opposite trend, where the IWR increases under SSP585 are significant. These differences underscore the importance of conducting regional-level assessments as they highlight the sensitivity of IWR projections to specific climate models, scenarios, and geographic contexts.
Overall, this study revealed that higher temperatures elevate the evapotranspiration and water demands in Brunei, especially during the off season. However, the increased rainfall during the off season mitigates the irrigation needs over time across all SSPs, despite the increasing temperature. Zhu et al. found an estimated IWR in the Lower Mekong River Basin (LMRB) under two climate scenarios, SSP126 and SSP585, using climate projections for 2031–2060 and 2061–2090 [36]. While the SSP126 scenario shows a slight decrease in the IWR for rice crops due to a balance between increased rainfall and moderate temperature rise, the SSP585 scenario results in a significant increase in the IWR due to higher temperatures that outweigh the benefits of increased rainfall [36]. On the other hand, Boonwichai et al. assessed the future IWR for rice crops in the Songkhram River Basin, Thailand, using DSSAT crop simulation [37]. Their study indicates that both maximum and minimum temperatures are expected to increase, which will enhance evapotranspiration rates and, consequently, the IWR for rice crops [37]. The increase in rainfall could potentially mitigate some of the increased IWR due to higher temperatures, but it is not expected to fully stabilise the IWR. This study’s findings suggest that, despite the projected increase in rainfall in the 2080s, the future IWR will continue to rise due to the significant impact of higher temperatures on ET rates under the higher emission scenario (the RCP8.5 scenario).
Adib et al. utilised a stochastic rainfall generator to analyse the potential future impacts of climate change on rainfall patterns and the IWR in the Kerian rice irrigation scheme in Malaysia [38]. Both Zhu et al. and Adib et al. projected future climate impacts using ensembles of global climate models (GCMs) and various shared socioeconomic pathways (SSPs), providing a comprehensive analysis of how climate change will influence rainfall patterns and irrigation needs. However, Adib et al. shared a common focus on the critical role of seasonal variations in the IWR under changing climate conditions, which is also a key aspect of the current study on the Wasan rice scheme in Brunei. In Adib’s study, the findings show that, during the dry season, increased future rainfall will potentially reduce the need for additional irrigation water for rice crops. Similarly, during the wet season, the expected significant increase in rainfall will help meet the water requirements for rice cultivation, stabilising the IWR despite rising temperatures. These projections align closely with the current study’s findings, highlighting the importance of understanding seasonal IWR variations to develop effective adaptive water management strategies for sustainable rice cultivation amidst climate change.
It is evident in this study that, as temperatures rise, crops require more water to maintain their growth. Additionally, an increase in rainfall can lead to excess runoff, further impacting irrigation needs and potentially causing crop failures or waterlogging issues. Irrigation methods to account for the possible changes in temperature and rainfall patterns caused by climate change are essential for maintaining sustainable and effective water usage in agriculture. One of the adaptive methods used by the Department of Agriculture and Agrifood (DoAA) to increase productivity and reduce crop failure risks is researching drought-tolerant varieties. Some of the adaptive measures to address these changes are discussed in this section.
Implement a flexible water allocation plan that gives priority to distributing water according to seasonal demand between the main and off seasons. Assign higher quantities of water during the off season when irrigation water requirements are typically higher and reduce the water allocation during the main season when crop water needs are lower. This method can aid in optimising water utilisation and effective irrigation techniques, thus contributing to the sustainable management of water in paddy farming.
In cases of heavy rainfall, prolonged waterlogging could be an issue. However, excessive rainfall can lead to waterlogging. Therefore, maintaining a balance between optimal rainfall levels and drainage is crucial for successful rice cultivation. To prevent waterlogging, proper drainage systems should be implemented. Surface drainage in paddy fields can be minimised by taking into account anticipated future precipitation. Furthermore, AWD can be used to save water, resulting in more efficient use of rainfall and reduced water use in both irrigation and drainage systems. Regulating drainage amounts based on projected rainfall can be useful for boosting irrigation utilisation efficiency [39].
A higher effective rainfall during the rainy season makes up for the high demand for water during the dry season [40]. This highlights the importance of monitoring and managing temperature levels during rice cultivation. Additionally, farmers may need to consider implementing irrigation systems to guarantee sufficient water supply during the arid season and mitigate water stress on rice. This can be conducted by implementing rainwater harvesting, and the rainwater can be stored in small dams or ponds within the vicinity of the field, which can be abstracted through gravity-fed pipelines or pumps [41]. A previous study aimed at climate change adaptation in Brunei proposed a solution to address water scarcity by constructing sand and other storage facilities for rainwater harvesting [42]. This approach is designed to mitigate the effects of drought and ensure water availability during dry spells, and sand dams are used to also reduce evaporation, allowing for more water to be available for crops [42].

5. Conclusions

This paper attempted to investigate the effect of climate change on the crop water requirement and irrigation water requirement in Brunei Muara District for paddy cultivation using WEAP-MABIA. Statistically downscaled GCMs based on CMIP6 scenarios were bias-corrected using quantile delta mapping (QDM) for three future periods: near future, mid future, and far future.
The off season had a higher average ETo compared to the main season due to higher minimum and maximum temperatures. Both seasons showed an increasing trend in the average ETo and pattern over time, indicating future crop water requirements will rise due to increased ETc. The anticipated changes in the demand for irrigation water within the paddy fields can be attributed to the fluctuations observed in rainfall patterns and crop evapotranspiration. The IWR in the off season was found to be higher in comparison to the main season due to the lower rainfall at the beginning of the growing season during the off season and the higher temperature, which causes an increase in the crop water requirement. Although the simulated IWR for the off season started off with a higher amount for the near future period, the IWR decreased in the far future scenario, following different trends for the three CMIP6 scenarios. On average, the IWR in the main season showed a slight increasing trend.
Further investigation on the prediction of yield under climate change is required by incorporating a crop growth model or crop prediction model. The drawback of the model is that it can only estimate the effect of climate conditions on the current potential crop yield, and it does not include crop yield prediction, which is as important as irrigation water requirements for developing mitigation strategies. Moreover, since the study’s model uses constant crop coefficient (Kc) values throughout the simulation periods, it might not accurately portray the effect of crop water demand and irrigation water requirement. The Kc values may not be the same in the future; therefore, further investigation on the future changes of Kc in response to climate change is required to improve the simulation of water demand and crop yield. In addition to enhancing the calculation of ETc, the availability of solar radiation data in the future would significantly improve the accuracy of crop water requirement estimates. Studies have shown that models incorporating accurate solar radiation measurements yield more precise ETo estimates [43,44,45]. Nonetheless, the outcome of this study can be a useful guide for farmers and water resource managers to adopt irrigation techniques to mitigate the impact of climate change on water resources.
Supplementary Materials

The following supporting information can be downloaded at: https://www.mdpi.com/article/10.3390/w16172498/s1, Table S1: Rainfall during the main and off season for three future periods, Table S2: Crop water requirement during the main and off season for three future periods, Table S3: Irrigation water requirement during the main and off season for three future periods.

Author Contributions

Conceptualization, H.R. methodology, H.R.; software, H.R.; formal analysis, H.R.; investigation, H.R.; data curation, H.R.; writing—original draft preparation, H.R.; writing—review and editing, S.S., U.R. and E.K.A.R.; visualization, H.R.; supervision, S.S., U.R. and E.K.A.R. All authors have read and agreed to the published version of the manuscript.

Funding

This research received no external funding.

Data Availability Statement

The data in the Supplementary Materials are available on request from the corresponding authors.

Acknowledgments

We would like to express our gratitude and thanks to the Brunei Government for providing PhD scholarship to the corresponding authors.

Conflicts of Interest

The authors declare no conflicts of interest.

Abbreviations

The following table describes the abbreviations and acronyms used throughout the manuscripts:
CMIP5Coupled model intercomparison project phase 6
CMIP6Coupled model intercomparison project phase 6
CWRCrop water requirement
DoAADepartment of Agriculture and Agrifood, Brunei
ETcCrop evapotranspiration
EToReference evapotranspiration
IWRIrrigation water requirement
SSPsShared socioeconomic pathways
QDMQuantile delta mapping

References

  1. IPCC. AR6 Synthesis Report: Climate Change 2023; IPCC: Geneva, Switzerland, 2023. [Google Scholar]
  2. Rhymee, H.; Shams, S.; Ratnayake, U.; Rahman, E.K.A. Comparing Statistical Downscaling and Arithmetic Mean in Simulating CMIP6 Multi-Model Ensemble over Brunei. Hydrology 2022, 9, 161. [Google Scholar] [CrossRef]
  3. Su, Y.-C.; Kuo, B.-J. Risk Assessment of Rice Damage Due to Heavy Rain in Taiwan. Agriculture 2023, 13, 630. [Google Scholar] [CrossRef]
  4. Abbas, S.; Mayo, Z.A. Impact of temperature and rainfall on rice production in Punjab, Pakistan. Environ. Dev. Sustain. 2021, 23, 1706–1728. [Google Scholar] [CrossRef]
  5. Energy and Industry Department. Brunei Darussalam’s Second National Communication: Under the United Nations Framework Convention on Climate Change; Energy and Industry Department: Bandar Seri Begawan, Brunei, 2017. [Google Scholar]
  6. Wasil, W. Agri Dept to Pilot Irrigation System, Seeks to Boost Rice Production. The Scoop. 2019. Available online: https://thescoop.co/2019/02/13/3-9m-imang-dam-upgrade-to-improve-irrigation-supply-boost-rice-output/ (accessed on 1 September 2023).
  7. Kamarulzamana, N.H. Ecomomic Diversification in Brunei Darussalam: The Case of Wet Rice Agriculture. Master’s Thesis, University of Sussex, Falmer, UK, 2017. [Google Scholar]
  8. Suhaili, W.S.H. Adoption of technology to improve self-sufficiency in paddy plantations in Brunei: Challenges and mitigation strategies for intermediate stakeholders. IOP Conf. Ser. Earth Environ. Sci. 2023, 1182, 012011. [Google Scholar] [CrossRef]
  9. Li, M.; Fu, Q.; Singh, V.P.; Liu, D.; Li, T.; Zhou, Y. Managing agricultural water and land resources with tradeoff between economic, environmental, and social considerations: A multi-objective non-linear optimization model under uncertainty. Agric. Syst. 2020, 178, 102685. [Google Scholar] [CrossRef]
  10. Munanjar, M.C.; Amalia, M. Impact of Changes in Rainfall Patterns and Air Temperature on Water Balance in Danda Besar Swamp Irrigation Area. Int. J. Civ. Eng. 2023, 10, 1–8. [Google Scholar] [CrossRef]
  11. Misnawati; Apriyana, Y.; Ramadhani, F. The projected water availability on paddy rice based on climate change scenario in Indonesia. IOP Conf. Ser. Earth Environ. Sci. 2021, 648, 012162. [Google Scholar] [CrossRef]
  12. Water Evaluation and Planning. Stockholm Environment Institute. Available online: https://www.weap21.org/ (accessed on 1 December 2023).
  13. Shams, S.; Reza, M.S.; Azad, A.K.; Juani, R.B.H.M.; Fazal, M.A. Environmental Flow Estimation of Brunei River Based on Climate Change. Environ. Urban. ASIA 2021, 12, 257–268. [Google Scholar] [CrossRef]
  14. Krittasudthacheewa, C.; Polpanich, O.; Bush, A.; Srikuta, P.; Kemp-Benedict, E.; Inmuong, Y.; Inmuong, U.; Featherston, P.; Eagleton, G.; Naruchaikusol, S.; et al. Final Report for the Northeast Thailand Futures: A Local Study of the Exploring Mekong Region Futures Project; Stockholm Environment Institute: Stockholm, Sweden, 2012. [Google Scholar]
  15. Ayt Ougougdal, H.; Yacoubi Khebiza, M.; Messouli, M.; Lachir, A. Assessment of Future Water Demand and Supply under IPCC Climate Change and Socio-Economic Scenarios, Using a Combination of Models in Ourika Watershed, High Atlas, Morocco. Water 2020, 12, 1751. [Google Scholar] [CrossRef]
  16. Abdallah, W.; Allani, M.; Mezzi, R.; Jlassi, R.; Romdhane, A.; Faidi, F.; Daouthi, Z.; Amara, A.; Selmi, H.; Zouabi, A.; et al. A Contribution to an Advisory Plan for Integrated Irrigation Water Management at Sidi Saad Dam System (Central Tunisia): From Research to Operational Support. In Embedding Space in African Society; Springer: Cham, Switzerland, 2019; pp. 65–79. [Google Scholar]
  17. Olabanji, M.F.; Ndarana, T.; Davis, N. Impact of Climate Change on Crop Production and Potential Adaptive Measures in the Olifants Catchment, South Africa. Climate 2020, 9, 6. [Google Scholar] [CrossRef]
  18. Schneider, P.; Sander, B.O.; Wassmann, R.; Asch, F. Potential and versatility of WEAP model (Water Evaluation and Planning System) for hydrological assessments of AWD (Alternate Wetting and Drying) in irrigated rice. Agric. Water Manag. 2019, 224, 105559. [Google Scholar] [CrossRef]
  19. Allani, M.; Mezzi, R.; Zouabi, A.; Béji, R.; Joumade-Mansouri, F.; Hamza, M.E.; Sahli, A. Impact of future climate change on water supply and irrigation demand in a small mediterranean catchment. Case study: Nebhana dam system, Tunisia. J. Water Clim. Chang. 2020, 11, 1724–1747. [Google Scholar] [CrossRef]
  20. Tikariha, Y.K.; Ahmad, I. Estimation and Management of Irrigation Water Using WEAP Model in Tandula Reservoir Command Area. In Hydrological Modeling: Hydraulics, Water Resources and Coastal Engineering; Springer International Publishing: Berlin/Heidelberg, Germany, 2022; pp. 423–435. [Google Scholar]
  21. Riahi, K.; van Vuuren, D.P.; Kriegler, E.; Edmonds, J.; O’Neill, B.C.; Fujimori, S.; Bauer, N.; Calvin, K.; Dellink, R.; Fricko, O.; et al. The Shared Socioeconomic Pathways and their energy, land use, and greenhouse gas emissions implications: An overview. Glob. Environ. Chang. 2017, 42, 153–168. [Google Scholar] [CrossRef]
  22. Eyring, V.; Bony, S.; Meehl, G.A.; Senior, C.A.; Stevens, B.; Stouffer, R.J.; Taylor, K.E. Overview of the Coupled Model Intercomparison Project Phase 6 (CMIP6) experimental design and organization. Geosci. Model Dev. 2016, 9, 1937–1958. [Google Scholar] [CrossRef]
  23. Song, Y.H.; Chung, E.-S.; Shahid, S.; Kim, Y.; Kim, D. Development of global monthly dataset of CMIP6 climate variables for estimating evapotranspiration. Sci. Data 2023, 10, 568. [Google Scholar] [CrossRef] [PubMed]
  24. Douville, H.; Willett, K.M. A drier than expected future, supported by near-surface relative humidity observations. Sci. Adv. 2023, 9, eade6253. [Google Scholar] [CrossRef] [PubMed]
  25. O’Neill, B.C.; Kriegler, E.; Riahi, K.; Ebi, K.L.; Hallegatte, S.; Carter, T.R.; Mathur, R.; van Vuuren, D.P. A new scenario framework for climate change research: The concept of shared socioeconomic pathways. Clim. Change 2014, 122, 387–400. [Google Scholar] [CrossRef]
  26. Cannon, A.J.; Sobie, S.R.; Murdock, T.Q. Bias Correction of GCM Precipitation by Quantile Mapping: How Well Do Methods Preserve Changes in Quantiles and Extremes? J. Clim. 2015, 28, 6938–6959. [Google Scholar] [CrossRef]
  27. Chen, J.; Brissette, F.P.; Chaumont, D.; Braun, M. Finding appropriate bias correction methods in downscaling precipitation for hydrologic impact studies over North America. Water Resour. Res. 2013, 49, 4187–4205. [Google Scholar] [CrossRef]
  28. Li, X.; Li, Z. Evaluation of bias correction techniques for generating high-resolution daily temperature projections from CMIP6 models. Clim. Dyn. 2023, 61, 3893–3910. [Google Scholar] [CrossRef]
  29. Allen, R.G.; Pereira, L.S.; Raes, D.; Smith, M. FAO Irrigation and Drainage Paper NO. 56: Crop Evapotranspiration (Guiedelines for Computing Crop Water Use)’; FAO: Rome, Italy, 1998. [Google Scholar]
  30. Hargreaves, G.H.; Samani, Z.A. Estimating potential evapotranspiration. J. Irrig. Drain. Eng. 1982, 108, 223–230. [Google Scholar] [CrossRef]
  31. Grealish, G.J.; Ringrose-Voase, A.J.; Fitzpatrick, R.W.; Wong, M.T.F.; Wintson, E.C. Soil Fertility Evaluation/Advisory Service in Negara Brunei Darussalam Volume 1—Soils and Land Suitability of the Agricultural Development Areas; Science Report 57/08/CSIRO Land and Water; CSIRO: Canberra, Australia, 2008. [Google Scholar]
  32. Ringrose-Voase, A.J.; Wong, M.T.F.; Winston, E.C.; Grealish, G.J.; Fitzpatrick, R.W.; Hicks, W.S. Soil Management in the Agricultural Development Areas (Report P2) in Soil Fertility Evaluation/Advisory Service in Negara Brunei Darussalam; CSIRO Land and Water Science Report 38/08; CSIRO: Canberra, Australia, 2008. [Google Scholar]
  33. IRRI How to Manage Water. Available online: http://www.knowledgebank.irri.org/step-by-step-production/growth/water-management (accessed on 2 September 2023).
  34. Rowshon, M.K.; Dlamini, N.S.; Mojid, M.A.; Adib, M.N.M.; Amin, M.S.M.; Lai, S.H. Modeling climate-smart decision support system (CSDSS) for analyzing water demand of a large-scale rice irrigation scheme. Agric. Water Manag. 2019, 216, 138–152. [Google Scholar] [CrossRef]
  35. Rudraswamy, G.K.; Umamahesh, N.V. Investigating the impact of climate change on irrigation and crop water requirements of Bhadra and Tungabhadra command area: A CMIP-6 GCMs and CROPWAT 8.0 approach. Water Supply 2024, 24, 625–642. [Google Scholar] [CrossRef]
  36. Luo, Y.; Zhu, T. Estimating Spatially Distributed Irrigation Water Requirements for the Lower Mekong River Basin: Present Condition and Climate Change Impacts. In Proceedings of the EGU General Assembly, Vienna, Austria, 23–28 April 2023. [Google Scholar] [CrossRef]
  37. Boonwichai, S.; Shrestha, S.; Babel, M.S.; Weesakul, S.; Datta, A. Climate change impacts on irrigation water requirement, crop water productivity and rice yield in the Songkhram River Basin, Thailand. J. Clean. Prod. 2018, 198, 1157–1164. [Google Scholar] [CrossRef]
  38. Adib, M.N.M.; Harun, S.; Rowshon, M.K. Long-term rainfall projection based on CMIP6 scenarios for Kurau River Basin of rice-growing irrigation scheme, Malaysia. SN Appl. Sci. 2022, 4, 70. [Google Scholar] [CrossRef]
  39. Zhao, X.; Chen, M.; Xie, H.; Luo, W.; Wei, G.; Zheng, S.; Wu, C.; Khan, S.; Cui, Y.; Luo, Y. Analysis of irrigation demands of rice: Irrigation decision-making needs to consider future rainfall. Agric. Water Manag. 2023, 280, 108196. [Google Scholar] [CrossRef]
  40. Ismail, H.; Kamal, M.R.; bin Abdullah, A.F.; bin Mohd, M.S.F. Climate-Smart Agro-Hydrological Model for a Large Scale Rice Irrigation Scheme in Malaysia. Appl. Sci. 2020, 10, 3906. [Google Scholar] [CrossRef]
  41. Liniger, H.P.; Studer, R.M.; Hauert, C.; Gurtner, M. Sustainable Land Management in Practice—Guidelines and Best Practices for Sub-Saharan Africa; TerrAfrica, World Overview of Conservation Approaches and Technologies (WOCAT) and Food and Agriculture Organization of the United Nations (FAO): Rome, Italy, 2011. [Google Scholar]
  42. Shams, S.; Shafiuddin, K.H.; Sultan, A.M.S.B.H.M.; Juani, R.B.H.M. Agriculture Adaptation to Climate Change in Brunei Darussalam. Environ. Urban. ASIA 2015, 6, 59–70. [Google Scholar] [CrossRef]
  43. Flores-Velazquez, J.; Akrami, M.; Villagrán, E. The Role of Radiation in the Modelling of Crop Evapotranspiration from Open Field to Indoor Crops. Agronomy 2022, 12, 2593. [Google Scholar] [CrossRef]
  44. Sabino, M.; de Souza, A.P. Global Sensitivity of Penman-Monteith Reference Evapotranspiration to Climatic Variables in Mato Grosso, Brazil. Earth 2023, 4, 714–727. [Google Scholar] [CrossRef]
  45. Han, Y.; Calabrese, S.; Du, H.; Yin, J. Evaluating biases in Penman and Penman–Monteith evapotranspiration rates at different timescales. J. Hydrol. 2024, 638, 131534. [Google Scholar] [CrossRef]
Figure 1. Paddy fields in Brunei Muara (Source: Google Earth).
Water 16 02498 g001
Figure 2. Flowchart of the forecasting irrigation water requirement (IWR) and crop water requirement (CWR).
Water 16 02498 g002
Figure 3. Comparison of the CMIP6 climate models with the observed results during the validation period (2010–2019). The blue line represents the observed data, the orange line represents the bias-corrected model output, and the grey line represents the raw, uncorrected model output.
Water 16 02498 g003
Figure 4. The projection of monthly average (a) rainfall, (b) maximum temperature and (c) minimum temperature under SSP245, SSP370, and SSP585 during the period 2020–2100.
Water 16 02498 g004aWater 16 02498 g004b
Figure 5. The projected annual total crop water requirement for (a) the main season and (b) the off season under the three future periods of SSP245, SSP370, and SSP585.
Water 16 02498 g005aWater 16 02498 g005b
Figure 6. The projected mean annual irrigation water requirement for the main season under (a) SSP245, (b) SSP370, and (c) SSP585.
Water 16 02498 g006aWater 16 02498 g006b
Figure 7. The projected mean annual irrigation water requirement for the off season under (a) SSP245, (b) SSP370, and (c) SSP585.
Water 16 02498 g007aWater 16 02498 g007b
Table 1. The model names, modelling centre, and resolutions of seven CMIP6 global climate models.
Model NamesModelling CentresResolutions
ACCESS-CM2Australian Community Climate and Earth System Simulator, Hobart, Australia1.25° × 1.875°
AWI-CM-1-MRAlfred Wegener Institute, Helmholtz Centre for Polar and Marine Research, Bremerhaven, Germany0.94° × 0.94°
INM-CM5-0Institute for Numerical Mathematics, Moscow, Russia2.0° × 1.5°
MIROC6University of Tokyo, National Institute for Environmental Studies and Japan Agency for Marine-Earth Science and Technology, Tokyo, Japan1.41° × 1.41°
MPI-ESM1-2-LRMax Planck Institute for Meteorology, Hamburg, Germany1.875° × 1.875°
MRI-ESM2-0Meteorological Research Institute, Tsukuba, Japan1.125° × 1.125°
NorESM2-MMNorwegian Climate Centre, Oslo, Norway1.25° × 0.9375°
Table 2. Database of the crop parameters used in WEAP-MABIA.
ParametersValue (s)
Kcb initial1.00
Kcb mid-season1.15
Kcb end-season1.15
Depletion factor initial0.2
Depletion factor mid0.2
Depletion factor end0.2
Minimum rooting depth (m)0.15
Maximum rooting depth (m)1.0
Table 3. Summary of the overall performance of the raw and bias-corrected climate models during the validation period.
Rainfall
SDMeanR-SquaredPBias
Observed80.45272.75
Raw SSP24512.75241.530.44−11.5
Raw SSP37013.56241.40.44−11.5
Raw SSP58513.9241.020.40−11.6
SSP245139.33289.50.606.1
SSP370142.87265.770.52−2.6
SSP585145.93262.310.42−3.8
Maximum Temperature
SDMeanR-SquaredPBias
Observed0.6332.12
Raw SSP2450.4332.290.98−0.005
Raw SSP3700.4532.290.97−0.005
Raw SSP5850.4532.290.98−0.005
SSP2451.0932.290.97−0.005
SSP3701.1332.290.97−0.005
SSP5851.1232.290.98−0.005
Minimum Temperature
SDMeanR-SquaredPBias
Observed0.3124.2
Raw SSP2450.0323.6−0.122.48
Raw SSP3700.0323.6−0.202.54
Raw SSP5850.0323.6−0.032.5
SSP2450.2923.6−0.122.49
SSP3700.3223.6−0.192.55
SSP5850.2823.6−0.022.51
Table 4. The average annual precipitation for the main and off season of the three future periods.
MainOff
SSP245SSP370SSP585SSP245SSP370SSP585
Near909780818875863790
Mid10311058897903921986
Far107210241145103613091439
Table 5. The average annual maximum temperature for the main and the off season of the three future periods.
MainOff
SSP245SSP370SSP585SSP245SSP370SSP585
Near30.930.830.932.932.732.7
Mid31.932.332.534.034.034.2
Far32.633.734.334.835.736.1
Table 6. The average annual minimum temperature for the main and off seasons of the three future periods.
MainOff
SSP245SSP370SSP585SSP245SSP370SSP585
Near22.822.722.623.123.023.0
Mid23.723.623.624.123.923.9
Far24.224.524.724.625.025.1
Table 7. The average reference evapotranspiration relative to the changes in average minimum and maximum temperatures during the off season and off season.
EToMinimum TemperatureMaximum Temperature
SSP245SSP370SSP585SSP245SSP370SSP585SSP245SSP370SSP585
MainNear57056956922.822.722.630.930.830.9
Mid58658959223.623.623.631.932.332.5
Far59761061924.224.524.732.633.734.3
OffNear61961761623.123.022.932.932.732.7
Mid63963663824.123.923.934.034.034.1
Far65066366924.625.025.134.835.636.1
Table 8. The average ETc (mm) for the main and off season under various climate scenarios.
Main-Season ETc (in mm)Off-Season ETc (in mm)
PeriodSSP245SSP370SSP585PeriodSSP245SSP370SSP585
Near674676661Near739717694
Mid702699688Mid738737748
Far713730742Far773783798
Table 9. Percentage excess rainfall relative to the average rainfall for the main and off seasons.
Main SeasonOff Season
PeriodSSP245SSP370SSP585PeriodSSP245SSP370SSP585
Near26%13%19%Near16%17%12%
Mid32%34%23%Mid18%20%24%
Far33%29%35%Far25%40%45%
Table 10. Average irrigation water requirement (mm) for the main and off seasons, with percentage changes in the future irrigation water requirement relative to the baseline period of 2010–2019 (in parentheses).
Main-Season IWR (in mm)Off-Season IWR (in mm)
PeriodSSP245SSP370SSP585PeriodSSP245SSP370SSP585
Near275 (43)263 (37)251 (31)Near411 (18)386 (11)397 (14)
Mid263 (37)263 (37)268 (40)Mid383 (10)365 (5)372 (7)
Far264 (37)289 (51)278 (45)Far363 (5)319 (−8)328 (−5)
Disclaimer/Publisher’s Note: The statements, opinions and data contained in all publications are solely those of the individual author(s) and contributor(s) and not of MDPI and/or the editor(s). MDPI and/or the editor(s) disclaim responsibility for any injury to people or property resulting from any ideas, methods, instructions or products referred to in the content.