Article

Real-Time Optimal Scheduling of a Water Diversion System Using an Improved Wolf-Pack Algorithm and Scheme Library

College of Electrical, Energy and Power Engineering, Yangzhou University, Yangzhou 225000, China
*
Author to whom correspondence should be addressed.
Water 2024, 16(17), 2420; https://doi.org/10.3390/w16172420
Submission received: 28 July 2024 / Revised: 11 August 2024 / Accepted: 16 August 2024 / Published: 27 August 2024

Abstract

:
A water diversion system (WDS) with cascade pumping stations (CPSs) plays an important role in the application of water resources. However, high energy consumption is reported due to unreasonable scheduling schemes and long decision times. Herein, this paper presents a new method to achieve optimal scheduling schemes effectively, including the head allocation of CPSs, the number of running pumps, and pump blade angles. A double-layer mathematical model for a WDS was established with the goal of achieving minimal energy consumption, considering the constraints of flow rate, water level, and the characteristics of pump units. The inner-layer model was used to obtain scheduling schemes of single-stage pumping stations, as well as the water levels and flow rates of water channels, while the outer-layer model was used to optimize inter-stage head allocation. An improved wolf-pack algorithm (IWPA) was proposed to solve the model, using a Halton sequence to obtain the uniform initial population distribution and introducing simulated annealing (SA) to improve the global searchability. Moreover, an idea for a pre-established scheme library was suggested for inner-layer models to obtain the solutions in real time with less calculation workload. Taking an actual project as a case, in contrast with the actual schemes, the optimal scheduling method could result in energy savings of 14.37–20.39%, a CO2 emission reduction of 13–32 tons per day, and water savings of 0.14–18.34%. Moreover, the time complexity decreased to square order, and the CPU time of the optimal method was about 1% that of the traditional method. This study provides an efficient method for the high-value utilization of energy and water resources for a WDS.

1. Introduction

With the continuous growth of the world economy, water resources in some areas cannot sustain the needs of domestic water supply, industrial water, agricultural irrigation, and ecological protection. To alleviate water supply conflict, many water diversion systems (WDSs) have been constructed around the world. As the core components of the systems, cascade pumping stations (CPSs), which are composed of two or more pumping stations in series, consume much energy during water diversion. Hence, it is necessary to implement optimal scheduling. For a WDS with CPSs, the decision schemes include the head allocation of CPSs, the number of running pumps, and the flow rate of each pump. The pumps may be fixed, speed variable, or blade angle variable, depending on the actual WDS. If the water is transferred along open channels, the water surface lines considering water and hydraulic losses should be calculated as well. In fact, the water level, flow rate, and pumping head influence and restrict each other, which increases the complexity and decision-making difficulty of the optimization models.
In the current literature, many scholars have extensively researched the optimal operation of WDSs. In terms of mathematical models, the focus is mostly on energy consumption [1,2,3,4,5], electrical cost [6,7,8,9], operational safety [10], and so on. Specifically, Luna et al. [11] presented a hybrid genetic algorithm (GA) to find the optimal operational sequence for each pump over 24 h to reduce the energy consumption, CO2 emissions, and costs, and the results indicated that the energy efficiency was up to 15% on average. Navarro-Gonzalez et al. [12] studied a least-squares scheduling algorithm with a short computing time for scheduling irrigation pumps in solar photovoltaic modules, showing a huge amount of energy savings. Ahcene and Saadia [13] developed an NNGA tool for pumping management, which optimized the consumed energy of the pumping system, achieving energy savings of around 39.4%. Cimorelli et al. [14] proposed a well-designed GA and a new decision-variable representation for parallel pump systems, offering a lower cost and fewer pump switches. Zhao et al. [15] studied operation combination and flow distribution schemes for pumping station systems based on a GA to minimize energy consumption and maximize operational efficiency.
From the perspective of decision methods, dynamic programming (DP), particle swarm optimization (PSO), and the grey wolf algorithm (GWA) are often applied to solve the models for WDSs. Zhang et al. [16] presented an improved DP method to schedule the CPSs, which can reduce the operation of one or more pumping stations and optimize the heat distribution, with the results of no less than 23% savings in energy cost. Meanwhile, variables and function values were stored in an array in the database in order to reduce computation time. Yan et al. [17] proposed a multi-objective PSO to solve the optimal model of CPSs coupled with the one-dimensional unsteady flow model, considering both cost and safety. Compared with the actual scheme, the average water lifting cost was reduced by 4.54–12.14% for the optimization schemes. Liu et al. [18] reported an improved adaptive GWA for the optimal operation of a CPS composed of six pumping stations, and the daily operating cost could be reduced by around 0.8% compared to that of the actual schemes. Wang et al. [19] and Yu et al. [20] adopted the sparrow search algorithm to obtain improved optimization schemes compared to the current schemes of pumping stations. In terms of real-time control in WDSs, the focus is on data monitoring and feedback control, such as flow rate, pressure, and water level. Creaco et al. [21] published a review of the real-time control of water distribution networks; Galuppini et al. [22,23] studied the stability and robustness of real-time pressure control in water distribution systems.
To sum up, what is most noteworthy is how to achieve better solutions in less time (such as within one hour). However, there is less attention on calculation time [12,16] and more focus on optimization schemes or real-time control. All algorithms have their own merits and demerits, and none of them can be claimed as the best. Therefore, there is an incentive to use better algorithms for solving models in real time for a WDS. In this article, a double-layer model is established for a WDS with CPSs. The objective function is minimal energy consumption, since this can directly reduce the emissions of greenhouse gases. The safety or stability requirement is guaranteed by constraints. A method using an improved wolf-pack algorithm (IWPA) is proposed to obtain optimizing solutions. Furthermore, an idea for a pre-established scheme library is put forward based on the decisions of inner-layer models to decrease the calculation time complexity. The schemes in the scheme library are called when making decisions in the outer-layer model. These methods can obtain the optimal schemes to meet the energy-saving and real-time requirements. Moreover, they can efficiently determine the optimization problems of more complicated WDSs with CPSs in series or parallel.
The remainder of this study is organized as follows: Section 2 provides a double-layer mathematical model. Section 3 proposes the IWPA and a solution process for the model. Section 4 shows a computational application for a project case. Section 5 shows the analysis and discussion. Finally, Section 6 concludes this study with a summary.

2. Mathematical Model

A WDS with CPSs is composed of water sources, pumping stations, and a long-distance water transfer engineering system. Typically, the system is divided into two closely related subsystems for the calculation of optimal operation: the pumping station subsystem and the water transfer subsystem. The pumping station subsystem consists of several single-stage pumping stations arranged in series or parallel, while the water transfer subsystem includes open water channels or pipelines situated between two pumping stations or a pumping station and a lake or reservoir. Consequently, the optimal models can be constructed as two interconnected layers. The inner-layer model is used to determine the solutions for the single-stage pumping stations and water surface lines of water channels, while the outer-layer model is employed to obtain the head allocation of the CPSs.

2.1. Inner-Layer Model

2.1.1. Optimal Model of Single-Stage Pumping Station

According to the sequence of power transfer, the power is transmitted from an external substation to the main transformer through high-voltage cables and is then supplied to the main motors and in-station electrical equipment. Consequently, the power consumption consists of the sum of the input power to main motors and in-station electrical equipment, along with the losses from transmission and transformation. The mathematical model of a single-stage pumping station is as follows.
P =   min ρ g Q s H z 1000 η z η d η m n + P is + Δ P el + Δ P tl
where ρ is the water density, kg/m3; g is the acceleration of gravity, m/s2; Qs is the flow rate of a single pump, m3/s; Hz is the head of a pumping station, m; n is the number of running pumps; ηz is the pump assembly efficiency; ηd is the driving efficiency; ηm is the motor efficiency; Pis is the power consumption of in-station electrical equipment, kW; ΔPel and ΔPtl are the losses of power transmission and transformer(kW), with the detailed expression provided in Reference [5].
The objective function should satisfy the constraints related to the flow rate range of a single pump, the operating head range of a pumping station, the number of installed units, the range of pump blade angles (for blade-adjustable pumps), and the required flow rate to ensure the operation safety and stability.
Q s min Q s Q s max H z min H z H z max 0 n N β min β β max Q r = Q s n
where Qsmin and Qsmax are the lower and upper flow rate limits of a single pump, m3/s; Hzmin and Hzmax are the lower and upper head limits of a pumping station, m; N is the number of installed pumps; β is the pump blade angle, (°); βmin and βmax are the lower and upper limits of pump blade angles, (°); Qr is the required flow rate, m3/s.

2.1.2. Model of Channel Water Level–Flow Rate

During the process of water delivery in an open channel, seepage, and evaporation loss occur, which are varied with the channel’s cross-sectional shape, flow rate, water level, and so on. Typically, the flow in the channel is non-uniform. To determine the water level and flow rate at different sections along the channel, the channel is divided into several micro-segments with a length of ΔL, and it is assumed that the hydraulic elements vary linearly within each micro-segment.
As shown in Figure 1, plane 0–0 is the datum plane, while planes 1–1, 2–2, 3–3, and 4–4 represent the cross-section of upstream, downstream, wet perimeter (including the bottom and slope of the channel), and water surface, respectively. The symbols Q, v, z, and θ represent the flow rate, velocity, potential energy per unit weight of liquid, and the angle between the channel bottom section and the datum plane. Based on the continuity equation in fluid mechanics, flow rate Q1 is the sum of Q2, Q3, and Q4, where Q3 and Q4 denote the flow rates of seepage qs and evaporation qz. The qs is related to the flow velocity, water depth, channel size, groundwater level, and soil permeability. The qz depends on local temperature, air relative humidity, wind speed, and other factors. The total energy equation is established for the micro-segment as follows:
ρ g Q 1 z 1 + p 1 ρ g + α 1 v 1 2 2 g = ρ g Q 2 z 2 + p 2 ρ g + α 2 v 2 2 2 g + ρ g Q 3 z 3 + p 3 ρ g + α 3 v 3 2 2 g   + ρ g Q 4 z 4 + p 4 ρ g + α 4 v 4 2 2 g + Δ E w
where p/(ρg) denotes the pressure energy per unit weight of the water, m; p1 = p2 = p4 = pa, p3 = pa + ρgh3cos θ, h is the average water depth, m; v2/(2g) is the average kinetic energy per unit weight of the water on the cross-section, m; α is the kinetic energy correction coefficient; ΔEw is the sum of the local loss ΔEj and the lengthwise loss ΔEf, m.
Local loss ΔEj is approximately equal to zero in a micro-segment and lengthwise loss ΔEf can be expressed as follows:
Δ E f = ρ g Δ L 2 Q 1 3 K 1 2 + Q 2 3 K 2 2
where K is flow modulus, m3/s, and K = A C R , C = R 1 / 6 / n r , where A is section area, m2; R is hydraulic radius, m; C is Chezy coefficient; and nr is the roughness coefficient.
Supposing z4 = (z1 + z2)/2, yield,
z 3 + p 3 ρ g = z 4 + p a ρ g = 1 2 z 1 + z 2 + p a ρ g
The Equation (3) becomes as follows by substituting Equations (4) and (5) into it.
Q 1 z 1 + v 1 2 2 g = Q 2 z 2 + v 2 2 2 g + q s 2 z 1 + z 2 + v 3 2 2 g + q z 2 z 1 + z 2 + v 4 2 2 g + Δ L 2 Q 1 3 K 1 2 + Q 2 3 K 2 2
For a cross-section at a given time, the parameters such as channel size, groundwater level, soil permeability, and evaporation are considered. If Q2 and z2 are given, the Q1 and z1 can be obtained through iterative calculations using Equation (6). The flow rate and water level at each section along the channel or water surface line are then calculated. These results are used to determine the head allocation of cascade pumping stations.

2.2. Outer-Layer Model

The outer-layer model determines the optimal head allocation among the CPSs. Given the source water level zs, the destination water level zd, and the required flow rate Qr, the optimization model is established with the objective of minimizing the power consumption Psys of a WDS as follows:
P sys = min w = 1 W P w
where w is the serial number of the pumping stations, W is the total steps, and Pw is the energy consumption of the w-th pumping station, kW, which can be obtained using Equation (1).
The constraints include flow rate and water level, which can ensure the operation’s safety and stability. Considering leakage and evaporation from the water channels, the flow rate must meet the continuity equation, as shown in Equation (8). The water level constraints involve the water level at the inlet and outlet side of each pumping station along the channel, as indicated in Equation (9).
Q s t = 1 T q s   t + q z   t = Q d
where t is the serial number of a channel, and T is the number of channels.
z i n   w min z i n   w z i n   w max z o u t   w min z o u t   w z o u t   w max z min x z x z max x
where zin and zout are the water level at the inlet and outlet side of a pumping station, m; zin min and zin max are the lower and upper water level limits on the inlet side of a pumping station, m; zout min and zout max are the lower and upper water level limits on the outlet side of a pumping station, m; z(x) is the water level at any section x-x of a channel, m, which can be calculated using the channel water level–flow rate model; zmin(x) and zmax(x) are the lower and upper water level limits at any section x-x of a channel, m.

3. Methodology

3.1. Wolf-Pack Algorithm

The wolf-pack algorithm (WPA) has been widely applied in various research fields [24,25,26], and the optimization process of standard WPA is as follows [27]:
(1)
Population initialization
Randomly generate M wolves in the D-dimensional solution space to form the initial wolf pack according to Equation (10), i.e.,
X i d = X d   m i n + r a n d ( 0 , 1 ) ( X d   m a x X d   m i n )
where i is the sequence number of the wolf, i = 1, 2, …, M; d is the d-dimensional variable space, d = 1, 2, …, D; Xid is the position of the i-th wolf in the d-dimensional variable space; rand (0, 1) is the random number in [0, 1]; Xdmax and Xdmin are the upper and lower space limits of the d-dimension variable.
(2)
Head wolf spawn rules
Calculate the objective function value Y of M wolves in the initial wolf pack, then select the wolf with the minimum value of Y as the head wolf Xa, with its objective function value being Ya.
(3)
Wandering update
According to the value Y of each wolf, the detection wolves are the J wolves with the best positions in the wolf pack, excluding the head wolf. These detection wolves walk in G different directions around themselves. If a better position is found, the detection wolf is updated. The wandering update is stopped when the updated position of the detection wolf is better than that of the head wolf or when the number of walks S reaches the maximum. The wandering update formula is expressed as follows:
X j d s = X j d + r a n d ( 1 , 1 ) s t e p a
where j is the j-th detection wolf, j = 1, 2, …, J; s is the number of wandering updates, s = 1, 2, …, S; Xjds is the position in the d-dimensional space after the s-th walk of the j-th detection wolf; Xjd is the position in the d-dimensional space of the j-th detection wolf; rand (−1, 1) is the random number between −1 and 1; stepa is the walking step size.
(4)
Raiding update
The fierce wolves are the T (T = MJ − 1) wolves in the wolf pack, excluding the head wolf and detection wolves. They start a search for the head wolf with a larger step size. At the same time, the fierce wolves may search away from the head wolf with a certain probability, which helps the wolves escape from the local optimum. If the new position is better than the current position, the fierce wolves are updated, and the formula is as follows:
X t d = X t d + r a n d ( 1 , 1 ) s t e p b ( X a d X t d )
where t is the t-th fierce wolf, t = 1, 2, …, T; Xtd is the position of the t-th fierce wolf in the d-dimensional space; stepb is the raiding size; Xad is the position of the head wolf in the d-dimensional space.
(5)
Siege update
The T fierce wolves launch a siege on the prey with a smaller step size. If a better position is found, the fierce wolf is updated; otherwise, the position remains unchanged. The siege update formula is as follows:
X t d k + 1 = X t d k , r a n d ( 0 , 1 ) θ X a d + r a n d ( 1 , 1 ) s t e p c ( X a d X t d ) ,   r a n d ( 0 , 1 ) > θ
where k is the number of wolf-pack iterations; X t d k is the position of the t-th wolf in the d-dimensional space after k iterations; θ is the threshold; stepc is the siege step size, and its value is determined by Equation (14):
s t e p c = s t e p c m i n ( X m a x X m i n ) e x p ln s t e p c m i n s t e p c m a x k k max
where stepcmax and stepcmin are the maximum and minimum values of the siege step size, respectively, and kmax is the maximum iterations.
(6)
Wolves elimination mechanism
According to Equation (10), L wolves are generated randomly to replace the worst L wolves in the wolf pack, where L is 5% of the initial population. This step ensures the diversity of the wolf pack. The process then returns to step (3) and proceeds to the next iteration.
(7)
Optimal solution output.
When the iterations reach the maximum kmax, the calculation is terminated. The position of the head wolf and its objective function value represent the optimal solutions. Please note that if a wolf’s position is better than that of the head wolf, the head wolf will be updated immediately.

3.2. Improved Wolf-Pack Algorithm

In this article, two strategies are considered to improve the performance of WPA. The first step involves initializing the population by the Halton sequence. Typically, a Pseudo-random number is used, which can lead to sample overlap. Therefore, low-bias sequences such as the Halton, Sobol, and Hammersley sequence have been proposed, with the Halton sequence being a fundamental and user-friendly choice [28,29].
The hybrid approach that combines two or more meta-heuristic algorithms is a trend in enhancing algorithm performance [30,31]. Consequently, the other strategy introduced is simulated annealing (SA), inspired by the tendency of objects to transition into a low-energy state during the metal annealing process [32]. The SA starts with an initial solution and improves it through iterative small changes, which may sometimes lead to a local optimum. To mitigate this issue, SA accepts worse solutions with a certain probability.
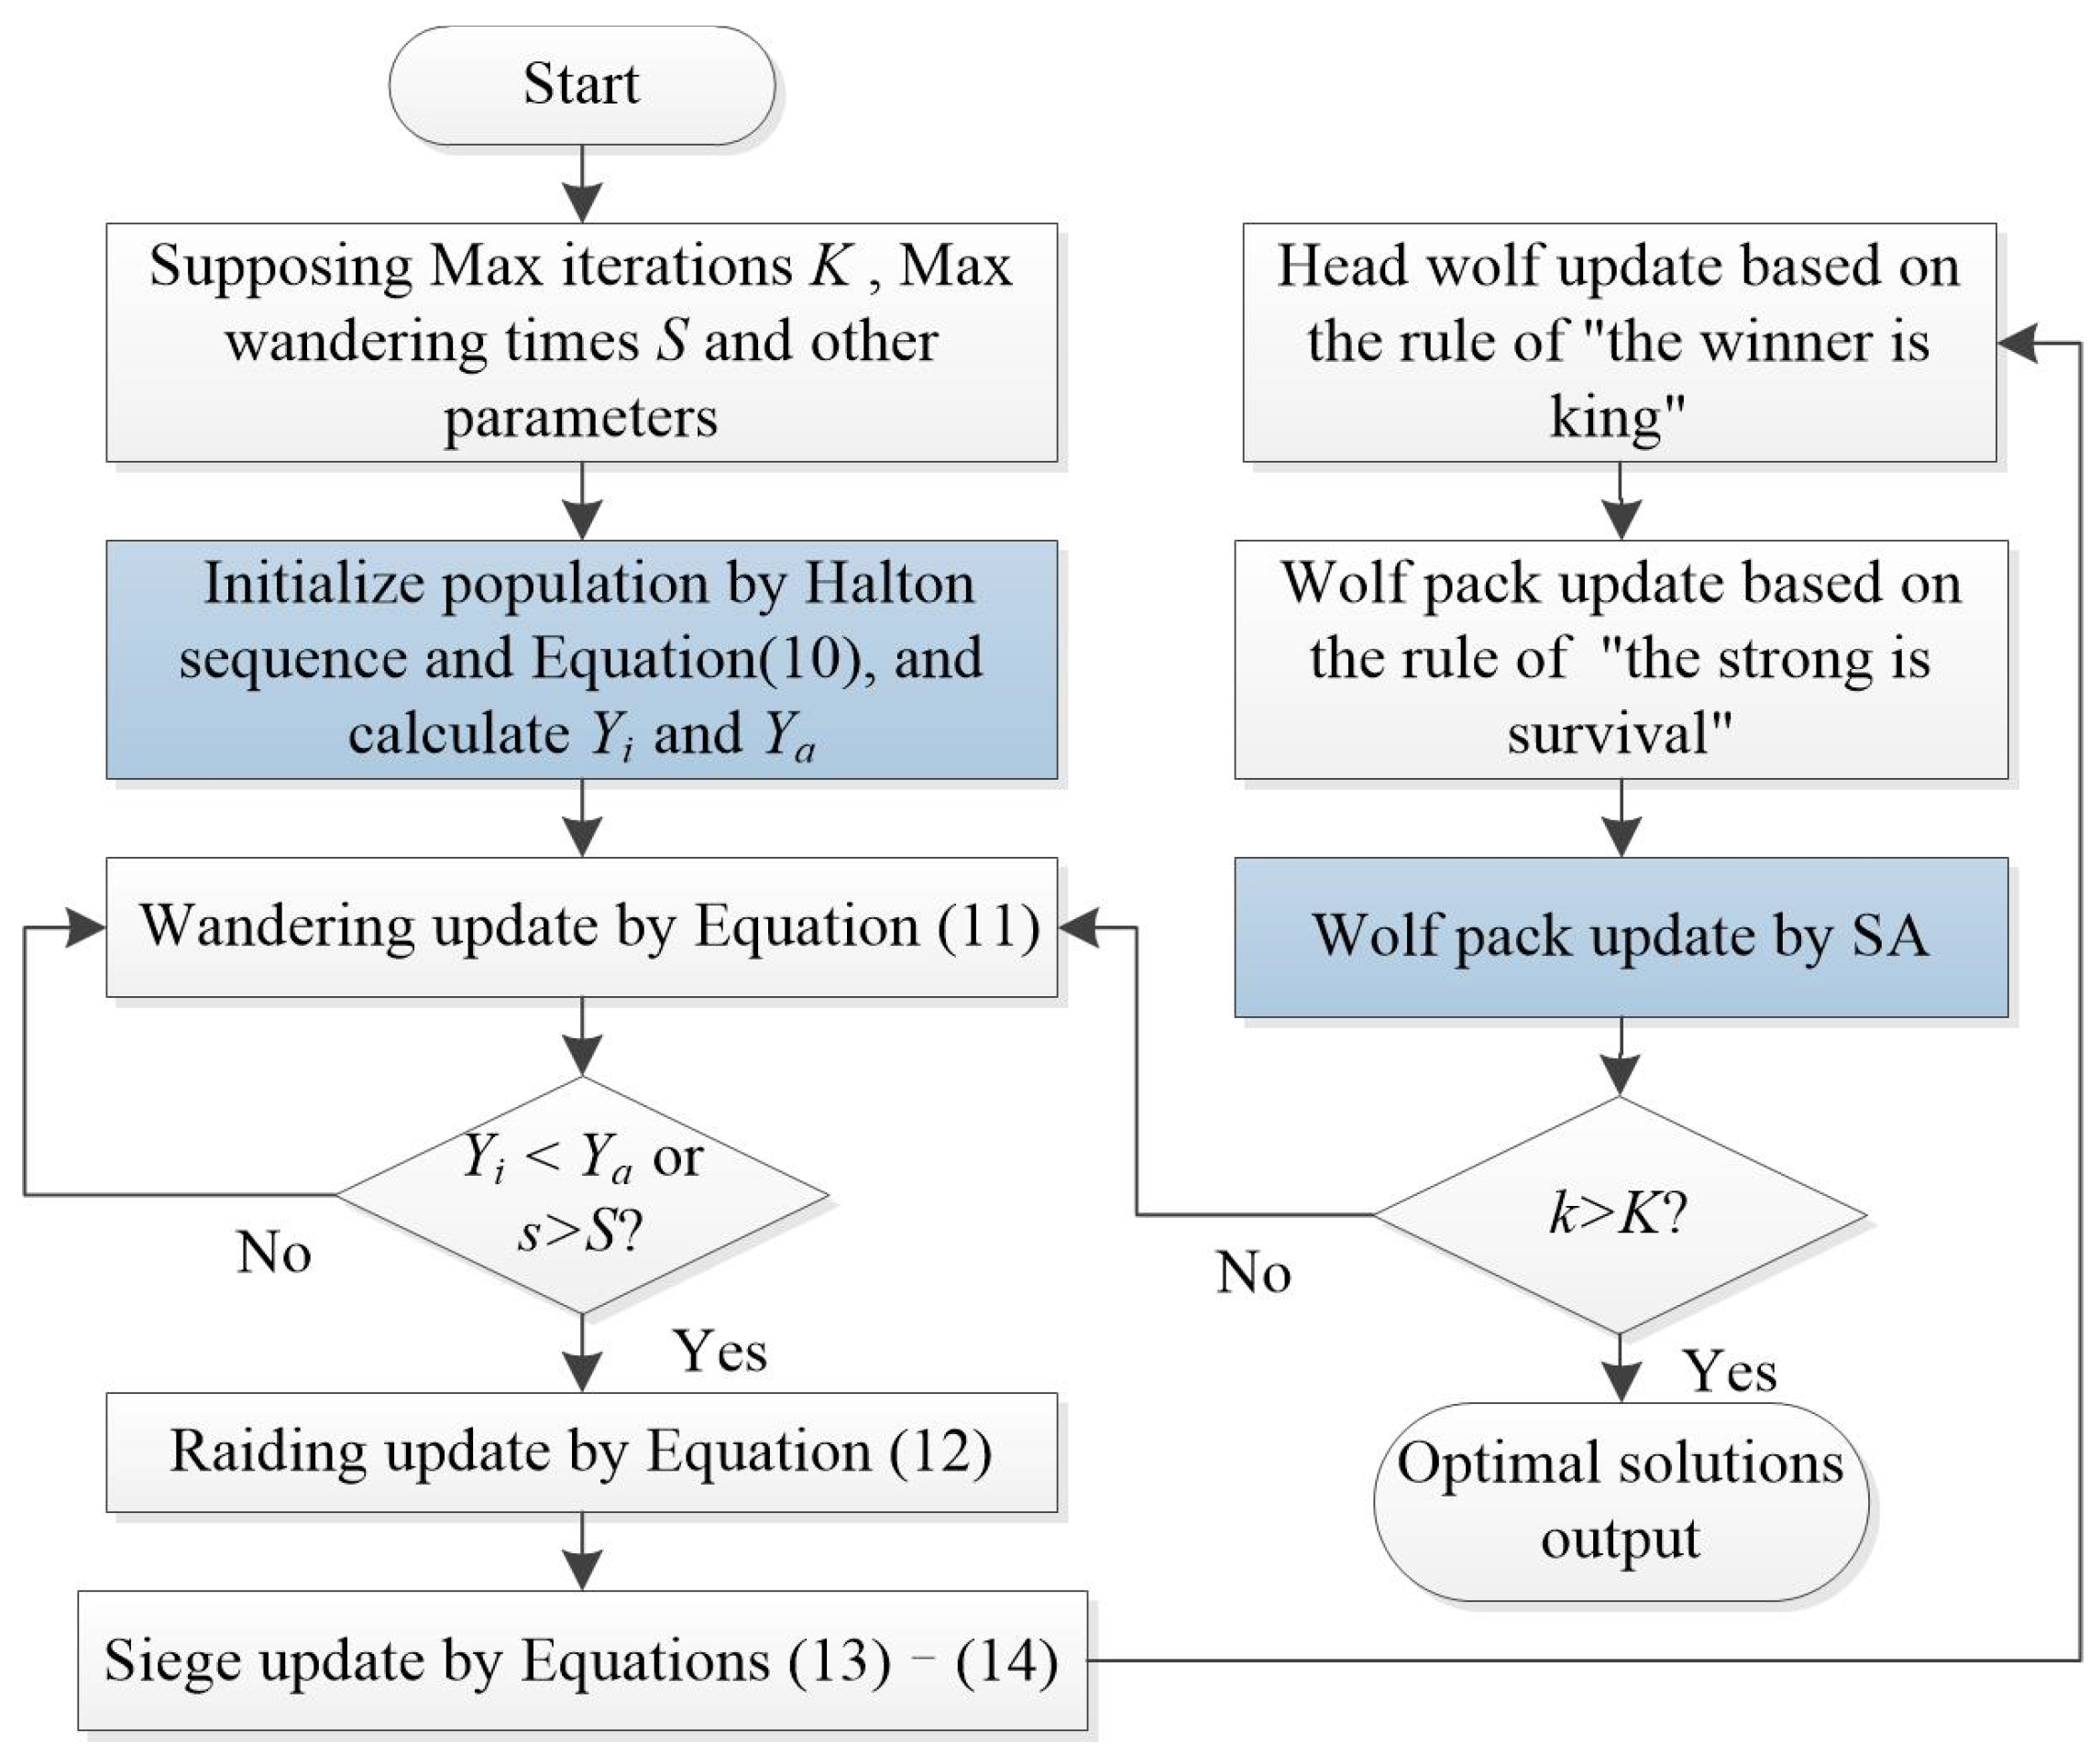
An improved wolf-pack algorithm (IWPA) was proposed, incorporating the two strategies mentioned above based on WPA. The flow chart of the IWPA is shown in Figure 2.

3.3. Performance Evaluation

Ten benchmark functions from the CEC2017 function sets [33] are used to evaluate the performance of the IWPA, as shown in Table 1. The first five functions are unimodal, while the remaining five functions are multimodal. The parameter m denotes the dimension, and fmin represents the global minimum. The performance of IWPA is compared with that of PSO, GA, and WPA. The initial population and iteration number for all four algorithms are set to 200 and 1000, respectively. In the IWPA and WPA, the walk step size stepa was 0.3, the raid step size stepb was 2, the minimum siege step stepcmin was 0.5, the maximum siege step stepcmax was 105, the number of detection wolves J was 10, the number of walking directions G was 5, the maximum wandering times S was 15, and the threshold θ was 0.2. In the SA, the annealing rate λ was 0.98, the search step size step was 0.01, and the maximum iterations kmax was 100. In the PSO, the minimum speed vmin and the maximum speed vmax of the particle were −0.5 and 0.5, the inertia weight ω was 0.9, and the learning factors c1 and c2 were both 0.5. In the GA, the crossover probability pc was 0.8, the mutation probability pm was 0.01, and the generation gap Gp was 0.95. If the solution is less than 10−16, it is recorded as 0. Each test function is run 50 times to obtain the statistical findings, including the minimum, mean, and standard deviation (SD), as shown in Table 1.
The minimum value in Table 1 can reflect the convergence ability of the algorithms. The results indicate that all four algorithms achieve high convergence accuracy, reaching 106 for low-dimensional functions such as Matyas, Sum Squares, and Booth. However, for the high-dimensional unimodal function Zakharov, the convergence of the PSO and GA is poor, with accuracy only reaching 103, which is significantly worse than that of the WPA and IWPA. For the multimodal function Michalewicz, the accuracy of the PSO and GA does not even reach 101. As the function dimension increases to 10 or higher number, the convergence accuracy of the PSO, GA, and WPA deteriorates, whereas the IWPA maintains accuracy up to 108. Hence, the proposed IWPA demonstrates strong convergence ability when dealing with multimodal and high-dimensional functions.
The mean and standard deviation can reflect the stability of the algorithm. For low-dimensional functions, the mean and standard deviation of all four algorithms are small, which indicates better stability. However, as the function dimension increases to four or higher, the mean values of the PSO, GA, and WPA deviate from the global minimum, and the standard deviation increases significantly. In contrast, the mean and standard deviation of the IWPA remains below 106, demonstrating that the IWPA has good stability for dealing with multimodal and high-dimensional problems.
Consequently, the proposed IWPA demonstrates strong search performance and is recommended for complex engineering problems.

3.4. Solution Process of Models with IWPA

The mathematical models of a WDS with CPSs described in Section 2 are multimodal and high-dimensional. It can be inferred that the IWPA is well-suited for solving these models. In this study, the decision variables include the head of each pumping station, the number of running pumps, and the flow rate of each pump. For blade-adjustable pumps, the flow rate is controlled by the blade angles. The head of each pumping station, or head allocation, is determined by the outer-layer model and is initialized and updated using the outer-layer IWPA. The number of running pumps and flow rate of each pump in a single-stage pumping station are determined by the inner-layer model and are initialized and optimized using the inner-layer IWPA. The water level–flow rate model is solved by an iterative method.
The traditional method of solving double-layer models involves double nesting. Specifically, the program used to solve the inner-layer models functions as a subroutine, which is called by the main program solving the outer-layer model. In Figure 3, the part of solid lines is the flow chart based on the double-nesting method. It is evident that once the inter-stage head is updated, the subroutine of the inner-layer IWPA and the iteration of the water level–flow rate model are repeatedly invoked, leading to increased computational load and CPU time.
To avoid repeat calculation, a method of creating a scheme library was proposed as an alternative to invoking the inner program, as indicated by the dotted lines in Figure 3. All high-quality solutions that meet accuracy requirements are pre-calculated under permissible operating conditions. Two independent scheme libraries are created and stored in the computer for the two inner-layer models. Scheme library A stores solutions of single-stage pumping stations, including flow rate, head, pump blade angles, number of running pumps, power consumption, and CPU time. In addition, the water level and flow rate of the first and end cross-section of all channel segments are stored in scheme library B.

4. Computational Application

4.1. Case System

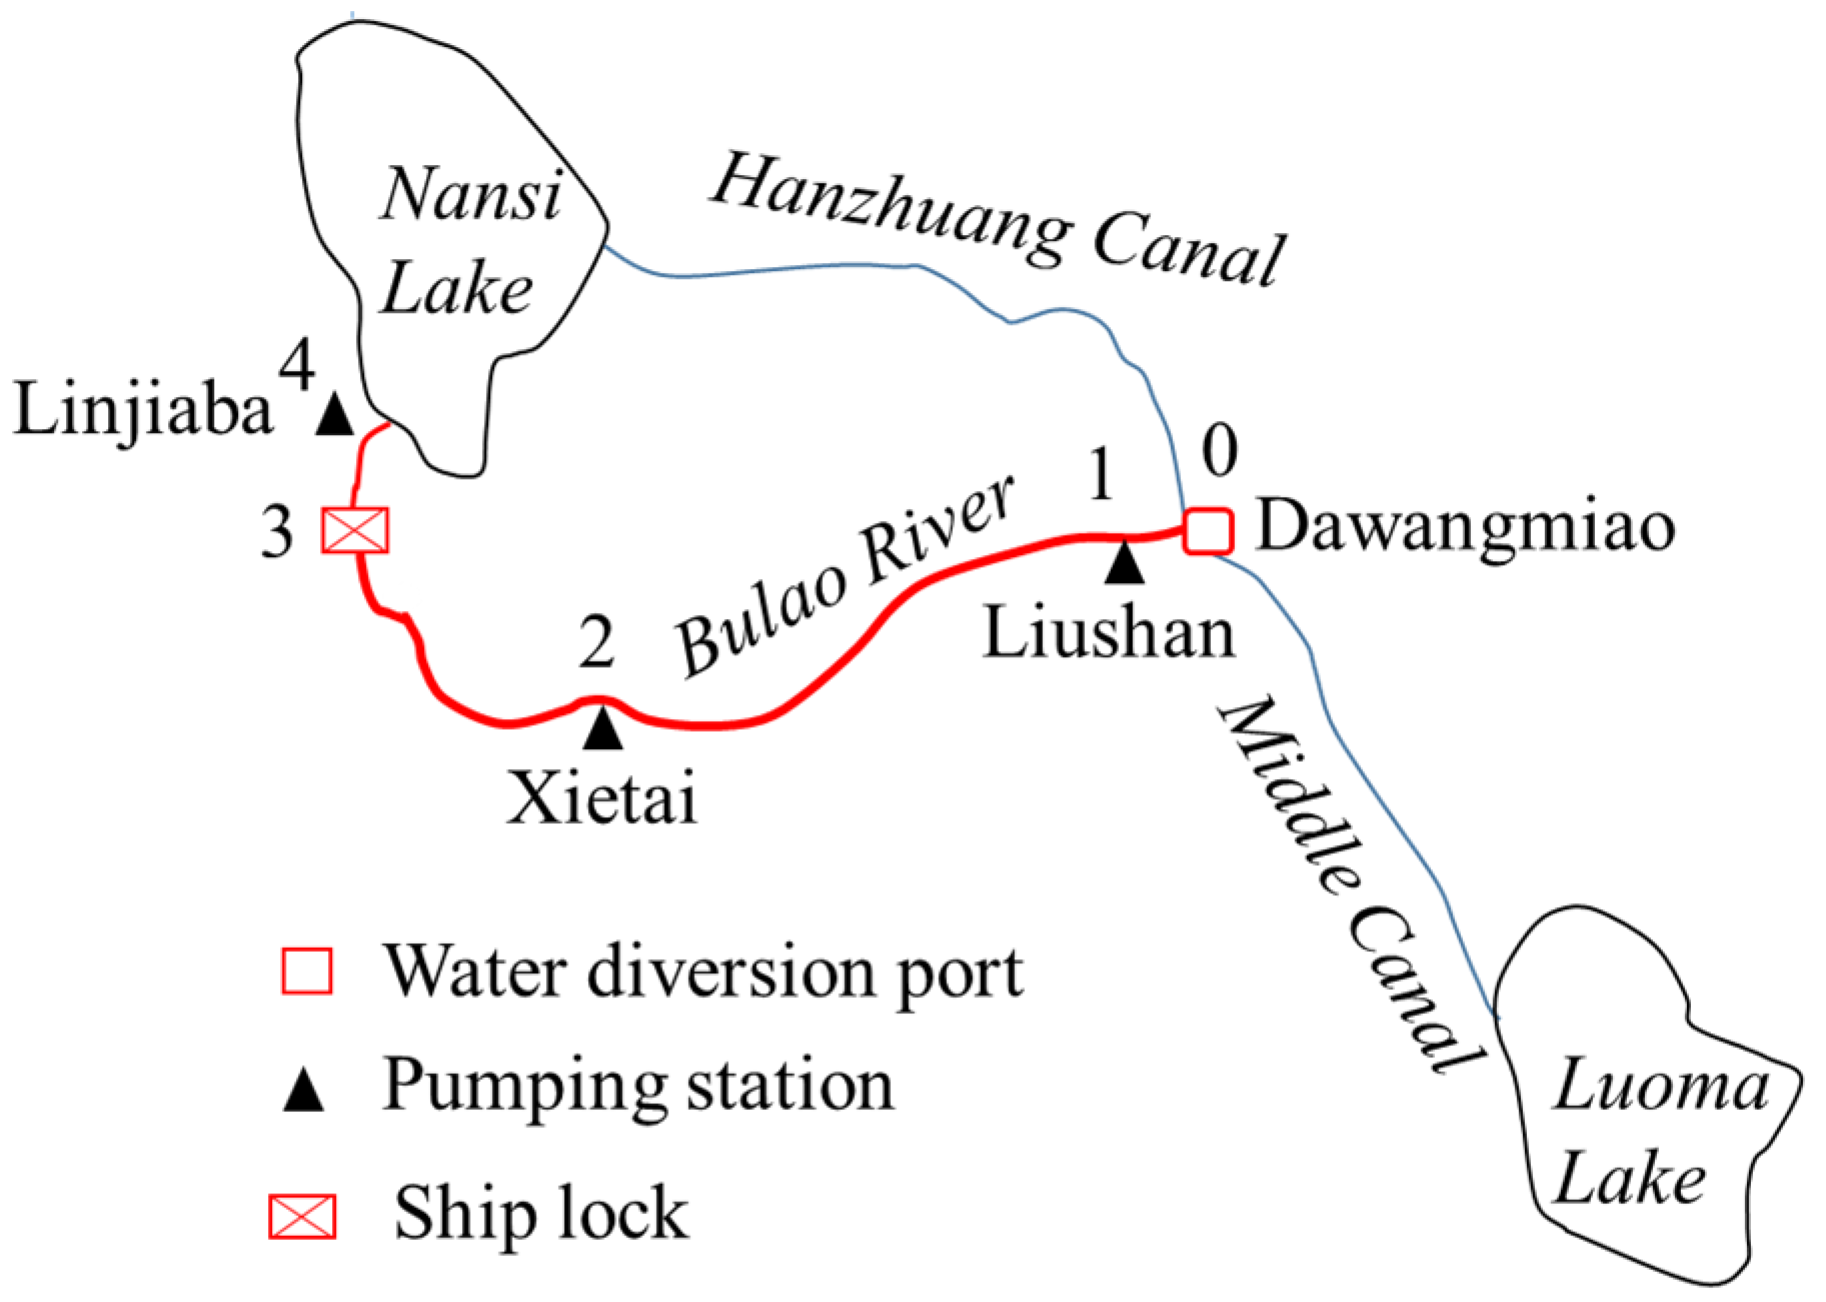
South-to-North Water Diversion Project of China is the largest WDS in the world and consists of three routes: eastern, central, and western. The eastern route diverts water from the mainstream of the Yangtze River near Yangzhou in Jiangsu Province to Tianjin and Jiaodong area in the Shandong Province through CPSs with 13 stages. This route connects Hongze Lake, Luoma Lake, Nansi Lake, and Dongping Lake with the Beijing–Hangzhou Grand Canal and its parallel river channels. As illustrated in Figure 4, water from Luoma Lake is transferred to the water diversion port at Dawangmiao (DWM) via the Middle Canal and then transmitted to Nansi Lake (NSL) by flowing along two rivers. Along the Bulao River, the Liushan (LS), Xietai (XT), and Linjiaba (LJB) pumping stations progressively lift the water. The study focuses on a WDS with three-stage pumping stations along the Bulao River, with a planned pumping flow rate to the NSL of 75 m3/s.
The types and parameters of the equipment installed at the pumping stations are listed in Table 2. The pumps are blade-adjustable. The water channel parameters are detailed in Table 3. Since the Linjiaba pumping station is close to the Nansi Lake, the channel loss of this section is considered negligible.

4.2. Calculation Results

4.2.1. Scheme Library

Within the operation limits of pumping stations, the calculation accuracy of the head and flow rate was 0.01. The IWPA was employed to solve the optimal model of single-stage pumping stations under all operating conditions. The initial population size and maximum number of iterations were set to 200 and 300, respectively, with the calculation program executed 30 times for each condition. The decision solutions included the minimum values of the objective function and operational schemes. There are 5,527,832, 2,168,500, and 3,760,199 groups of valid data for the LS, XT, and LJB pumping stations, which were stored in scheme library A. A portion of the data from scheme library A is shown in Table 4.
For the water channel from DWM to NSL, the calculation accuracy for the water level was also 0.01, within the limits of the water level and flow rate. The iterative method was used to solve the channel water level–flow rate model, resulting in 1,259,889, 1,073,751, 1,010,101, and 3,913,854 groups of data for each channel segment, which are stored in scheme library B. Partial groups of channel level and flow rate are listed in Table 5.

4.2.2. Optimal Schemes

(1)
Using scheme library method
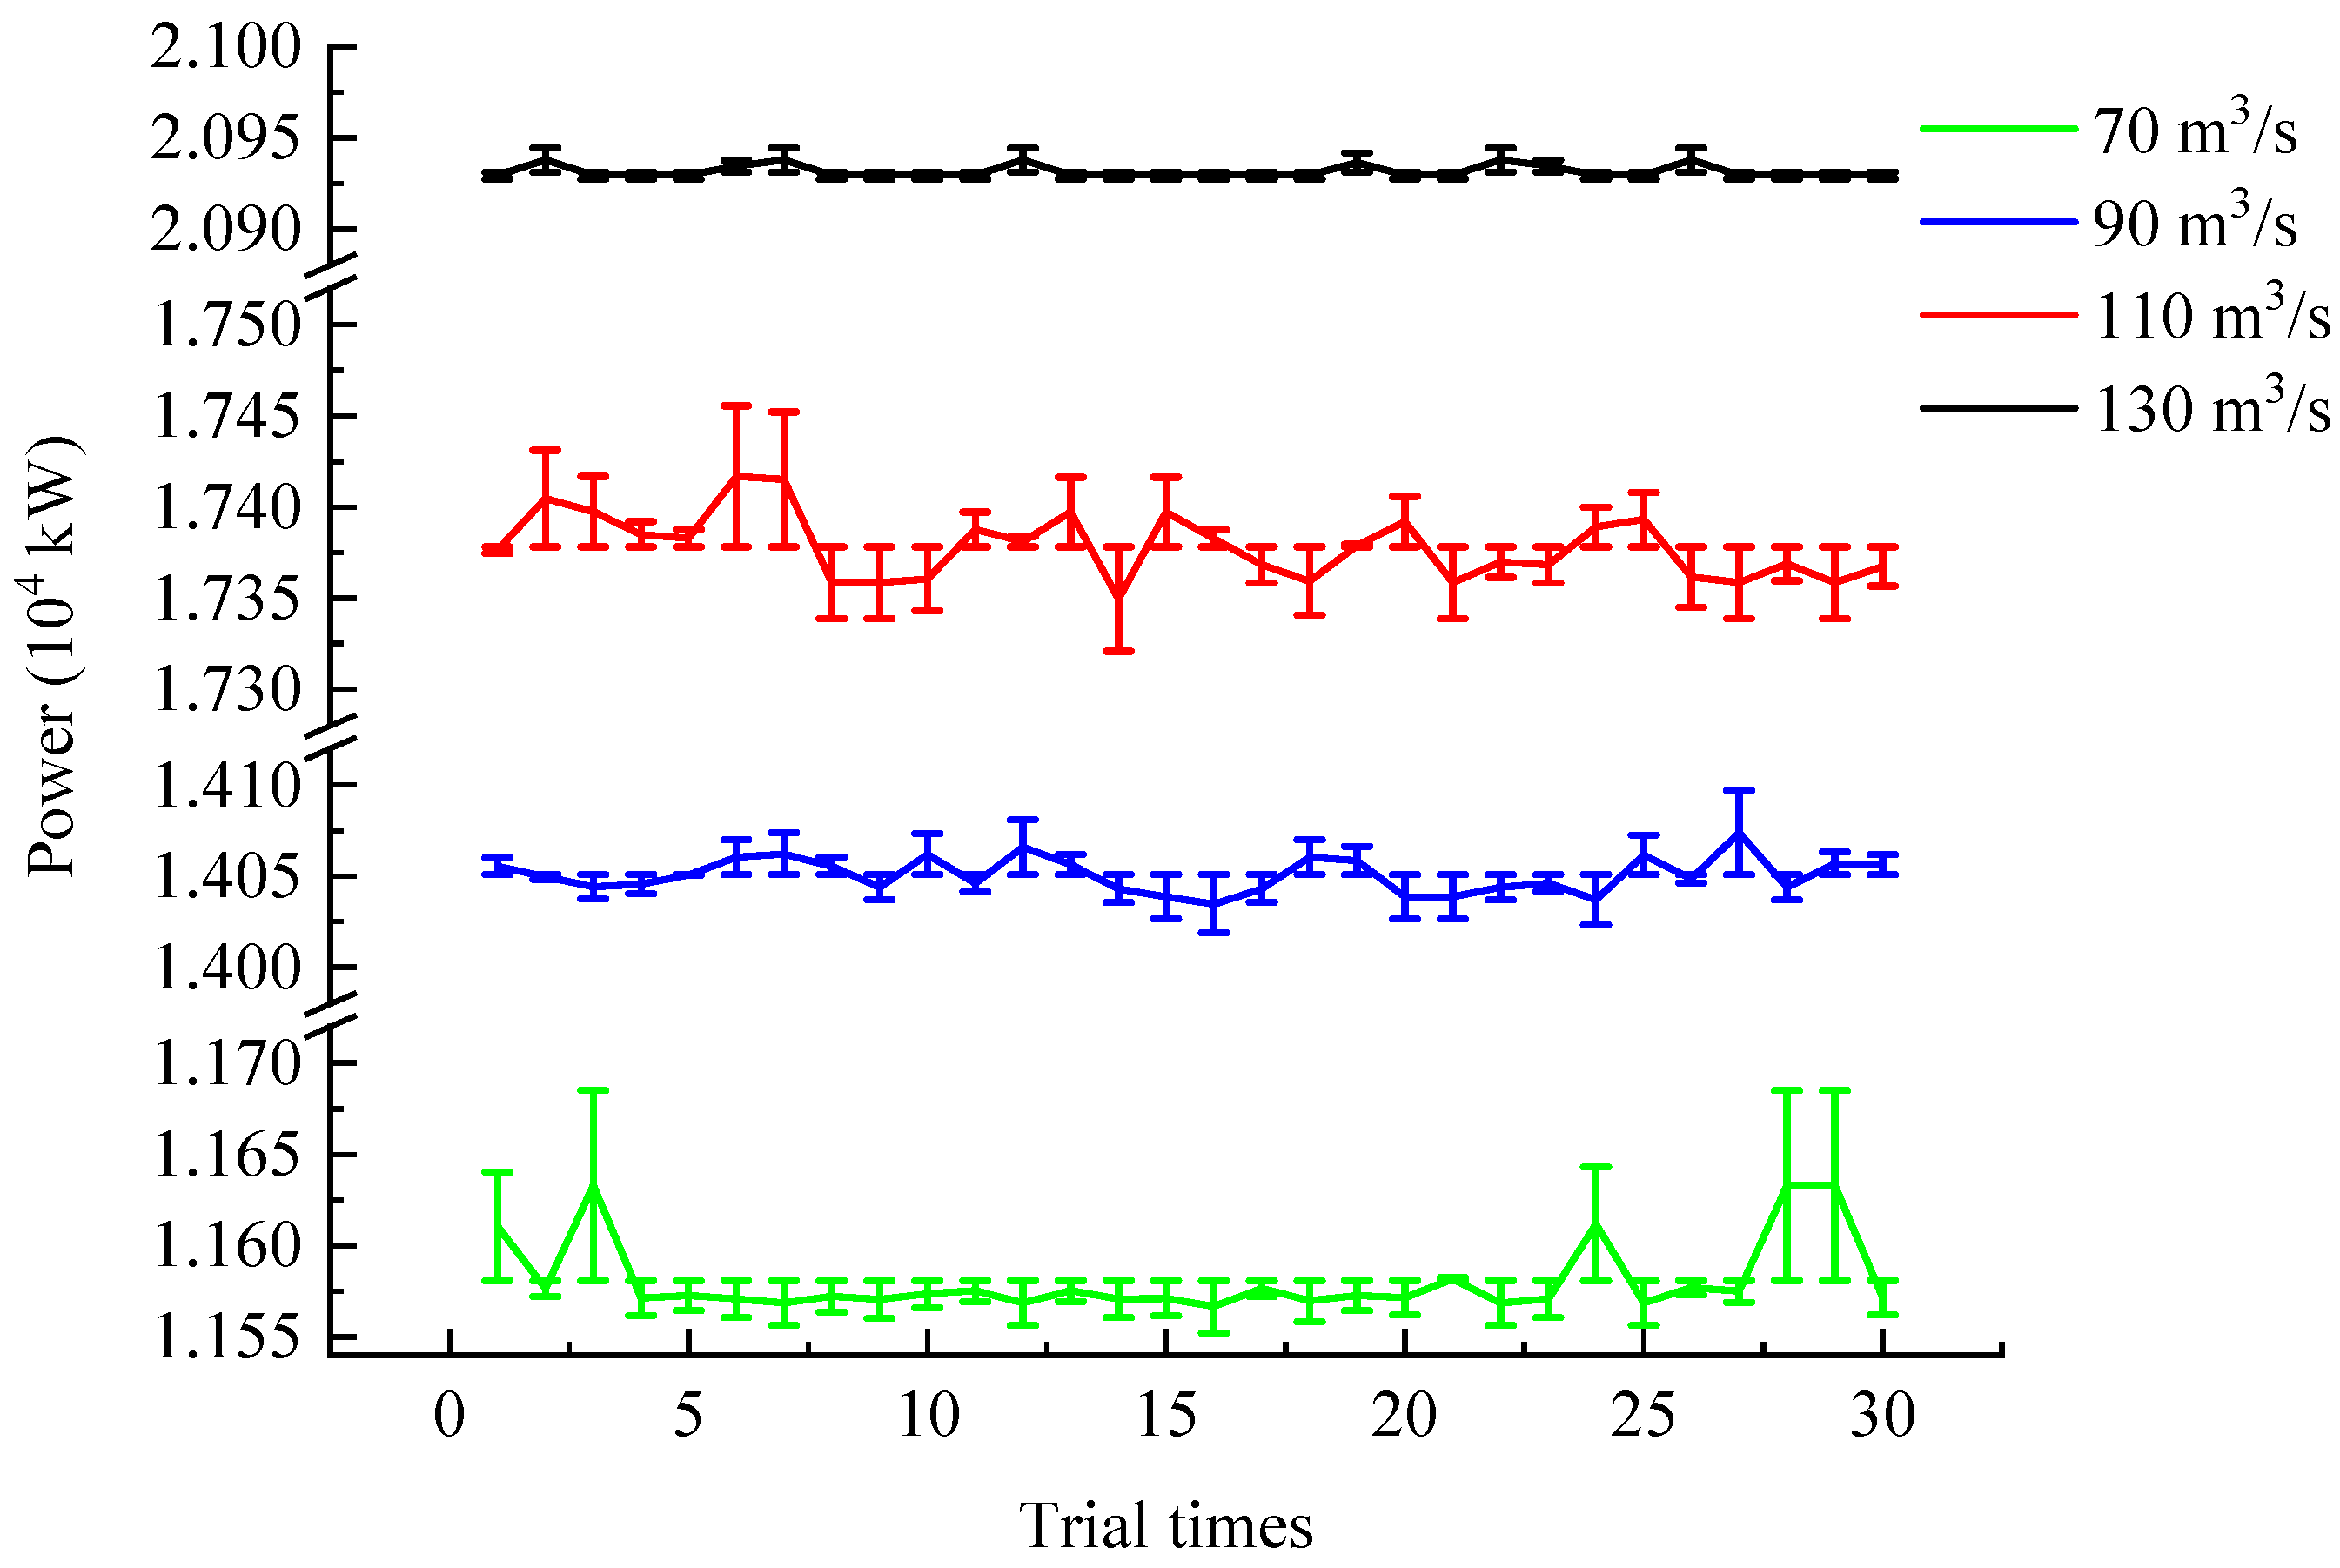
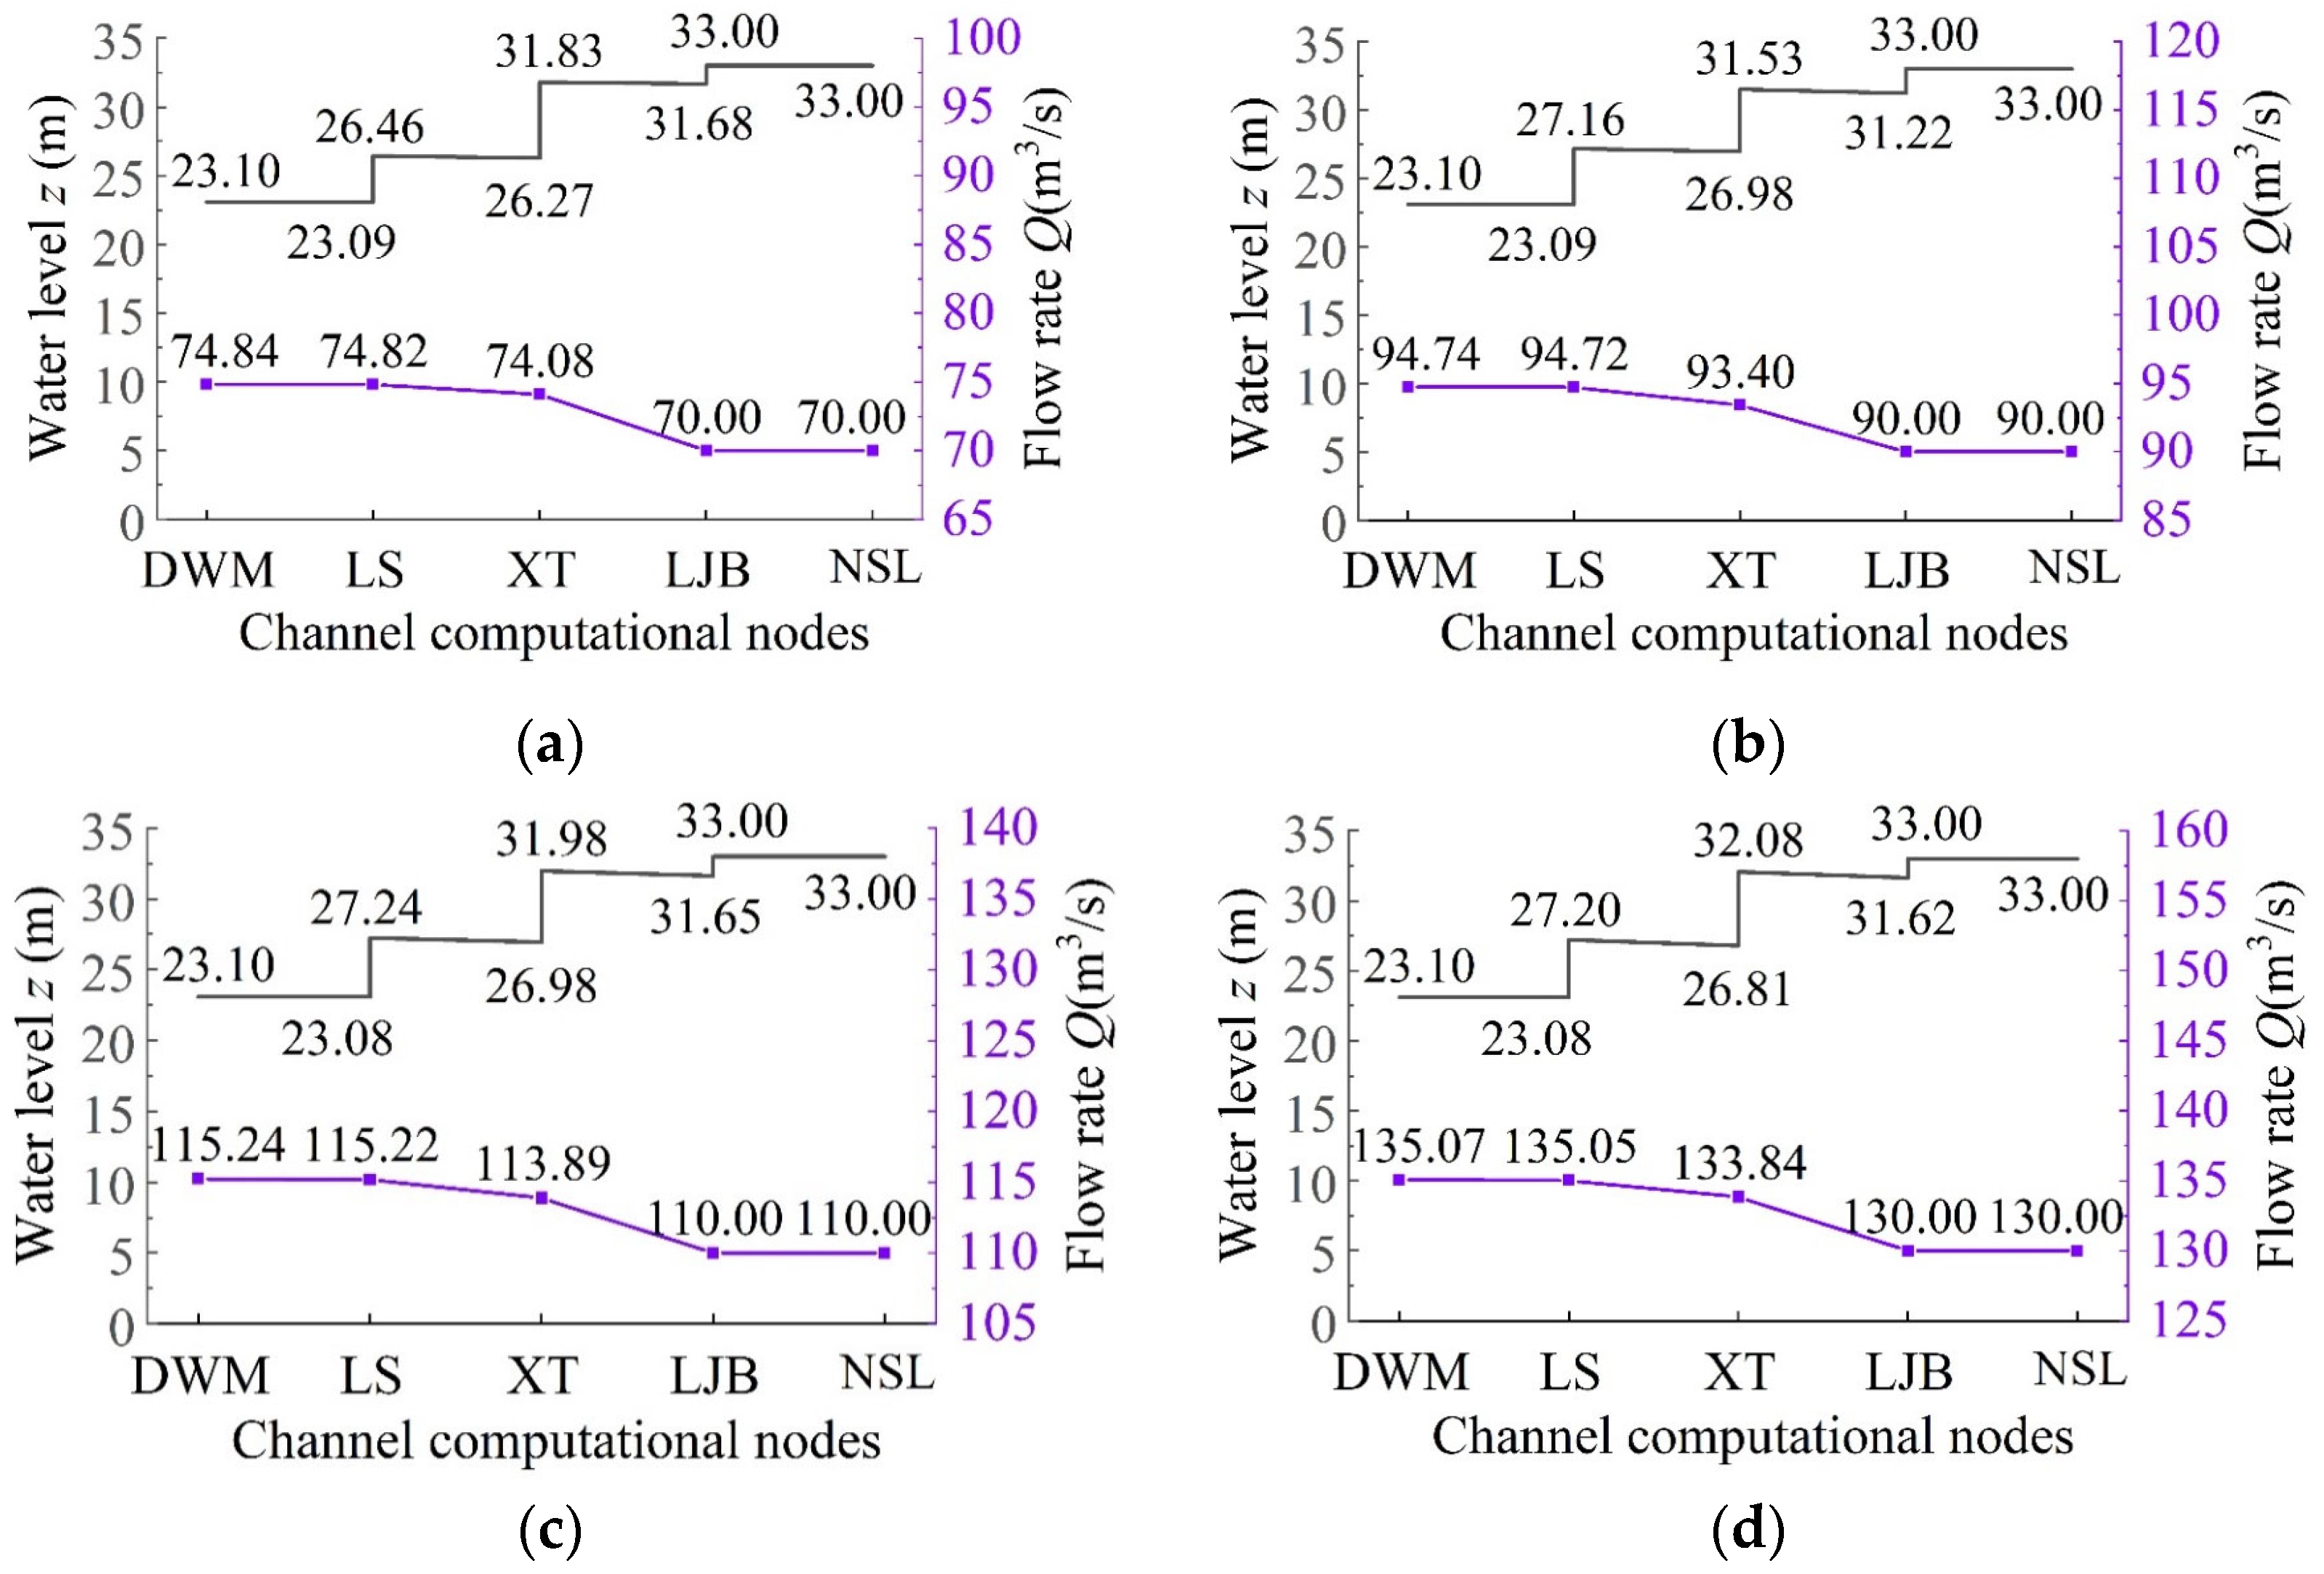
Assuming that the water level zin at the DWM is 23.1 m, zout at the NSL is 33.3 m, and the required flow rate Qr is 70, 90, 110, and 130 m3/s, the IWPA was employed to determine the optimal head allocation among the stages. The initial population size and number of iterations were set to 200 and 100, respectively. During the calculation process, the water level and flow rate of the channels were retrieved from scheme library B. The blade angles, number of running pumps, and power consumption of single-stage pumping stations were sourced from the scheme library A. Solutions for the given working conditions were obtained through 30 trial calculations. The error bar, representing the difference between the objective function value and mean value, is shown in Figure 5. The relative standard deviation, which is the standard deviation as a percentage of the mean value, ranges from approximately 0.02% to 0.17%. Among the 30 trial calculations, the solutions with the minimum objective value were selected as the decision schemes. The calculations were performed on the computer with a Windows 11 operating system, Intel Core i7-10700 CPU, Intel Xeon E5-2640 v4 processor, 16 GB of memory, a 2 TB HDD, and Matlab 2016a. The average CPU running time was approximately 380 s.
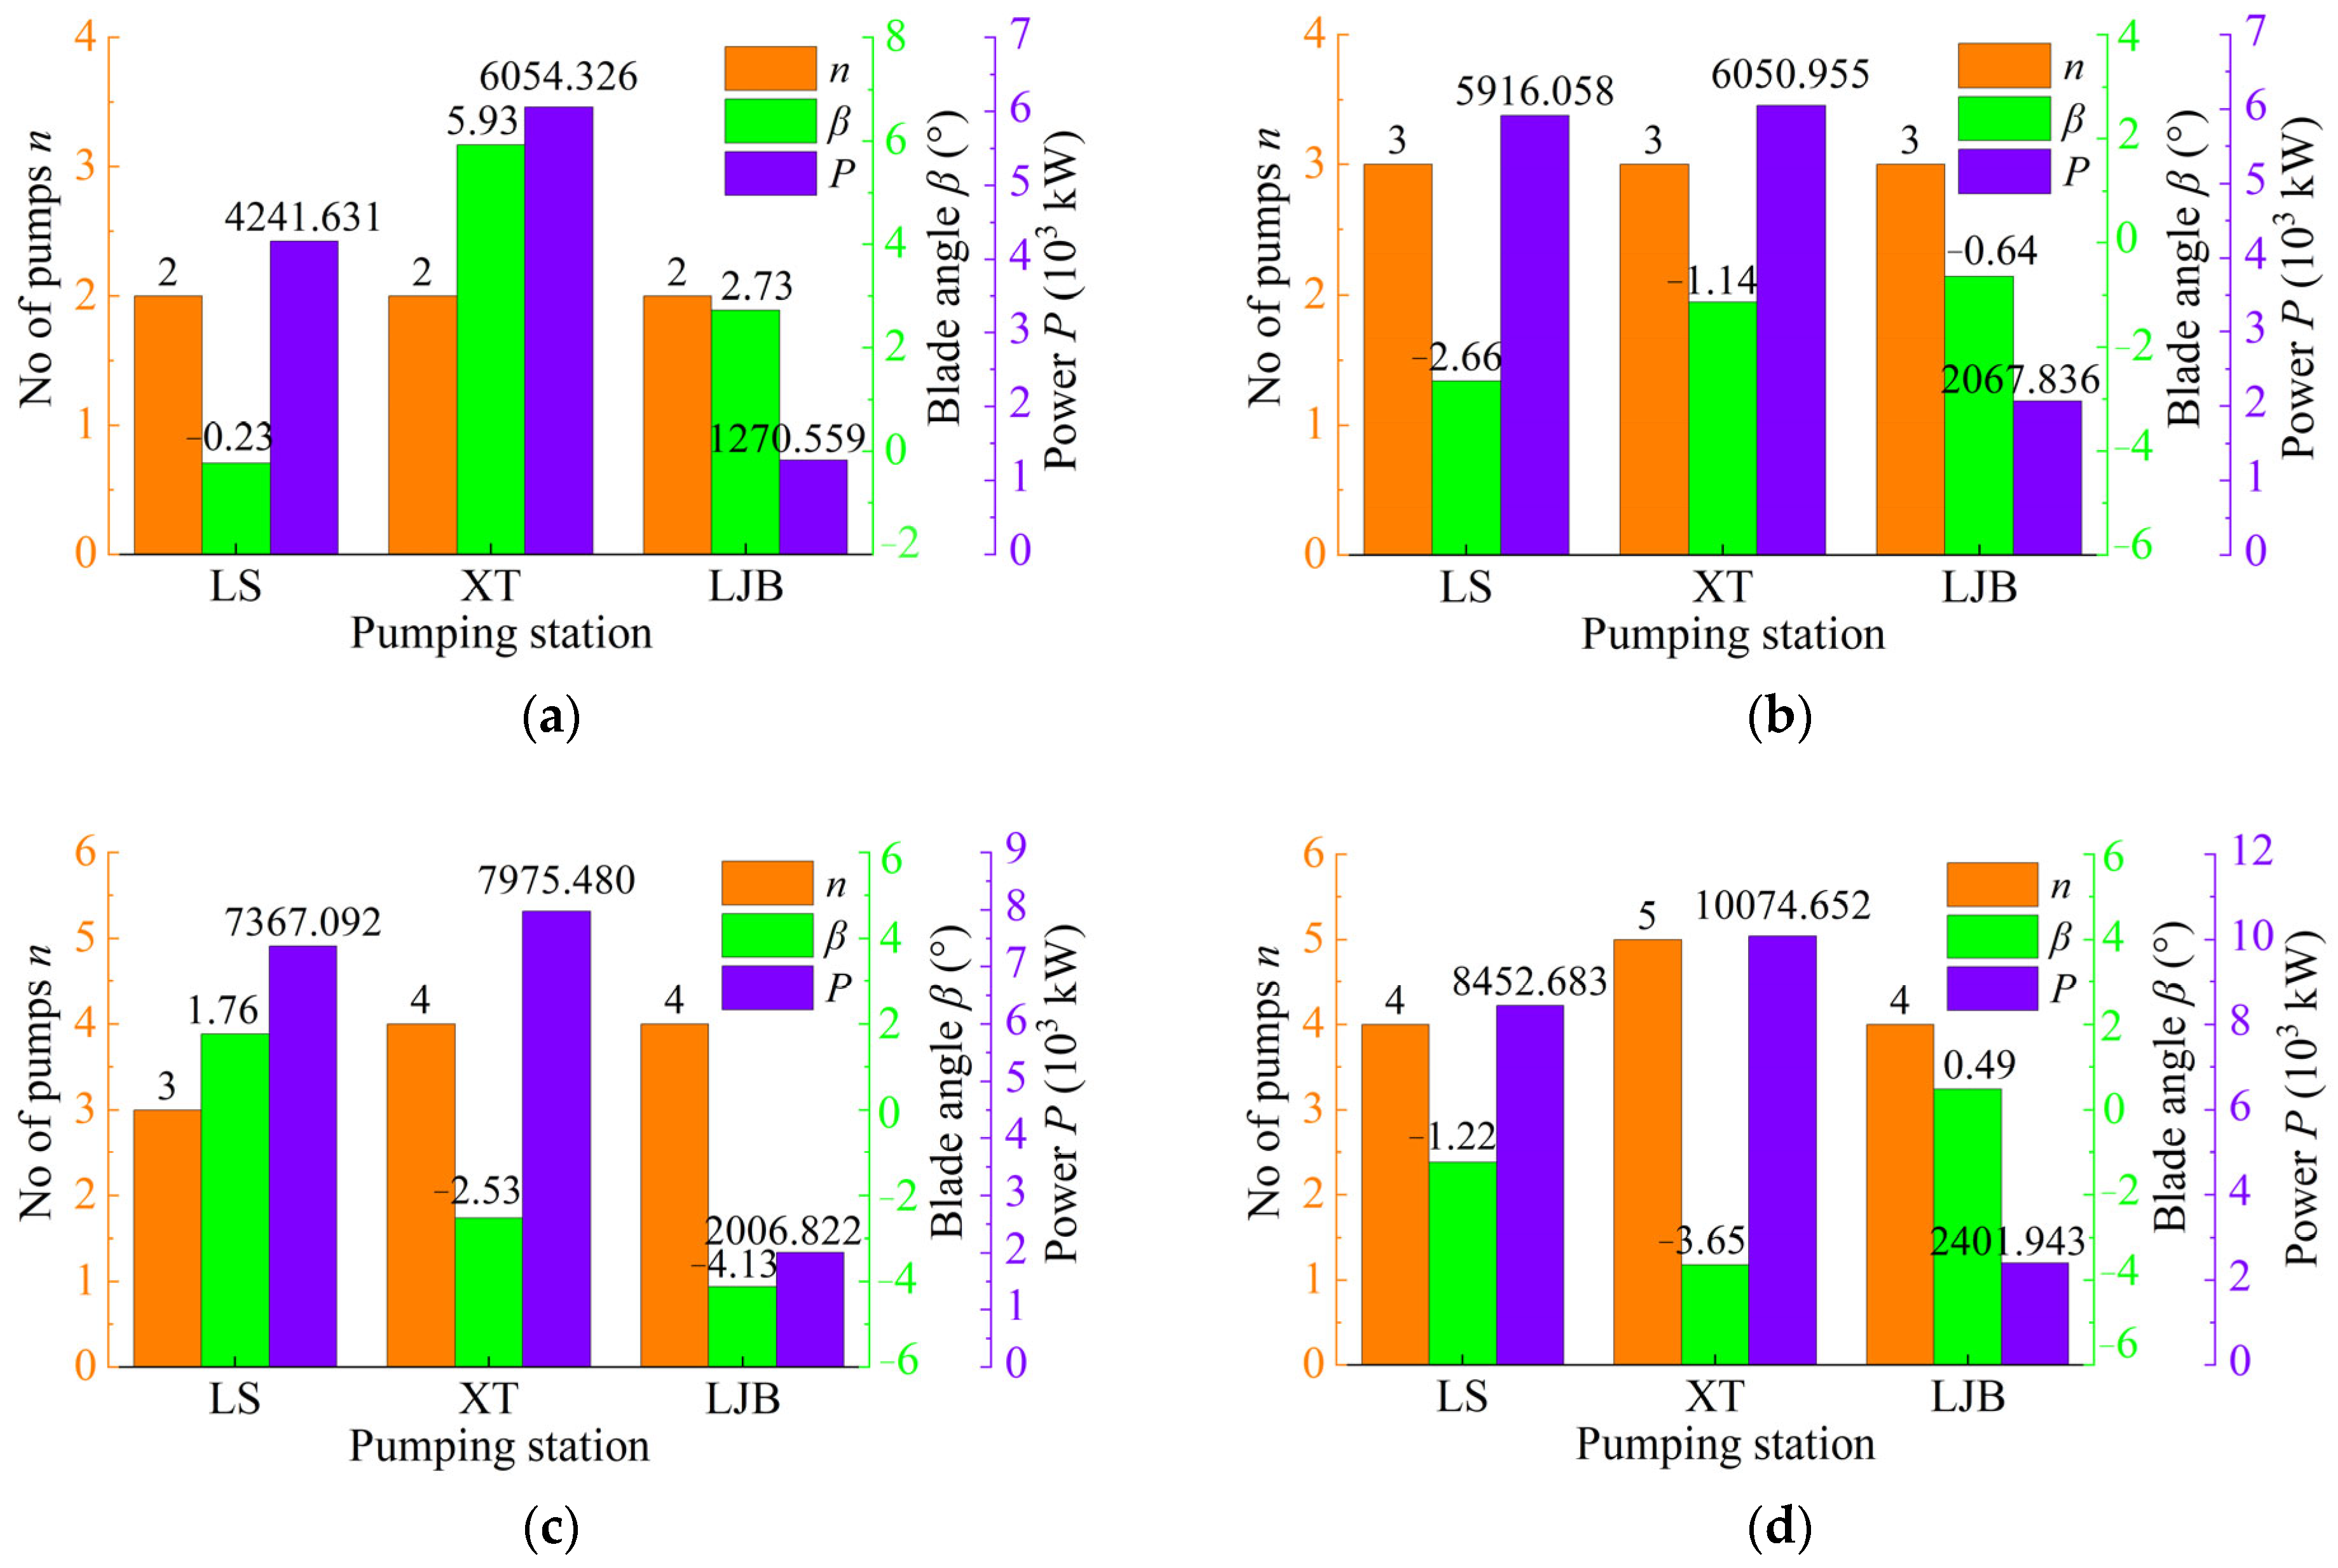
Figure 6 illustrates the optimal schemes for the inner-layer model of each pumping station; Figure 7 displays the water level and flow rate of the inner-layer model for each channel segment; and Figure 8 presents the head allocation results among the stages of the outer-layer model.
(2)
Using the double-nesting method
Double-nesting methods are also employed to solve the models and to demonstrate the efficiency of the scheme library method. In the double-nesting method, the IWPA is used to determine optimal schemes for each pumping station in the inner layer and head allocation in the outer layer. The key difference is that, in this approach, the procedures for the inner IWPA, water level, and flow rate of the channel were repeatedly called by the outer IWPA. The results display that the objective function value is 0.4% lower than that obtained using the scheme library method. However, the running time for the double-nesting method is over 10 h on the same CPU.

5. Analysis and Discussion

To describe the calculation efficiency while ignoring the hardware and software of the computer, the computational complexity of the methods was analyzed.
For the new method using IWPA and scheme library, it is assumed that M is the population scale of the wolf pack; K is the maximum iterations of WPA; L is the maximum iterations of SA; D is the dimensions of the outer-layer model; and T is trial calculation times. In this case, D = 3, T < M, K < M, and L < M. The time complexity of each operation is listed in Table 6, from which it can be inferred that the time complexity of the new method is O (T × M2) ≈ O (M2).
For the double-nesting method, two-layer IWPA was used to solve the models. In the inner layer, the IWPA determined the optimal schemes for each pumping station. It is assumed that M1 is the initial population of the wolf pack, of the same order of magnitude as M; K1 is the maximum iterations of WPA; L1 is the maximum iterations of SA; D1 is the variable dimensions; R1 is the iteration number of water level and flow rate in the channel, which depends on the step size and channel length; and T1 is trial calculation times. Here, D1 = 2, T1 < M1, K1 < M1, and L1 < M1. Similarly, the time complexity of the IWPA of the inner layer is O (M12), and that for channel level and flow rate is O (R1). In the outer layer, the parameters are the same as those used in the proposed new method. Therefore, the time complexity of each operation is detailed in Table 7, and the time complexity of the double-nesting method is O (T × M4) ≈ O (M4).
From the above analysis, the time complexity of the new method is reduced to O (M2), indicating fewer calculations and reduced CPU time. In contrast, the CPU time of the new method is about 1% of that required by the double-nesting method, therefore achieving real-time solution capabilities.
Furthermore, the results from Reference [5] utilized a dichotomy approach to determine the flow rate and water level of two parallel channels, which improved calculation efficiency by reducing time complexity. However, this approach may not be applicable to systems with three or more parallel water channels. Thus, the scheme library method demonstrates broader applicability.
To illustrate the economic benefits of the optimization schemes, the actual schemes for the case were calculated, as shown in Figure 9. In these actual schemes, the blade angles are fixed at 0°, and the head of each pumping station should be at the design value, leading to a mismatch in water level. For example, if the head of the LJB pumping station is fixed at the design value of 2.40 m, the heads of other pumping stations are adjusted based on water level coordination. From Figure 8 and Figure 9, it can be observed that the total head —comprising the sum of the heads of the three pumping stations—rises with the required flow rate due to increased water and hydraulic losses. Compared to the actual schemes, the optimal schemes result in a total head that is 0.5 m lower, with significant variation in the head of each pumping station. This variation leads to different operation schemes and power consumption.
In the actual schemes, the blade angles are typically fixed at a design angle of 0°, and the number of running pumps is an integer. Consequently, the flow rate often exceeds the requirement of a single pumping station. To ensure a comparable energy consumption between the actual and optimal schemes, the power consumption per unit flow rate, Punit, is proposed. The results are shown in Figure 10, indicating that the Punit for the actual schemes ranges from 58.48 to 63.73 kW/(m3·s−1), whereas for the optimal schemes, it ranges from 50.07 to 52.19 kW/(m3·s−1). The power consumption of the optimal schemes is 14.37–20.39% lower than that of the actual schemes. The average power savings amount to approximately 16.27% for the optimal schemes. The reasons for this are as follows: In the actual schemes, a blade angle of 0° is the design value, and the operation at this angle is efficient only under the design pump assembly head. Typically, the pump assembly head varies with the water level, making the 0° blade angle suboptimal in most situations. Conversely, the optimal schemes adjust the blade angles based on the varying pump assembly head and required flow rate. Moreover, assuming that each kilowatt-hour of energy saved corresponds to a reduction in CO2 emission of 0.272 kg, it can be estimated that 13–32 tons of CO2 can be saved per day.
In addition, the water supply in the optimal schemes precisely matches the required value, whereas, in the actual schemes, it is higher due to constraints imposed by fixed pump blade angles and the requirement for an integer number of running pumps. This excess water supply, referred to as abandoned water, ranges from 0.18 to 20.18 m3/s, accounting for 0.14% to 18.34% of the required flow rate, as shown in Figure 11. Specifically, the actual schemes result in wasted water resources and energy, while the optimal schemes achieve savings in both.

6. Conclusions

This study focuses on a scheduling problem for a WDS with CPSs. The objective was to develop a method for obtaining optimal solutions quickly to reduce energy consumption, CO2 emission, and water resource use. The following conclusions were drawn:
  • The IWPA was proposed by incorporating the Halton sequence and SA and was tested using ten benchmark functions with varying peaks and dimensions. Compared to PSO, GA, and WPA, the IWPA demonstrated superior convergence ability with respect to the global minimum value and exhibited better stability based on the mean value and standard deviation. Therefore, the IWPA is effective for solving multimodal and high-dimensional models of a WDS with CPSs.
  • For the WDS case, double-layer optimal models were developed and solved using the IWPA. To achieve real-time optimal solutions, a method for pre-establishing a scheme library was proposed to avoid repeated calculations. Compared to the double-nesting method, the time complexity was reduced from quadratic to square order, and the CPU time decreased from 10 h to 380 s using the optimal method, demonstrating the time-efficiency of the new approach.
  • By considering adjustable pump blade angles and head matching among pumping stations, the optimal schemes were obtained using the IWPA method and the scheme library. Compared to actual schemes, the optimal schemes resulted in power savings of 14.37~20.39% and the flow rate reduction of 0.14~18.34%, translating to a decrease in CO2 emissions of 13~32 tons per day. Overall, the proposed method significantly contributes to energy and water resource savings and environmental protection.
  • This study has some limitations. First, the precision of the scheme library was set to 0.01. Higher precision increases CPU time and memory requirements. Therefore, future work will focus on developing machine-learning techniques to reduce the scale of scheme libraries. Second, the water surface line was calculated using iterative methods. Incorporating high-precision hydrodynamic simulations could better account for water and hydraulic losses. Finally, energy savings was the only objective function considered. Future research could explore multi-objective optimization problems considering the reliability and practical of the schemes.

Author Contributions

Conceptualization, X.F. and Y.W.; Methodology, X.F. and Y.W.; Software, Y.W.; Validation, Y.W.; Writing-original draft, X.F. and Y.W.; Writing-review and editing, X.F., X.S. and B.Q.; Supervision, X.F.; Funding acquisition, B.Q. All authors have read and agreed to the published version of the manuscript.

Funding

This work was funded by the National Natural Science Foundation of China (Grant No. 52179091).

Data Availability Statement

The data presented in this study are available upon request from the corresponding author upon reasonable request.

Conflicts of Interest

The authors declare no conflict of interest.

References

  1. Khadra, R.; Moreno, M.A.; Awada, H.; Lamaddalena, N. Energy and hydraulic performance-based management of large-scale pressurized irrigation systems. Water Resour. Manag. 2016, 30, 3493–3506. [Google Scholar] [CrossRef]
  2. Turci, L.D.; Wang, J.C.; Brahmia, I. Adaptive and improved multi-population based nature-inspired optimization algorithms for water pump station scheduling. Water Resour. Manag. 2020, 34, 2869–2885. [Google Scholar] [CrossRef]
  3. Truettner, C.B.; Barkdoll, B.D. Economic feasibility analysis of variable-speed pumps by simulating 15 multiple water distribution systems. AQUA—Water Infrastruct. Ecosyst. Soc. 2022, 71, 664–670. [Google Scholar] [CrossRef]
  4. Martin-Candilejo, A.; Martin-Carrasco, F.J. Optimization of a pumping system using convex hyperbola charts: A case study application in Tres Cantos, Madrid, Spain. J. Water Resour. Plan. Manag. 2024, 150, 05023024. [Google Scholar] [CrossRef]
  5. Feng, X.; Qiu, B.; Wang, Y. Optimizing parallel pumping station operations in an open-channel water transfer system using an efficient hybrid algorithm. Energies 2020, 13, 4626. [Google Scholar] [CrossRef]
  6. Wang, Y.; Yok, K.T.; Wu, W.Y.; Simpson, A.R.; Weyer, E.; Manzie, C. Minimizing pumping energy cost in real-time operations of water distribution systems using economic model predictive control. J. Water Resour. Plan. Manag. 2021, 147, 04021042. [Google Scholar] [CrossRef]
  7. Gong, Y.; Zou, W.H. Optimal operation of urban tidal drainage pumping station based on genetic algorithm coupled with head-water level successive approximation. Front. Energy Res. 2023, 10, 1074529. [Google Scholar] [CrossRef]
  8. Zhao, F.L.; Qiu, B.Y.; Wang, H.J.; Yan, T.X. Energy saving based on a multi-objective optimization model of the tidal pumping station along the coastal area. J. Clean. Prod. 2023, 421, 138513. [Google Scholar] [CrossRef]
  9. Alsanabani, H.; Iskefiyeli, M.; Yarali, K.; Küçük, H.; Turan, M. A new approach for optimum operation of multi-stage water pump stations. J. Fac. Eng. Archit. Gazi Univ. 2024, 39, 1179–1191. [Google Scholar] [CrossRef]
  10. Kong, L.Z.; Li, Y.Q.; Chen, R.B. Predictive control for the operation of cascade pumping stations in water supply canal systems considering energy consumption and costs. Appl. Energy 2023, 341, 121103. [Google Scholar] [CrossRef]
  11. Luna, T.; Ribau, J.; Figueiredo, D.; Alves, R. Improving energy efficiency in water supply systems with pump scheduling optimization. J. Clean. Prod. 2019, 213, 342–356. [Google Scholar] [CrossRef]
  12. Navarro-Gonzalez, F.J.; Pardo, M.A.; Chabour, H.E.; Alskaif, T. An irrigation scheduling algorithm for sustainable energy consumption in pressurised irrigation networks supplied by photovoltaic modules. Clean Technol. Environ. Policy 2023, 25, 2009–2024. [Google Scholar] [CrossRef]
  13. Ahcene, B.; Saadia, B. Energetic optimization and evaluation of a drinking water pumping system: Application at the Rassauta station. Water Supply 2019, 19, 472–481. [Google Scholar] [CrossRef]
  14. Cimorelli, L.; D‘Aniello, A.; Cozzolino, L. Boosting genetic algorithm performance in pump scheduling problems with a novel decision-variable representation. J. Water Resour. Plan. Manag. 2020, 146, 04020023. [Google Scholar] [CrossRef]
  15. Zhao, Y.P.; Zhang, P.L.; Pu, Y.J.; Lei, H.; Zheng, X.B. Unit operation combination and flow distribution scheme of water pump station system based on Genetic Algorithm. Appl. Sci. 2023, 13, 11869. [Google Scholar] [CrossRef]
  16. Zhang, Z.; Lei, X.H.; Tian, Y.; Wang, L.L.; Wang, H. Optimized scheduling of cascade pumping stations in open-channel water transfer systems based on station skipping. J. Water Resour. Plan. Manag. 2019, 145, 05019011. [Google Scholar] [CrossRef]
  17. Yan, P.R.; Zhang, Z.; Lei, X.H.; Hou, Q.Z.; Wang, H. A multi-objective optimal control model of cascade pumping stations considering both cost and safety. J. Clean. Prod. 2022, 345, 131171. [Google Scholar] [CrossRef]
  18. Liu, X.L.; Tian, Y.; Lei, X.H.; Wang, H. An improved self-adaptive grey wolf optimizer for the daily optimal operation of cascade pumping stations. Appl. Soft Comput. 2019, 75, 473–493. [Google Scholar] [CrossRef]
  19. Wang, X.N.; Ma, X.M.; Liu, X.L.; Zhang, L.K.; Tian, Y.; Ye, C. Research on optimal operation of cascade pumping stations based on an improved sparrow search algorithm. Water Sci. Technol. 2023, 88, 1982–2001. [Google Scholar] [CrossRef]
  20. Yu, Z.W.; Yu, J.H.; Liu, J.J.; Hu, C.L.; Hu, S.S.; Wang, J.J.; Zhang, H.H.; Lu, H.T. Prediction model for safe operation of pumping stations optimized by the Sparrow Search Algorithm and BP Neural Network. Adv. Civ. Eng. 2024, 2024, 5358915. [Google Scholar] [CrossRef]
  21. Creaco, E.; Campisano, A.; Fontana, N.; Marini, G.; Page, P.R.; Walski, T. Real time control of water distribution networks: A state-of-the-art review. Water Res. 2019, 161, 517–530. [Google Scholar] [CrossRef] [PubMed]
  22. Galuppini, G.; Creaco, E.; Toffanin, C.; Magni, L. Service pressure regulation in water distribution networks. Control Eng. Pract. 2019, 86, 70–84. [Google Scholar] [CrossRef]
  23. Galuppini, G.; Magni, L.; Creaco, E. Stability and robustness of real-time pressure control in water distribution systems. J. Hydraul. Eng.—ASCE 2020, 146, 04020023. [Google Scholar] [CrossRef]
  24. Wu, H.S.; Xiao, R.B. Flexible wolf pack algorithm for dynamic multidimensional knapsack problems. Research 2020, 2020, 1762107. [Google Scholar] [CrossRef]
  25. Chen, X.; Cheng, F.; Liu, C.; Cheng, L.; Mao, Y. An improved wolf pack algorithm for optimization problems: Design and evaluation. PLoS ONE 2021, 16, e0254239. [Google Scholar] [CrossRef] [PubMed]
  26. Lu, N.; Ma, L. Quantum wolf pack evolutionary algorithm of weight decision-making based on fuzzy control. Chin. J. Electron. 2022, 31, 635–646. [Google Scholar] [CrossRef]
  27. Fong, S.; Deb, S.; Yang, X.S. A heuristic optimization method inspired by wolf preying behavior. Neural Comput. Appl. 2015, 26, 1725–1738. [Google Scholar] [CrossRef]
  28. Herrero-Collantes, M.; Garcia-Escartin, J.C. Quantum random number generators. Rev. Mod. Phys. 2017, 89, 015004. [Google Scholar] [CrossRef]
  29. Kromer, P.; Platos, J.; Snasel, J. Differential evolution for the optimization of low-discrepancy generalized Halton sequences. Swarm Evol. Comput. 2020, 54, 100649. [Google Scholar] [CrossRef]
  30. Ahmadianfar, I.; Kheyrandish, A.; Jamei, M.; Gharabaghi, B. Optimizing operating rules for multi-reservoir hydropower generation systems: An adaptive hybrid differential evolution algorithm. Renew. Energy 2021, 167, 774–790. [Google Scholar] [CrossRef]
  31. Pang, J.W.; Li, X.H.; Han, S. PSO with mixed strategy for global optimization. Complexity 2023, 2023, 7111548. [Google Scholar] [CrossRef]
  32. Kirkpatrick, S.; Gelatt, C.D., Jr.; Vecchi, M.P. Optimization by simulated annealing. Science 1983, 220, 671–680. [Google Scholar] [CrossRef] [PubMed]
  33. Awad, N.H.; Ali, M.Z.; Suganthan, P.N. Ensemble sinusoidal differential covariance matrix adaptation with Euclidean neighborhood for solving CEC2017 benchmark problems. In Proceedings of the 2017 IEEE Congress on Evolutionary Computation (CEC), Donostia, Spain, 5–8 June 2017; pp. 372–379. [Google Scholar] [CrossRef]
Figure 1. Hydraulic elements in a micro-segment of water channel.
Water 16 02420 g001
Figure 2. Flow chart of the IWPA.
Water 16 02420 g002
Figure 3. Flow chart of model decision.
Water 16 02420 g003
Figure 4. Schematic diagram of the water diversion route. 0, 1, 2, 3, and 4 are the calculation numbers of the channel section.
Water 16 02420 g004
Figure 5. Error bar of 30 trials.
Water 16 02420 g005
Figure 6. Optimal schemes of an inner-layer model of pumping stations. (a) Qr = 70 m3/s; (b) Qr = 90 m3/s; (c) Qr = 110 m3/s; (d) Qr = 130 m3/s.
Water 16 02420 g006
Figure 7. Water level and flow rate of an inner-layer model of channels. (a) Qr = 70 m3/s; (b) Qr = 90 m3/s; (c) Qr = 110 m3/s; (d) Qr = 130 m3/s.
Water 16 02420 g007
Figure 8. Head allocation results of the outer-layer model.
Water 16 02420 g008
Figure 9. Actual schemes. (a) Qr = 70 m3/s; (b) Qr = 90 m3/s; (c) Qr = 110 m3/s; (d) Qr = 130 m3/s.
Water 16 02420 g009
Figure 10. Energy and CO2 savings.
Water 16 02420 g010
Figure 11. Abandoned water of original schemes.
Water 16 02420 g011
Table 1. Test results of ten benchmark functions.
FunctionAlgorithmMinMeanSD
Matyas: f ( x ) = 0.26 ( x 1 2 + x 2 2 ) 0.48 x 1 x 2
x 1 , x 2 10 , 10 , m = 2, fmin = 0
PSO2.74 × 10−147.42 × 10−121.42 × 10⁻¹²
GA3.15 × 10−96.57 × 10−83.59 × 10−8
WPA4.75 × 10−129.13 × 10−117.22 × 10⁻¹¹
IWPA1.34 × 10−142.37 × 10−125.96 × 10⁻¹³
Sum squares: f ( x ) = i = 1 m i x i 2
x i 10 , 10 , m = 4, fmin = 0
PSO8.14 × 10−89.06 × 10−64.22 × 10−6
GA1.27 × 10−69.13 × 10−47.92 × 10−5
WPA6.32 × 10−109.75 × 10−76.56 × 10−8
IWPA2.79 × 10−115.47 × 10−98.49 × 10−9
Trid: f ( x ) = i = 1 m ( x i 1 ) 2 i = 2 m x i x i 1
x i 36 , 36 , m = 6, fmin = −50
PSO−50−49.87283.71 × 10−3
GA−50−49.74534.79 × 10−3
WPA−50−509.16 × 10⁻⁷
IWPA−50−501.24 × 10⁻¹⁰
Zakharov: f ( x ) = i = 1 m x i 2 + i = 1 m 0.5 i x i 2 + i = 1 m 0.5 i x i 4
x i 5 , 10 , m = 10, fmin = 0
PSO9.58 × 10−39.65 × 10−26.79 × 10−2
GA1.58 × 10−32.71 × 10−27.40 × 10−2
WPA9.57 × 10−84.85 × 10−66.56 × 10−6
IWPA8.00 × 10−111.42 × 10−107.06 × 10⁻¹¹
Sphere: f ( x ) = i = 1 m x i 2
x i 100 , 100 , m = 30, fmin = 0
PSO0.02771.76250.3709
GA8.24 × 10−30.02760.0680
WPA6.95 × 10−53.17 × 10−46.55 × 10−5
IWPA9.50 × 10−93.44 × 10−81.19 × 10−8
Booth: f ( x ) = ( x 1 + 2 x 2 7 ) 2 + ( 2 x 1 + x 2 5 ) 2
x i 10 , 10 , m = 2, fmin = 0
PSO4.39 × 10−83.82 × 10−79.60 × 10−7
GA7.66 × 10−97.95 × 10−75.85 × 10−7
WPA1.87 × 10−124.90 × 10−97.51 × 10−9
IWPA000
Michalewicz: f ( x ) = i = 1 m sin ( x i ) s i n i x i 2 π 20
x i 0 , π , m = 4, fmin = −9.6602
PSO−8.64930.63763.1924
GA−9.6441−1.62373.8752
WPA−9.6602−9.65997.98 × 10−7
IWPA−9.6602−9.66026.24 × 10−13
Rastrigin: f ( x ) = 10 m + i = 1 m x i 2 10 cos ( 2 π x i )
x i 5.12 , 5.12 , m = 10, fmin = 0
PSO7.422927.25337.3257
GA0.170710.99615.5383
WPA1.82 × 10−72.64 × 10−61.84 × 10−6
IWPA1.42 × 10−114.22 × 10−99.16 × 10−9
Dixon-price: f ( x ) = ( x 1 1 ) 2 + i = 1 m i ( 2 x i 2 x i 1 ) 2
x i 10 , 10 , m = 10, fmin = 0
PSO17.800362.973010.6977
GA14.501139.756515.5096
WPA8.17 × 10−48.69 × 10−38.53 × 10−3
IWPA7.09 × 10−114.58 × 10−101.19 × 10⁻¹⁰
Styblinski-tang: f ( x ) = 1 2 i = 1 m x i 4 16 x i 2 + 5 x i
x i 5 , 5 , m = 30, fmin = −1175
PSO−1210.10−1289.9023.3371
GA−1221.30−1390.8063.3567
WPA−1175.40−1185.905.1424
IWPA−1175−11756.37 × 10−7
Table 2. Types and parameters of the equipment.
Station NamePump TypeMain TransformerIn-Station
Transformer
CablesNumber of Pumps NHead Hz (m)
LS2900ZLQ32–6S10–20000/110SCB10–630/10YJV–3 × 15052.5–6.5
XT2900ZLQ32–6S10–20000/110SCB10–630/10YJV–3 × 15054.0–6.08
LJB2800ZGQ–2.5S10–M–6300/35SCB9–800/10YJV–3 × 18540.1–3.0
Table 3. Parameters of the water channel.
Channel SegmentLength
L (km)
Bottom Elevation zb (m)Bottom Width B (m)Slope Factor mGroundwater Level zg (m)Soil Permeability
C
0~15.3016.5060324.02~25.020.0017
1~239.9022.0060325.02~28.200.0016
2~326.0227.0060328.20~30.100.0029
3~48.5027.0040330.10~31.500.0014
Table 4. A portion of the data of from scheme library A.
Station NameHead
Hz (m)
Flow Rate
Qr (m3/s)
Blade Angles
β (°)
No. of Pumps
n
Power
P (kW)
LS2.5070.00−2.7023401.01
90.004.0024615.88
110.00−1.5935317.40
130.002.9436697.54
XT4.0070.001.1324496.11
90.00−3.0635393.64
110.002.7437425.57
130.00−0.9447738.75
LJB3.0070.00−2.1736165.04
90.00−3.0647668.11
110.001.7649337.32
130.000.36511,163.96
Table 5. Partial groups of channel level and flow rate in scheme library B.
Channel
Segment
End Level
Z2 (m)
End Flowrate
Q2 (m3/s)
Starting Level
Z1 (m)
Starting Flowrate
Q1 (m3/s)
Hydraulic Loss
ΔH (m)
Water Loss
ΔQ (m3/s)
0~121.0070.0021.0270.010.020.01
90.0021.0390.010.030.01
110.0021.05110.010.050.01
130.0021.06130.010.060.01
1~226.0070.0026.2270.560.220.56
90.0026.3490.610.340.61
110.0026.48110.660.480.66
130.0026.62130.720.620.72
2~330.9070.0031.0672.810.162.81
90.0031.1592.750.252.75
110.0031.26112.710.362.71
130.0031.38132.700.482.70
3~431.4070.0031.4770.210.070.21
90.0031.5290.210.120.21
110.0031.57110.210.170.21
130.0031.63130.210.230.21
Table 6. Time complexity of the new method.
OperationsTime Complexity
Population initializationO (1)
Selecting head wolf O (M)
Wandering updateO (K × M × D) ≈O (M)
Raiding update O (K × M × D) ≈ O (M)
Siege update and elimination mechanism O (K × M + K × M2) ≈ O (M2)
SA O (K × D × L) ≈ O (1)
Table 7. Time complexity of each operation of the double-nesting method.
OperationsTime Complexity
Population initializationO (1)
Selecting head wolfO (M × (M12 + R1)) ≈ O (M3)
Wandering updateO (M × (M12 + R1)) ≈ O (M3)
Raiding update O (M × (M12 + R1)) ≈ O (M3)
Siege update and elimination mechanism O (M2 × (M12 + R1)) ≈ O (M4)
SA O (1 × (M12 + R1)) ≈ O (M2)
Disclaimer/Publisher’s Note: The statements, opinions and data contained in all publications are solely those of the individual author(s) and contributor(s) and not of MDPI and/or the editor(s). MDPI and/or the editor(s) disclaim responsibility for any injury to people or property resulting from any ideas, methods, instructions or products referred to in the content.