Abstract
Nowadays, a detailed safety policy is applied for dams. These policies cover structural safety, monitoring, inspection, safe operation, and emergency plans. For high-risk dams, all these policy elements need to be included in dam safety programs. Deficiencies in embankment dams, which suffer the most damage, can be detected by visual inspection and programmed monitoring of dams. In dams, horizontal and vertical deformation, leakage, pressure, stress, loads acting on structural elements, and environmental factors are generally measured. These behaviors can be numerically modeled to determine the dam behavior. Numerical analysis methods are important for monitoring the safety of the dam. Models created with software such as Plaxis provide information about dam behavior. Although numerical analysis is very important for dams, obtaining the material parameters used in the construction of the dam needed for modeling, recording the construction stages of the dam, not taking the water level change in the dam reservoir instantaneously, and not taking the measurement records of the dam measurement instruments correctly for different reasons constitute problems and difficulties for the analyses. Within the scope of this study, İkizdere Dam in Turkey was modeled with the Plaxis finite element program; the survey and piezometer measurement data taken from the dam were evaluated by comparing with the analysis results; the difficulties and problems encountered in the modeling and analysis phase were stated, and recommendations were made on dam safety and numerical analysis. Thus, in addition to other studies, it was emphasized that it is important for dam engineers to monitor the use of numerical analysis models throughout the entire process, not only in the planning phase but also from the planning phase to the life of the dam, and to keep records of all recording intervals that will be needed in digital analysis models.
1. Introduction
Many dams have been constructed for different purposes, such as flood protection, energy generation, water supply for drinking, irrigation, and utilization purposes. The fact that the dams built so far within the borders of Turkey have been constructed in the most technically and economically favorable locations has led to the necessity of constructing the dams to be built in less favorable locations compared to the existing dams, and therefore, more technical problems have started to be faced during the construction and operation of new dams. As a result of inadequacies that may arise due to technical problems, the dam may face the risk of collapse. After the dam collapse, the large volume of water mass in the dam reservoir moves uncontrollably in a very short time and causes material and moral damage in the region downstream of the dam.
According to the General Directorate of State Hydraulic Works (DSI) data, there are 1018 dams in Turkey that were completed between 1936 and 2022 [1]. Approximately 90 per cent of these dams were constructed as embankment dams [2].
According to statistics, earthfill dams are the most damaged dam type, followed by gravity dams, rockfill dams, and arch dams [3].
Dam collapse results in great loss of life and property. In 1963, 2600 people died as a result of the collapse of the Vajont dam in Italy; in 1976, 100 people died as a result of the collapse of the Teton dam in the USA, and an economic loss of approximately 1 billion dollars occurred; and 300 people died as a result of the collapse of the Gouhou dam in China in 1993 [4].
In the 20th century, approximately 200 dams collapsed, killing more than 8000 people [5]. Due to excessive rainfall on 8 August 1975 in the People’s Republic of China, 62 large- and small-scale dams, including Banqiao and Shimantan dams, collapsed; a total of 171,000 people lost their lives; many people were injured; and 5.96 million buildings were destroyed. This tragic event was recorded as the biggest dam disaster in history [6].
Some of the dam collapses that resulted in more than 100 deaths in different countries and the causes of collapse are given in Table 1.

Table 1.
Some dam collapses resulting in more than 100 deaths and causes of collapse [7].
As can be seen in Table 1, many dam collapses have occurred for many different reasons so far, and as a result of dam collapses, many people have lost their lives and serious financial losses have occurred.
When the deficiencies occurring in 534 dams from 43 countries before 1974 were examined, it was seen that earth-rock dams were the most deficient dam types, and 49% were due to water overflow over the dam, 28% were due to leakage in the dam body, and 29% were due to leakage in the foundation [4].
After a long period of evaluations in the risk assessment of dams, it is increasingly accepted that there are significant uncertainties in dam risk assessment and that these uncertainties often cannot be eliminated by a reasonable investigation. Uncertainties are the source of dam risk. Hydrological, hydraulic, geotechnical, seismic, structural, and operational uncertainties have persisted in dam risk assessment to this day. Analyses must be made with limited or incomplete information. Additionally, the nature and range of uncertainties depend on, among other factors, the environment and history of a particular dam. Therefore, although deterministic studies are often conducted to assess dam risk, it is now recognized that the results of such studies have limitations in taking into account the influence of uncertain factors. More detailed studies within a probabilistic framework are often appropriate and desirable. For risk studies, such analyzes are necessary so that significant uncertainties can be identified and their effects on reliability can be systematically examined [8].
In order to detect inadequacies that may cause dam failure in advance and take the necessary precautions in a timely manner, it is necessary to constantly monitor and monitor whether the dams are working as planned, starting from the construction phase, throughout the dam’s operating life. In this way, the collapse of dams can be prevented, and even if the dams collapse, loss of life and property can be minimized with timely interventions.
Numerical analyses are frequently preferred by engineers for fast and safe solutions to geotechnical problems. Commercial finite element software systems are available to solve geotechnical problems, including all versions of PLAXIS, ZSOIL, and FLAC [9].
Shahzadi and Soulaïmani modeled the Romaine-2 dam in Canada with Plaxis software, compared the displacements calculated from inclinometers placed on the dam with measurements, and stated that computational modeling plays an important role in the design of rockfill dams [10].
Aydın modeled the Sakarya Akçay Dam in Turkey using the finite element method, made evaluations by comparing the measurements taken from the dam with the model results, and emphasized the importance of using numerical analyses for dam safety investigations [11].
As can be understood from the literature, numerical analysis methods have an important place in terms of monitoring dam safety from the planning stage of the dam to the completion of the dam life. By using models created with software such as Plaxis, which performs analysis with the finite element method, information about the behavior of the dam can be obtained from the planning stage. In the natural case, it can be determined with the help of these programs whether a geotechnical ground collapse will occur after the construction of the dam, whether the settlements will exceed the limits, and whether ground improvement is required. In addition, the safety of the dam can be constantly questioned by comparing the deformations that may occur in the dam body and the water pressure changes in the impermeable clay core with real-time measurements during the operational life of the dam. However, the absence of the data needed for modeling the dam or the inaccuracy of the data may cause problems in reflecting the real situation to the model.
2. Monitoring and Inspection of Fill Dams
Identifying the failure modes and causes in high dams is critical for better guiding high dam designs and implementing safety prevention and control measures [12].
One of the challenges facing dams is that dams built to different standards and conditions grow old and are used for longer periods than planned. Any long-term behavior that causes changes in dam properties over time and thus may affect dam safety is defined as dam aging. ICOLD (International Commission On Large Dams) defines dam aging as structural deteriorations that occur more than 5 years after the dam is put into operation. Monitoring dams is one of the most important issues in terms of dam safety. Monitoring of dams includes installation of monitoring equipment, visual inspections, monitoring of dam performance, data management, and diagnostics. Monitoring of dams is important to detect emerging problems in advance and to provide information about the long-term behavior of dams [13].
Today, a detailed dam safety policy is implemented for dams at risk of damage. This policy includes the elements of structural safety of the dam, monitoring and inspection of dams, safe operation of dams, and preparation of emergency plans. Engineers are primarily concerned with the structural safety of the dam. The structural safety of the dam is ensured by designing and constructing the dam according to design guidelines such as flood and earthquake, taking into account local site conditions. However, in dams with high risk of damage, all mentioned safety elements must be included [14].
Some of the deficiencies in embankment dams can be detected by visual inspection at the dam top, dam slope, and the points where the dam body meets the dam ground surface. In embankment dams, the state of the linear form of the crest, settlements, the state of cracks, the presence of excessive and deep-rooted plants, the cavities created by animals, and whether the measuring systems and mechanical equipment are in working order or whether their locations have been changed should be examined [15].
Geohazards such as bank collapses and landslides are usually triggered by reservoir filling and drawdown operations. Generally, analyzing the deformation mechanism of the slope through field monitoring and numerical simulation and then evaluating the stability is a crucial tool to ensure the safe operation of the reservoir, in which the determination of mechanical parameters is significant for safety evaluation. Due to the complex site conditions, the mechanical properties of the slope during impoundment are difficult to obtain through field testing. Therefore, parameter identification utilizing the back analysis approach based on field monitoring is a more appropriate strategy and now applied in engineering practice [16].
Dams are generally observed with measurements taken from the dam, photographs, on-site tests, and laboratory tests. Hydrological effects such as excessive rainfall, level and temperature of water in the reservoir, air temperature, internal temperature, and wind impulse, and structural movements such as buoyancy force applied by water to the dam, leakage amounts in the body and foundation, pressures on the body, seismic forces, and the measurements taken during the dam’s ability to resist these effects. Measurements, examinations, and observations made at the dam site facilitate the detection of functional deficiencies and abnormal situations that have occurred in the dam. The data obtained as a result of measurements, examinations, and observations are transferred to the database and protected [17].
Observations, inspections, and measurements at dams should be carried out within a certain program. The measurements to be made vary depending on the dam type and characteristics. In dams, measurements such as horizontal and vertical deformation, leakage, pressure and stress, loads affecting structural elements, and environmental factors (water level, temperature, precipitation, seismic movement) are generally taken.
The minimum criteria for measuring devices that must be used in dams to be built in Turkey are specified in the Dam Measuring Devices Technical Specification published by DSI in 2014. The main instruments used in the observation of earth fill and rock fill dams and the locations of these instruments are given in Figure 1.

Figure 1.
Measuring devices in earth and rock fill dams. Adapted from Baykan et al. [18].
2.1. Piezometers
Piezometers are used to observe the water pressure caused by leakage and compression in the dam body and foundation, to determine the efficiency of the drainage zones during the dam’s water retention, and to determine the pore water pressures that occur during the construction of the dam. Piezometers are placed at the most critical points in the horizontal and vertical directions, which will allow creating the pressure model resulting from excessive pore water pressure and leakage. Fill-type piezometers are placed at critical points within the impermeable clay core to measure the pore water pressures occurring in the impermeable clay core. Foundation-type piezometers placed under the foundation are used to control the seepage in the dam foundation, the effectiveness of the injection curtain, if any, and the groundwater level.
2.2. Survey Points
These are measurement systems placed on the crest and downstream slope of the dam to monitor the horizontal and vertical displacements that will occur in the embankment. As soon as the dam filling is completed, the anchors should be placed in their places in the project, and their initial values should be determined.
2.3. Extensometers
Extensometers measure displacements on the ground at certain heights. They are used to observe vertical movements (collapse, swell, etc.) occurring at the base of the dam body or the base of the foundation ground.
2.4. Water Pressure Meters
Water pressure meters are placed at the bottom of the filter zone on the downstream side of the dam and function similar to observation wells in embankment dams. Unlike the piezometer, there are no filter units.
2.5. Inclinometers
Inclinometers are used to measure horizontal movements (displacements) in mm in dams at the relevant cross-section and depth. They are placed in boreholes drilled during the construction phase and usually in the body, foundation, and piers.
2.6. Settlement Meters
Settlement meters are used to determine the amount and rate of settlement that will occur at different depths.
3. Method and Application
Plaxis is a powerful finite element computer program used for analyzing stresses and deformations in geotechnical engineering problems. The program includes advanced features such as higher-order elements for improved accuracy, automatic mesh generation, tension-only structural elements for simulating geosynthetics, joint elements for interface behavior between materials, multiple soil models for different characteristics, and more. Plaxis also offers features like updated Lagrangian analysis for large deformations, staged-construction algorithms for sequential operations, and a post-processor for interpreting various relationships and diagrams related to load, stress, strain, and time settlements [19].
When defining initial and boundary conditions in the Plaxis program, it is very important to choose initial and boundary conditions in a way that does not affect the results. Otherwise, incorrect values may be obtained as a result of the analysis.
Plaxis software is able to model the natural conditions before dam construction, dam construction, and dam operation in detail and in stages at every stage, and analyses can be performed with the desired precision, so that the behavior of the dam can be obtained accurately.
Also, in the Plaxis program, different soil models such as linear elastic, Mohr–Coulomb, soft soil, and hardening soil are used to model the behavior of soils.
The hardening soil (HS) model in Plaxis is an elastoplastic soil model developed by Schanz et al. [20]. It calculates deformation using elastic and plastic strain but does not account for hysteretic or cyclic mobility in soils. The model consists of mathematical equations to define soil behavior and is detailed in the Plaxis Material Models Manual [21]. Users have found the HS model accurate in simulating complex soil behavior under various stress conditions. Model parameters can be determined through conventional triaxial compression tests on the soil (Figure 2). Overall, the hardening soil model is a valuable tool for accurately predicting soil behavior in geotechnical engineering applications [19]. Therefore, in this study, the zones were modeled using the hardening soil model in order to model the behavior of the dam more realistically.
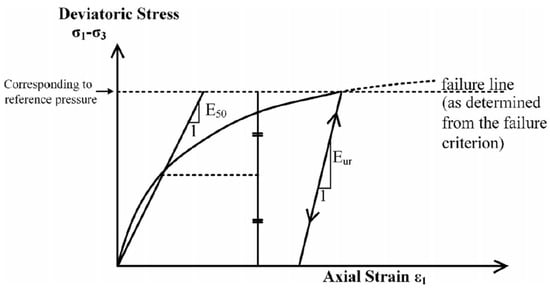
Figure 2.
Determination of soil model parameters E50 and Eur from triaxial compression test results [17].
Ikizdere Dam is located on the Ikizdere Stream in the Aydin province of Turkey. The dam was built by DSI as a central clay core, upstream sand–gravel, and downstream rock fill dam for the purpose of supplying drinking and irrigation water. The height of the dam from the thalweg is 101 m, and the height from the foundation is 108 m (Figure 3).
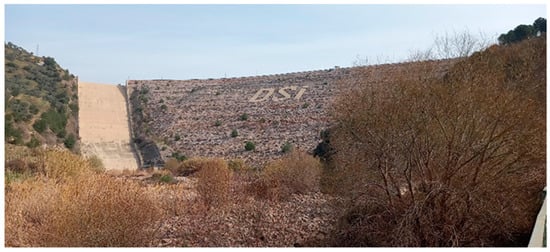
Figure 3.
View of Ikizdere dam.
Analyses were carried out with the Plaxis 2D finite element program under two-dimensional plane deformation conditions. B3, B4, and B5 sections, where both piezometer and surveyor measurements were taken, were used in the modeling. The results obtained from the analyses were compared with the measurement data taken from the dam, and evaluations and recommendations were made. The visual of the model of the B3 section used in the analysis is given in Figure 4.

Figure 4.
Model of section B3.
In order to model the dam in detail and realistically, sections and zones were taken from as-built projects. Triangular elements with 15 nodes were used to provide more precise results in the finite element mesh of the section. The test and experimental results of the dam body filling materials used during the construction of the dam, which are necessary to model the realistic behavior of the dam, could not be obtained because laboratory test results obtained during the planning phase and material parameters in the literature were used in the dam model. In the analysis, the “very fine” mesh option offered by the program was selected in order to make the results more precise while creating the finite element mesh, and the mesh was tightened manually in the entire model, being the densest in the impermeable clay core zone. Figure 5 shows images of the model and finite element network created for sections B3, B4, and B5.
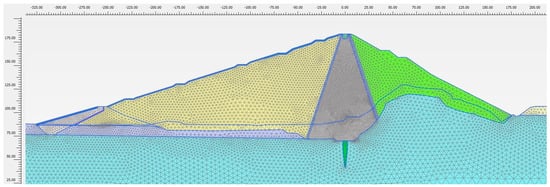
Figure 5.
Finite element mesh of section B3.
In order to obtain realistic behavior of the dam under different conditions and water levels, the injection curtain and cover injection were modeled using the linear elastic soil model, and all soils in the dam foundation and zones were modeled using the hardening soil model. In soils modeled using the hardening soil model, pref = 100 kN/m2, υur = 0.2, and Eoedref = E50ref and Eurref = 3 × E50ref values recommended to be used by the Plaxis program are defined in the program. The parameters of the materials used in the analysis model are given in Table 2.

Table 2.
Parameters of the materials used in the analysis model.
In order to measure the water pressures that will occur in the dam, 44 fill-type piezometers, 6 foundation-type piezometers, and 3 water pressure meters were placed at different elevations and coordinates during the construction phase. In addition, 29 reference points were placed at different elevations and coordinates during the construction phase in order to measure the displacements that will occur in the dam body. Visuals showing the locations of piezometers and guides on the dam are given in Figure 6.
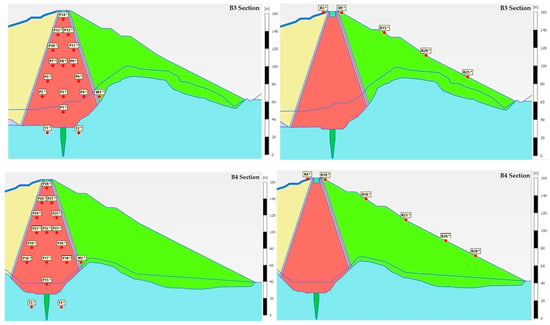

Figure 6.
Piezometer and survey points of B3, B4 and B5 sections. (R: survey point, P: fill-type piezometer, T: foundation-type piezometer, W: water pressure meter).
4. Analysis Results
B3, B4, and B5 sections of the dam, where both piezometer and surveyor readings were found, were modeled and analyzed in two dimensions. The values obtained as a result of the analysis and the measurement results were evaluated under separate headings for reference points and piezometer points.
The examples given in Figure 7 are based on the fact that sudden increases and decreases in the vertical displacement and dam breaking distance measurement values made on certain dates in the reference measurement charts will create major problems for the performance and safety of the dam, and on these dates, such shape behavior and safety problems have not been observed in the dam so far. Therefore, the readings on these days are thought to be operator-induced reading errors. These significant changes in distance and water level have resulted in significantly revised measurement graphs based on the previous and next readings, making the measurement graphs more accurate.
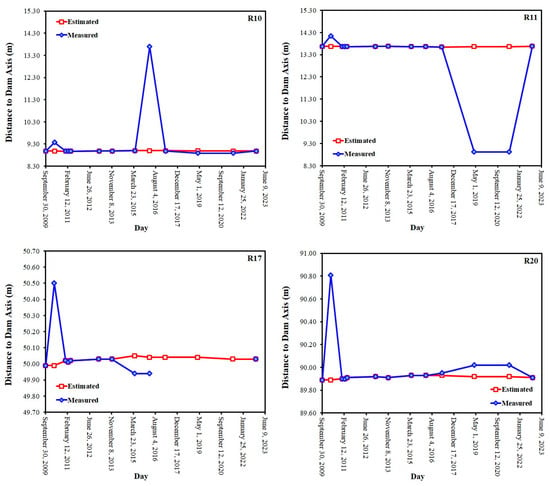
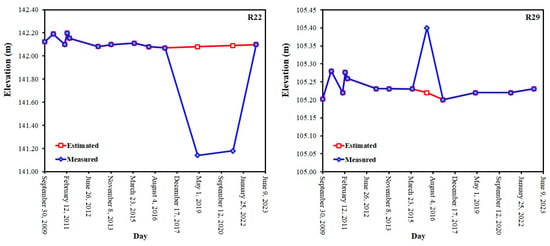
Figure 7.
Graphs of measurement values and regulated values of the survey points.
4.1. Comparison and Evaluation of Analysis Results of Survey Points and Measurement Results
Deformations occurring at survey points provide important information about the behavior of the dam. In the light of this information, comments can be made about dam safety, and the possible behavior of the dam can be predicted. At İkizdere Dam, reference measurements were taken at 13 different times between 30 September 2009 and 9 November 2022. Some examples of the total deformation outputs obtained for these measurement dates as a result of the two-dimensional analysis of the B3, B4, and B5 sections with the finite element model are given in Figure 8 and Figure 9.

Figure 8.
Total deformation analysis output of B3 and B4 sections dated 30 September 2009.

Figure 9.
Total deformation analysis output of sections B3 and B4 dated 9 November 2022.
Vertical displacement values of measured and computed values of R3, R4, and R5 survey points are given in Table 3.

Table 3.
Vertical displacement values of measured and computed values of R3, R4, and R5 survey points.
Vertical displacement graphs of measured and computed values of R3, R4, and R5 survey points are given in Figure 10.
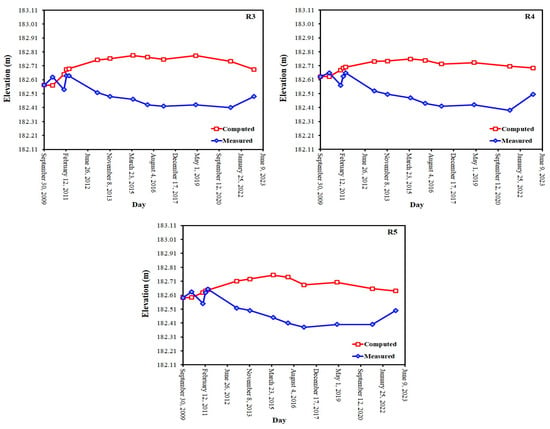
Figure 10.
Vertical displacement graphs of measured and computed values of R3, R4, and R5 survey points.
Vertical displacement values of measured and computed values of R20, R21, and R22 survey points are given in Table 4.

Table 4.
Vertical displacement values of measured and computed values of R20, R21, and R22 survey points.
Vertical displacement graphs of measured and computed values of R20, R21, and R22 survey points are given in Figure 11.
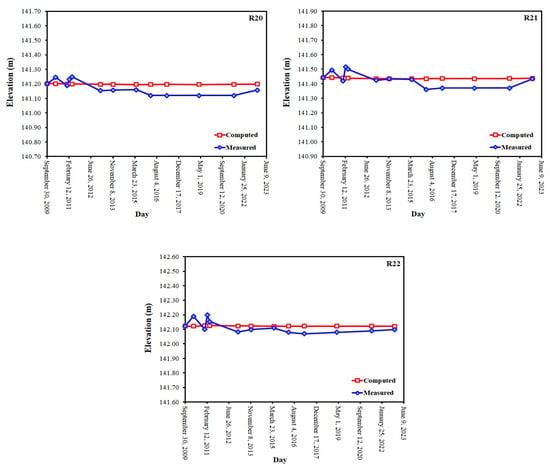
Figure 11.
Vertical displacement graphs of measured and computed values of R20, R21, and R22 survey points.
Vertical displacement values of measured and computed values of R28 and R29 survey points are given in Table 5.

Table 5.
Vertical displacement values of measured and computed values of R28 and R29 survey points.
Vertical displacement graphs of measured and computed values of R28 and R29 survey points are given in Figure 12.
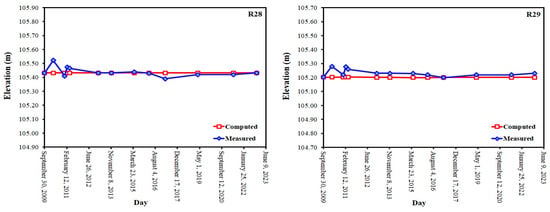
Figure 12.
Vertical displacement graphs of measured and computed values of R28 and R29 survey points.
According to the measurement results, it was observed that the vertical displacements of the survey points at the upper elevations decreased between the first reference reading date of 30 September 2009 and 9 November 2022. For this reason, it is thought that settlements in the upper elevations continue. The relationship between the measurement values and the water level was not clearly understood due to the continuing settlement of the dam, and the analysis values showed dynamic changes depending on the water level. Since the vertical elevation measurement values until 14 January 2013 changed independently of the water level and dam behavior, it is thought that the readings until this date are incorrect. The sudden increase in the measurements dated 9 November 2022, regardless of the water level, led to the conclusion that these dated measurements were incorrect. In addition, the vertical elevation measurements and analysis results of the survey points located at the lower elevations showed similar values.
Distance change values from the dam axis of the measured and computed values of R3, R4, and R5 survey points are given in Table 6.

Table 6.
Distance change values from the dam axis of the measured and computed values of R3, R4, and R5 survey points.
Distance change graphs from the dam axis of the measured and computed values of R3, R4, and R5 survey points are given in Figure 13.
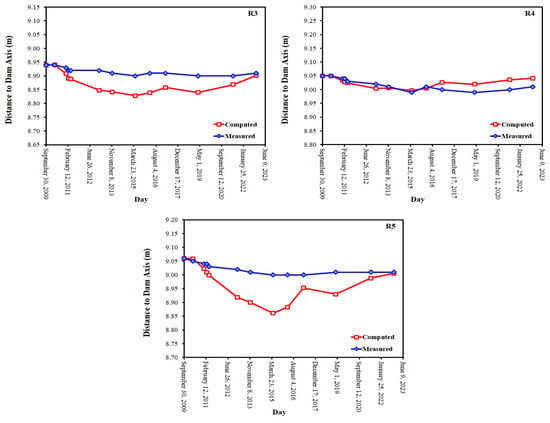
Figure 13.
Distance change graphs from the dam axis of the measured and computed values of R3, R4, and R5 survey points.
Distance change values from the dam axis of the measured and computed values of R20, R21, and R22 survey points are given in Table 7.

Table 7.
Distance change values from the dam axis of the measured and computed values of R20, R21, and R22 survey points.
Distance change graphs from the dam axis of the measured and computed values of R20, R21, and R22 survey points are given in Figure 14.
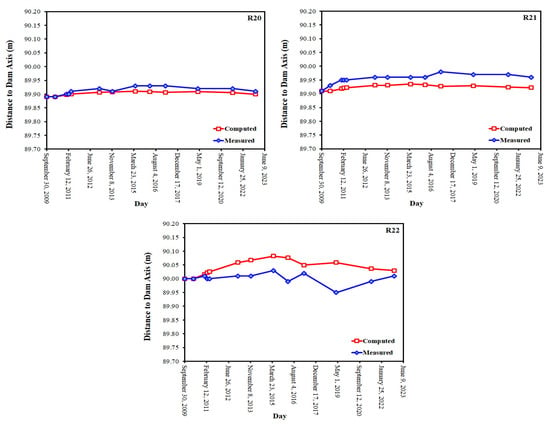
Figure 14.
Distance change graphs from the dam axis of the measured and computed values of R20, R21, and R22 survey points.
Distance change values from the dam axis of the measured and computed values of R28 and R29 survey points are given in Table 8.

Table 8.
Distance change values from the dam axis of the measured and computed values of R28 and R29 survey points.
Distance change graphs from the dam axis of the measurement and analysis values of R28 and R29 survey points are given in Figure 15.
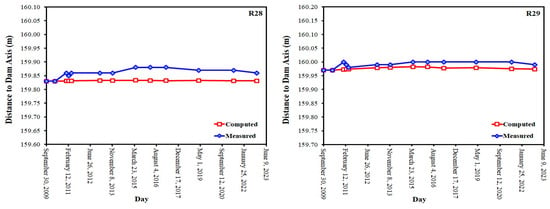
Figure 15.
Distance change graphs from the dam axis of the measured and computed values of R28 and R29 survey points.
The analysis values of the distance to the dam axis of survey points located at the upper elevations were below the measurement values, and large differences were observed between the analysis results and measurement values. It is thought that the reason for this is that the material parameters used in the application are different from the material parameters used in the analysis, and the settlement behavior of the dam continues. The analysis values of the distance to the dam axis of survey points located at the lower elevations were close to the measured values, and the measurement values remained above the analysis values.
4.2. Comparison and Evaluation of Analysis Results of Piezometers and Dam Measurement Results
Measuring water pressures in dams is an important step in monitoring the stability and security of embankment dams. Water pressure measurements were taken at İkizdere Dam at different times between 7 January 2010 and 1 March 2023. Some examples of the water pressure outputs obtained for these measurement dates as a result of the two-dimensional analysis of sections B3, B4, and B5 with the finite element model are given in Figure 16 and Figure 17.

Figure 16.
Water pressure analysis output of B3 and B4 sections dated 6 November 2011.

Figure 17.
Water pressure analysis output of B3 and B4 sections dated 15 May 2015.
Measured and computed values of P29, P15, and P1 piezometers are given in Table 9.

Table 9.
Change values of measured and computed values of P29, P15, and P1 piezometers.
Change graphs of measured and computed values of P29, P15, and P1 piezometers are given in Figure 18.
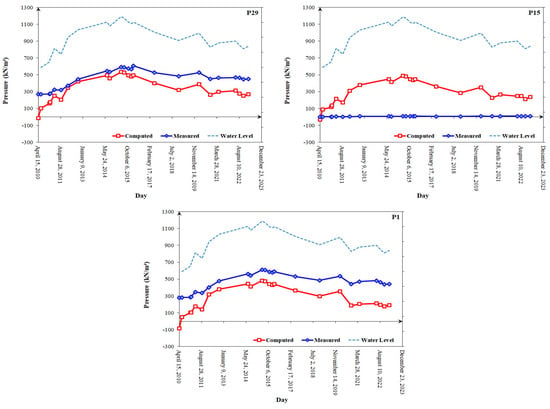
Figure 18.
Change graphs of measured and computed values of P29, P15, and P1 piezometers.
Measured and computed values of P37, T4, and T6 piezometers are given in Table 10.

Table 10.
Change values of measured and computed values of P37, T4, and T6 piezometers.
Change graphs of measured and computed values of P37, T4, and T6 piezometers are given in Figure 19.
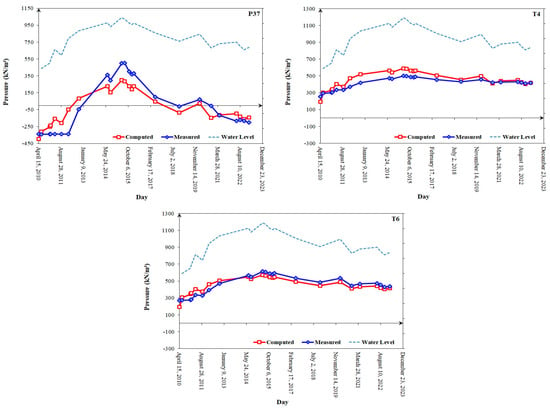
Figure 19.
Change graphs of measured and computed values of P37, T4, and T6 piezometers.
The analysis values of P29 and P1 piezometers remained below the measurement values, and the measurement values and analysis values showed dynamic changes depending on the water level. The measurement values on the P15 piezometer are below the required values. Therefore, it is thought that the P15 filler-type axis piezometer is defective. The analysis values of the P37 piezometer remained below the measurement values at certain times and above the measurement values at other times. While measurement values generally changed depending on the water level, analysis values showed dynamic changes depending on the water level. Measurement values increased significantly, especially after 8 February 2012. While the analysis values of the T4 piezometer remained above the measurement values, the analysis values of the T6 piezometer remained below the measurement values at certain times and above the measurement values at certain times. Measurement values and analysis values showed dynamic changes depending on the water level. While the piezometer values obtained as a result of the analysis in all piezometers changed dynamically depending on the water level, the measurement values generally changed independently of the modeled water levels. It is thought that the reason for this is that the measurement values give results according to the actual water level change, while the analysis water levels give results according to the modeled water levels. It was concluded that piezometer readings and model results would give similar results as a result of creating a real scenario by instantly monitoring the water level change in the field and reflecting the real permeability values of the materials used in the application to the model. While there is generally no negative pressure value in the reading values, negative pressure values were obtained in the model results depending on the water level.
5. Results and Discussion
As stated in the studies conducted in the literature, performing safety analyses by modeling dams with numerical analysis and obtaining the data needed in the analyses completely and accurately directly affects the analysis results and may cause problems in terms of dam safety.
It is thought that the reason for the difference between the piezometer and survey point measurements taken and the results obtained by analysis is that the real soil parameters in the dam zone and foundation cannot be obtained and the water level change in the dam is not measured instantly.
Considering the analysis results and the real-time behavior of the dam, it is thought that survey point measurement values taken at certain times are incorrect.
Since the dam under investigation did not have settlement measurements during the construction phase, real-time deformation behavior of the dam could not be obtained.
The data obtained as a result of the analysis show that the behavior of the dam changes depending on the change in water level and the values of the parameters (elasticity modules, permeability, etc.) entered in the ground model. For this reason, it is important to determine the material parameters used in the application and correctly introduce them into the analysis programs in order to analyze the dam behavior in the most real way.
In order to model the pore water pressures in dams realistically, it is important to monitor the water pressures and water levels at the time of measurement and reflect them in the analysis model. The water level defined in the analysis model occurs at certain time intervals, and the water level change between these time intervals is assumed to be linear. However, in reality, the water level change between these dates may not show a linear change. In this case, the pore water pressure data obtained as a result of the analysis and the measured pore water pressure data do not match each other, and the realistic behavior of the dam cannot be obtained.
It is recommended that the ground models to be used in the modeling of the dams planned to be built are decided at the planning stage, and the necessary tests and experiments for the parameters needed in the ground structure model for which this decision is made during the planning and construction stages are also carried out and reported and recorded.
It is important for dam safety that dam monitoring plans are created for each dam at the planning stage and that periodic inspections, observations, and measurements begin from the first day of the dam’s construction and continue throughout the operating life of the dam.
Inspections, observations, and measurements at dams should be carried out periodically by expert personnel. The data obtained based on the audit, observation, and measurement results should be analyzed, evaluated by expert personnel, and archived carefully.
It is recommended to establish systems where critical measurements can be taken as automatically as possible and to carry out maintenance, calibration, and physical checks of measuring instruments and the systems they are connected to at specified periods. In this way, damage and malfunctions in measuring instruments and the systems they are connected to will be minimized, personal errors in measurement values will be prevented, and continuous data recording will be possible at specified periods.
In order for the measurement data to be taken from the dams to be more accurate and to obtain good performance from the devices, it is necessary to be very careful in choosing the measurement devices to be placed, determining the settlement areas, and taking the readings.
Author Contributions
Conceptualization, O.S. and S.S. (Sedat Sert); methodology, S.S. (Sedat Sert); software, S.S. (Suleyman Sarayli); validation, S.S. (Suleyman Sarayli); formal analysis, S.S. (Suleyman Sarayli); investigation, S.S. (Suleyman Sarayli); resources, S.S. (Suleyman Sarayli); data curation, S.S. (Suleyman Sarayli) and O.S.; writing—original draft preparation, S.S. (Suleyman Sarayli); writing—review and editing, O.S. and S.S. (Sedat Sert); visualization, S.S. (Suleyman Sarayli); supervision, O.S. and S.S. (Sedat Sert). All authors have read and agreed to the published version of the manuscript.
Funding
This research received no external funding.
Data Availability Statement
The data presented in this study are available on request from the corresponding author. The data are not publicly available due to privacy.
Conflicts of Interest
The authors declare no conflicts of interest.
References
- Yıllar Itibariyle Yapımı Tamamlanan Baraj Sayıları 1936–2022. Available online: https://dsi.gov.tr/Sayfa/Detay/1847 (accessed on 3 March 2024).
- Ağıralioğlu, N. Atatürk Barajı ve Türkiye’ye Etkileri, 1st ed.; Scala: İstanbul, Turkey, 2014; pp. 83–84. [Google Scholar]
- Uzel, T.; Erkaya, H.; Hoşbaş, R.G.; Gülal, E. Barajların güvenliği: Uygulamadan örnekler. In Proceedings of the International 2nd National Symposium on Dam Safety, Eskişehir, Turkey, 13–15 May 2009. [Google Scholar]
- You, L.; Li, C.; Min, X.; Xiaolei, T. Review of Dam-break Research of Earth-rock Dam Combining with Dam Safety Management. In Proceedings of the 2012 International Conference on Modern Hydraulic Engineering, Nanjing, China, 9–11 March 2012. [Google Scholar]
- Yenigün, K.; Yüzgül, F. Baraj elemanlarının tasarım ve yapım aşamasında baraj güvenliği kıstasıyla irdelenmesi; Ilısu Barajı Örneği. In Proceedings of the International Participation Fourth National Symposium On Dam Safety, Elazığ, Turkey, 9–11 October 2014. [Google Scholar]
- Abay, O.; Baykan, N.; Baykan, N.O. Tarih boyunca barajların elden çıkma nedenleri. In Proceedings of the 4. Su Yapıları Sempozyumu, Antalya, Turkey, 19–21 November 2015. [Google Scholar]
- Dam Failure. Available online: https://en.wikipedia.org/wiki/Dam_failure (accessed on 20 December 2023).
- Zhong, D.; Sun, Y.; Li, M. Dam break threshold value and risk probability assessment for an earth dam. Nat. Hazards 2011, 59, 129–147. [Google Scholar] [CrossRef]
- Amouzou, G.Y.; Soulaïmani, A. Numerical Algorithms for Elastoplacity: Finite Elements Code Development and Implementation of the Mohr–Coulomb Law. Appl. Sci. 2021, 11, 4637. [Google Scholar] [CrossRef]
- Shahzadi, G.; Soulaïmani, A. Deep Neural Network and Polynomial Chaos Expansion-Based Surrogate Models for Sensitivity and Uncertainty Propagation: An Application to a Rockfill Dam. Water 2021, 13, 1830. [Google Scholar] [CrossRef]
- Halil, İ.A. Ön Yüzü Beton Kaplı Sakarya Akçay Barajı’nın Sonlu Elemanlar Yöntemiyle Tasarımı ve Arazide Yapılan Ölçüm-lerle Karşılaştırılması. Master’s Thesis, Sakarya University, Sakarya, Turkey, 2021. [Google Scholar]
- Li, Y.; Zhang, H.; Yuan, Y.; Lan, L.; Su, Y. Research on Failure Modes and Causes of 100-m-High Core Wall Rockfill Dams. Water 2024, 16, 1809. [Google Scholar] [CrossRef]
- Klun, M.; Kryžanowski, A. Dynamic monitoring as a part of structural health monitoring of dams. Arch. Civ. Eng. 2022, 68, 569–578. [Google Scholar] [CrossRef]
- Wieland, M.; Kirchen, G.F. Long-term dam safety monitoring of Punt dal Gall arch dam in Switzerland. Front. Struct. Civ. Eng. 2012, 6, 76–83. [Google Scholar] [CrossRef]
- Ağıralioğlu, N. Baraj Güvenliği, 1st ed.; Beta: İstanbul, Turkey, 2011; pp. 120–142. [Google Scholar]
- Zhuang, W.; Liu, Y.; Zhang, R.; Ho, S.; Yang, Q. Study on deformation mechanism and parameter inversion of a reservoir bank slope during initial impoundment. Acta Geotech. 2023, 18, 4353–4374. [Google Scholar] [CrossRef]
- Aksu, S.; Ağca, E. Baraj emniyeti rehberi ve bölge taşkın planları. In Proceedings of the International 2nd National Symposium on Dam Safety, Eskişehir, Turkey, 13–15 May 2009. [Google Scholar]
- Baykan, N.O.; Yaşar, M.; Saf, B. Safety regulations and measuring devices in dams. In Proceedings of the International 2nd National Symposium on Dam Safety, Eskişehir, Turkey, 13–15 May 2009. [Google Scholar]
- Wu, J.T.H.; Tung, S.C.-Y. Determination of Model Parameters for the Hardening Soil Model. Transp. Infrastruct. Geotechnol. 2019, 7, 55–68. [Google Scholar] [CrossRef]
- Schanz, T.; Vermeer, P.A.; Bonnier, P.G. The Hardening Soil Model: Formulation and Verification. Available online: https://www.academia.edu/7922212/The_hardening_soil_model_Formulation_and_verification (accessed on 1 July 2024).
- Plaxis, B.V. Plaxis Version 8 Material Models Manual; Balkema: Rotterdam, The Netherlands, 2002. [Google Scholar]
Disclaimer/Publisher’s Note: The statements, opinions and data contained in all publications are solely those of the individual author(s) and contributor(s) and not of MDPI and/or the editor(s). MDPI and/or the editor(s) disclaim responsibility for any injury to people or property resulting from any ideas, methods, instructions or products referred to in the content. |
© 2024 by the authors. Licensee MDPI, Basel, Switzerland. This article is an open access article distributed under the terms and conditions of the Creative Commons Attribution (CC BY) license (https://creativecommons.org/licenses/by/4.0/).