Article

Modelling High Resolution Agricultural Nitrogen Budgets: A Case Study for Germany

1
Thünen-Institute of Rural Studies, Bundesallee 50, 38102 Braunschweig, Germany
2
Laboratory of Economics Rouen Normandie (LERN), Université Rouen Normandie, LERN UR 4702, 76186 Rouen Cedex 1, France
3
Partnership for Economic Policy (PEP), Nairobi P.O. Box 30772-00100, Kenya
*
Author to whom correspondence should be addressed.
Water 2024, 16(17), 2376; https://doi.org/10.3390/w16172376
Submission received: 6 August 2024 / Revised: 20 August 2024 / Accepted: 23 August 2024 / Published: 24 August 2024

Abstract

:
Water pollution with nitrogen (N) from agriculture constitutes a persisting environmental problem in intensive farming regions worldwide. Understanding the spatio-temporal interconnection between agricultural N emissions and N inputs to water bodies is key to evaluating and improving existing mitigation policies. Nitrogen flux models are an indispensable tool for addressing these complex research questions in the land use–water nexus, requiring adequate data on agricultural N surpluses. However, high-resolution farm management data are not readily available to the scientific community. We develop a municipality-level agricultural N budget model for Germany based on farm-level administration data from the Integrated Administration and Control System (IACS) and regional expert knowledge. We estimate a total agricultural N surplus of 58 kg N ha−1 of utilised agricultural area as the three-year average for 2014–2016. About 90% of municipalities exhibit N surpluses between 21 and 99 kg N ha−1. Evaluation with collected farm accountancy data revealed a good fit of the modelled (with observed) mineral N quantities applied. Our results highlight the potential of farm-level data for N flux models. Due to the ubiquitous reporting of land use and farming structures in the IACS, our approach can be adapted in other countries of the EU to serve as a harmonised backbone of monitoring and policy impact assessments.

1. Introduction

1.1. The Significance of Nitrogen Flux Models

Nitrogen (N) emissions to the environment are one of the most challenging global and regional environmental problems of global change [1,2,3,4,5], and pollution with N derivatives generates substantial societal costs [6]. In large parts of the world N-related environmental boundaries for ground- and surface waters are exceeded, particularly in Central Europe and South and East Asia [4,7]. Agricultural N surpluses stemming from unbalanced fertilisation are the major source of N inputs into waters, leading to severe eutrophication of fresh and marine surface waters and to contaminated groundwater [2,8,9].
Depending on the hydrogeological conditions, i.e., the amount of leachate, the residence time of leachate in the soil and the denitrification processes in the soil and in the saturated zone, the same N surplus can impact water bodies differently in terms of N inputs and nitrate (NO3) concentrations [9]. N can accumulate in soils and groundwater, which, combined with the residence times of N in soil and groundwater, leads to time lags before improved N management is measurable in water bodies [10,11,12].
In the European Union (EU), the Water Framework Directive (WFD), together with two of its sub-directives, the Nitrates Directive (NiD) and the Marine Strategy Framework Directive, constitute a comprehensive framework for water protection policies in the EU. These require member states to inform about the drivers and pressures of water pollution with N as well as (potential) impacts of mitigation policies [13,14,15]. So far, many member states have failed to comply with the water quality goals regarding nitrate [16].
Nitrogen flux models—i.e., spatially explicit area-wide model-systems linking N emissions with geohydrological processes—are an essential and widely used tool to quantify N fluxes in the environment at river basin or country level [17,18,19,20,21]. These model systems may provide spatial information on N inputs into waters and the respective reduction requirements, such as required by WFD and NiD [16,22,23] and assist with spatial targeting [24,25] or evaluation [21,26,27,28,29,30] of mitigation policies. Nitrogen flux models typically require spatially explicit estimates on agricultural N emissions at the soil surface [17,31], as N surpluses correlate well with N leaching and discharge rates if aggregated across time and/or space [32,33,34]. A widely used method to quantify agricultural nutrient emissions is the calculation of N budgets [35,36]. N budget contrast N inputs and outputs for a limited system, and their difference gives the N surplus [36]. Depending on the research question, the choice of system boundaries determines the budgeting method, for instance farm gate budget, soil surface budget or the holistic Net Anthropogenic Nitrogen Inputs approach [36,37,38,39].

1.2. Challenges in Modelling High-Resolution Agricultural N Budgets

In a systematic validation study of NO3 concentrations in leachates below the root zone, Wolters et al. [40] demonstrated the need for accurate high-resolution N surplus estimates to improve predictions of changes in NO3 inputs to groundwater in N flux models. Many existing N budgeting approaches model N surplus at the district (NUTS-3 (https://ec.europa.eu/eurostat/web/nuts/background, accessed on 1 August 2024)) level or above [35,41,42,43,44,45]. Until now, only few studies on N emissions at higher spatial resolutions (e.g., municipality level or 5 arcmin grid) have been published for the international scientific community [46,47,48,49]. However, choosing a high spatial resolution when estimating N surpluses for N flux models has several advantages. First, it allows for the identification of local pollution hotspots in regions of heterogeneous environmental conditions and agricultural production intensity [47]. Second, as mentioned above, N flux models require adequate N surplus data to improve the accuracy of modelled NO3 concentrations in leachates [40] by providing more realistic data on N in soils that are at risk of leaching. Similarly, the data can potentially improve spatial estimates of ammonia emissions or denitrification processes in agricultural soils [50]. Third, high-resolution N budgets help to improve subsequent analyses relying on N emission data, such as international greenhouse gas reporting [50,51] or biodiversity monitoring [52].
Data of sufficient quality are required to achieve these high-resolution results. Typically, statistical data are used, which—if available at high spatial resolution—may be incomplete due to data protection constraints [48]. Similarly, readily available aggregate data must be disaggregated by algorithms, which typically requires assumptions about the spatial distribution of land use and other variables [47,49]. To overcome these limitations, farm-level administration data can serve as input data for regional agricultural N surplus models. These datasets include, for example, data on land use, livestock farming or manure transport, which must be documented and reported to the authorities by agricultural businesses as part of statutory reporting obligations. The EU-wide Integrated Administration and Control System (IACS) administers and processes the information that farms must provide to receive payments from the European Common Agricultural Policy (CAP) funding and contains annual information on land use and livestock numbers.

1.3. Study Objective

Germany has been struggling to meet N-related environmental goals [53], especially regarding NO3 pollution. Although slow progress has been made, Germany has failed to comply with both the WFD and the NiD [23,54]. Failure to comply with the NiD eventually led to an EU infringement proceeding against Germany and Germany’s conviction in front of the European Court of Justice in 2018 [55]. As a consequence, Germany had to revise and tighten its NiD Action Programme and the Fertiliser Application Ordinance and to implement an additional monitoring system to assess the impact of the Fertiliser Application Ordinance on groundwater and surface waters to avoid substantial penalty payments.
Against this background, the AGRUM-DE project had the goal of developing a nationwide N flux model in Germany based on the “best available data” in the German federal states [9]. Within the project, we extended the municipality extension of the Regionalised Agricultural Information System for Germany (RAUMIS) [56,57] to Germany to model agricultural N soil surface budget surpluses as input data for subsequent hydrogeological flux models [9] based on farm-level administration data. While several regional grey literature studies on N budgets using similar datasets exist for some German federal states [24,58,59,60], this work is, to our knowledge, the first to use nation-wide farm-level administration data to model high-resolution agricultural N budgets.
A major difficulty in the process was to account for regional characteristics in the national model. To overcome this, an expert panel with 51 members from local agricultural and water authorities was established to accompany and evaluate the model development [61]. In this way, local knowledge about regional agricultural production structures could be accounted for in the process.

2. Material and Methods

2.1. Selected Agricultural Structure Determinants in Germany

With about 16.6 million ha of utilised agricultural area (UAA), of which 12.1 million ha are arable land and permanent crops and 4.5 million ha are grassland (Figure 1a,b), Germany is one of the largest agricultural producers in the EU. Its agricultural sector is characterised by heterogenous climatic and hydrogeological conditions and a wide range of farm types, farm sizes, agricultural production structures and land use types, with a substantial share of intensive animal husbandry (Figure 1c) and biogas production, especially in north-west (North Rhine-Westphalia, Lower Saxony and Schleswig-Holstein) and south-east (Bavaria and western Baden-Württemberg) Germany. Cattle farming with a focus on dairy production dominates in the foothills of the Alps and the coastal regions of the north-west (Figure 1d). Intensive pig and poultry production is mainly located in the north-west, while large parts of eastern Germany are dominated by arable farming.

2.2. Model Input Data

We compiled the model database for the years 2014 to 2016 from agricultural administration data provided by the federal state authorities and statistical information (Table 1). Before entering the model, the database was aggregated to municipalities (n = 9649). To reduce the impact fluctuations concerning N input, N removal and the respective N surplus, the three-year average of the agricultural production data for 2014–2016 has been used as the model input. Land use information was extracted from the IACS. The IACS database provides geo-referenced land use information on every parcel, combined with livestock information, for every farm that has applied for direct EU payments, which is the vast majority of farms in Germany. This allows N emissions to be modelled by the situs principle, meaning that emissions are assigned to actual farm plots. Data on cattle farming in the IACS stem partially from the Identification and Information System for Animals (ISA), which tracks the birth, transport, slaughter or natural death of individual cattle, resulting in a good representation of cattle numbers. As landless livestock farming is not part of the dataset, municipality data on poultry and pig production are taken from the Thünen Agraratlas, a dataset based on statistical information that includes commercial livestock production. Coefficients for animal N excretion, animal roughage uptake and the N content of harvest products were taken from the literature [60,61,62] (see Tables S1 and S2 in the Supplementary Materials).

2.3. Municipality-Level N Budget Model

The RAUMIS model core is a regionalised agricultural supply model at the NUTS-3 level [56] that has been employed for agricultural policy assessments, e.g., [63,64,65]. For modelling N soil surface budgets, we used a separate municipality module [21,51,57,66], driven by the aforementioned database.

2.3.1. N Soil Surface Budgets

N budget surpluses for municipalities i ( N S i ) are defined as the difference between the total N application ( N A i ) and the total N removal ( N R i ):
N S i = N A i N R i
A i c represents the amount of a specific crop c grown in municipality m , M i is the total amount of mineral N and O i k is the total amount of organic N applied with fertiliser k (animal manure, biogas digestates, sewage sludge and compost). c f i c represents the legume N fixation rates, Y i c represents the regional crop yields per ha, c n i c is the respective crops’ N content and G i k is the total gaseous emissions from animal housing, storage and application of organic fertilisers. The N application for every municipality is then defined as
N A i = k ( O i k G i k ) + M i + c ( c f i c × A i c )
with G i k = 0 for k ( c o m p o s t , s e w a g e , s l u d g e ) . For N removal,
N R i = c Y i c × A i c × c n i c
holds. If yield data are not available for a crop, removal rates are either calculated based on standard yields from the literature [67] or crop-specific average removal rates are assumed. As no reliable regional data on agricultural grassland management are available in Germany, grassland yields are estimated based on roughage balances at the NUTS-3-level.

2.3.2. Organic Fertiliser Input

Modelling N application with manure and digestate requires the simultaneous consideration of animal excretion, the digestion of substrates in biogas plants and manure transportation. The interregional distribution of organic N in manure and digestate is simulated in the model for regions without data on manure transportation. The calculation for net organic fertiliser (OrgF) application is represented by Equation (4). H i a is the number of animals kept for livestock a , and c e i a is their average annual N excretion rate. The substrate requirement of biogas plants ( D i s ) is calculated for the three substrate classes ( s )—animal manure, energy plants and organic wastes—with c s s denoting their respective N content. T S i indicates the amount of manure N that is digested in biogas plants ( T S i 0 ), and T D i k denotes the amount of manure N or digestate N that is transported across regions.
O r g F i k = a ( H i a × c e i a ) + T S i + T D i k G i k for   k = m a n u r e s ( D i s × c s s ) + T D i k G i k for   k = d i g e s t a t e M k × γ i k × c s k for   k { compost ,   sewage ,   sludge }
Both T S and T D are only partly available from the data and are thus simulated according to the approach by Kreins et al. [68]. Modelling manure transport at the municipality level is complex due to many possible transport relationships between the municipalities and requires much computation time. To reduce this complexity, the approach of Kreins et al. [68] is simplified by modelling total transport costs as a function of distance and neglecting farms’ marginal costs and the benefits of manure transportation. The optimisation problem is constrained by the manure and digestate availability ( T S and T D ), the application constraints for organic fertilisers and the regional demand for manure as the substrate for digestion ( T S ). Subsequently, the model simulates minimal manure transportation distances while respecting the mass balance constraints. Gik indicates ammonia emissions originating from the stable and from manure management.
Sewage sludge application rates are partially taken from plot-wise application registers. When only aggregate data are available ( M k ), the spatial distribution of N applied with compost and sewage sludge is modelled based on the distribution ( γ i k ) and the respective N content ( c s k ). The parameter γ i k represents the proportion of crops suitable for fertilising with compost and sludge in the respective municipalities.

2.3.3. Biological N Fixation

Biological N fixation ( N F I X i ) is calculated separately for arable land and grassland. On arable land, biological N fixation is obtained by weighting legume production area with the per hectare fixation rates. On grassland, different fixation rates are used for favourable (25 kg N ha−1 UAA) and unfavourable (12 kg N ha−1 UAA) natural site conditions; pastures are assigned the rate of 10 kg N ha−1 UAA [69,70].

2.3.4. Mineral Fertiliser Application

Regional data on mineral fertiliser (MinF) use is not available. Thus, in RAUMIS, mineral fertiliser application is modelled by means of auxiliary yield- and crop dependent N requirement functions, reflecting the amount of N that a crop requires to meet a given yield level, considering both the site conditions as well as cropping patterns [57]. The total N requirement ( T R i ) per municipality, which is not part of the N budget, is calculated as
T R i = x s i × j [ ( a j × Y i j + b j ) × A i j ] j ( N P i j × A i j )
with x s i reflecting local site specifics such as soil and climate conditions [71] and a j and b j ( a 0 ) are crop-specific parameters of the N requirement functions. The linear requirement functions imply that N surpluses rise ceteris paribus with management intensities, which are proxied by the regional yield levels. N P j is the amount of N that is available from the residuals of previous crops. With c s r j representing the share of crop residuals as a fraction of Y j , c n r j denoting the N concentration in crop residuals and c n r a j being the share of N available to succeeding crops, N P j can be expressed as
N P i j = Y i j × c s r j × c n r j × c n r a j
Finally, the total MinF application at the municipality level is computed by
M i n F i = β × T R i k ( α k × O r g F i k ) N F I X i
with α k as the share of total organic N being available for the crops [72] and β as a calibration factor ( β = 1.01 ) . As N applied with organic fertiliser is usually not as readily available for plants compared with MinF [44,73], only a fraction of the organic N input is considered for fertilisation planning [72]. These factors ensure that i = 1 n M i n F i approximates the amount of mineral fertiliser reported in the national mineral fertiliser sales statistics [74] (Figure 2). N from atmospheric deposition is usually considered in soil surface budgets [36], but it is omitted here as the model is employed in a nutrient flux model chain where N deposition is accounted for in downstream hydrological models [9].

2.4. Model Evaluation

To evaluate the model, we compare modelled municipality-level mineral fertiliser inputs with weighted farm-level data from the German Farm Accountancy Data Network (FADN) for 2016/17. The sample dataset contains annual purchased mineral fertiliser quantities for 6112 single farms [75]. To obtain a consistent estimator on regional mineral fertiliser use, the farm sample is weighted by farm-type-specific extrapolation factors derived from the national farm survey to represent the German farm and agricultural structure [75,76,77]. We use mineral fertiliser instead of calculating N surpluses for the FADN dataset as the benchmark because the mineral fertiliser quantities applied can be taken directly from farm accountancy data and are therefore associated with less uncertainty than those derived from farm-level N surpluses.

3. Results

3.1. Overview

The total average N surplus for the period 2014–2016 amounts to 58 kg N ha−1 UAA (963.500 t N in total), which represents more than 30% of the average N input of 202 kg N ha−1 UAA (Table 2). Mineral fertiliser contributes 51% of the total N input and is the largest N source, while 26% arises from manure, 16% from biogas digestate and 5% from biological N fixation. Compost, sewage sludge and N from seeds collectively contribute 2% to the total N input. Organic fertilisers together account for 44% of the total N input. A total of 144 kg N ha−1 UAA is removed with harvest products, which equals 70% of the total net input.

3.2. N Inputs from Manure and Digestate

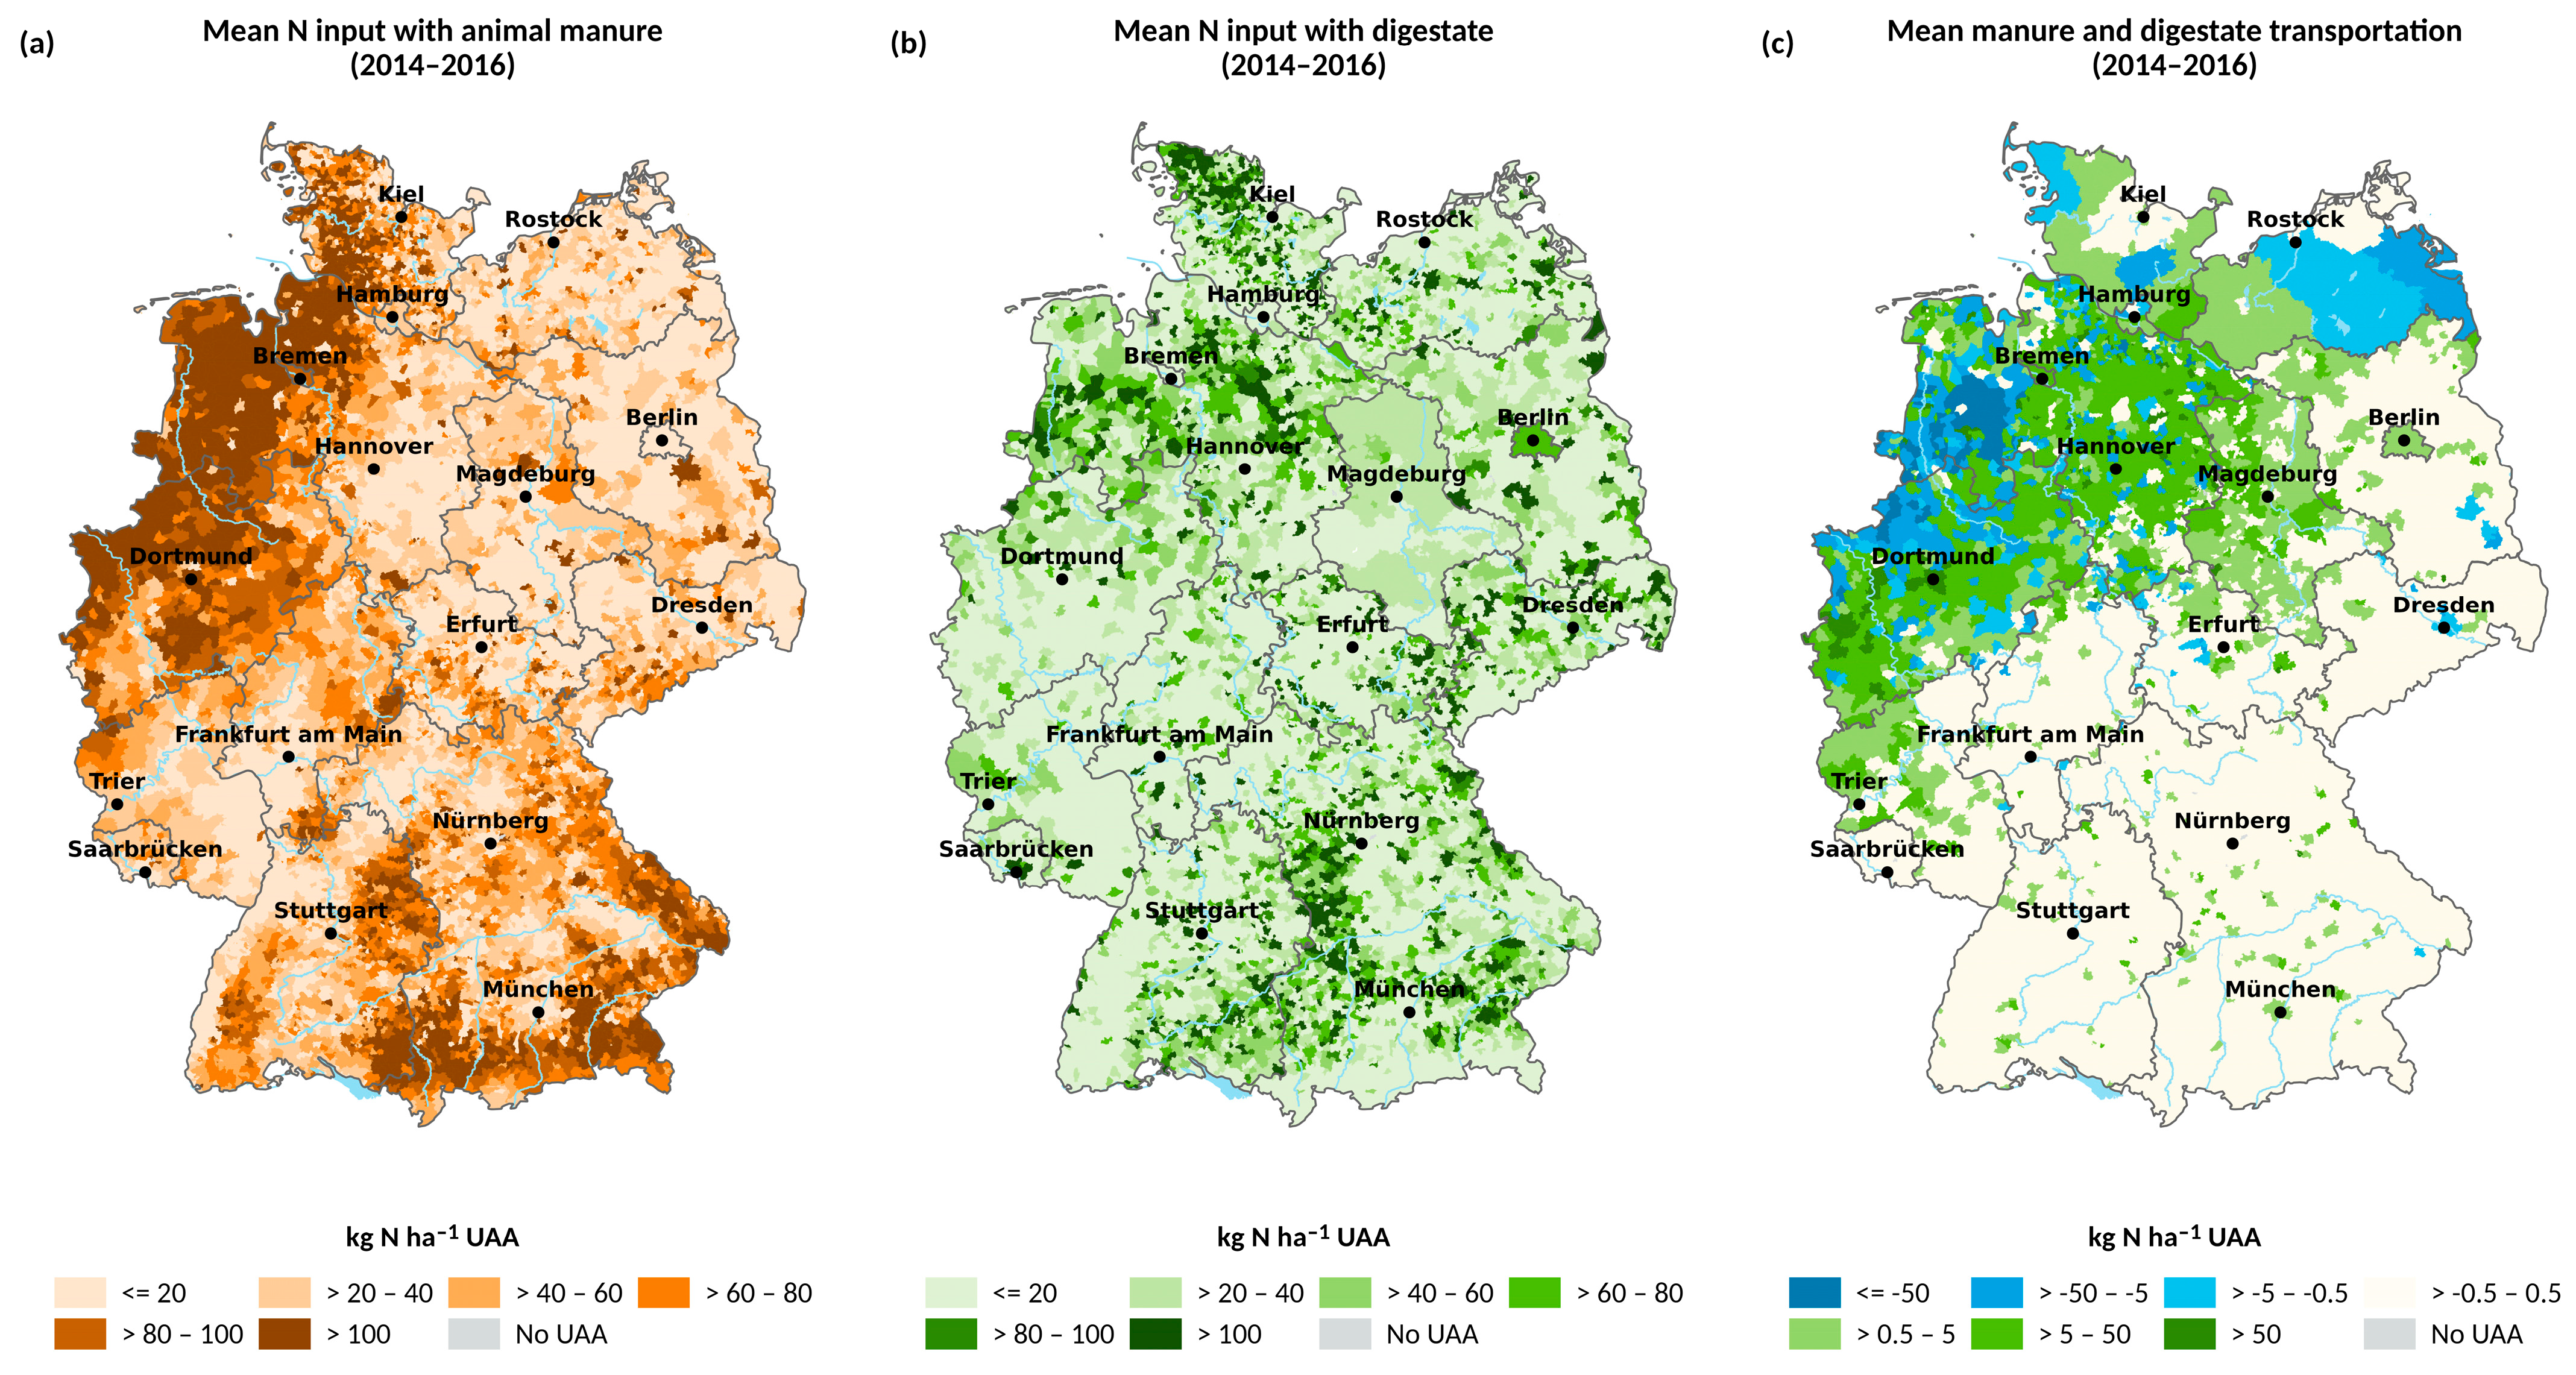
The spatial distribution of manure application demonstrates that high amounts of N input are clustered in regions with dense livestock populations (Figure 3a). The mean manure application for the period 2014–2016 is 51.7 kg N ha−1 UAA. However, in the livestock-intensive regions in the north-west and the south-east with more than 1.5 LU ha−1 UAA, more than 100 kg N ha−1 UAA from manure is applied. Conversely, low manure application rates, often less than 40 kg N ha−1 UAA, can be observed in regions with comparably low livestock densities, especially in the north-east.
The application of digestate, averaging 32.2 kg N ha−1 UAA, is a comparatively less substantial N source than animal manure (Figure 3b). However, approximately 50% of the modelled N applied with digestate originates from animal manure, while the remaining half stems from energy plants (e.g., silage maize, grass clover). Digested N originating from biowaste and other sources accounts for 1.3%. Regions with digestate fertilisation exceeding 100 kg N ha−1 UAA are present in the south-east, the north-west and the very north, particularly near the Danish border. In contrast to animal manure, the spatial distribution of digestate exhibits a more granular pattern, reflecting the fact that animal production activities occur in 99% of municipalities while biogas production plants are present in only 38% of municipalities.
Manure and digestate is predominantly exported from the livestock-abundant north-west to the arable regions, e.g., the Börde area near Magdeburg or the Cologne Bight in the west (Figure 3c). Manure and digestate transportation is particularly significant at the regional level, especially within Lower Saxony and North Rhine–Westphalia; municipalities that are net exporters reduce N amounts from manure and digestate on average by 15% (30 kg N ha−1 UAA) while net-importing municipalities receive 20 kg N ha−1 UAA, on average. Net exports of individual municipalities amount to up to 270 kg N ha−1 UAA, while net imports reach 280 kg N ha−1 UAA. However, net transports on a national level are negligible, amounting to less than 1 kg N ha−1 UAA of the net imports from neighbouring countries.

3.3. N Inputs from Biological N Fixation and Other Organic Sources

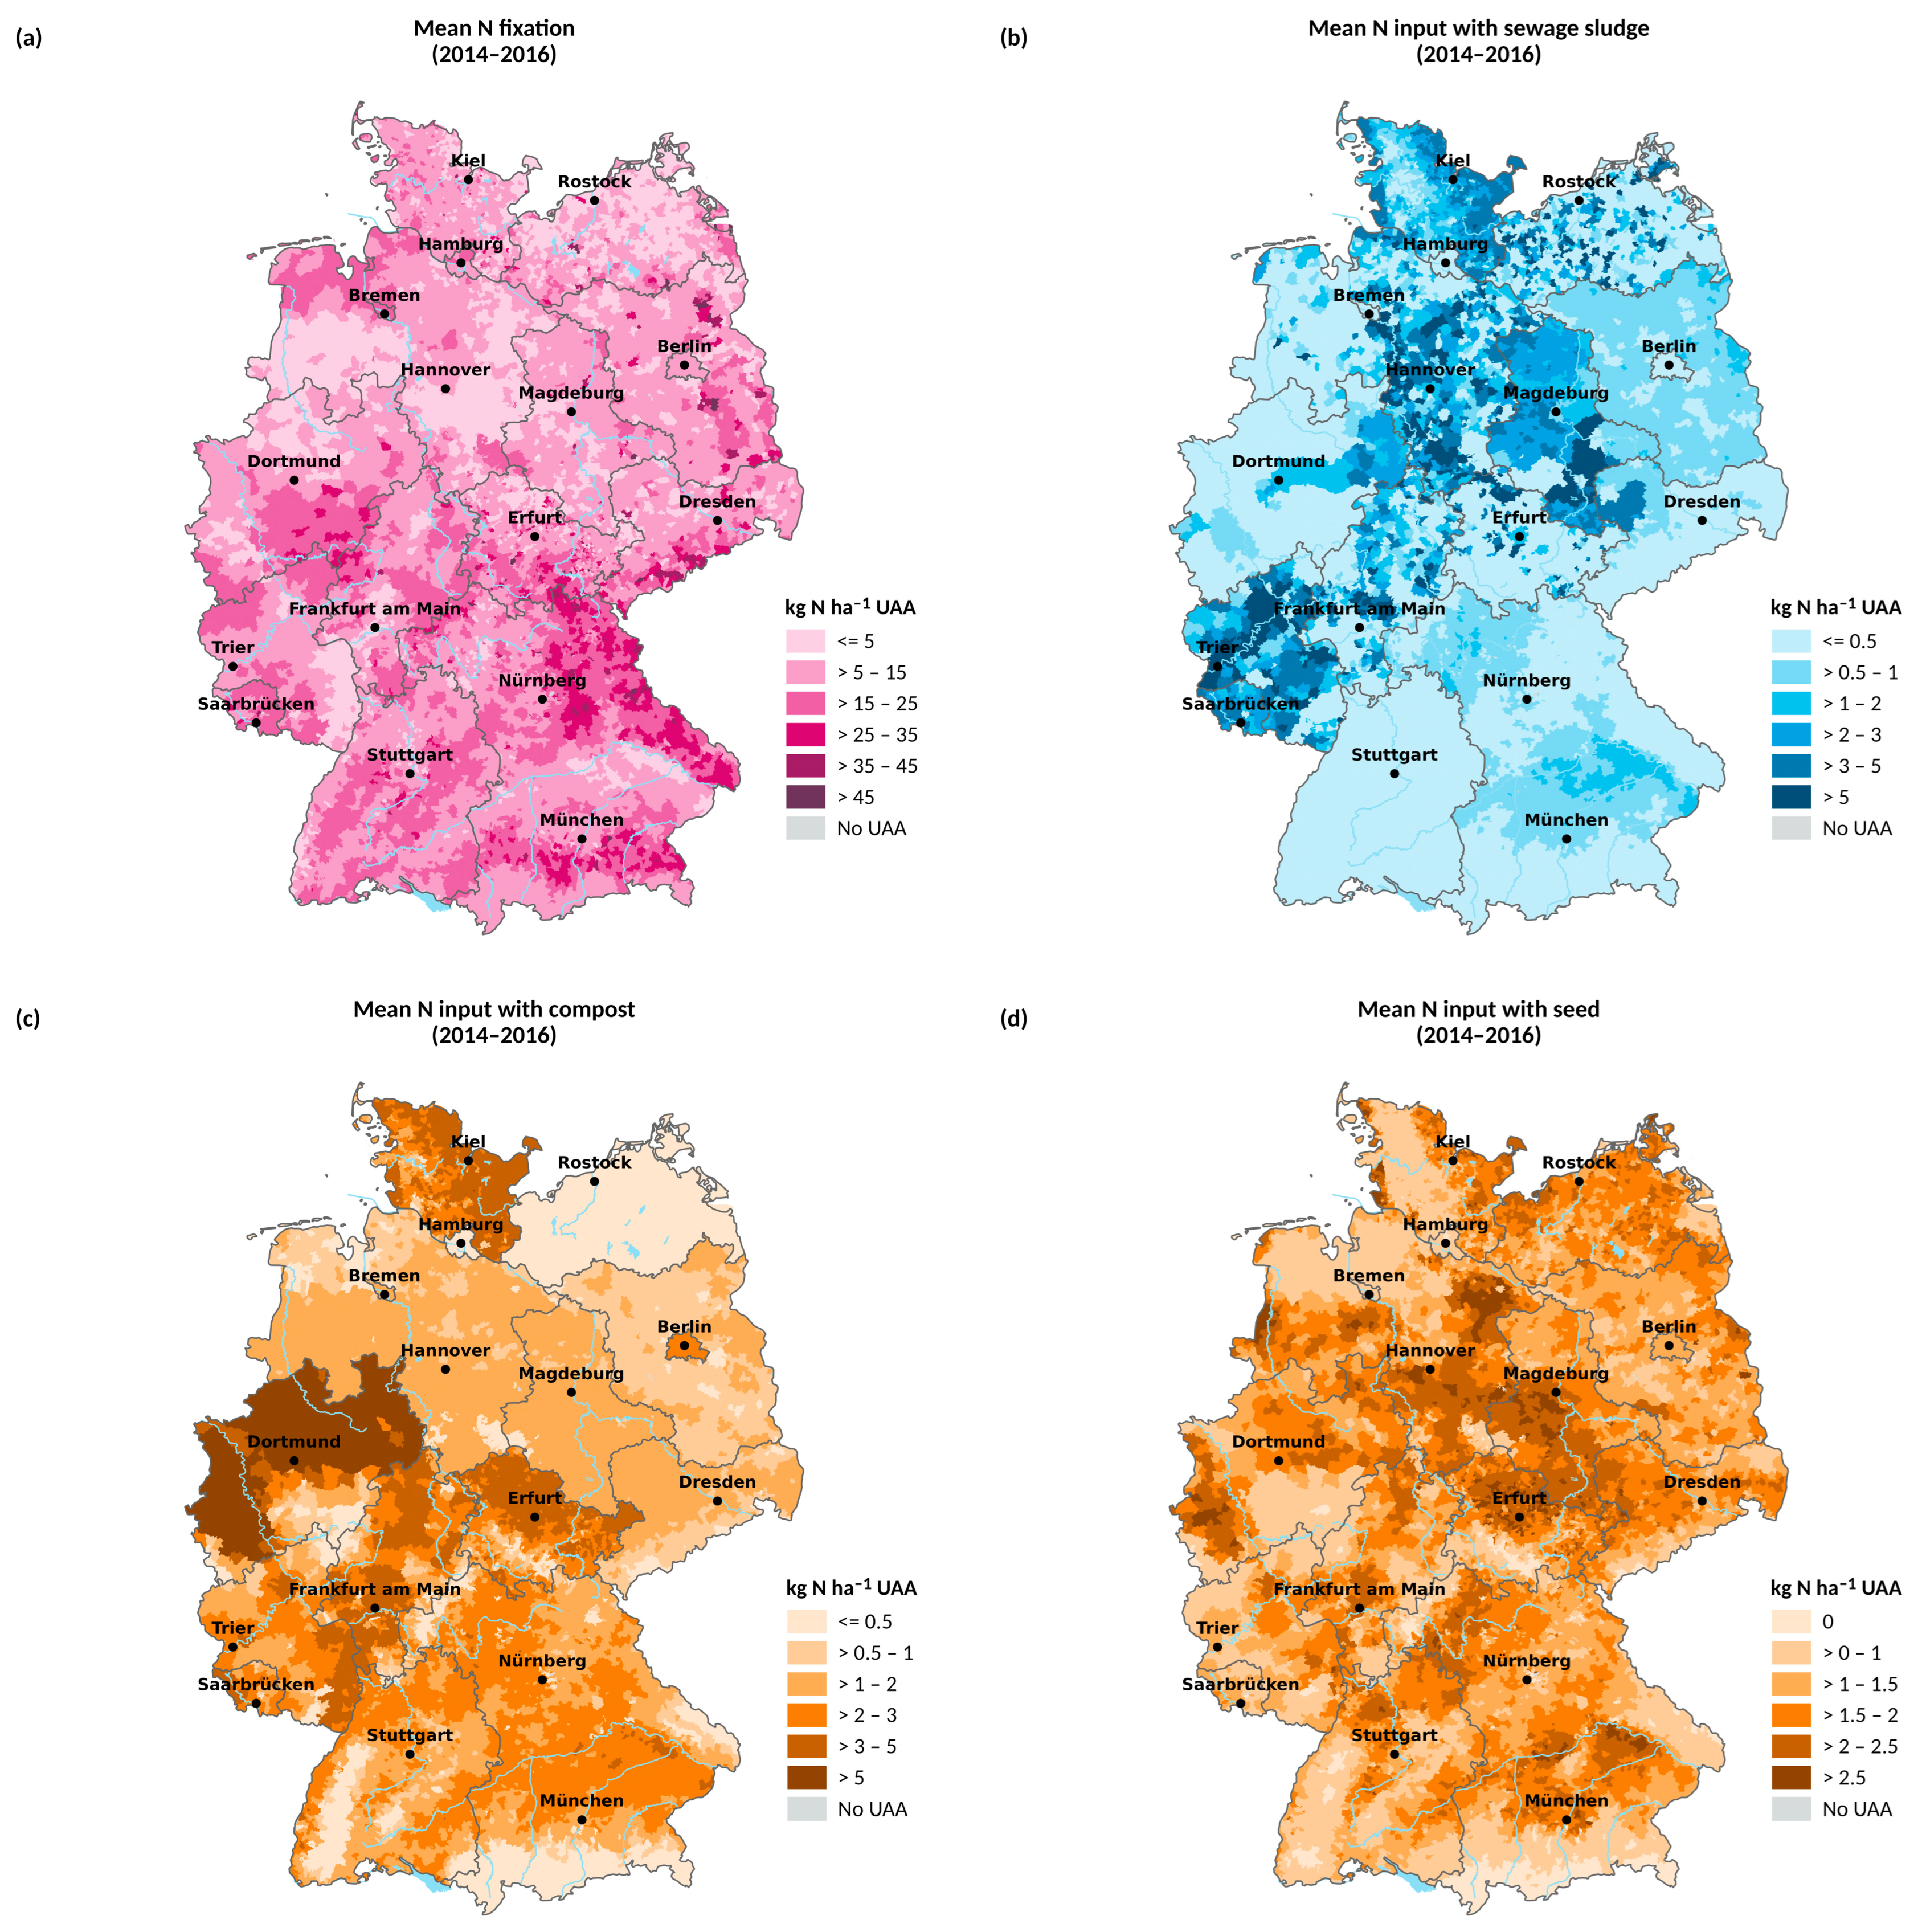
The remaining non-mineral N inputs sum up to 15.6 kg N ha−1 UAA, which equals 7.7% of total N inputs (Table 2). High biological fixation rates of more than 25 kg N ha−1 UAA are predominant in the grassland regions along the Alpine foothills and low mountain ranges (Figure 4a). Here, favourable fixation conditions in the grassland regions coincide with substantial shares of legume-based arable forage cultivation or grain legume production on arable land. Low N inputs from biological fixation occur mainly in regions with a high proportion of arable farming or above average non-ruminant livestock densities (Figure 1a), where legume crops are usually not economically competitive. In 90% of the municipalities, the share of biological N fixation among the total N input ranges between less than 0.1% and 19.1%.
Similarly to biological fixation, N input from sewage sludge and compost (in total 4 kg N ha−1 UAA) is of minor relevance compared with inputs from manure and mineral fertiliser (Figure 4c). The differences in the spatial patterns of N input from sewage sludge (Figure 4b) originate from different data sources (Table 1). Input data in regions with more pronounced regional patterns and above-average application rates stem from German federal state sewage sludge application registers with plot-wise application information (e.g., Mecklenburg–Western Pomerania). For the remaining federal states, regional application rates had to be modelled based on NUTS1-level statistical data. The total N input from seeds and planting material (Figure 4d) is 1.5 kg N ha−1 UAA. or 0.7% of the total N input. Grassland reseeding was not considered due to limited data availability, resulting in low N inputs in grassland-dominated regions.

3.4. Mean Crop N Requirement and N Inputs from Mineral Fertiliser Application

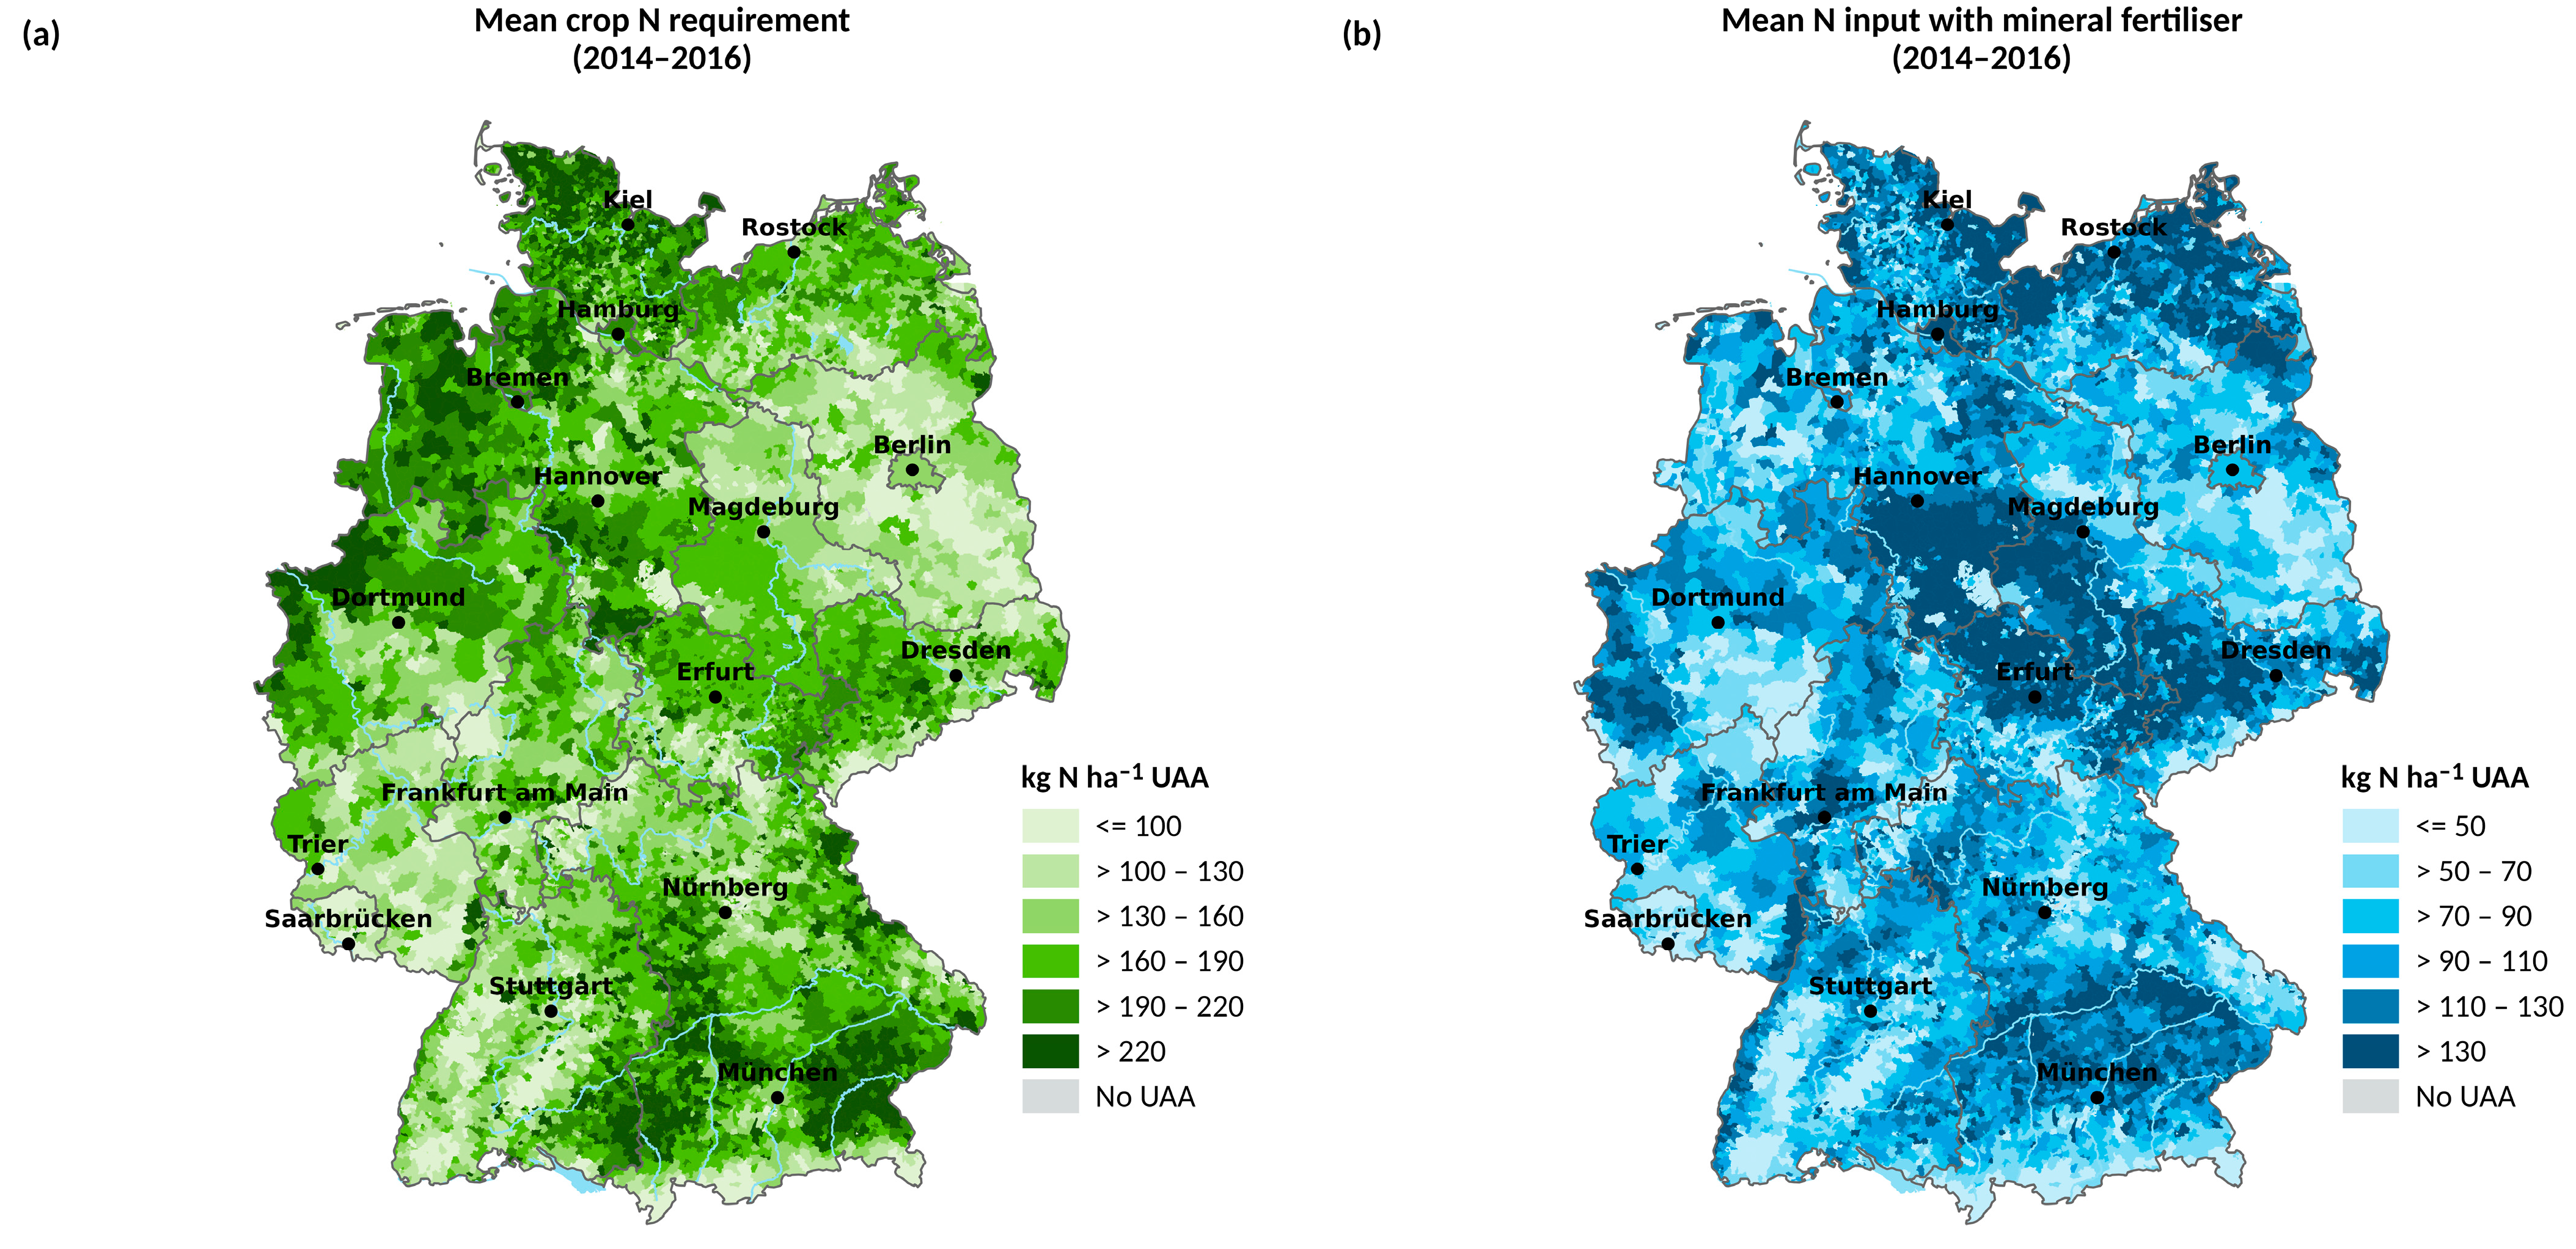
The average modelled N requirement of 174 kg N ha−1 UAA is 13% lower than the total N input. This is due to the fact that only a fraction of organic fertiliser is available for plants in the same year, which must be accounted for in fertilisation planning [60]. Regions with N requirements above 190 kg N ha−1 UAA are mainly the north-west and the south-east (Figure 5a), where the livestock density is high (Figure 1c). The N requirement rates in these regions are partially larger compared with regions with intensive arable farming, e.g., in Mecklenburg–Western Pomerania or the Börde region. Low N requirement levels are found in the grassland-dominated regions of low mountain ranges (Black Forest, Bergisches Land) and the Alps.
Equation (7) defines a negative correlation between the N input from organic fertilisers and the mineral fertiliser input. Thus, livestock-intensive regions may have large N requirement rates, but these are mostly met by organic fertilisation, resulting in comparably low mineral N application rates (<70 kg N ha−1 UAA; Figure 5b). Regions where organic N is scarce, such as central-eastern and north-eastern Germany, must cover their N requirement through mineral fertilisation. In these regions, where grain and rapeseed production dominate crop rotations, or in the Rhine Valley along the south-western German border, where intensive vegetable production is located, above-average mineral fertiliser application rates greater than 130 kg N ha−1 UAA occur. Mineral fertiliser application rates of less than 50 kg N ha−1 UAA occur in regions with less intensive arable farming with large shares of rye and oat in crop rotations (e.g., in the dry regions of eastern Germany). The same is observed in grassland regions (e.g., southern Germany), as productive grassland in Germany is often combined with manure fertilisation originating from intensive dairy production or suckler cow husbandry (Figure 1).

3.5. Total N Input, N Removal and N Surplus

The total average N surplus is the difference between N inputs of 201.8 kg N ha−1 UAA and removals of 143.5 kg N ha−1 UAA and amounts to 58.3 kg N ha−1 UAA. Total N inputs and N removal products show corresponding spatial patterns but at different levels (Figure 6). The model results show high total N inputs (>180 kg N ha−1 UAA) for regions with high livestock and biogas production densities, especially in the north-west and the south-east (Figure 6a). Below-average N inputs (<150 kg N ha−1 UAA) occur in the extensive grassland regions of the Alps and the south-western low mountain ranges (Black Forest and Sauerland) as well as in Brandenburg, where unfavourable soil and climate conditions allow only low-input arable production. This spatial pattern also holds for N removals (Figure 6b); the north-west and the south-east are characterised by high removal rates (>150 kg N ha−1 UAA), while the south-west and the north-east exhibit removal rates that are 40 to 80 kg N ha−1 UAA lower. Total N inputs and N removal rates in intensive arable farming regions (e.g., Mecklenburg–Western Pomerania, Magdeburg Börde area, Cologne bight) are both higher than in grassland-dominated regions, but they do not reach the levels of those in the north-west and the south-east.
The N surplus distribution across Germany (Figure 7) corresponds to the input and removal patterns (Figure 6). Regions with N surpluses greater than 80 kg N ha−1 UAA are mainly located in the north-west and the south-east. In contrast, large parts of the south-west and the north-east are characterised by below-average N surpluses of below 40 kg N ha−1 UAA. Ninety percent of municipality-level N surpluses range between 21 and 99 kg N ha−1 UAA. Surpluses of more than 100 kg N ha−1 UAA occur in about 5% of municipalities (Table 2), often coinciding with substantial livestock density (Figure 1c) or digestate fertilisation (Figure 3b), but they also occur in regions without organic N abundance, for example, in the vegetable production regions of Rhine Valley. While the general N surplus level can be homogeneous at the landscape level (e.g., surpluses are generally high in the north-west and low in the north-east), individual municipalities with high N surpluses may occur, as can landscapes with comparably low N surplus levels and vice versa.

3.6. Comparison of Modelled Mineral Fertilizer Applied with FADN Data

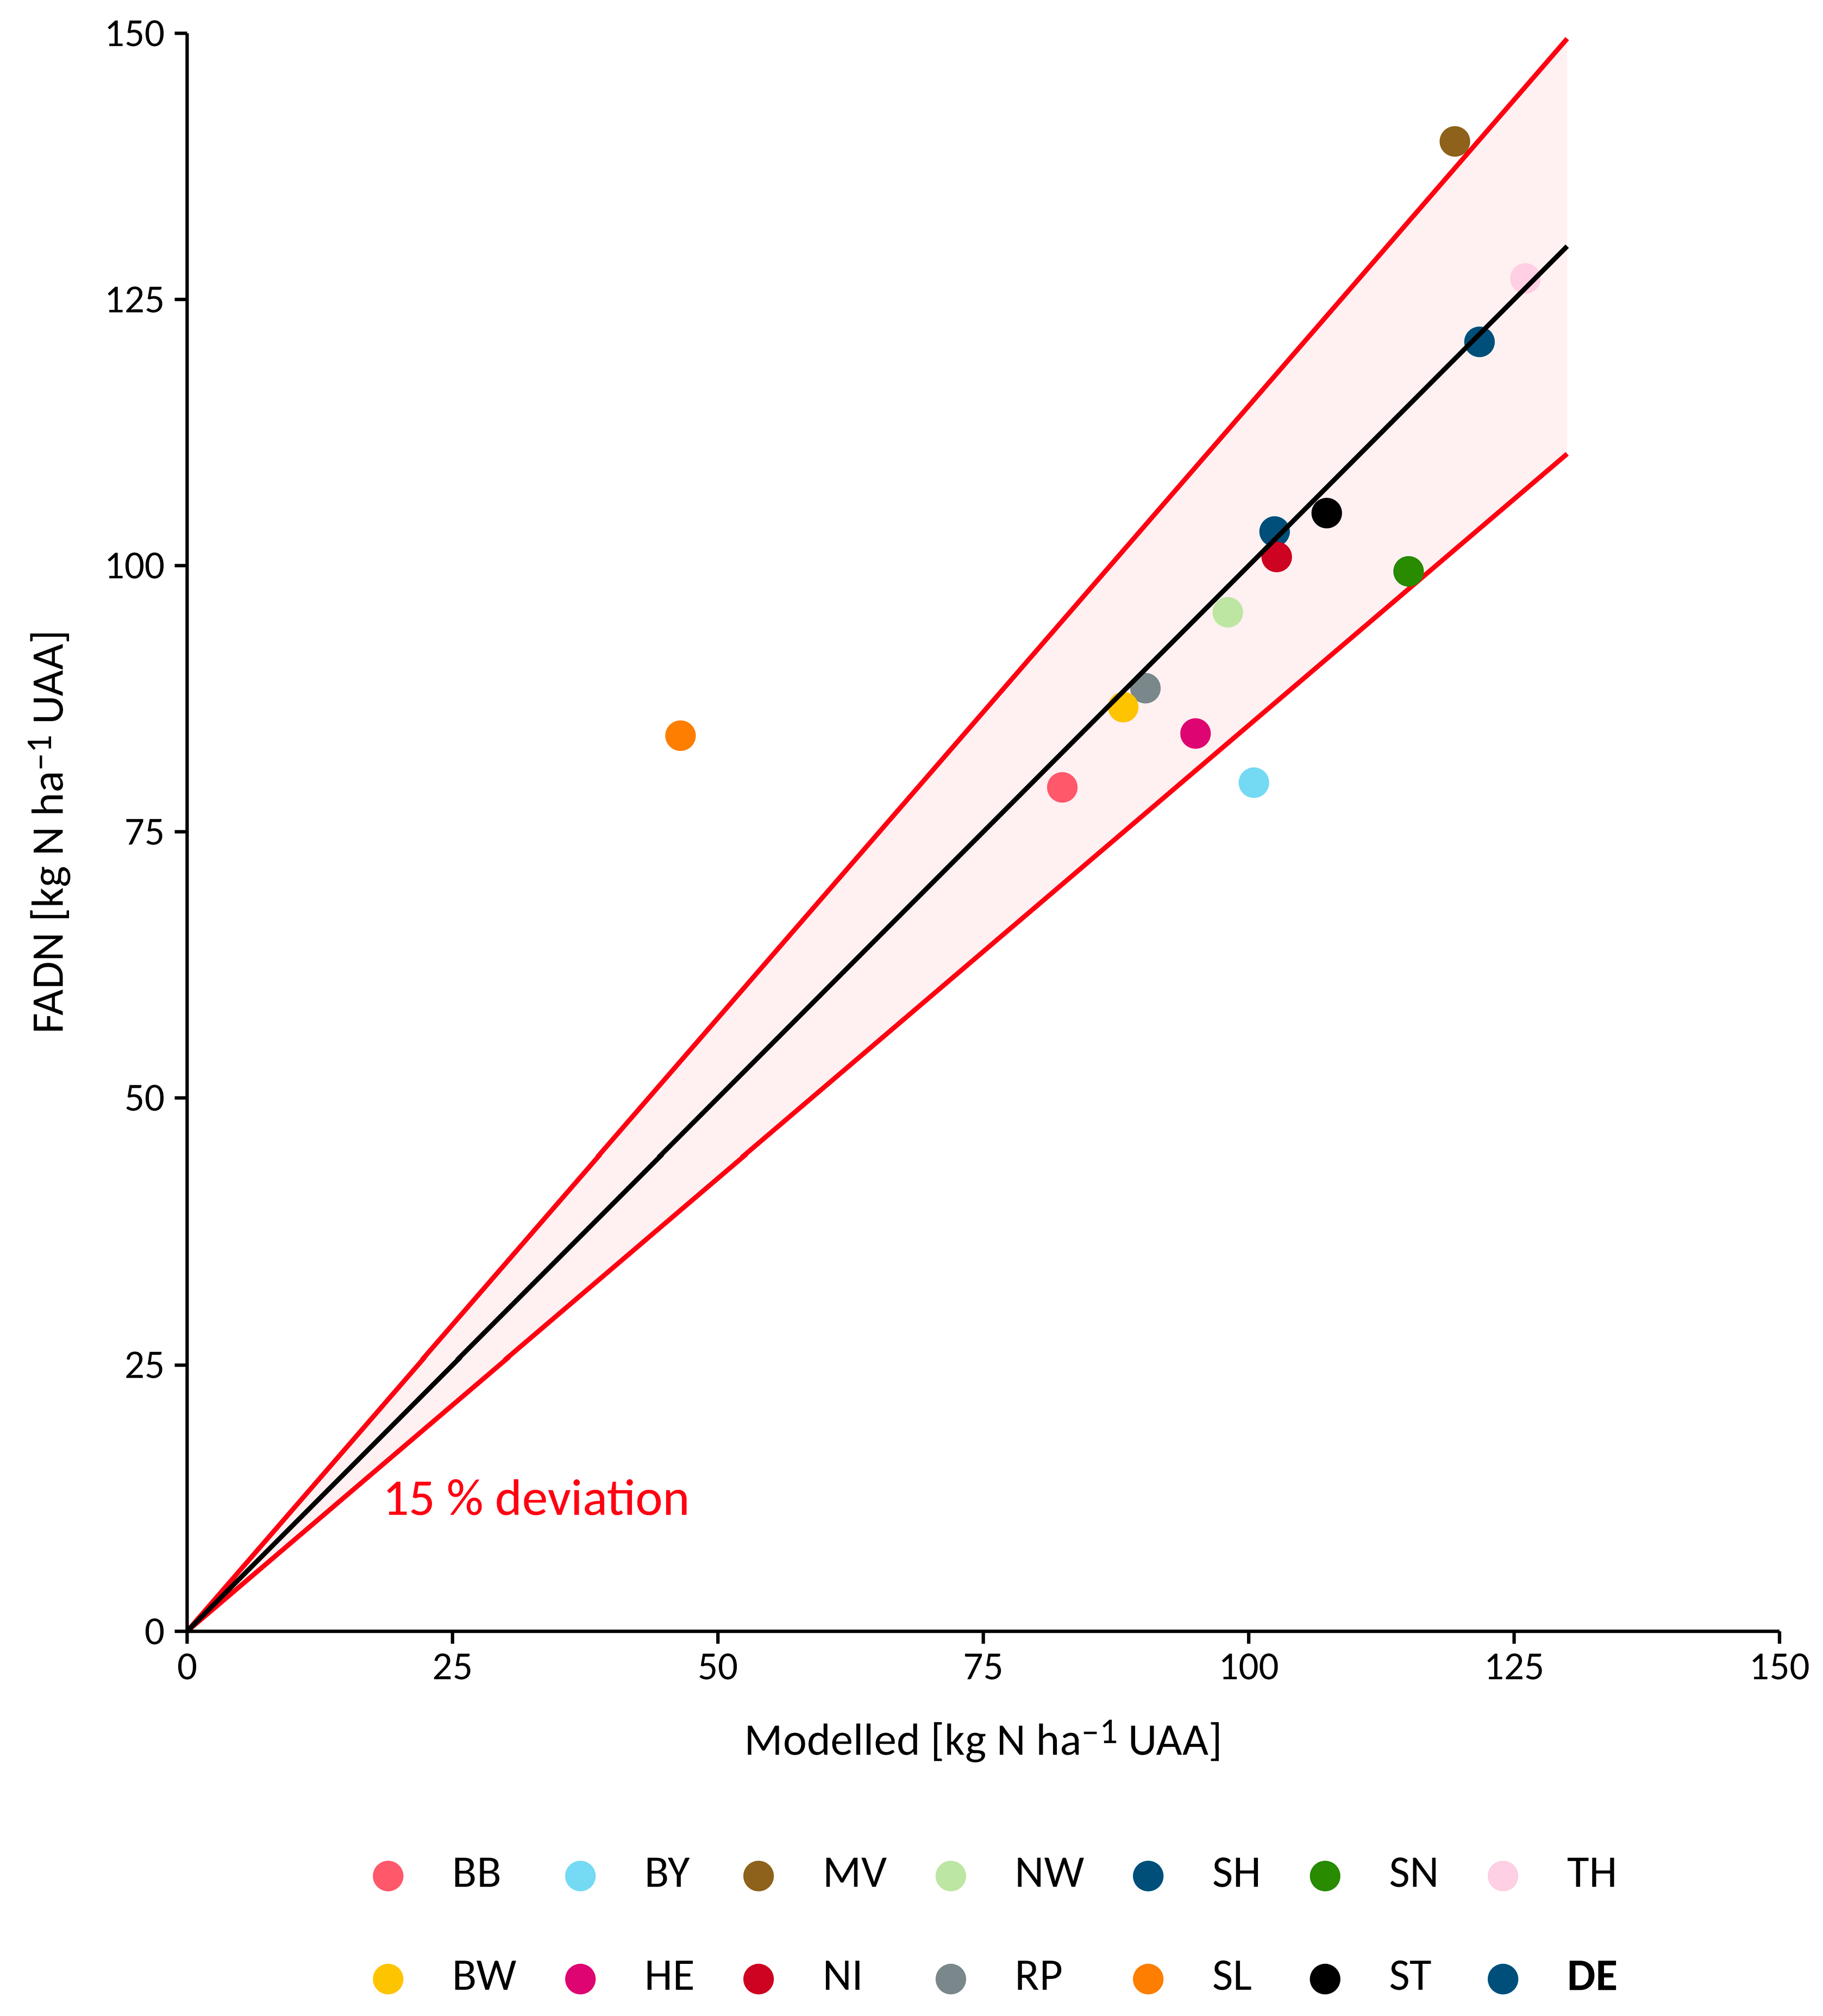
Figure 8 shows the comparison between the modelled and the weighted FADN mineral fertiliser quantities applied. The model generally captures the regional magnitudes of mineral fertiliser application rates. Especially in federal states with intensive agriculture (Schleswig–Holstein, Lower Saxony and North Rhine–Westphalia), the modelled application rates correspond well to the weighted FADN values. The mean absolute deviation is 8.6 kg N ha−1 UAA, and the root mean squared error is 13.8 kg N ha−1 UAA. Compared with the weighted FADN data, the model overestimates the application rates in Bavaria and underestimates the application rates in Mecklenburg–Western Pomerania and Saarland. The comparison does not indicate a systematic bias of weighted mineral fertiliser application rates.

4. Discussion

The results show that the model is capable of reflecting small-scale spatial variations in N emissions in accordance with the agricultural production structure and intensity. The model provides information on all relevant agricultural N inputs and captures removals from agriculturally utilised land, allowing for a full and consistent spatial data layer of N flows to and from the soil surface on agricultural land. Thus, the model may provide necessary input data for a variety of applications where information on agricultural N input and output at the soil surface is needed, especially regarding nutrient flux modelling but also for soil, biodiversity and climate modelling.

4.1. Plausibility of Model Results in the Context of Other Literature

The general pattern that the N surpluses correspond to the organic and total N input levels is not surprising and is in line with other studies’ findings [32,41]. Notably, regions with above-average surpluses show both above-average N inputs as well as N removals (Figure 6), indicating that higher N input levels cannot be compensated for by higher yield levels due to a lower nitrogen use efficiency (NUE, understood as the share of N output to N input at the soil surface). This is in line with Leip et al. [32], who find a negative correlation between the NUE and the N input at the soil surface.
Estimating N soil surface budget surpluses for German farms with FADN data, Löw et al. [74] found almost balanced budgets for arable farms and average surpluses of well below 50 kg N ha−1 UAA for cattle and mixed farms, and highest N surpluses were observed for specialised pig and poultry producers (76 kg N ha−1 UAA). This confirms our findings that intensive livestock production regions are associated with N surpluses about double those in arable regions. However, predicted N surpluses in dairy production regions are high compared to those found by Löw et al. [74], who also related the grassland yields to the animals’ roughage needs but set a minimum yield level of 40 dt dry matter ha−1. A reason for this is that the estimation of N removals from forage crops and grassland as well as N fluxes with fodder purchases are associated with high uncertainty [74]. As our approach balances roughage consumption and supply at the regional level and, thus, implicitly accounts for roughage trade, we assume that our approach is valid.
The model predicts above-average N surpluses for vegetable production regions, which is in line with a high NO3 leaching risk in horticulture [77,78,79]. Henning et al. [80] estimated a total N surplus of 74 kg N ha−1 UAA for the federal state of Schleswig–Holstein, which corresponds well with our findings (77 kg N ha−1 UAA). Häußermann et al. [41] reported an average national soil surface budget surplus for Germany of 64 kg N ha−1 UAA (corrected for N deposition) for the period 2014–2016, which is about 10% higher than our result, likely due to different data sources and, accordingly, different parametrisation. Nevertheless, our study’s spatial patterns and the magnitude of the individual budget components are in accordance with the findings of Häußermann et al. [41].
According to Figure 8, the model correctly reflects the magnitude of mineral N inputs. Discrepancies in some federal states can be due to effects of agri-environmental schemes (AESs) and organic farming, which are not explicitly considered in the model. Participation in AES may improve N utilisation rates and reduce both the mineral fertiliser use and N surpluses [81,82]. Methodological bias might also result from low participation numbers in the FADN, particularly in Saarland and Mecklenburg–Western Pomerania. Also, horticulture and specialty crop farms are underrepresented in the FADN sample [74], which might bias the comparison values. A regional study for Mecklenburg–Western Pomerania reported average mineral N inputs for 2014–2016 of 143.5 kg N ha−1 UAA [21], which is about 20% higher than the model results. In contrast to our model, the authors [21] estimated mineral N inputs by means of a farm-sample-based regression approach, which may—in light of Figure 8—constitute a more suitable approach to modelling mineral N inputs in intensive cereal- and rapeseed-dominated crop rotations.

4.2. Opportunities and Challenges When Using Farm-Level Administration Data

The utilised dataset with farm-level administration data has great potential for high-resolution spatial agri-environmental assessments. The IACS database allows for the unique identification of field plots and, thus, for an ideal spatial representation of agricultural land use on an annual basis. This substantially reduces the necessity of making assumptions about the spatial distribution of land use activities that similar studies [44] have had to make. Thus, uncertainty regarding regional activity data, which has been found to be a cause for biased N surpluses in other studies [43], can be reduced.
However, landless livestock production and sequential multi-cropping in horticulture is not reflected in IACS data and must be accounted for, e.g., by gap-filling methods or by additional data sources. While the opportunity to link different data sources with IACS data via an agricultural operation number is an advantage, it is not always unambiguous (e.g., linking manure transport with biogas production data) and may lead to outliers (Table 2) that must not be confused with actual emission hotspots. Finally, it should be noted that farm-level datasets are far from harmonised across the German federal states and that data protection regulations must be respected. These circumstances make data acquisition and preparation quite complex [83]—an issue that should be considered when preparing future modelling studies. Also, other datasets such as yield data and mineral fertiliser use are available at a lower spatial resolution only, posing a relevant source of uncertainty.

4.3. Applications in Nutrient Flux Models and Further Research

The aim of this study was to develop a nationwide model to depict agricultural N budgets with high spatial resolution based on farm-level administration data. By extensive collaboration with experts from federal state authorities, regional knowledge about agri-environmental conditions was taken into account and the data acquisition process was facilitated. Our approach can bring several advantages to N flux modelling but can also enhance environmental monitoring:
As IACS data cover almost the entire use of agricultural land, only a minimum of additional assumptions about the spatial distribution of land use activities are required. This subsequently improves the overall accuracy of modelled N surpluses. As the IACS contains geo-referenced parcels, it allows N surpluses to be assigned to actual farm plots. This feature simplifies the coupling with subsequent raster-based soil and hydrological models [9,51,78].
N surpluses in the presented model depend entirely on agricultural activity data, which makes it easy for it to be coupled with economic models. This facilitates the possibility of using the model for projections [77] and scenario analyses with the purpose of assessing the impact of existing or future water protection policies, enhancing WFD management plans and NiD action programmes.
If reliable and validated time series of high-resolution agricultural N budget surpluses can be developed, time lags originating from the residence times of leachates and groundwater [79] or possible N legacies [80] can be accounted for in policy impact assessments. Moreover, this forms the basis for regional emission monitoring that complements existing monitoring systems based on water quality measurement networks.
Finally, our model provides both information about the general level of agricultural N pressures and allows, if the data quality is sufficient, for the identification of “hotspots” and unpolluted regions. This feature makes the model a suitable tool to contribute to an “integrated nitrogen strategy” [81].
Future research should focus on improving the database and the data quality to reduce the necessity of making assumptions about agricultural fertilisation practices, especially regarding mineral fertiliser applications and manure transportation. Furthermore, coupling specialised models such the GAS-EM model [82] to obtain better estimates about ammonia emissions or by including novel remote sensing data on grassland use intensity [83] may improve the overall model accuracy. According to expert knowledge, the consideration of AES and organic farming should be prioritised to account for low-input farming practices. An update of the Germany-wide model is currently under development in the RELAS (https://www.thuenen.de/en/cross-institutional-projects/mapping-regional-agricultural-nitrogen-fluxes-for-water-and-climate-protection-policy, accessed on 23 August 2024) project.

5. Conclusions

Water protection legislation in the EU requires member states to implement mitigation policies and monitoring to prevent and reduce agricultural N inputs. N flux models driven by high-resolution agricultural N surpluses can complement existing monitoring systems based on water quality measurements and help with the assessment of water protection policies. With long-term spatial time series on agricultural N surpluses, monitoring systems such as Germany’s new Fertiliser Application Ordinance impact monitoring can link short-term changes in agricultural fertilisation practices with long-term changes in water quality, especially in high-risk areas. This requires high-resolution information on changes to agricultural land use and fertilisation practices. We developed and tested a high-resolution N budget model that reflects small-scale variations in the N pollution intensity. We applied the model to agricultural areas of Germany based on area-wide farm-level administration data. Due to the large spatial extent and heterogeneity of German agricultural production, local expert knowledge of model coefficients and parameters were incorporated where applicable. In contrast to pure water quality monitoring, our additional modelling approach allows for the monitoring of agricultural N emissions and for short-term policy action should pollution levels on agricultural land rise further.
A detailed database with annual updates is crucial for this purpose. As IACS data should be available in all EU member states, our approach constitutes an example that can be adopted in other EU member states to improve existing monitoring programs or national mitigation policies. Especially for countries that have recently completed their EU accession or will do so soon, our approach can help policy-makers design, target and monitor the NiD action programme and WFD management plans. Likewise, current member states can improve existing monitoring programs or national mitigation policies—not least because of the EU Farm-to-Fork-Strategy, which aims for a substantial reduction of nutrient losses and fertiliser inputs [84].

Supplementary Materials

The following supporting information can be downloaded at: https://www.mdpi.com/article/10.3390/w16172376/s1, Table S1: Coefficients for N excretion and N uptake with roughage; Table S2: Coefficients for selected plant production activities.

Author Contributions

Conceptualisation, M.Z. and M.E.; methodology, M.Z.; software, M.Z. and M.E.; validation, M.Z. and P.L.; formal analysis, M.Z.; investigation, M.Z., M.E., P.L. and M.H.; data curation, M.Z. and M.E.; writing—original draft preparation, M.Z.; writing—review and editing, M.E., E.B., M.H. and P.L.; visualisation, M.Z. and M.E. All authors have read and agreed to the published version of the manuscript.

Funding

This study is based on the results of the AGRUM-DE project, which was jointly funded by the Bund/Länder-Arbeitsgemeinschaft Wasser (LAWA, Länderfinanzierungsprogramm “Wasser, Boden und Abfall” (Project number: O 4.18)) and the Thünen Institute.

Data Availability Statement

Sensitive farm-level data have been used in the model; thus, these data cannot be published due to data protection regulations. Model results will be provided through the Thünen Repository as soon as legal data protection issues are resolved.

Acknowledgments

This study is based on the AGRUM-DE project. It was jointly funded by the Bund/Länder-Arbeitsgemeinschaft Wasser (LAWA) and the Thünen-Institute. The authors thank the 51 members of the AGRUM-DE project advisory board, who have contributed to the AGRUM-DE project through the provision of data, feedback and critical evaluation of the work in progress. We also thank Peter Kreins, who initiated and co-led the AGRUM-DE project. We also thank Frank Wendland for his advice.

Conflicts of Interest

The authors declare no conflicts of interest. The funders had no role in the design of the study; in the collection, analyses, or interpretation of data; in the writing of the manuscript; or in the decision to publish the results.

References

  1. Rockström, J.; Steffen, W.; Noone, K.; Persson, Å.; Chapin, F.S.; Lambin, E.; Lenton, T.M.; Scheffer, M.; Folke, C.; Schellnhuber, H.J.; et al. Planetary Boundaries: Exploring the Safe Operating Space for Humanity. Ecol. Soc. 2009, 14, 32. [Google Scholar] [CrossRef]
  2. Sutton, M.A.; Howard, C.M.; Erisman, J.W.; Billen, G.; Bleeker, A.; Grennfelt, P.; van Grinsven, H.; Grizzetti, B. The European Nitrogen Assessment: Sources, Effects and Policy Perspectives; Cambridge University Press: Cambridge, UK, 2011; ISBN 9781139080972. [Google Scholar]
  3. Steffen, W.; Richardson, K.; Rockström, J.; Cornell, S.E.; Fetzer, I.; Bennett, E.M.; Biggs, R.; Carpenter, S.R.; de Vries, W.; de Wit, C.A.; et al. Sustainability. Planetary boundaries: Guiding human development on a changing planet. Science 2015, 347, 1259855. [Google Scholar] [CrossRef]
  4. Schulte-Uebbing, L.F.; Beusen, A.H.W.; Bouwman, A.F.; de Vries, W. From planetary to regional boundaries for agricultural nitrogen pollution. Nature 2022, 610, 507–512. [Google Scholar] [CrossRef]
  5. Jones, L.; Provins, A.; Holland, M.; Mills, G.; Hayes, F.; Emmett, B.; Hall, J.; Sheppard, L.; Smith, R.; Sutton, M.; et al. A review and application of the evidence for nitrogen impacts on ecosystem services. Ecosyst. Serv. 2014, 7, 76–88. [Google Scholar] [CrossRef]
  6. van Grinsven, H.J.M.; Holland, M.; Jacobsen, B.H.; Klimont, Z.; Sutton, M.A.; Jaap Willems, W. Costs and benefits of nitrogen for Europe and implications for mitigation. Environ. Sci. Technol. 2013, 47, 3571–3579. [Google Scholar] [CrossRef] [PubMed]
  7. de Vries, W.; Schulte-Uebbing, L.; Kros, H.; Voogd, J.C.; Louwagie, G. Spatially explicit boundaries for agricultural nitrogen inputs in the European Union to meet air and water quality targets. Sci. Total Environ. 2021, 786, 147283. [Google Scholar] [CrossRef]
  8. McCrackin, M.L.; Harrison, J.A.; Compton, J.E. Future riverine nitrogen export to coastal regions in the United States: Prospects for improving water quality. J. Environ. Qual. 2015, 44, 345–355. [Google Scholar] [CrossRef]
  9. Tetzlaff, B.; Kunkel, R.; Eysholdt, M.; Nguyen, H.H.; Venohr, M.; Wolters, T.; Zinnbauer, M.; Wendland, F. Modelling Current-State N- and P-Fluxes into Surface Waters in Germany. Water 2024, 16, 1872. [Google Scholar] [CrossRef]
  10. Liu, X.; Beusen, A.H.W.; van Grinsven, H.J.M.; Wang, J.; van Hoek, W.J.; Ran, X.; Mogollón, J.M.; Bouwman, A.F. Impact of groundwater nitrogen legacy on water quality. Nat. Sustain. 2024, 7, 891–900. [Google Scholar] [CrossRef]
  11. Yang, C.; Wang, L.; Chen, S.; Li, Y.; Huang, S.; Zeng, Q.; Chen, Y. Nitrate transport velocity data in the global unsaturated zones. Sci. Data 2022, 9, 613. [Google Scholar] [CrossRef]
  12. Basu, N.B.; van Meter, K.J.; Byrnes, D.K.; van Cappellen, P.; Brouwer, R.; Jacobsen, B.H.; Jarsjö, J.; Rudolph, D.L.; Cunha, M.C.; Nelson, N.; et al. Managing nitrogen legacies to accelerate water quality improvement. Nat. Geosci. 2022, 15, 97–105. [Google Scholar] [CrossRef]
  13. Directive 2008/56/EC of the European Parliament and of the Council of 17 June 2008 Establishing a Framework for Community Action in the Field of Marine Environmental Policy (Marine Strategy Framework Directive): MSFD. 2008. Available online: https://eur-lex.europa.eu/eli/dir/2008/56/oj (accessed on 15 July 2024).
  14. Directive 2000/60/EC of the European Parliament and of the Council of 23 October 2000 Establishing a Framework for Community Action in the Field of Water Policy: WFD. 2000. Available online: https://eur-lex.europa.eu/eli/dir/2000/60/oj (accessed on 1 January 2020).
  15. Council Directive 91/676/EEC of 12 December 1991 Concerning the Protection of Waters against Pollution Caused by Nitrates from Agricultural Sources: Nitrates Directive. 1991. Available online: https://eur-lex.europa.eu/legal-content/EN/TXT/?uri=CELEX%3A31991L0676 (accessed on 15 July 2024).
  16. European Commission. Report from the Commission to the Council and the Parliament on the Implementation of Council Directive 91/676/EEC Concerning the Protection of Waters against Pollution Caused by Nitrates from Agricultural Sources Based on Member State Reports for the Period 2016–2019. 2021. Available online: https://eur-lex.europa.eu/legal-content/EN/TXT/?uri=COM:2021:1000:FIN (accessed on 18 July 2024).
  17. Strenge, E.; Zoboli, O.; Mehdi-Schulz, B.; Parajka, J.; Schönhart, M.; Krampe, J.; Zessner, M. Regional nitrogen budgets of agricultural production systems in Austria constrained by natural boundary conditions. J. Environ. Manag. 2023, 347, 119023. [Google Scholar] [CrossRef]
  18. Rosenstock, T.S.; Liptzin, D.; Dzurella, K.; Fryjoff-Hung, A.; Hollander, A.; Jensen, V.; King, A.; Kourakos, G.; McNally, A.; Pettygrove, G.S.; et al. Agriculture’s Contribution to Nitrate Contamination of Californian Groundwater (1945–2005). J. Environ. Qual. 2014, 43, 895–907. [Google Scholar] [CrossRef] [PubMed]
  19. Seitzinger, S.P.; Mayorga, E.; Bouwman, A.F.; Kroeze, C.; Beusen, A.H.W.; Billen, G.; van Drecht, G.; Dumont, E.; Fekete, B.M.; Garnier, J.; et al. Global river nutrient export: A scenario analysis of past and future trends. Glob. Biogeochem. Cycles 2010, 24. [Google Scholar] [CrossRef]
  20. Malagó, A.; Bouraoui, F.; Vigiak, O.; Grizzetti, B.; Pastori, M. Modelling water and nutrient fluxes in the Danube River Basin with SWAT. Sci. Total Environ. 2017, 603–604, 196–218. [Google Scholar] [CrossRef]
  21. Ackermann, A.; Mahnkopf, J.; Heidecke, C.; Venohr, M. Reducing agricultural nitrogen inputs in the German Baltic Sea catchment—trends and policy options. Water Sci. Technol. 2016, 74, 1060–1068. [Google Scholar] [CrossRef]
  22. Schmidt, B.; Kuhn, U.; Trepel, M.; Kreins, P.; Zinnbauer, M.; Eysholdt, M.; Osterburg, B.; Löw, P.; Wendland, F.; Herrmann, F.; et al. Modellansatz zur Bestimmung der Nährstoffbelastung und ihrer Reduktion in allen deutschen Flussgebieten. Wasser Und Abfall 2020, 22, 33–38. [Google Scholar] [CrossRef]
  23. Umweltbundesamt. Die Wasserrahmenrichtlinie: Gewässer in Deutschland 2021. Fortschritte und Herausforderungen, Dessau-Roßlau. 2022. Available online: https://www.umweltbundesamt.de/sites/default/files/medien/1410/publikationen/221010_uba_fb_wasserrichtlinie_bf.pdf (accessed on 28 April 2023).
  24. Nawotke, C.; Wacker-Fester, K.; Hoppe, A.; Kape, H.-E.; Hiller, J.; Pöplau, R. Regionalisierte Flächenbilanzen für Stickstoff auf landwirtschaftlichen Nutzflächen in Mecklenburg-Vorpommern: Im Auftrag des Ministeriums für Landwirtschaft und Umwelt Mecklenburg-Vorpommern, Rostock. 2020. Available online: https://www.wrrl-mv.de/static/WRRL/Dateien/Dokumente/Service/Dokumente/2020_Bericht_Regionalisierung_landwirtschaftliche_Stickstoffbilanzen_MV_2012-2017_end.pdf (accessed on 19 July 2024).
  25. Jacobsen, B.H.; Hansen, A.L. Economic gains from targeted measures related to non-point pollution in agriculture based on detailed nitrate reduction maps. Sci. Total Environ. 2016, 556, 264–275. [Google Scholar] [CrossRef] [PubMed]
  26. McCrackin, M.L.; Gustafsson, B.G.; Hong, B.; Howarth, R.W.; Humborg, C.; Savchuk, O.P.; Svanbäck, A.; Swaney, D.P. Opportunities to reduce nutrient inputs to the Baltic Sea by improving manure use efficiency in agriculture. Reg. Environ. Chang. 2018, 18, 1843–1854. [Google Scholar] [CrossRef]
  27. Svanbäck, A.; McCrackin, M.L.; Swaney, D.P.; Linefur, H.; Gustafsson, B.G.; Howarth, R.W.; Humborg, C. Reducing agricultural nutrient surpluses in a large catchment—Links to livestock density. Sci. Total Environ. 2019, 648, 1549–1559. [Google Scholar] [CrossRef] [PubMed]
  28. Hirt, U.; Kreins, P.; Kuhn, U.; Mahnkopf, J.; Venohr, M.; Wendland, F. Management options to reduce future nitrogen emissions into rivers: A case study of the Weser river basin, Germany. Agric. Water Manag. 2012, 115, 118–131. [Google Scholar] [CrossRef]
  29. Piniewski, M.; Tattari, S.; Koskiaho, J.; Olsson, O.; Djodjic, F.; Giełczewski, M.; Marcinkowski, P.; Księżniak, M.; Okruszko, T. How effective are River Basin Management Plans in reaching the nutrient load reduction targets? Ambio 2021, 50, 706–722. [Google Scholar] [CrossRef]
  30. Wendland, F.; Bogena, H.; Goemann, H.; Hake, J.F.; Kreins, P.; Kunkel, R. Impact of nitrogen reduction measures on the nitrogen loads of the river Ems and Rhine (Germany). Phys. Chem. Earth Parts A/B/C 2005, 30, 527–541. [Google Scholar] [CrossRef]
  31. de Wit, M.; Bendoricchio, G. Nutrient fluxes in the Po basin. Sci. Total Environ. 2001, 273, 147–161. [Google Scholar] [CrossRef]
  32. Howarth, R.; Swaney, D.; Billen, G.; Garnier, J.; Hong, B.; Humborg, C.; Johnes, P.; Mörth, C.-M.; Marino, R. Nitrogen fluxes from the landscape are controlled by net anthropogenic nitrogen inputs and by climate. Front. Ecol. Environ. 2012, 10, 37–43. [Google Scholar] [CrossRef]
  33. Blicher-Mathiesen, G.; Andersen, H.E.; Larsen, S.E. Nitrogen field balances and suction cup-measured N leaching in Danish catchments. Agric. Ecosyst. Environ. 2014, 196, 69–75. [Google Scholar] [CrossRef]
  34. de Notaris, C.; Rasmussen, J.; Sørensen, P.; Olesen, J.E. Nitrogen leaching: A crop rotation perspective on the effect of N surplus, field management and use of catch crops. Agric. Ecosyst. Environ. 2018, 255, 1–11. [Google Scholar] [CrossRef]
  35. Leip, A.; Britz, W.; Weiss, F.; de Vries, W. Farm, land, and soil nitrogen budgets for agriculture in Europe calculated with CAPRI. Environ. Pollut. 2011, 159, 3243–3253. [Google Scholar] [CrossRef]
  36. EUROSTAT. Nutrient Budgets—Methodology and Handbook: Version 1.02., Luxembourg. 2013. Available online: https://ec.europa.eu/eurostat/documents/2393397/2518760/Nutrient_Budgets_Handbook_%28CPSA_AE_109%29_corrected3.pdf/4a3647de-da73-4d23-b94b-e2b23844dc31 (accessed on 7 January 2022).
  37. Howarth, R.W.; Billen, G.; Swaney, D.; Townsend, A.; Jaworski, N.; Lajtha, K.; Downing, J.A.; Elmgren, R.; Caraco, N.; Jordan, T.; et al. Regional nitrogen budgets and riverine N & P fluxes for the drainages to the North Atlantic Ocean: Natural and human influences. In Nitrogen Cycling in the North Atlantic Ocean and Its Watersheds; Howarth, R.W., Ed.; Springer: Dordrecht, The Netherland, 1996; pp. 75–139. ISBN 978-94-009-1776-7. [Google Scholar]
  38. Oenema, O.; Kros, H.; de Vries, W. Approaches and uncertainties in nutrient budgets: Implications for nutrient management and environmental policies. Eur. J. Agron. 2003, 20, 3–16. [Google Scholar] [CrossRef]
  39. Hong, B.; Swaney, D.P.; McCrackin, M.; Svanbäck, A.; Humborg, C.; Gustafsson, B.; Yershova, A.; Pakhomau, A. Advances in NANI and NAPI accounting for the Baltic drainage basin: Spatial and temporal trends and relationships to watershed TN and TP fluxes. Biogeochemistry 2017, 133, 245–261. [Google Scholar] [CrossRef]
  40. Wolters, T.; Cremer, N.; Eisele, M.; Herrmann, F.; Kreins, P.; Kunkel, R.; Wendland, F. Checking the Plausibility of Modelled Nitrate Concentrations in the Leachate on Federal State Scale in Germany. Water 2021, 13, 226. [Google Scholar] [CrossRef]
  41. Özbek, F.Ş.; Leip, A. Estimating the gross nitrogen budget under soil nitrogen stock changes: A case study for Turkey. Agric. Ecosyst. Environ. 2015, 205, 48–56. [Google Scholar] [CrossRef]
  42. Eriksson, H.; Pastuszak, M.; Löfgren, S.; Mörth, C.-M.; Humborg, C. Nitrogen budgets of the Polish agriculture 1960–2000: Implications for riverine nitrogen loads to the Baltic Sea from transitional countries. Biogeochemistry 2007, 85, 153–168. [Google Scholar] [CrossRef]
  43. Lassaletta, L.; Romero, E.; Billen, G.; Garnier, J.; García-Gómez, H.; Rovira, J.V. Spatialized N budgets in a large agricultural Mediterranean watershed: High loading and low transfer. Biogeosciences 2012, 9, 57–70. [Google Scholar] [CrossRef]
  44. Häußermann, U.; Klement, L.; Breuer, L.; Ullrich, A.; Wechsung, G.; Bach, M. Nitrogen soil surface budgets for districts in Germany 1995 to 2017. Environ. Sci. Eur. 2020, 32, 109. [Google Scholar] [CrossRef]
  45. Wang, X.; Feng, A.; Wang, Q.; Wu, C.; Liu, Z.; Ma, Z.; Wei, X. Spatial variability of the nutrient balance and related NPSP risk analysis for agro-ecosystems in China in 2010. Agric. Ecosyst. Environ. 2014, 193, 42–52. [Google Scholar] [CrossRef]
  46. Kros, J.; Hutchings, N.J.; Kristensen, I.T.; Kristensen, I.S.; Børgesen, C.D.; Voogd, J.C.; Dalgaard, T.; de Vries, W. A comparison of disaggregated nitrogen budgets for Danish agriculture using Europe-wide and national approaches. Sci. Total Environ. 2018, 643, 890–901. [Google Scholar] [CrossRef] [PubMed]
  47. Serra, J.; Cordovil, C.M.; Cruz, S.; Cameira, M.R.; Hutchings, N.J. Challenges and solutions in identifying agricultural pollution hotspots using gross nitrogen balances. Agric. Ecosyst. Environ. 2019, 283, 106568. [Google Scholar] [CrossRef]
  48. Bach, M.; Frede, H.-G. Assessment of agricultural nitrogen balances for municipalities—Example Baden-Wuerttemberg (Germany). Eur. Water Manag. Online 2004. [Google Scholar]
  49. Batool, M.; Sarrazin, F.J.; Attinger, S.; Basu, N.B.; van Meter, K.; Kumar, R. Long-term annual soil nitrogen surplus across Europe (1850–2019). Sci. Data 2022, 9, 612. [Google Scholar] [CrossRef]
  50. Mathivanan, G.P.; Eysholdt, M.; Zinnbauer, M.; Rösemann, C.; Fuß, R. New N2O emission factors for crop residues and fertiliser inputs to agricultural soils in Germany. Agric. Ecosyst. Environ. 2021, 322, 107640. [Google Scholar] [CrossRef]
  51. Eysholdt, M.; Kunkel, R.; Rösemann, C.; Wendland, F.; Wolters, T.; Zinnbauer, M.; Fuß, R. A model-based estimate of nitrate leaching in Germany for GHG reporting. J. Plant Nutr. Soil Sci. 2022, 185, 850–863. [Google Scholar] [CrossRef]
  52. Klein, K.; Ogan, S.; Rottstock, T.; Thönnshof, C. MonViA Indikatorenbericht 2024—Bundesweites Monitoring der biologischen Vielfalt in Agrarlandschaften, Bonn. 2024. Available online: https://research.wur.nl/en/publications/monvia-indikatorenbericht-2024-bundesweites-monitoring-der-biolog (accessed on 23 July 2024).
  53. Sachverständigenrat für Umweltfragen. Stickstoff: Lösungsstrategien für ein Drängendes Umweltproblem; Sondergutachten: Berlin, Germany, 2015. [Google Scholar]
  54. Bundesministerium für Umwelt, Naturschutz, nukleare Sicherheit und Verbraucherschutz; Bundesministerium für Ernährung und Landwirtschaft. Nitratbericht 2024. 2024. Available online: https://www.bmuv.de/fileadmin/Daten_BMU/Download_PDF/Binnengewaesser/nitratbericht_2024_bf.pdf (accessed on 18 July 2024).
  55. European Court of Justice. European Commission against Federal Republic of Germany. Infringement Proceedings—Directive 91/676/EEC. 2018. Available online: https://eur-lex.europa.eu/legal-content/de/TXT/?uri=CELEX:62016CJ0543 (accessed on 5 April 2022).
  56. Henrichsmeyer, W.; Cypris, C.; Löhe, W.; Meudt, M.; Sander, R.; von Sothen, F. Entwicklung eines gesamtdeutschen Agrarsektormodells. In Endbericht zum Kooperationsprojekt "Entwicklung des Gesamtdeutschen Agrarsektormodells RAUMIS96"; Universität Bonn, Bundesforschungsanstalt für Landwirtschaft, Eds.; Braunschweig: Bonn, Germany, 1996. [Google Scholar]
  57. Kreins, P.; Behrendt, H.; Gömann, H.; Heidecke, C.; Hirt, U.; Kunkel, R.; Seidel, K.; Tetzlaff, B.; Wendland, F. Analyse von Agrar- und Umweltmaßnahmen im Bereich des Landwirtschaftlichen Gewässerschutzes vor dem Hintergrund der EG-Wasserrahmenrichtlinie in der Flussgebietseinheit Weser; Landbauforschung Sonderheft No. 336: Braunschweig, Germany, 2009. [Google Scholar]
  58. Landwirtschaftskammer Nordrhein-Westfalen. Nährstoffbericht NRW 2021, Münster. 2021. Available online: https://www.landwirtschaftskammer.de/landwirtschaft/ackerbau/pdf/naehrstoffbericht-2021.pdf (accessed on 17 November 2021).
  59. Bach, M.; Knoll, L.; Kilian, J.; Breuer, L. Nicht-Agrarbedingte im Vergleich zu den Agrarbedingten Einflussfaktoren auf die Nitratbelastung von Grundwasserkörpern in Hessen; Justus-Liebig-Universität Gießen: Gießen, Germany, 2021. [Google Scholar]
  60. Landwirtschaftskammer Niedersachsen. Nährstoffbericht für Niedersachsen 2019/2020, Oldenburg. 2021. Available online: https://www.duengebehoerde-niedersachsen.de/duengebehoerde/thema/684_Naehrstoffbericht (accessed on 16 January 2022).
  61. Zinnbauer, M.; Eysholdt, M.; Henseler, M.; Kreins, P.; Herrmann, F.; Kunkel, R.; Nguyen, H.; Tetzlaff, B.; Venohr, M.; Wolters, T.; et al. Quantifizierung Aktueller und Zukünftiger Nährstoffeinträge und Handlungsbedarfe für ein Deutschlandweites Nährstoffmanagement—AGRUM-DE; Thünen-Report No. 108: Braunschweig, Germany, 2023; Available online: https://www.thuenen.de/media/publikationen/thuenen-report/Thuenen_Report_108.pdf (accessed on 22 November 2023).
  62. Daniel-Gromke, J.; Rensberg, N.; Denysenko, V.; Trommler, M.; Reinholz, T.; Völler, K.; Beil, M.; Beyrich, W. Anlagenbestand Biogas und Biomethan—Biogaserzeugung und-nutzung in Deutschland; DBFZ Report No. 30: Leipzig, Leipzig, 2017; Available online: https://www.dbfz.de/fileadmin/user_upload/Referenzen/DBFZ_Reports/DBFZ_Report_30.pdf (accessed on 6 January 2020).
  63. Gömann, H.; Julius, C.; Kreins, P. Quantifying Impacts of Different Agri-environmental Policies on the Environment Using the Regional Agri-environmental Information System RAUMIS. In Environmental Communication in the Information Society: Proceedings of the 16th International Conference Informatics for Environmental Protection, September 25–27, 2002, University of Technology, Vienna, Austria; Pillmann, W., Ed.; ISEP International Society for Environmental Protection: Vienna, Austria, 2002; ISBN 3-9500036-7-3. [Google Scholar]
  64. Henseler, M.; Dechow, R. Simulation of regional nitrous oxide emissions from German agricultural mineral soils: A linkage between an agro-economic model and an empirical emission model. Agric. Syst. 2014, 124, 70–82. [Google Scholar] [CrossRef]
  65. Röder, N.; Henseler, M.; Liebersbach, H.; Kreins, P.; Osterburg, B. Evaluation of land use based greenhouse gas abatement measures in Germany. Ecol. Econ. 2015, 117, 193–202. [Google Scholar] [CrossRef]
  66. Röder, N.; Gocht, A. Municipality Disaggregation of Germany’s Agricultural Sector Model RAUMIS: Paper Prepared for the 122nd EAAE Seminar. 2011. Available online: https://literatur.thuenen.de/digbib_extern/dn048083.pdf (accessed on 3 October 2023).
  67. Bayerische Landesanstalt für Landwirtschaft. Basisdaten: Stand: Januar 2019. 2019. Available online: https://www.lfl.bayern.de/mam/cms07/iab/dateien/basisdaten_20190131.pdf (accessed on 6 December 2019).
  68. Kreins, P.; Herrmann, S.; Kunkel, R.; Wendland, F. Integrated Agricultural and Hydrological Modeling within an Intensive Livestock Region. In Ecological Economics of Sustainable Watershed Management; Erickson, J.D., Messner, F., Ring, I., Eds.; Emerald Group Publishing: Amsterdam, The Netherland, 2007; pp. 113–142. ISBN 9780762314485. [Google Scholar]
  69. Elsäßer, M. Düngung von Wiesen und Weiden. Merkblätter Für Die Umweltgerechte Landbewirtschaftung 2005, 13, 1–8. [Google Scholar]
  70. Elsäßer, M. N-Bindung von Leguminosen auf Grünland, Personal communication. 2020.
  71. Krüll, H. Erstellung einer Stickstoffbilanz in den Kreisen der BRD. In Endbericht Zum Forschungsvorhaben Wirkungen Agrarpolitischer Maßnahmen Auf Ziele von Umwelt-, Natur-Und Landschaftsschutz; Rheinische Friedrich-Wilhelms-Universität zu Bonn: Bonn, Germany, 1988; pp. 8–39. [Google Scholar]
  72. Verordnung über die Anwendung von Düngemitteln, Bodenhilfsstoffen, Kultursubstraten und Pflanzenhilfsmitteln nach den Grundsätzen der Guten Fachlichen Praxis Beim Düngen: DüV. 2017. Available online: https://www.gesetze-im-internet.de/d_v_2017/BJNR130510017.html (accessed on 23 August 2024).
  73. Frick, H.; Oberson, A.; Frossard, E.; Bünemann, E.K. Leached nitrate under fertilised loamy soil originates mainly from mineralisation of soil organic N. Agric. Ecosyst. Environ. 2022, 338, 108093. [Google Scholar] [CrossRef]
  74. Statistisches Bundesamt. Produzierendes Gewerbe—Düngemittelversorgung: Fachserie 4 Reihe 8.2. 2021. Available online: https://www.destatis.de/DE/Themen/Branchen-Unternehmen/Industrie-Verarbeitendes-Gewerbe/Publikationen/Downloads-Fachstatistiken/duengemittelversorgung-jahr-2040820217004.html (accessed on 6 December 2021).
  75. Löw, P.; Osterburg, B.; Klages, S. Comparison of regulatory approaches for determining application limits for nitrogen fertilizer use in Germany. Environ. Res. Lett. 2021, 16, 55009. [Google Scholar] [CrossRef]
  76. Hansen, H.; Bahta, S.; Offermann, F. Statistical Usefulness of the EU FADN Database for Production Cost Estimations; FACEPA Deliverable D1.3: Braunschweig, Germany, 2009. [Google Scholar]
  77. Haß, M.; Banse, M.; Deblitz, C.; Freund, F.; Geibel, I.; Gocht, A.; Kreins, P.; Laquai, V.; Offermann, F.; Osterburg, B.; et al. Thünen-Baseline 2020–2030 Agrarökonomische Projektionen für Deutschland; Thünen Report No. 82: Braunschweig, Germany, 2020. [Google Scholar]
  78. Wolters, T.; McNamara, I.; Tetzlaff, B.; Wendland, F. Germany-Wide High-Resolution Water Balance Modelling to Characterise Runoff Components as Input Pathways for the Analysis of Nutrient Fluxes. Water 2023, 15, 3468. [Google Scholar] [CrossRef]
  79. Herrmann, F.; Berthold, G.; Fritsche, J.-G.; Kunkel, R.; Voigt, H.-J.; Wendland, F. Development of a conceptual hydrogeological model for the evaluation of residence times of water in soil and groundwater: The state of Hesse case study, Germany. Environ. Earth Sci 2012, 67, 2239–2250. [Google Scholar] [CrossRef]
  80. van Meter, K.J.; Basu, N.B. Time lags in watershed-scale nutrient transport: An exploration of dominant controls. Environ. Res. Lett. 2017, 12, 84017. [Google Scholar] [CrossRef]
  81. Salomon, M.; Schmid, E.; Volkens, A.; Hey, C.; Holm-Müller, K.; Foth, H. Towards an integrated nitrogen strategy for Germany. Environ. Sci. Policy 2016, 55, 158–166. [Google Scholar] [CrossRef]
  82. Dämmgen, U.; Lüttich, M.; Döhler, H.; Eurich-Menden, B.; Osterburg, B. GAS-EM—A Procedure to Calculate Gaseous Emissions from Agriculture. Landbauforsch. Völkenrode 2002, 52, 19–42. [Google Scholar]
  83. Schwieder, M.; Wesemeyer, M.; Frantz, D.; Pfoch, K.; Erasmi, S.; Pickert, J.; Nendel, C.; Hostert, P. Mapping grassland mowing events across Germany based on combined Sentinel-2 and Landsat 8 time series. Remote Sens. Environ. 2022, 269, 112795. [Google Scholar] [CrossRef]
  84. European Commission. A Farm to Fork Strategy for a Fair, Healthy and Environmentally-Friendly Food System. 2020. Available online: https://eur-lex.europa.eu/resource.html?uri=cellar:ea0f9f73-9ab2-11ea-9d2d-01aa75ed71a1.0001.02/DOC_1&format=PDF (accessed on 4 August 2024).
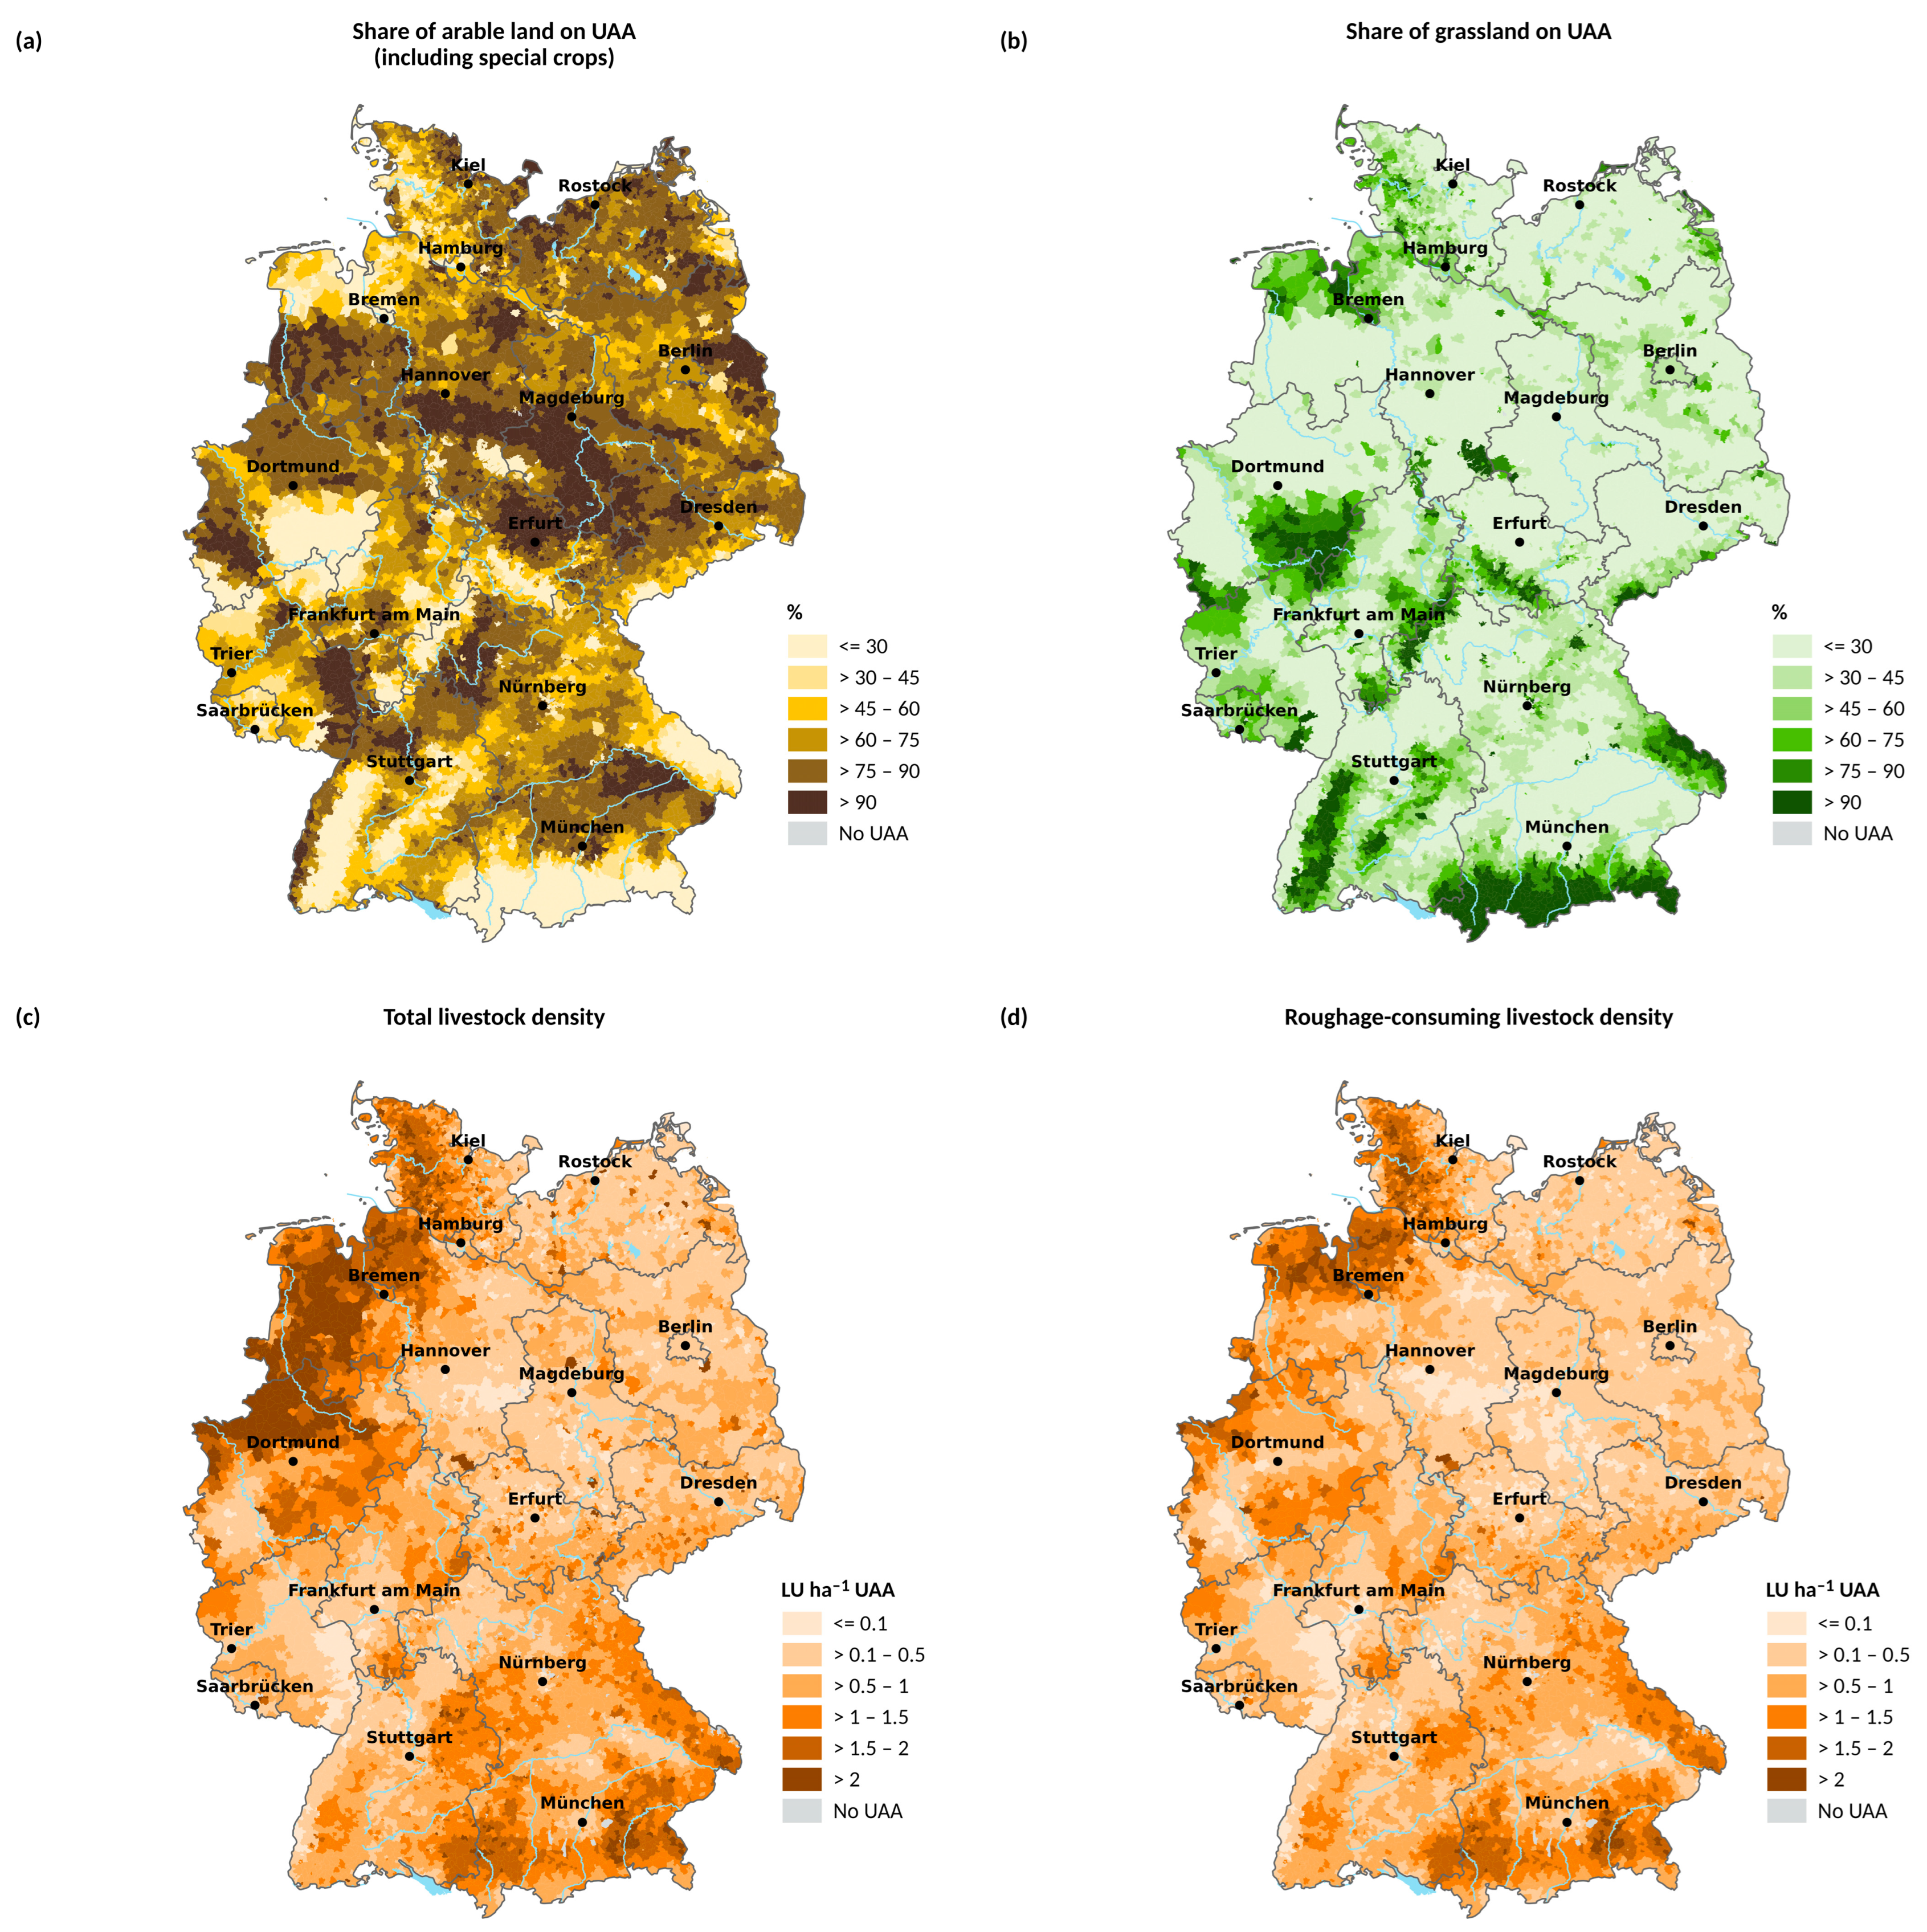
Figure 1. Selected agricultural structure determinants in Germany: (a) share of arable land and (b) share of grassland on total UAA, (c) livestock density, (d) roughage-consuming livestock density. Roughage-consuming livestock include cattle, horses and small ruminants.
Water 16 02376 g001
Figure 2. Mineral N sales in Germany. Data from [74].
Water 16 02376 g002
Figure 3. N input from animal manure (a) and digestate (b), as well as net N fluxes with manure and digestate transportation (c). Manure and digestate transportation is already included in (a,b).
Water 16 02376 g003
Figure 4. N input from biological N fixation (a), sewage sludge (b) and compost (c) application and from seed and planting material (d).
Water 16 02376 g004
Figure 5. N requirement (a) and N from mineral fertiliser application (b).
Water 16 02376 g005
Figure 6. Total N input (a) and N removal with harvest products (b).
Water 16 02376 g006
Figure 7. N soil surface budget surpluses at the municipality level for Germany.
Water 16 02376 g007
Figure 8. Modelled mineral N inputs compared with weighted mineral fertiliser quantities applied from the Farm Accountancy Data Network (2016/2017) at the federal state level.
Water 16 02376 g008
Table 1. Overview of the model database.
Input DataData SourcesSpatial ResolutionCoverageYears
Land useAll cropsIACS Farm level with single field geocoordinatesNational2014–2016
Vegetables, vinicultureThünen-AgraratlasMunicipality levelNational2016
Animal husbandryCattleIACS, ISAFarm levelNational (IACS) and partial (ISA)2014–2016
Pigs, poultryThünen-AgraratlasMunicipality levelNational2016
Small ruminants, other animalsIACSFarm levelNational2014–2016
Biogas productionPlant type, capacity, energy productionNetwork operator data, plant registerSingle-plant data, including geocoordinatesNational2014–2016
Substrate inputDaniel-Gromke et al. [62], federal state reportsVaryingNationalVarying
Manure transportation Manure transportation databasesMunicipality levelPartial 2014–2016
Other manure transportation recordsNUTS-3 level and lowerPartial2014–2016
Yields Federal statistical office (www.destatis.de, accessed on 15 July 2024)NUTS-3National2014–2016
Sewage sludgeSingle-field dataFederal state sewage sludge application registersField levelPartial2014–2016
Aggregated dataFederal state reportsVaryingNationalVarying
Compost Federal state statistical officesNUTS-1NationalVarying
Table 2. Distribution of municipality-level N budget results and the total N budget for the period 2014–2016.
Distribution of Municipality ResultsTotal N Budget
Minq05MeanMedianq95MaxSDTotalMean (Area Weighted)
kg N ha−1 UAAkt Nkg N ha−1 UAA
Input total12.8100.9195.3190.3301.41392.962.73334.6201.8
Mineral fertiliser0.232.9101.1101.1165.3432.641.41693.1102.4
Manure0.00.048.837.5139.3567.746.8854.251.7
Digestate0.00.029.10.3142.81341.448.5531.632.2
Compost0.00.11.91.64.38.21.434.32.1
Sewage sludge0.00.01.10.34.7115.72.620.81.3
N fixation0.01.911.810.525.9117.08.1176.110.7
Seed0.00.01.41.42.44.30.724.51.5
Removal2.675.7140.3138.5214.7455.142.02371.1143.5
Surplus0.820.955.050.498.81066.028.5963.558.3
Note(s): Remarks: q05, q95: 5% and 95% quantiles. SD: standard deviation. Here, mean refers to the mean value of all municipalities while mean (area-weighted) refers to the national average.
Disclaimer/Publisher’s Note: The statements, opinions and data contained in all publications are solely those of the individual author(s) and contributor(s) and not of MDPI and/or the editor(s). MDPI and/or the editor(s) disclaim responsibility for any injury to people or property resulting from any ideas, methods, instructions or products referred to in the content.