Article

Remote Sensing-Based Analysis of Precipitation Events: Spatiotemporal Characterization across China

1
School of Geography and Tourism, Huizhou University, Huizhou 516007, China
2
School of Ecology, Environment and Resources, Guangdong University of Technology, Guangzhou 510006, China
3
School of Art and Design, Guangdong University of Technology, Guangzhou 510006, China
*
Author to whom correspondence should be addressed.
Water 2024, 16(16), 2345; https://doi.org/10.3390/w16162345
Submission received: 5 July 2024 / Revised: 1 August 2024 / Accepted: 19 August 2024 / Published: 21 August 2024
(This article belongs to the Special Issue Analysis of Extreme Precipitation Under Climate Change)

Abstract

:
Precipitation occurs in individual events, but the event characteristics of precipitation are often neglected. This work seeks to identify the precipitation events on both spatial and temporal scales, explore the event characteristics of precipitation, and reveal the relationships between the different characteristics of precipitation events. To do this, we combined the Forward-in-Time (FiT) algorithm with the gridded hourly precipitation product to detect precipitation events in time and space over China. The identified precipitation events were analyzed to determine their characteristics. The results indicate that precipitation events can be detected and identified in time and space scales based on the FiT algorithm and the gridded hourly precipitation product. The precipitation total, duration, and intensity of these events decrease gradually from the southern (eastern) coastal regions to northern (western) inland areas of China. The event precipitation totals are strongly correlated with event duration and event maximum intensity; the totals are more strongly correlated with event maximum intensity and event intensity in the regions with lower precipitation than the regions with higher precipitation. More than 90% of precipitation events are shorter than 6 h, and events with long duration normally occur in temperate monsoon (TM) and subtropical/tropical monsoon (ST) climate zones. Heavy precipitation events with a duration longer than 7 h generally occur more than seven times per year in TM and ST climate zones. Our results suggest that precipitation analyses should sufficiently consider the characteristics of events across different regions.

1. Introduction

Precipitation events directly reflect the dynamics of the climate system [1,2]. The event characteristics (e.g., precipitation total, duration, intensity, and frequency) are crucial for hydrological practices, precipitation-induced hazard mitigation, and meteorological applications [3,4]. Accurately capturing the spatiotemporal characteristics of precipitation events is highly significant. It not only reveals the intrinsic mechanisms that impact precipitation events, but also allows for a comprehensive understanding of the formation mechanisms behind disasters like flooding [5,6]. These characteristics are significantly influenced by various factors, including climate change, human activities, and topography. Against the backdrop of rapid climate change and urbanization, detecting and identifying precipitation events can help understand the impacts of the factors in the spatiotemporal characteristics of the events [7,8]. However, there has been little extensive research into the characteristics of precipitation events on both spatial and temporal scales [9].
Precipitation exhibits distinct spatial and temporal patterns across various climatic regions, and the characteristics of precipitation events can be very complex on regional scales [10,11]. Three decades ago, Trenberth et al. [12] emphasized the need for paying greater attention to the characteristics of precipitation events, such as duration, intensity, and affected areas. Christidis and Stott [13] found that human influence has led to the Mediterranean basin becoming drier, while the rest of Europe has become wetter. Armon et al. [14] simulated the heavy precipitation events in the eastern Mediterranean, and found that the rainfall accumulation, duration, and area showed a decreasing trend; however, the maximum 10 min rain rates and mean conditional rain intensity have shown an increasing trend. Sun et al. [15] indicated that climate change may increase or decrease the frequency, intensity, and duration of precipitation in different climatic regions. These differences in precipitation characteristics are not only related to natural climatic conditions (e.g., differences in latitude, distribution of land and sea, topography, and atmospheric circulation), but are also closely linked to human activities (e.g., urbanization, industrialization, deforestation, and changes in land use) [16,17]. Human activities and climate change significantly impact precipitation, which exhibits nonstationary characteristics [18]. Under the combined influence of climate change and human activities, changes in precipitation characteristics have garnered widespread attention [19,20,21].
The changing characteristics of precipitation events have a great impact on hydrological practices. For instance, Xiao et al. [22] found that flash floods showed an increasing trend despite the mean precipitation decreases in southwestern China. However, some previous studies were focused on mean precipitation on daily or longer time scales [23,24,25], and event detection was limited spatially and temporally [26]. Zhu et al. [27] noted that the “event characteristics” of precipitation were often neglected or replaced by highly idealized assumptions in hydrologic practices. Although the impacts of these characteristics on hydrological practices are great, the potential consequences of such neglect and these assumptions have received little attention.
Previous studies have focused on examining various facets of precipitation events, including the detection of these events, as well as a detailed study of their temporal and spatial characteristics [28,29,30]. Chen et al. [31] detected urban rainfall events and analyzed the spatial–temporal distribution characteristics of the events using multiple meteorological stations. Huang et al. [28] developed a rainstorm identification tool to identify rainstorms at each grid based on the TRMM precipitation product and analyzed the space–time variabilities in rainstorms. Some studies were extended to analyze precipitation associated with large-scale atmospheric circulations [32,33,34]. These studies generally focused on the precipitation characteristics using gauge-based or gridded observations, but the spatiotemporal information of individual events is still not receiving sufficient attention.
With the ongoing enhancement of remote sensing precipitation products, they are widely used for tracking and identifying precipitation events due to their superior performance in factors such as timeliness, seamless coverage, and high spatiotemporal resolution [35,36]. Chen et al. [37] confirmed that unprecedented precipitation events can be accurately detected and estimated based on the selected precipitation products. The products can effectively mitigate the limitations of ground observation systems, such as the sparse distribution of monitoring stations and the challenges associated with monitoring inaccessible remote regions. The high spatiotemporal resolution of remote sensing precipitation products enables detailed capture of precipitation dynamics, including the initiation, peak, and cessation of rainfall events [38,39]. This detailed information is essential for accurate forecasting and early warning systems, which play a crucial role in mitigating the adverse impacts of extreme weather events such as floods.
Based on the high spatiotemporal resolution of remote sensing precipitation products, lots of methods for tracking and identifying rainfall events have been proposed. For example, Li et al. [40] adopted the Integrated MultisatellitE Retrieval for Global Precipitation Measurement (IMERG) to characterize satellite errors of precipitation events over CONUS [40]. Pang et al. [41] found that the remote sensing precipitation products, including a radar precipitation estimation product (RADAR), a satellite precipitation product (GSMAP), and a reanalysis product (ERA5), possess a strong capability to monitor extreme rainstorms in the Henan region. Previous studies have indicated that a precipitation product with spatial resolution higher than 0.1° and a temporal resolution of less than 1 h can be considered to have high spatiotemporal resolution. Regarding methods for tracking and identifying rainfall events, object-based approaches, which combine pixel-by-pixel analysis with precipitation thresholds, are common methods in precipitation detection studies [42,43]. However, some methods potentially lead to problems such as the loss of spatiotemporal propagation details, double-penalty errors, and discrepancies with observed phenomena [44,45]. The object-based approach can effectively circumvent the aforementioned problems and excels at detecting grid motion and stage changes, such as when objects merge or split. The accuracy and credibility of object-based methods, like the method for object-based diagnostic evaluation [46], the Flexible Object Tracker method [47], the recursive-fractal method, and the Forward-in-Time (FiT) method [26], have been proven to be accurate and credible, and they need few features of precipitation.
In the process of tracking and identifying precipitation events, a crucial question revolves around the decision to apply pre-existing limitations on the dimensions of the precipitation area associated with a particular event. To tackle this question, most object-based approaches identify objects based on contiguous pixels of nonzero grid precipitation products [48,49]. However, they may produce unrealistically large objects, and neglect to consider the weighted geometric centroid. Among the above-mentioned methods, the FiT algorithm endeavors to circumvent arbitrary size constraints by utilizing precipitation thresholds to identify the precipitation area. The precipitation thresholds are designed to prevent light precipitation, which serves as a link between areas of different precipitation events, from being erroneously associated with unrelated events. The algorithm can distinguish neighboring precipitation events led by different meteorological systems.
To address the aforementioned problems of detecting and characterizing event-based precipitation, this study seeks to track and identify the precipitation events on both spatial and temporal scales based on a high-resolution remote sensing precipitation product, and explore the event characteristics of precipitation and the relationships of the different characteristics of precipitation events. By doing this, we combine the Forward-in-Time (FiT) algorithm with a gridded hourly precipitation product (0.1° spatial resolution, 1 h temporal resolution) from the China Meteorological Administration to detect precipitation events in time and space over China. The identified events are analyzed to determine the event characteristics of precipitation (including event occurrence, intensity, and duration). It is worth noting that this study utilizes nonzero cascading thresholds, rather than contiguous nonzero precipitation pixels, for tracking and identifying precipitation events. It is intended to prevent the tracking of unrealistic large-scale precipitation events and to accurately distinguish between neighboring events. Additionally, this study does not evaluate the applicability of the precipitation products for analyzing precipitation events in China. This study tracks both low-intensity and heavy precipitation events to identify their distinct patterns, aiming to provide a theoretical foundation for water resource management and flood disaster prevention.

2. Methodology

Different precipitation events exhibit variations in their physical mechanisms and influence factors, and the characteristics (spatiotemporal distribution, intensity, duration, etc.) of different events can vary. In order to distinguish different precipitation events, the FiT algorithm [26] is adopted to track and identify different events. The FiT algorithm is an object-based physical event detection method based on object-based diagnostic evaluation. The algorithm sets a sequence of cascading thresholds based on precipitation, and combines the temporal and spatial distribution of precipitation to distinguish distinct events. By doing so, the algorithm is intended to track and distinguish precipitation events closer to the actual precipitation events. The identified events are three-dimensional spatiotemporal entities (i.e., latitude, longitude, and time dimensions). The FiT algorithm first identifies the code object and its growth boundary at each, and then identifies each object belonging to the different precipitation events based on the overlapping areas of the objects at adjacent (i.e., previous or next) time intervals. More details can be found in Skok et al. [26], and the main principle and calculation step of the FiT algorithm are shown in the following.

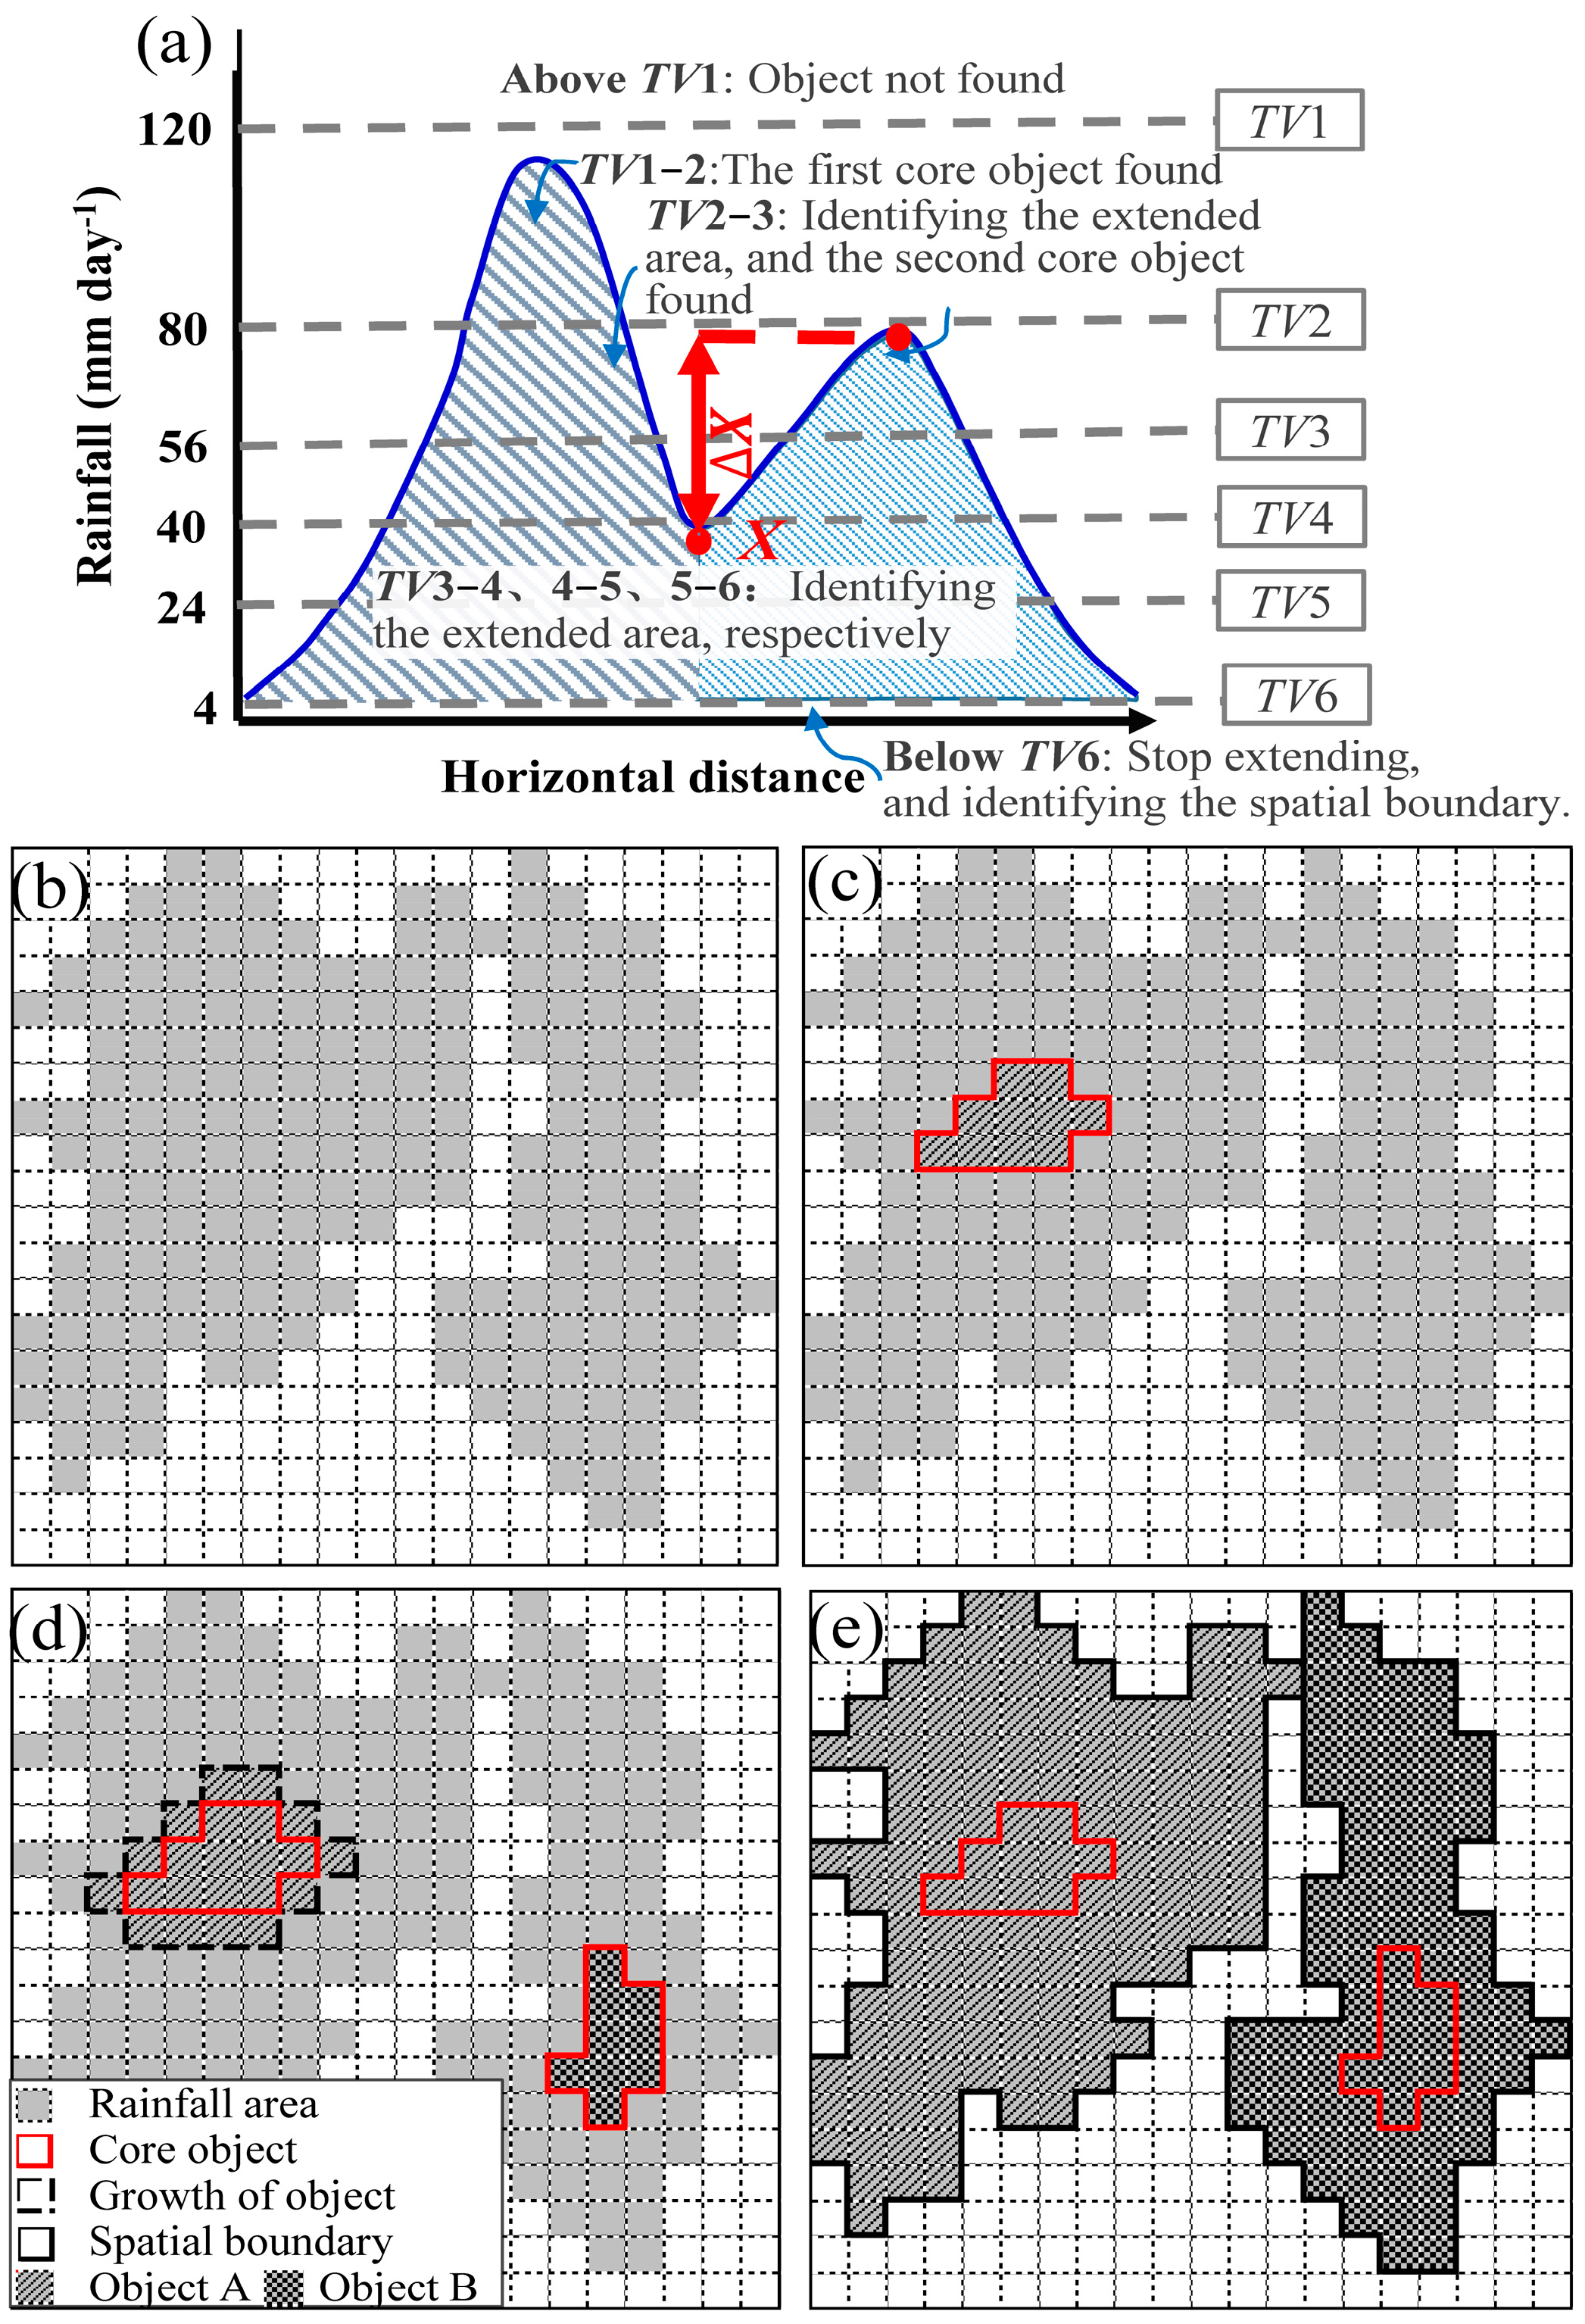
2.1. Identify the Precipitation Objects at Each Time Interval

The algorithm defines a series of cascading thresholds based on precipitation rates to delineate distinct precipitation events. The cascading thresholds are adopted to distinguish different levels of precipitation rates. In this study, the cascading thresholds follow the definition shown in Skok et al. [26], i.e., the threshold values T V n   ( n = 1 , 2 , , 6 ) are 120, 80, 56, 40, 24, and 4 mm day−1 (Figure 1a). The threshold T V n to T V ( n + 1 ) is set to decrease about 30% ( n = 1 , 2 , , 5 ) in order to identify discrete different precipitation events and more features of events.
During the identification of the spatial boundaries of different objects at each time interval, the FiT algorithm identifies areas with precipitation rates exceeding the lowest threshold (i.e., TV6 = 4 mm day−1). These are considered effective precipitation areas, while others are considered to have no rainfall (Figure 1b). The lowest threshold can prevent the tracking of too many events with low precipitation rates. On this basis, the precipitation rates are iteratively calculated, starting from the higher threshold values and descending to the lower ones. Specifically, the highest threshold, TV1, is applied first to identify objects with precipitation rates exceeding TV1. If all precipitation rates are below TV1, it indicates that no objects can be identified using this threshold. The process continues with the second-highest threshold, TV2, and so on, until the lowest threshold is reached.
When the FiT algorithm identifies the first object at a time interval, the object is regarded as a core object (i.e., the red line area as shown in Figure 1c). It is worth mentioning that there may be one or more core objects in the same time interval, e.g., there are one or more precipitation areas and the precipitation areas are discontinuous, so that one or more core objects can be identified. One core object can identify one object, and different core objects cannot be merged. Then the area of the next threshold is regarded as the growth area. The object growth extends from the periphery of core objects in four directions (i.e., left, right, top, and bottom). Each extension should be connected to the periphery, until the growth areas of this threshold are occupied (e.g., Figure 1d,e). In this way, the growth areas are identified from the higher threshold to the lower one, until the lowest one. During the object growth, new core objects may be identified.
The FiT algorithm focuses on distinguishing precipitation events caused by different factors; it can distinguish the continuous spatial areas of precipitation into different objects with different precipitation rates and the threshold list. The following conditions should be satisfied: (i) the continuous spatial area contains two precipitation peaks (i.e., XL and XH), and the minimum precipitation between the peaks is X, where X < X L X H ; (ii) T H 5 < X L < T H 1 + Δ T H , where Δ T H = T H i T H ( i + 1 ) , and T H ( i + 1 ) X L T H i ( i = 1 , 2 , , 4 ); (iii) Δ X > Δ T H , where Δ X = X L X (Figure 1a). To avoid identifying the precipitation events with a light precipitation rate, TH6 (i.e., 4 mm day−1) is used only to detect and identify the growth of objects; it cannot serve as a threshold for identifying a new core object. Once a precipitation event is identified, the event cannot be merged with other events, but can merge other objects at the next time intervals.

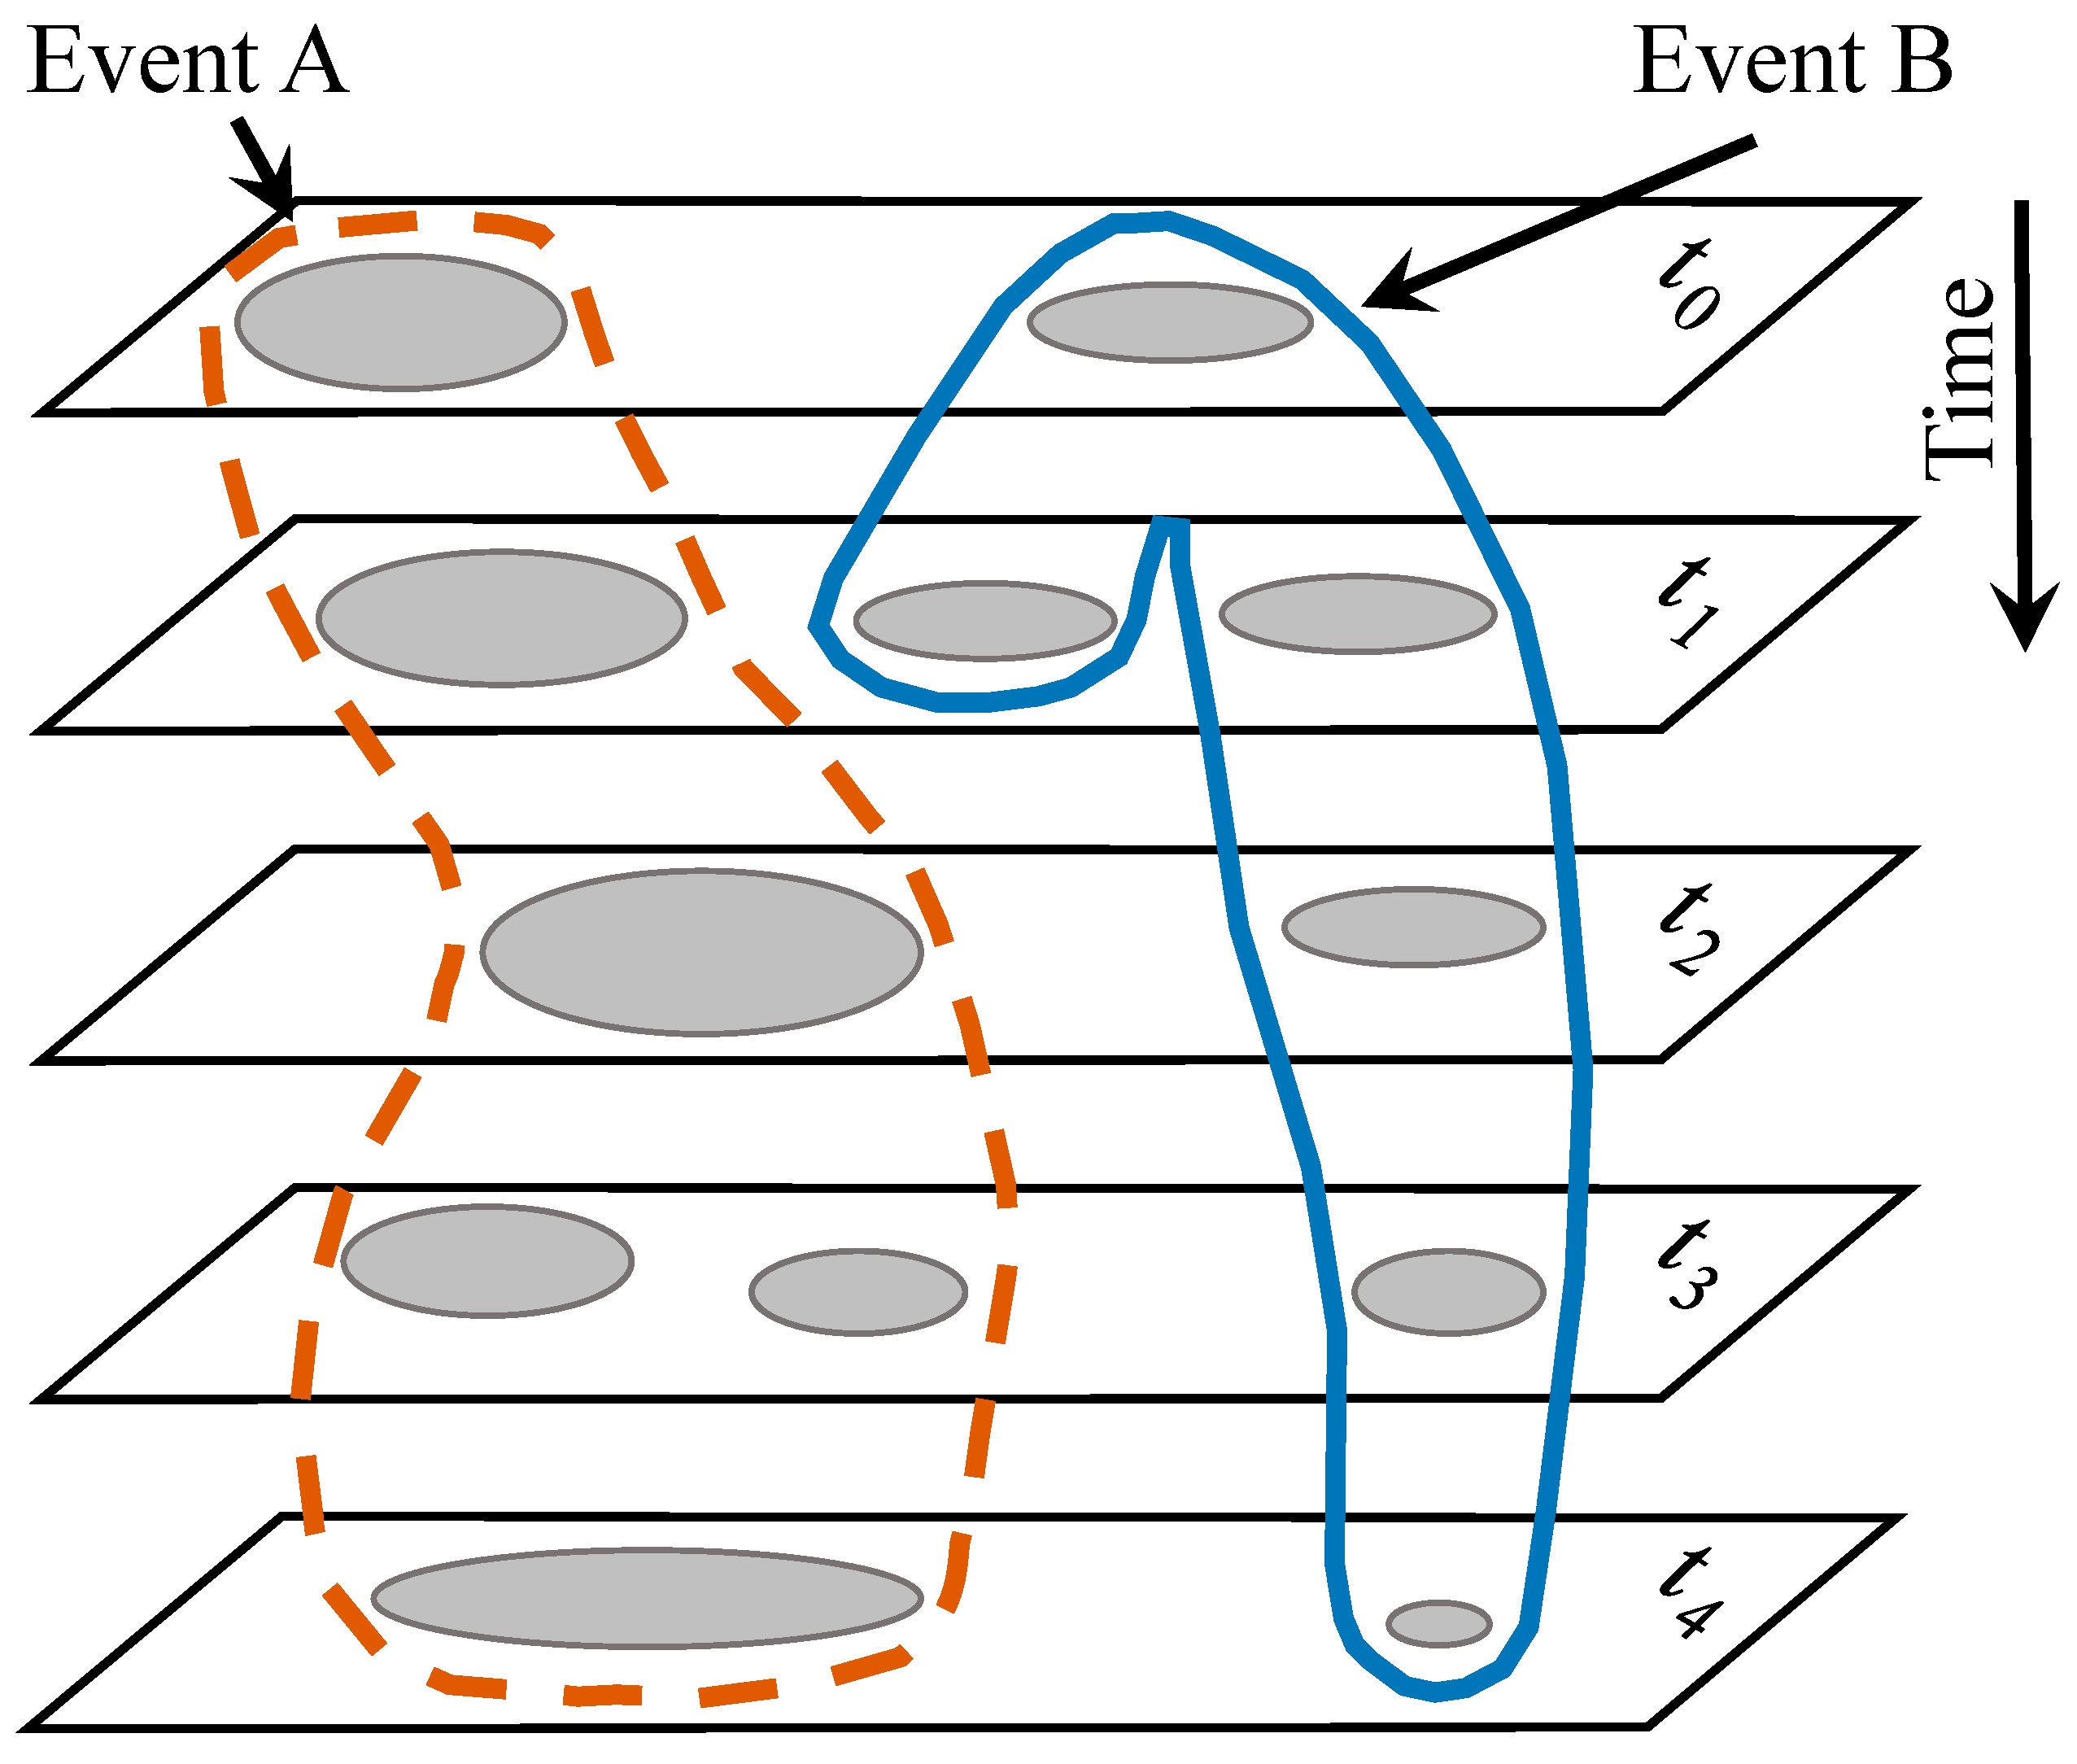
2.2. Identify the Same Precipitation Event through Time Intervals

Precipitation events are defined as three-dimensional spatiotemporal objects by the FiT algorithm, that is, self-contained volumes with dimensions of latitude, longitude, and time interval. The precipitation object identification only considers latitude and longitude dimensions at each time interval; the temporal matching of objects at adjacent (i.e., previous or next) time intervals is not treated. The FiT algorithm regards the time interval as the third dimension. In order to identify the same precipitation event, the identified objects are linked through time intervals. The FiT algorithm divides different objects into the same precipitation event based on whether the object areas overlap at adjacent time intervals.
During the performance of the temporal matching of objects (e.g., Figure 2), the FiT algorithm allows one object to be split into two or more objects at the next time interval (e.g., the object of Event B at t0 splits into two objects at the t1 time interval); also, two or more objects can merge into one object (e.g., two objects of Event A at t3 merge into one object at the t4 time interval). It is remarkable that objects can be branched or merged from time t to t + 1; the objects cannot be retroactively branched or merged from time t + 1 to t, i.e., the objects before the current time interval belonging to an event cannot be changed to other events in the current time interval. When merging objects, the FiT algorithm checks if the current time interval objects overlap with those at adjacent time intervals. The roles of identifying different objects into the same precipitation event are as follows:
(i)
If one object in the current (t) time interval only overlaps with one object in the previous (t − 1) time interval, the two objects are identified as the same precipitation event.
(ii)
If two or more objects in the current (t) time interval overlap with one object in the previous (t − 1) time interval, these objects are identified as the same precipitation event.
(iii)
If one object in the current (t) time interval overlaps with two or more objects belonging to different events in the previous (t − 1) time interval, the object is assigned to the object that has the largest overlap area, i.e., these two objects are identified as the same precipitation event.

3. Study Region and Data
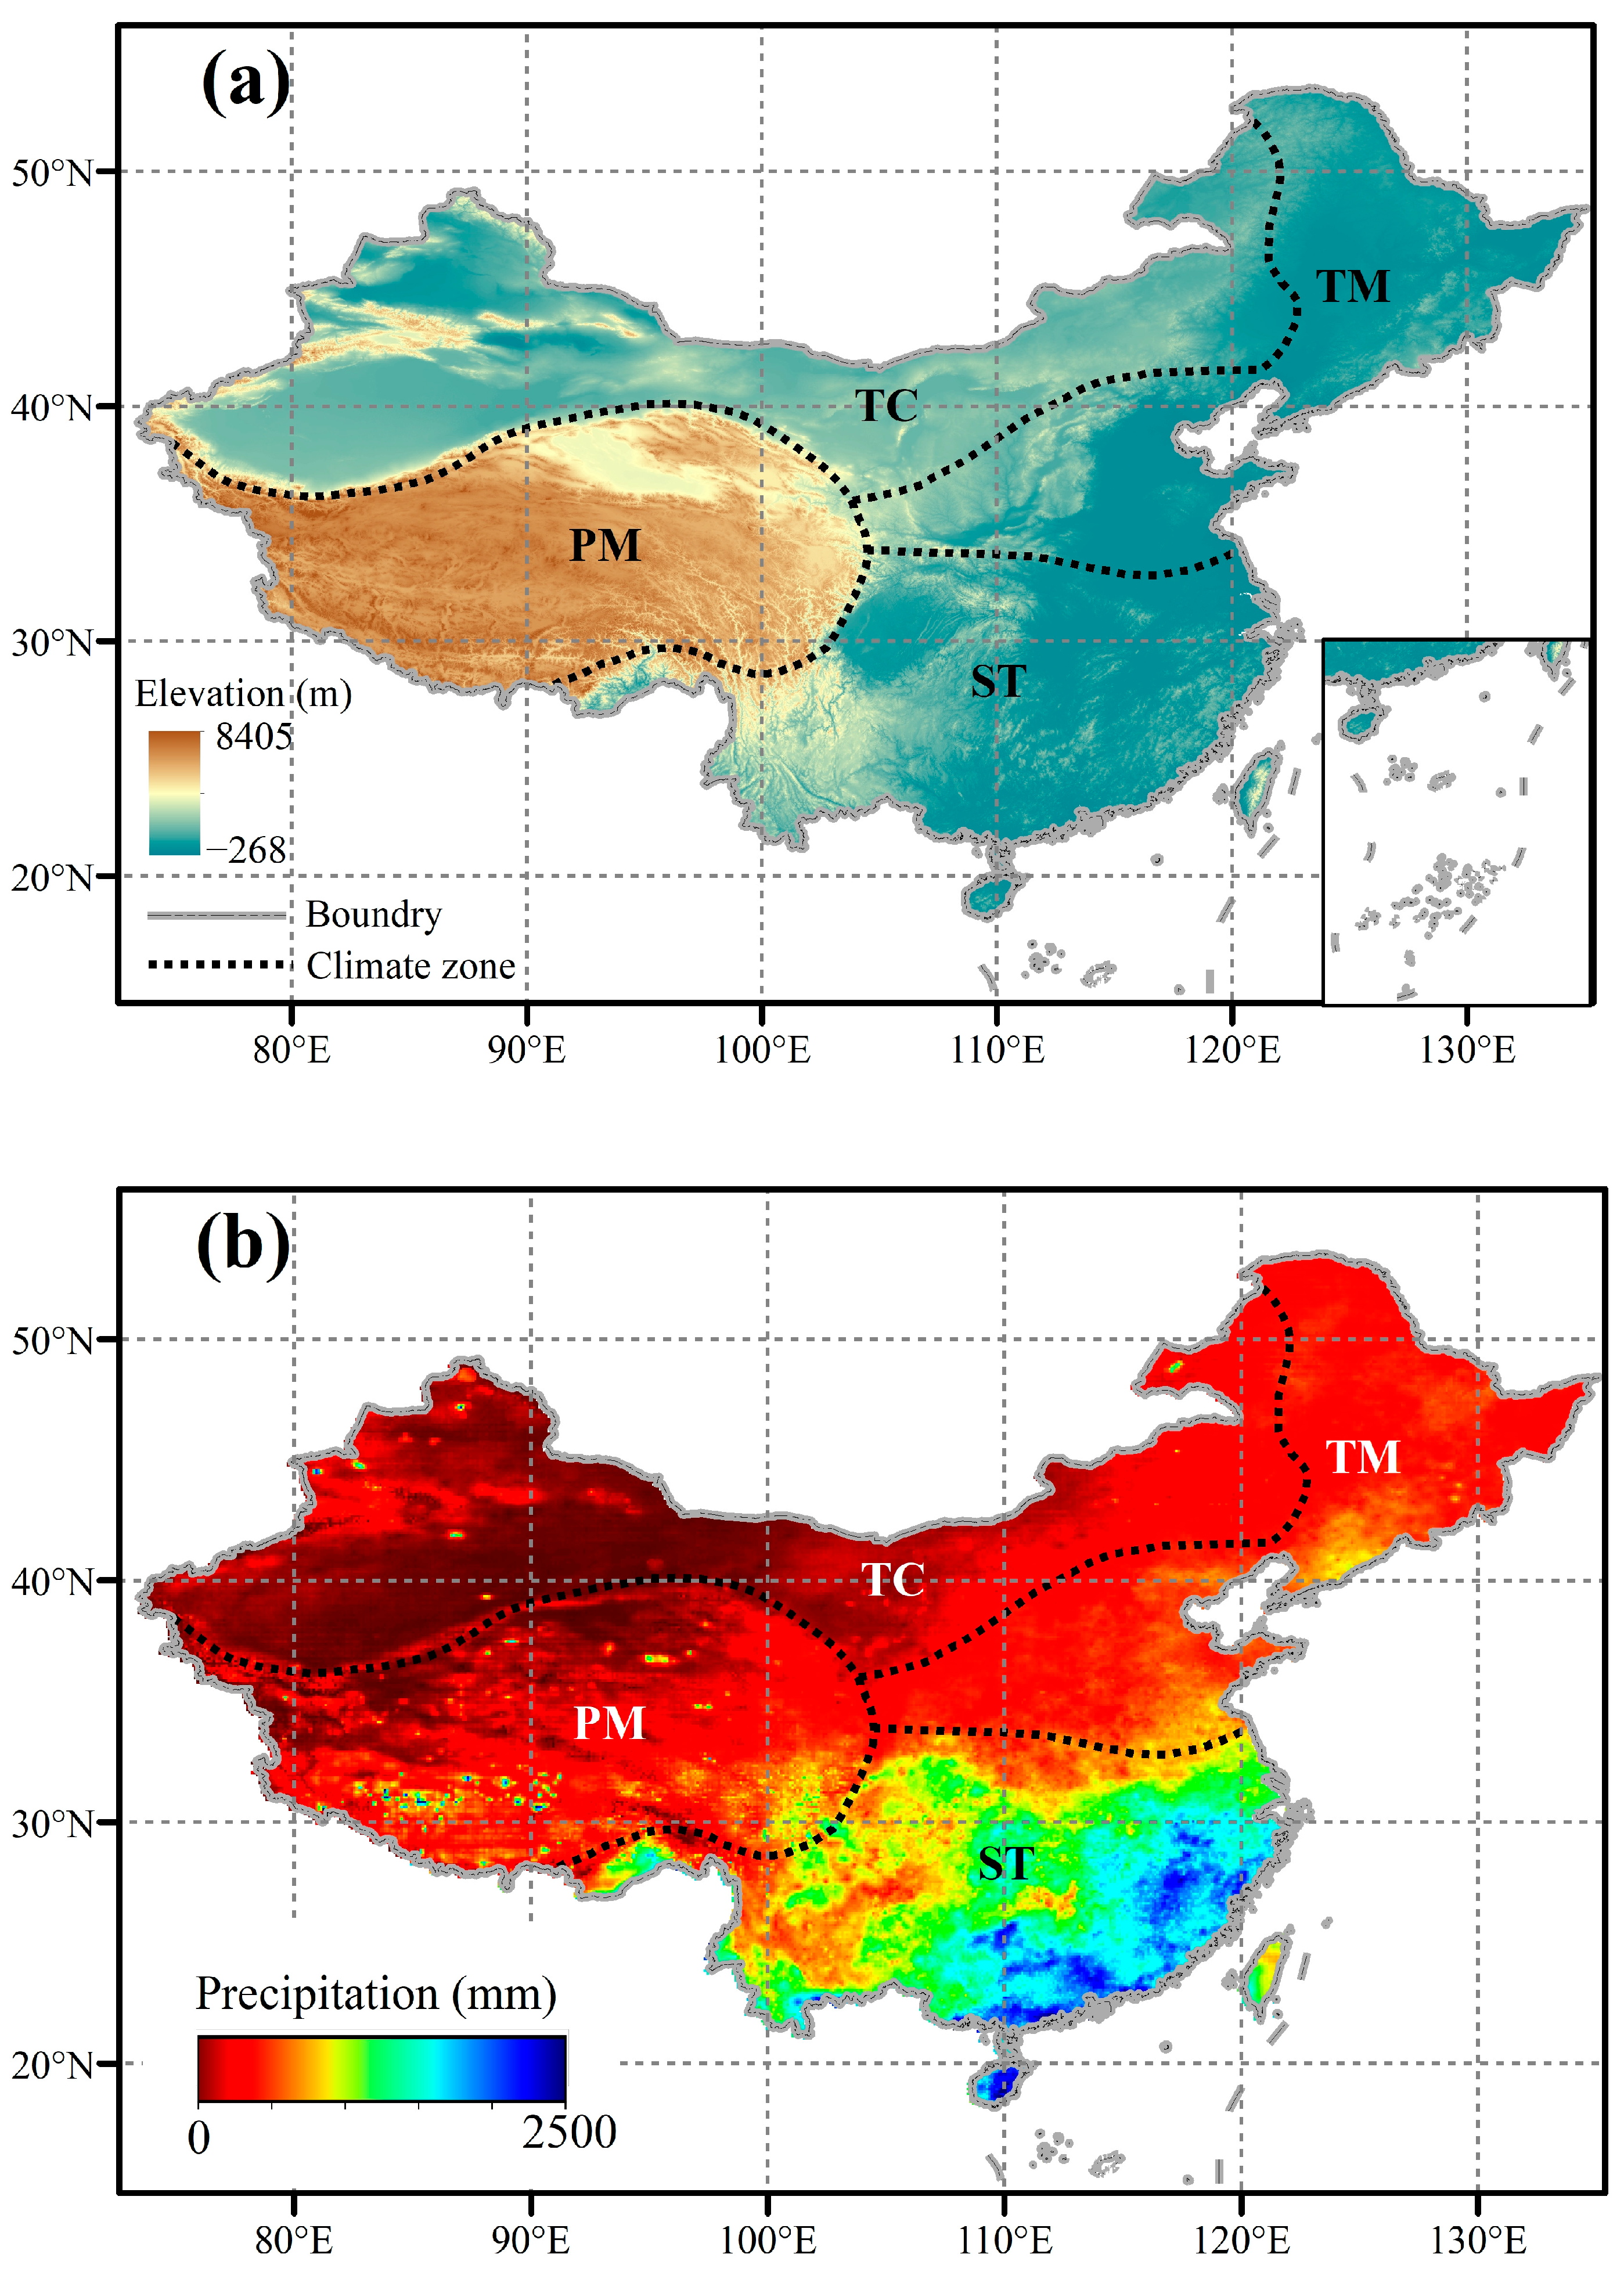
3.1. Study Region

Mainland China, covering a vast territory, is selected as the study region. The land area is around 9.6 million km2, of which more than 60% is mountains, hills, and plateaus, and around 30% is basins and plains. The terrain of China gradually rises from the southeast to the northwest (Figure 3a). The east and southeast of China is mainly composed of plains and hilly areas with a lower altitude, while the western and northern parts are characterized by high mountains and plateaus with a higher altitude. Figure 3a shows the spatial distribution of the topography, indicating that the difference in the elevation between southeast and northwest is generally more than 4000 m. The climatic conditions are significantly different because of the wide range of latitudes and longitudes. Following the climatic characteristics, topography, and water resource conditions [50,51], mainland China can be classified into four climate zones (Figure 3a): (i) plateau mountain (PM) climate zone, (ii) temperate continental (TC) climate zone, (iii) temperate monsoon (TM) climate zone, and (iv) subtropical and tropical monsoon (ST) climate zone (Figure 3b). Generally, the annual precipitation of the ST climate zone is greater than 1000 mm; that of the TM climate zone ranges from 400 to 1000 mm; and that of the PM and TC climate zones is lower than 400 mm. The main portion of the annual precipitation is concentrated in summer. Precipitation tends to decrease along south–north and east–west axes, and is primarily affected by the monsoon dynamics.

3.2. Precipitation Data

A gridded hourly precipitation product from the China Meteorological Administration (https://data.cma.cn/site/showSubject/id/101.html, accessed on 1 June 2023) is adopted in this study. This precipitation product merges more than 30,000 ground-based hourly rain gauge observations and the Climate Prediction Center morphing technique (CMORPH) satellite precipitation product, i.e., the ground-based observations are applied to correct the bias of the CMORPH satellite precipitation product through a probability density function; then the corrected CMORPH satellite precipitation product is merged with the ground-based observations to create the gridded hourly precipitation product through the optimal interpolation method. The gridded hourly precipitation product effectively reduces the systematic bias in the CMORPH satellite precipitation product over China. The quality of the product is strictly controlled by the China Meteorological Administration. Shen et al. [52] indicated the total error of the gridded hourly precipitation product is less than 10%. Although the errors are relatively greater in sparse areas (less than 20%), the product is more accurate than similar precipitation products in these areas. Due to its high quality and accuracy, the product is commonly utilized as a benchmark for evaluating satellite-based and reanalysis precipitation products in China, such as IMERG, PERSIANN-CCS, ERA5-Land, FY-4A, and GSMaP [53,54,55,56]. The product covers China at an hourly temporal resolution and has a horizontal resolution of 0.1°. It has been widely used in precipitation studies and hydrologic analyses (e.g., Xu et al. [51]; Jiang et al. [57]; Sun et al. [58]). In this study, we use the gridded hourly precipitation product from 2008 to 2016 to analyze the characteristics of precipitation events.

4. Results and Discussions

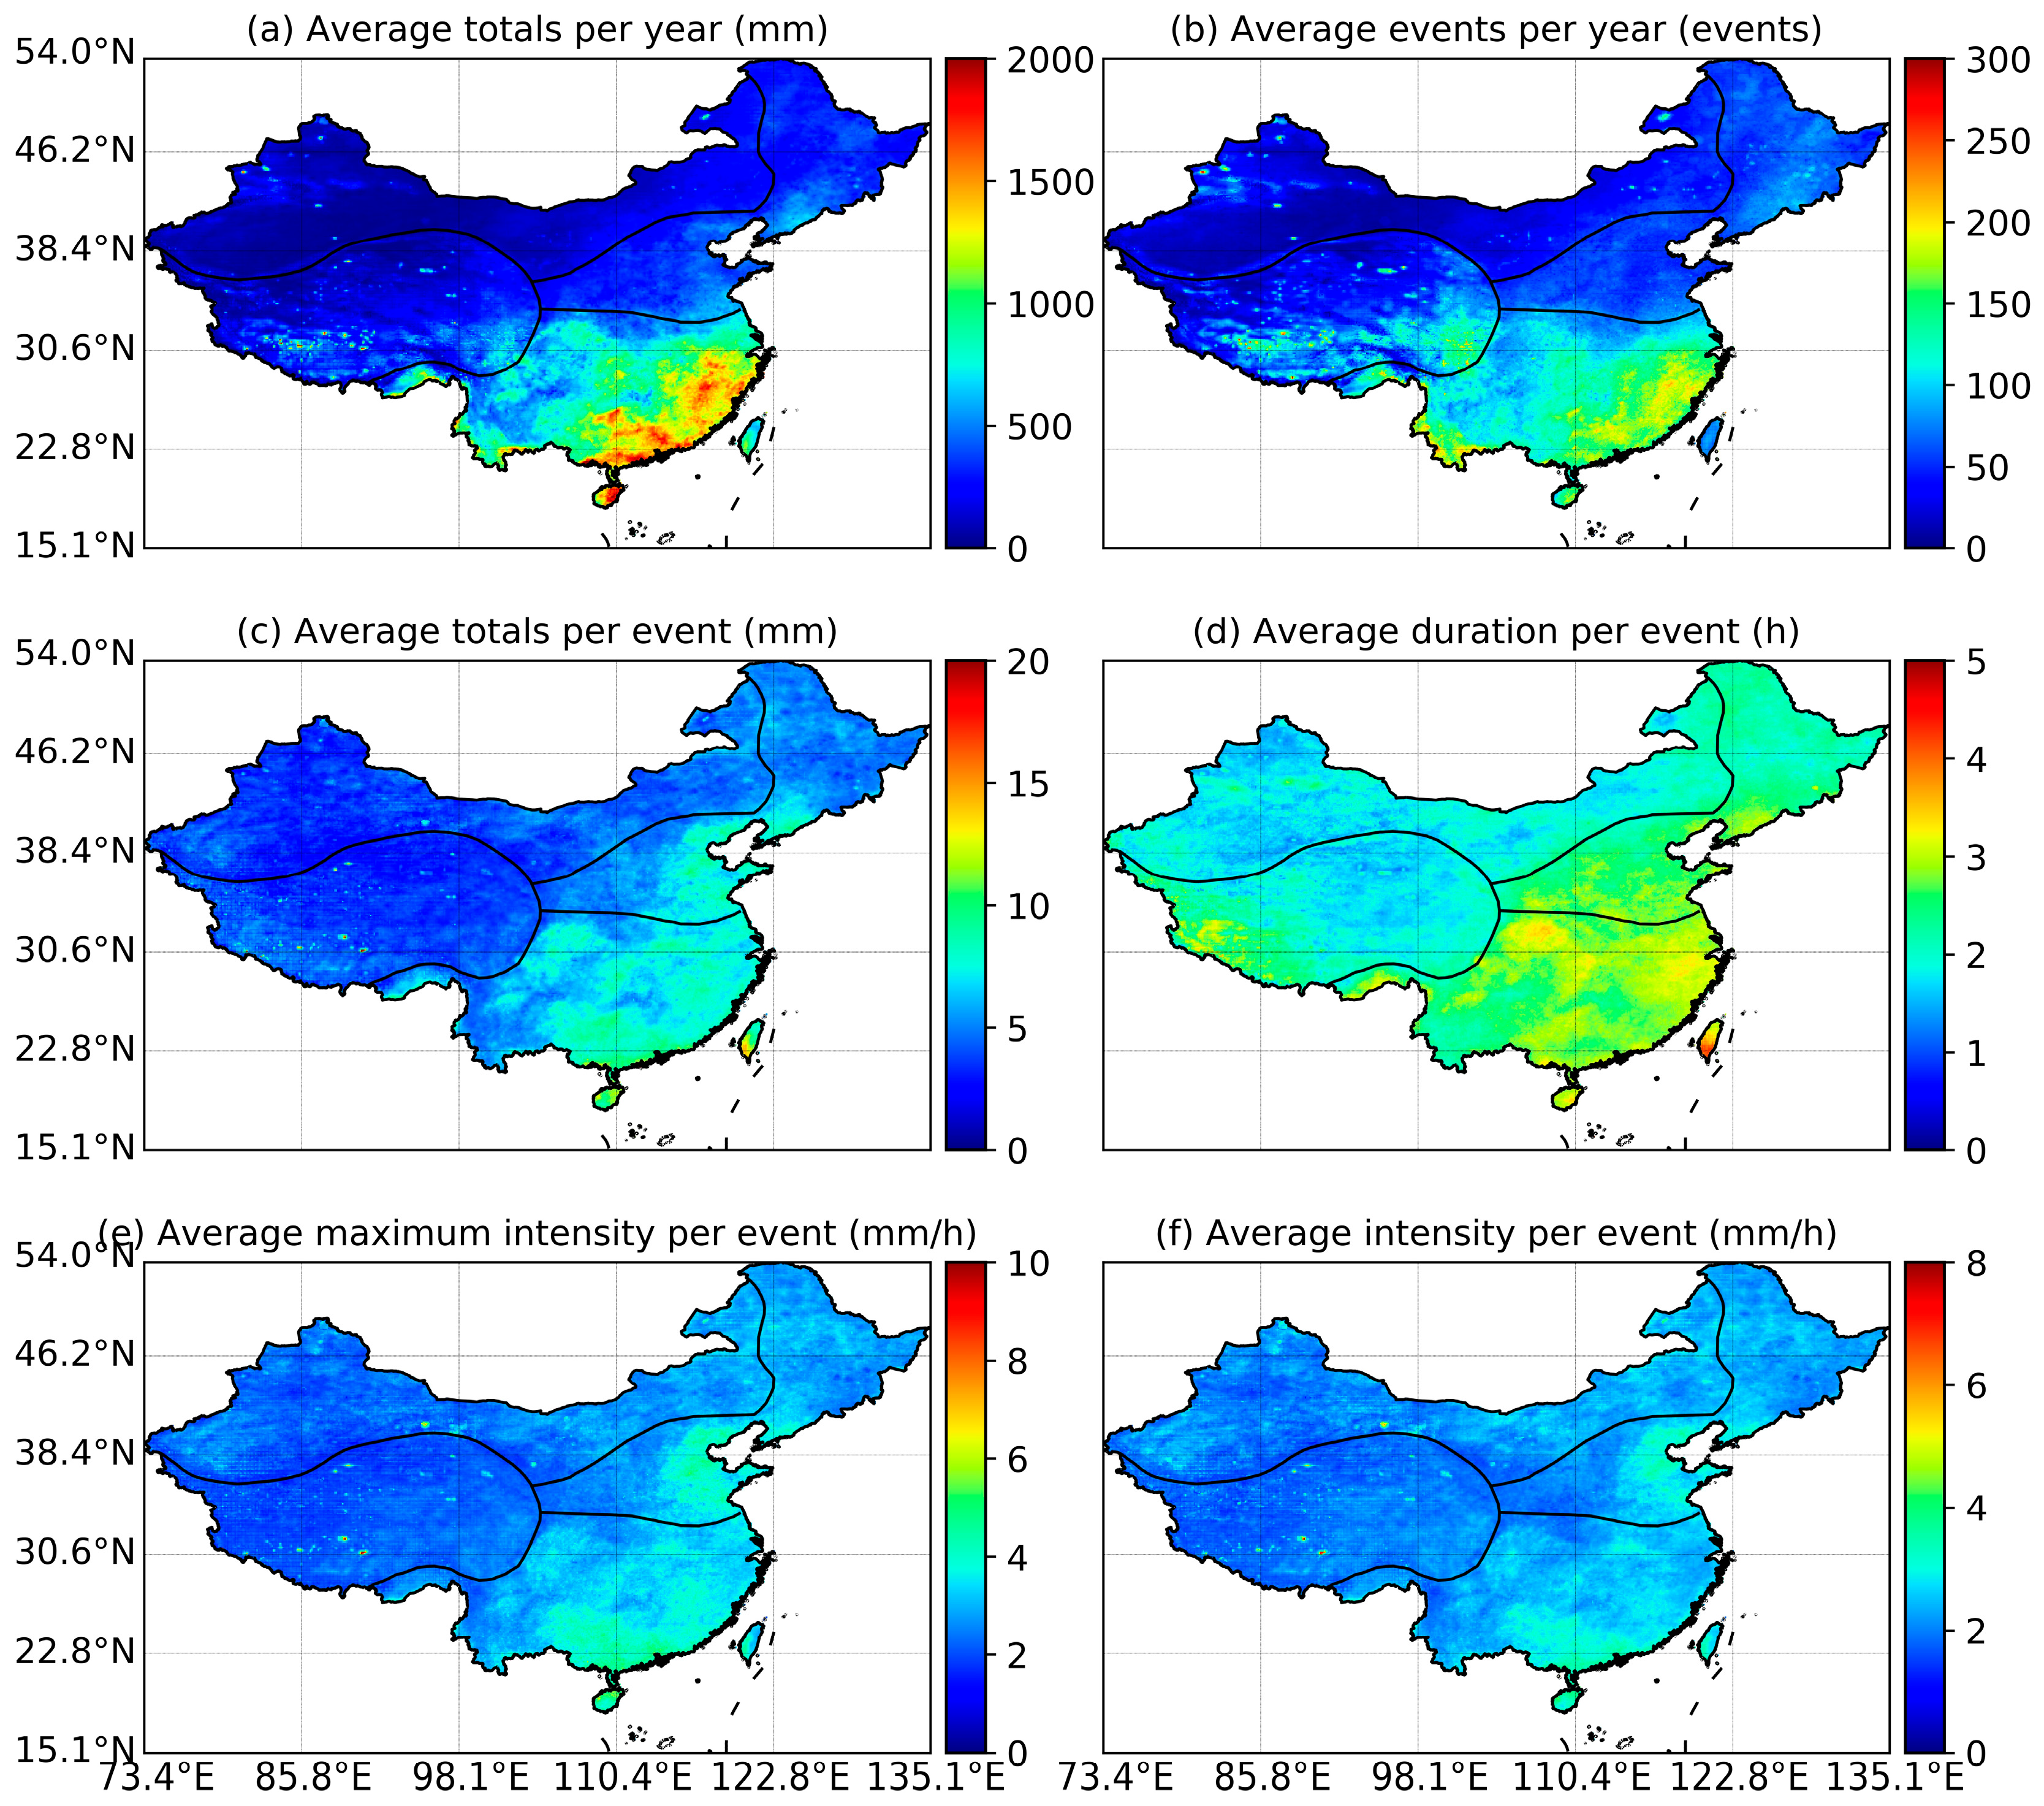
4.1. The Spatial Characteristics of Precipitation Events

The average characteristics of precipitation events were explored across mainland China, including the average of precipitation totals, events, totals per event, duration per event, average maximum intensity per event, and average intensity per event (Figure 4). It is worth mentioning that the results shown in the figure were analyzed based on the detected precipitation events, i.e., the precipitation rates below 4 mm day−1 were discarded in this study. Following the criteria described earlier, precipitation rates lower than 4 mm day−1 were discarded to avoid detecting some very low precipitation events.
Generally, the average precipitation totals and events decrease gradually from the southern (eastern) coastal regions to northern (western) inland areas of China. The results show that the spatial patterns of the precipitation totals and events are consistent with the precipitation observations from individual gauges across mainland China. The precipitation totals shown in Figure 4a are generally lower than the observed totals, as some relatively light precipitation data are discarded. The short-duration and drizzling events were not counted, which could help reveal the characteristics of the precipitation events. Similarly, White et al. [59] excluded rainfall of less than 24 mm day−1 to avoid unrealistically large-scale events. Specifically, the ST climate zone has the largest average precipitation totals and the most precipitation events, ranging from around 650 to 2000 mm per year and from 80 to 300 events per year, respectively. The precipitation totals (ranging from about 300 to 900 mm) and events (ranging from about 50 to 130 events) in the TM climate zone are relatively lower and less frequent than in the ST climate zone. The TC and PM climate zones have the lowest precipitation totals (generally lower than 400 mm) and the fewest precipitation events.
The spatial characteristics of precipitation events, including the average totals, duration, maximum intensity, and intensity per event, are similar to the average precipitation totals and events (Figure 4c–f), i.e., they decrease gradually from the coastal regions to inland areas of China. Although the disparities between coastal and inland areas in these characteristics are not as pronounced as in the overall precipitation measures, variations within the same climate zone are also relatively minor. For instance, the average precipitation totals per year between southeastern and northwestern areas within the ST climate zone show a relatively large difference, while the difference in average precipitation totals per event or duration per event is relatively small. These different precipitation event characteristics reflect the fact that the event characteristics in different climate zones or even in the same climate zone can be very different.
It can be noted from Figure 4 that the precipitation events with larger totals on average tend to have longer durations and higher maximum intensities. The average precipitation totals per event in the ST climate zone and the coastal area of the TM climate zone are around 5 to 10 mm, and are larger than in other climate zones. On the other hand, the average maximum intensity (duration) per event in the ST climate zone and the coastal area of the TM climate zone ranges from 3 to 5 mm (3 to 4 h), which is notably higher than in other climate zones, where the average maximum intensity (duration) is generally lower than 3 mm (3 h) per event (Figure 4c–e). The results shown in Figure 4 correspond well to the results found by Li et al. [44], who analyzed the number of precipitation events, event duration, and event depth over mainland China based on gauge records and the IMERG precipitation product.

4.2. The Relationships of the Different Characteristics of Precipitation Events

For hydrological practices such as flood hazard mitigation, understanding the relationships of the characteristics of precipitation events, which can reflect the mechanism of rainfall-induced hazards, is extremely important. The Pearson correlation coefficients between event precipitation totals and event duration, event maximum intensity, and event intensity, as well as event maximum intensity vs. event intensity, were calculated. The spatial distribution of Pearson correlation coefficients is illustrated in Figure 5.
As shown in Figure 5, event precipitation totals are generally more strongly correlated with event duration and event maximum intensity than with event intensity. The Pearson correlation coefficients for event precipitation totals with event duration exceed 0.7 in most areas, indicating a strong positive correlation. The differences in these coefficients between coastal areas and inland regions are not distinct (Figure 5a). These results indicate that longer event durations are typically associated with larger event precipitation totals. These results are consistent with the results found by Wu et al. [60], showing that the larger event precipitation totals are more likely attributed to events with long durations. Additionally, Li et al. [61] found a significant correlation between the duration of extreme precipitation and the precipitation total.
Unlike event duration, event precipitation totals are more strongly correlated with event maximum intensity and event intensity in PM and TC climate zones. The Pearson correlation coefficients between event precipitation totals and event maximum intensity are at their maximum in the TC climate zone (Figure 5b). The coefficients are generally greater than 0.8, and are almost 1 in most areas in this climate zone. The coefficients range from around 0.8 to 0.95 in the PM climate zone, and are generally lower than in the TC climate zone, but are greater than those in ST and TM climate zones (ranging from around 0.7 to 0.9). Event precipitation totals generally have a rather weaker correlation with event intensity than maximum intensity. The coefficients of event intensity range from around 0.7 to 0.9 in TC and PM climate zones, and from 0.4 to 0.7 in ST and TM climate zones (Figure 5c). However, the correlation between event maximum intensity and event intensity is relatively weak; the Pearson correlation coefficients are generally lower than 0.4 across mainland China (Figure 5d).
It can be noted from Figure 4 and Figure 5 that, on average, larger event precipitation totals are associated with longer event durations and larger event maximum intensities in TC and PM climate zones, where the characteristics of precipitation events are relatively complex. Although in these zones event precipitation totals mainly depend on event duration, event maximum intensity, and event intensity, the characteristics of precipitation events in ST and TM climate zones are relatively uniform.

4.3. The Duration Characteristics of Precipitation Events

The percentage of all precipitation events captured at each grid in different durations is shown in Figure 6. It is worth mentioning that each precipitation event was counted once in each grid, while the same event occurring in different grids is counted separately for each grid.
On average, the precipitation events are mainly characterized by a short duration across mainland China. It can be noted from Figure 6 that the event durations are generally shorter than 6 h. For the PM and TC climate zones, the combined percentage of 1 h, 2–3 h, and 4–6 h is close to 100%, with the percentage for 1 h typically exceeding 70%, around 20% for 2–3 h, and less than 10% for 4–6 h. There are almost no precipitation events with a duration exceeding 6 h. Despite the fact that the proportion of precipitation events with short durations is relatively high in ST and TM climate zones, the proportion for 1 h, 2–3 h, and 4–6 h is generally less than around 50%, 35% and 15%, respectively. The proportion for the duration of longer than 7 h generally exceeds 4% in ST and TM climate zones. On the whole, there are more precipitation events with long duration in the ST climate zone than in the TM climate zone.
The spatial variations in event duration within heavy precipitation events are more significant, as shown in Figure 7. Heavy events predominantly occur in the coastal areas of the ST climate zone, which experience about 15 to 25 events per year, but there are generally fewer than 10 events in non-coastal areas of the same climate zone (Figure 7a). The TM climate zone has the second highest number of heavy rainfall events following the ST climate zone, ranging from 5 to 10 events per year. As latitude increases, the frequency of heavy events tends to decrease. In the TC and PM climate zones, there are generally fewer than four heavy events per year.
The spatial characteristics of heavy events vary with duration (Figure 7). For durations of 1–3 h, the spatial distribution of events shows relatively little variation, with less than one event per year across the four climate zones. For heavy events with a duration longer than 4 h, the spatial distribution difference of the events is more significant than the events with a duration of 1–3 h. Heavy events primarily occur in the ST climate zone across different durations, and the heavy events are significantly more frequent than in other climate zones. It can be found from Figure 7 that heavy events with a duration of 7–12 h are more frequent than those of other durations; there are around 3 to 10 events per year in the ST climate zone. There are generally around four heavy events and three heavy events per year with durations of 4–6 h and 13–24 h, respectively, which are less frequent than the heavy events with a duration of 7–12 h, but more frequent than events with other durations. Similar results can also be found in Zhu et al. [3].

5. Conclusions

Precipitation events are naturally individual and exhibit a variety of characteristics, such as duration, intensity, and total precipitation. The spatial characteristics of these events vary significantly across different climate zones and durations. However, these event characteristics are often ignored in precipitation analysis and hydrological modeling. The main motivation for this work is that, despite a focus on analyzing event precipitation characteristics in many studies, only a relatively small number of them have explored these characteristics using sub-daily gridded precipitation data. We use the FiT algorithm to detect and identify precipitation events based on gridded remote sensing precipitation products. These events are then used to analyze characteristics such as precipitation total, duration, and maximum intensity. The major conclusions are summarized as follows:
(i)
Precipitation events can be detected and identified in time and space scales based on the FiT algorithm and the gridded hourly precipitation product. It is a useful framework for characterizing precipitation events and understanding the relationships between the different characteristics of precipitation events.
(ii)
The spatial distribution of precipitation event characteristics (including the average precipitation totals and events per year, and the average totals, duration, maximum intensity, and intensity per event) notably differs across different climate zones. It decreases gradually from the southern (eastern) coastal regions to northern (western) inland areas of China.
(iii)
The event precipitation totals are generally more strongly correlated with event duration and event maximum intensity than with event intensity. The Pearson correlation coefficients of the event duration and event maximum intensity often exceed 0.7. The Pearson correlation coefficients between event maximum intensity and event intensity are higher in the climate zones with lower precipitation than climate zones with higher precipitation.
(iv)
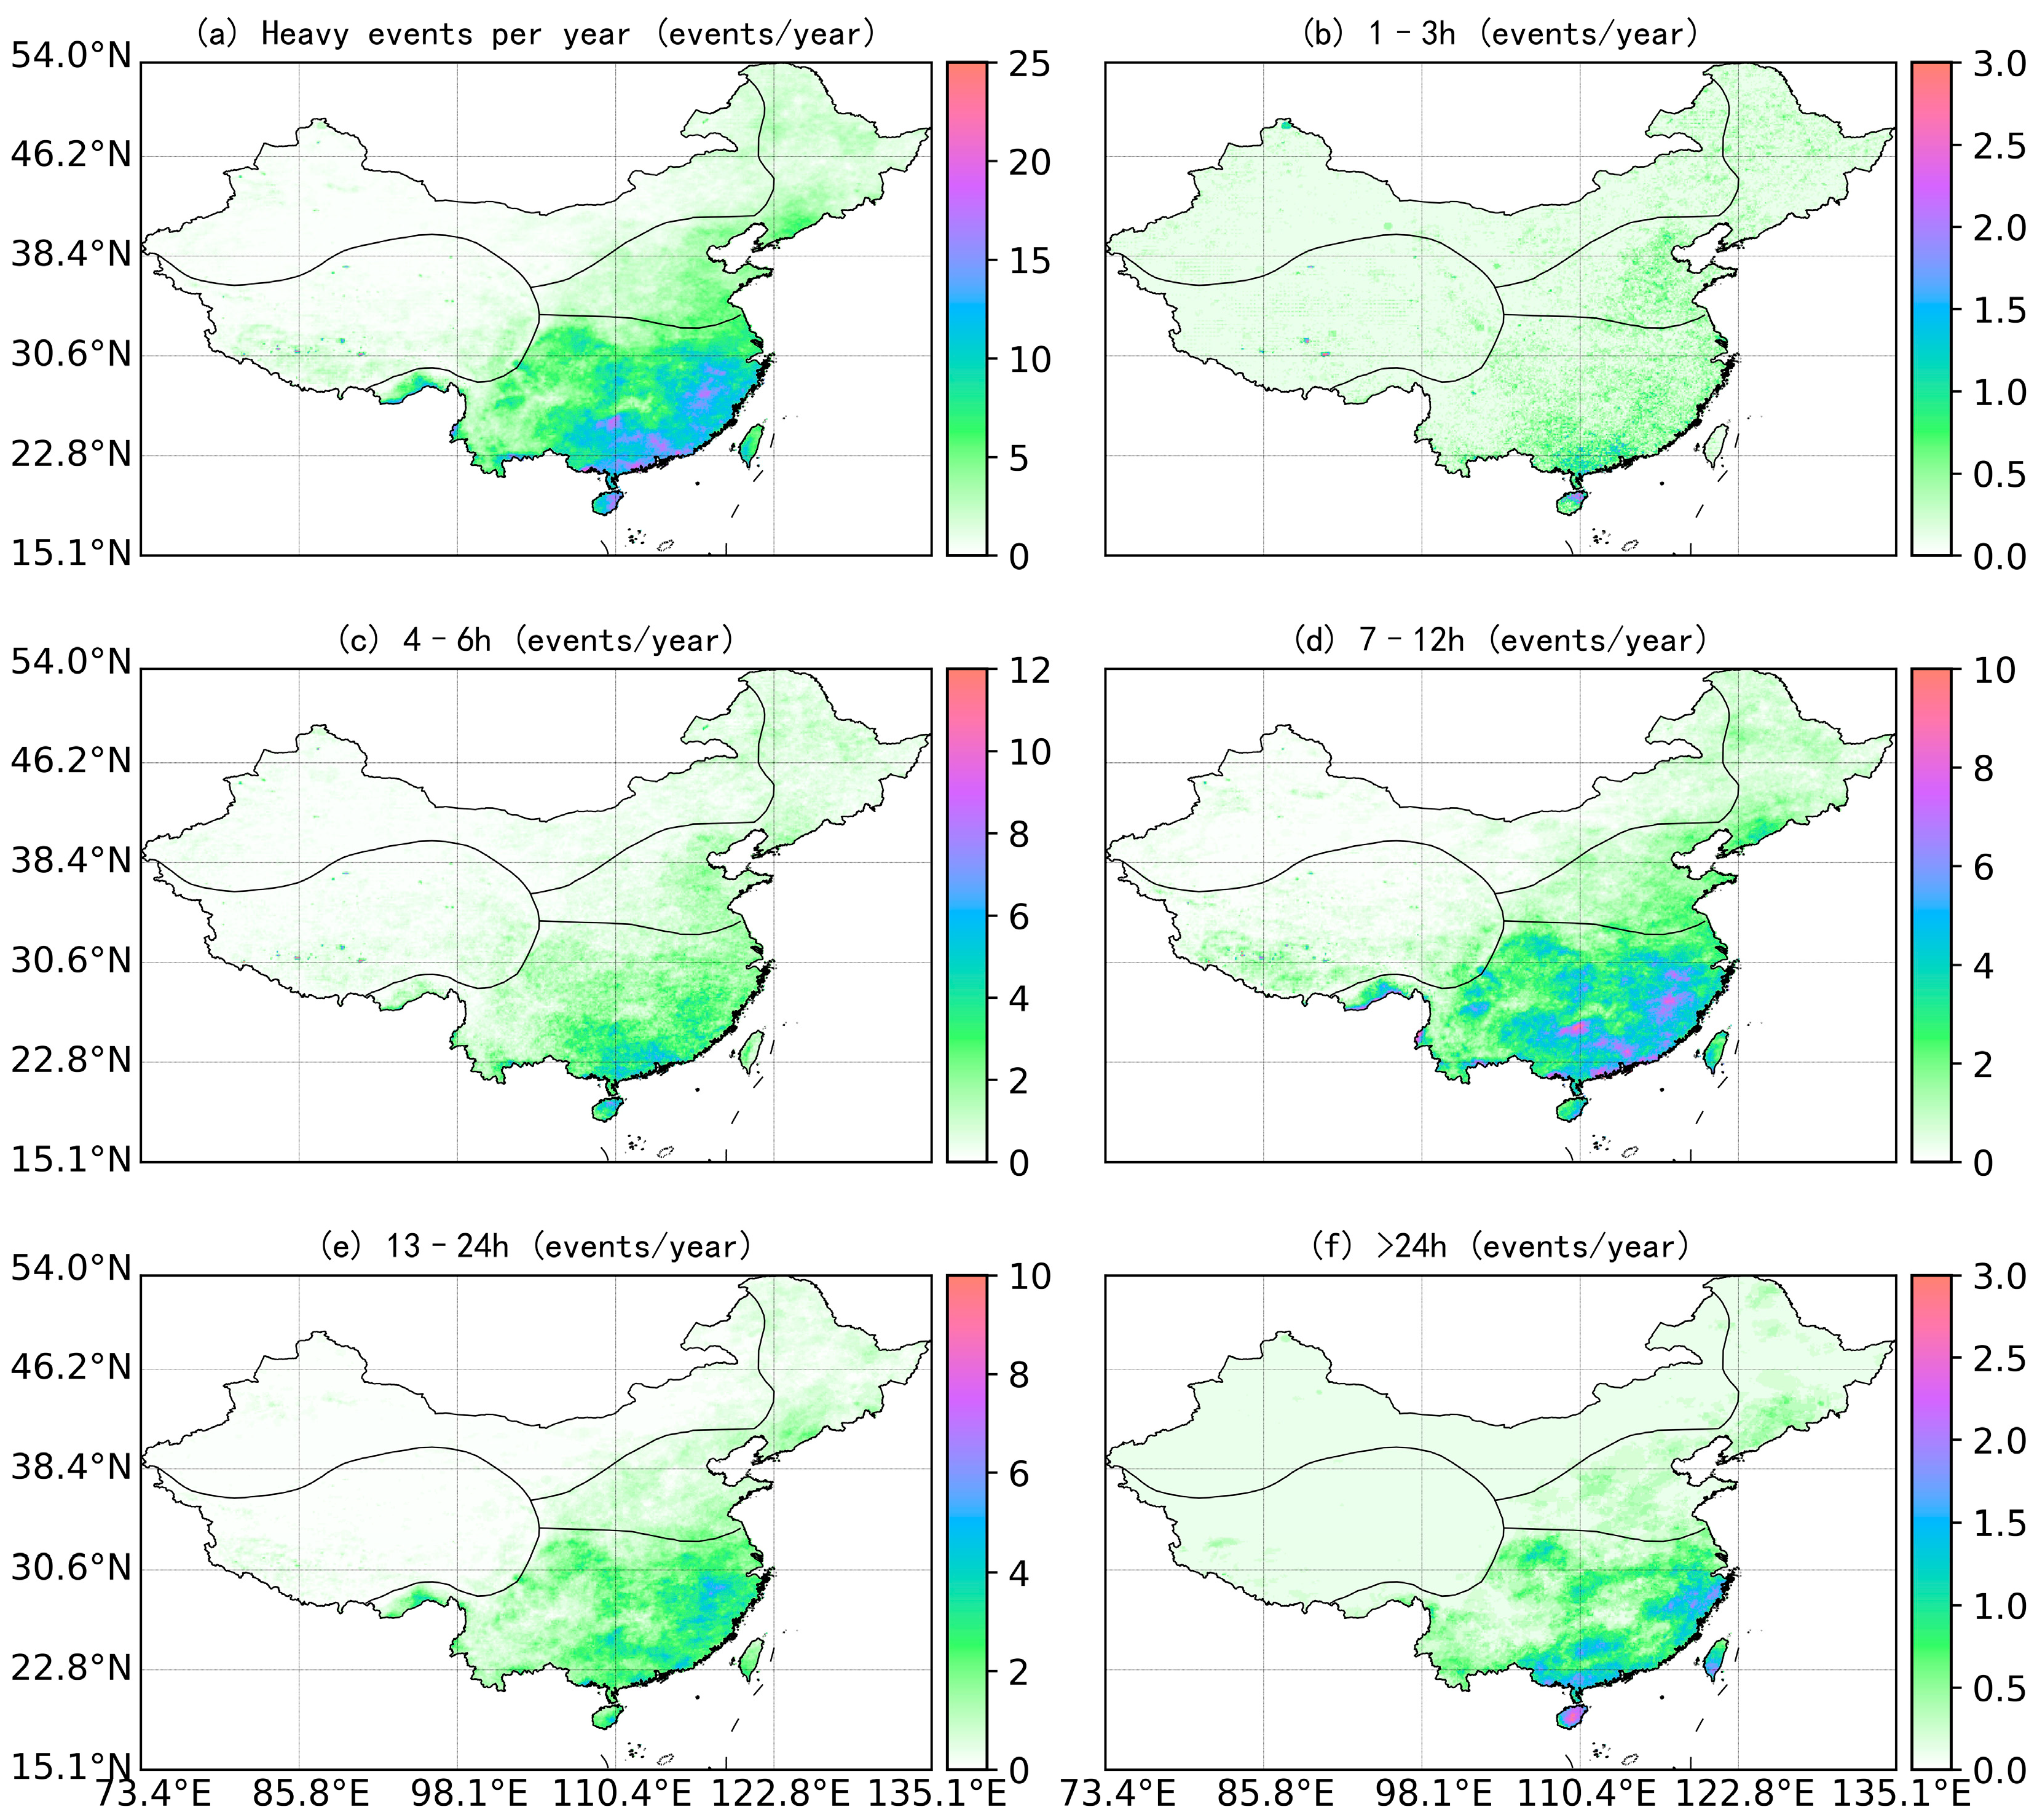
The durations of precipitation events are generally shorter than 6 h, and the proportion of events having a duration shorter than 6 h generally exceeds 90%. The combined proportion of 1 h, 2–3 h, and 4–6 h is close to 100% in the PM and TC climate zones, and the frequency of heavy precipitation events is generally less than four per year. The proportion of events with a duration longer than 7 h generally exceeds 4% in ST and TM climate zones, and the frequency of heavy precipitation events is often more than seven per year.

Author Contributions

Conceptualization, Z.Z., C.P. and X.L.; methodology, Z.Z. and C.P.; software, Z.Z. and R.Z.; validation, Z.Z., X.D. and B.J.; formal analysis, Z.Z. and C.P.; resources, Z.Z., J.C. and R.Z.; writing—original draft preparation, C.P., J.C. and R.Z.; writing—review and editing, Z.Z., X.L. and X.D.; supervision, Z.Z.; project administration, Z.Z.; funding acquisition, Z.Z. and X.L. All authors have read and agreed to the published version of the manuscript.

Funding

This research was funded by the Natural Science Foundation of Guangdong Province (2024A1515012440), National Natural Science Foundation of China (52009021), Scientific Research Starting Foundation of Huizhou University for PhD and Prof. (2023JB006), and GuangDong Basic and Applied Basic Research Foundation (2022A1515110589).

Data Availability Statement

The data adopted in the study are included in the article; further inquiries can be directed to the corresponding author.

Acknowledgments

We thank the editor and anonymous reviewers for their time and good advice.

Conflicts of Interest

The authors declare no conflicts of interest.

References

  1. He, H.; Wang, J.; Ding, J.; Wang, L. Spatial Downscaling of Precipitation Data in Arid Regions Based on the XGBoost-MGWR Model: A Case Study of the Turpan–Hami Region. Land 2024, 13, 448. [Google Scholar] [CrossRef]
  2. Bevacqua, E.; Zappa, G.; Lehner, F.; Zscheischler, J. Precipitation trends determine future occurrences of compound hot–dry events. Nat. Clim. Chang. 2022, 12, 350–355. [Google Scholar] [CrossRef]
  3. Zhu, Z.; Cai, Y.; Dai, X.; Bai, X.; Yang, Y.; Li, X.; Yang, Z. Spatiotemporally contiguous precipitation events across China: Role of atmospheric rivers and tropical cyclones in heavy precipitation. Ecol. Indic. 2024, 158, 111426. [Google Scholar] [CrossRef]
  4. So, B.-J.; Kim, H.-S.; Kwon, H.-H. Spatial pattern of bias in areal rainfall estimations and its impact on hydrological modeling: A comparative analysis of estimating areal rainfall based on radar and weather station networks in South Korea. Stoch. Environ. Res. Risk Assess. 2024, 38, 1–17. [Google Scholar] [CrossRef]
  5. Ballarin, A.S.; Wendland, E.; Zaerpour, M.; Hatami, S.; Neto, A.A.M.; Papalexiou, S.M. Frequency Rather Than Intensity Drives Projected Changes of Rainfall Events in Brazil. Earth’s Future 2024, 12, e2023EF004053. [Google Scholar] [CrossRef]
  6. Wang, X.; Jiang, W.; Wu, J.; Hou, P.; Dai, Z.; Rao, P.; Ling, Z.; Deng, Y. Extreme hourly precipitation characteristics of Mainland China from 1980 to 2019. Int. J. Climatol. 2023, 43, 2989–3004. [Google Scholar] [CrossRef]
  7. Burn, D.H.; Whitfield, P.H. Climate related changes to flood regimes show an increasing rainfall influence. J. Hydrol. 2023, 617, 129075. [Google Scholar] [CrossRef]
  8. Eini, M.R.; Rahmati, A.; Salmani, H.; Brocca, L.; Piniewski, M. Detecting characteristics of extreme precipitation events using regional and satellite-based precipitation gridded datasets over a region in Central Europe. Sci. Total. Environ. 2022, 852, 158497. [Google Scholar] [CrossRef] [PubMed]
  9. Wang, X.; Luo, M.; Wu, S.; Ning, G.; Liu, Z.; Wang, S.; Wang, P.; Zhang, H.; Li, X. Spatiotemporal Evolution Patterns of Contiguous Extreme Precipitation Events Across China From a 3D Perspective. Geophys. Res. Lett. 2022, 49, e2022GL098840. [Google Scholar] [CrossRef]
  10. Mondal, S.; Mishra, A.K.; Leung, L.R. Spatiotemporal Characteristics and Propagation of Summer Extreme Precipitation Events Over United States: A Complex Network Analysis. Geophys. Res. Lett. 2020, 47, e2020GL088185. [Google Scholar] [CrossRef]
  11. Wang, H.; Liu, J.; Klaar, M.; Chen, A.; Gudmundsson, L.; Holden, J. Anthropogenic climate change has influenced global river flow seasonality. Science 2024, 383, 1009–1014. [Google Scholar] [CrossRef] [PubMed]
  12. Trenberth, K.E.; Dai, A.; Rasmussen, R.M.; Parsons, D.B. The Changing Character of Precipitation. Bull. Am. Meteorol. Soc. 2003, 84, 1205–1218. [Google Scholar] [CrossRef]
  13. Christidis, N.; Stott, P.A. Human Influence on Seasonal Precipitation in Europe. J. Clim. 2022, 35, 5215–5231. [Google Scholar] [CrossRef]
  14. Armon, M.; Marra, F.; Enzel, Y.; Rostkier-Edelstein, D.; Garfinkel, C.I.; Adam, O.; Dayan, U.; Morin, E. Reduced Rainfall in Future Heavy Precipitation Events Related to Contracted Rain Area Despite Increased Rain Rate. Earth’s Future 2021, 10, e2021EF002397. [Google Scholar] [CrossRef]
  15. Sun, S.; Shi, P.; Zhang, Q.; Wang, J.; Wu, J.; Chen, D. Evolution of future precipitation extremes: Viewpoint of climate change classification. Int. J. Climatol. 2021, 42, 1220–1230. [Google Scholar] [CrossRef]
  16. Yu, X.; Gu, X.; Kong, D.; Zhang, Q.; Cao, Q.; Slater, L.J.; Ren, G.; Luo, M.; Li, J.; Liu, J.; et al. Asymmetrical Shift Toward Less Light and More Heavy Precipitation in an Urban Agglomeration of East China: Intensification by Urbanization. Geophys. Res. Lett. 2022, 49, e2021GL097046. [Google Scholar] [CrossRef]
  17. Wei, L.; Gu, X.; Slater, L.J.; Lai, Y.; Kong, D.; Liu, J.; Li, J.; Zhang, X. Heavier Precipitation in Response to Longer-Lasting Tropical Cyclones and Rapid Urbanization over the Yangtze River Delta of Eastern China. J. Clim. 2024, 37, 403–418. [Google Scholar] [CrossRef]
  18. Gao, L.; Huang, J.; Chen, X.; Chen, Y.; Liu, M. Contributions of natural climate changes and human activities to the trend of extreme precipitation. Atmos. Res. 2018, 205, 60–69. [Google Scholar]
  19. Thackeray, C.W.; Hall, A.; Norris, J.; Chen, D. Constraining the increased frequency of global precipitation extremes under warming. Nat. Clim. Chang. 2022, 12, 441–448. [Google Scholar] [CrossRef]
  20. Gu, G.; Adler, R.F. Observed variability and trends in global precipitation during 1979–2020. Clim. Dyn. 2023, 61, 131–150. [Google Scholar] [CrossRef]
  21. Swain, S.S.; Kumar, S.B.; Mishra, A.; Chatterjee, C. Sensitive or resilient catchment?: A Budyko-based modeling approach for climate change and anthropogenic stress under historical to CMIP6 future scenarios. J. Hydrol. 2023, 622, 129651. [Google Scholar] [CrossRef]
  22. Xiao, C.; Wu, P.; Zhang, L.; Clark, R.T. Increasing Flash Floods in a Drying Climate over Southwest China. Adv. Atmospheric Sci. 2018, 35, 1094–1099. [Google Scholar] [CrossRef]
  23. Morrison, A.; Villarini, G.; Zhang, W.; Scoccimarro, E. Projected changes in extreme precipitation at sub-daily and daily time scales. Glob. Planet. Chang. 2019, 182, 103004. [Google Scholar] [CrossRef]
  24. Delgado-Torres, C.; Donat, M.; Soret, A.; Gonzalez-Reviriego, N.; Bretonnière, P.-A.; Ho, A.-C.; Pérez-Zanón, N.; Samsó, M.; Doblas-Reyes, F.J. Multi-annual predictions of the frequency and intensity of daily temperature and precipitation extremes. Environ. Res. Lett. 2023, 18, 034031. [Google Scholar] [CrossRef]
  25. Kömüşcü, A.; Aksoy, M. Long-term spatio-temporal trends and periodicities in monthly and seasonal precipitation in Turkey. Theor. Appl. Climatol. 2023, 151, 1623–1649. [Google Scholar] [CrossRef]
  26. Skok, G.; Bacmeister, J.; Tribbia, J. Analysis of Tropical Cyclone Precipitation Using an Object-Based Algorithm. J. Clim. 2013, 26, 2563–2579. [Google Scholar] [CrossRef]
  27. Zhu, Z.; Wright, D.B.; Yu, G. The Impact of Rainfall Space-Time Structure in Flood Frequency Analysis. Water Resour. Res. 2018, 54, 8983–8998. [Google Scholar] [CrossRef]
  28. Huang, C.; Zhang, S.; Dong, L.; Wang, Z.; Li, L.; Cui, L. Spatial and temporal variabilities of rainstorms over China under climate change. J. Geogr. Sci. 2021, 31, 479–496. [Google Scholar] [CrossRef]
  29. Guo, B.; Xu, T.; Yang, Q.; Zhang, J.; Dai, Z.; Deng, Y.; Zou, J. Multiple Spatial and Temporal Scales Evaluation of Eight Satellite Precipitation Products in a Mountainous Catchment of South China. Remote Sens. 2023, 15, 1373. [Google Scholar] [CrossRef]
  30. Wei, W.; Zou, S.; Duan, W.; Chen, Y.; Li, S.; Zhou, Y. Spatiotemporal variability in extreme precipitation and associated large-scale climate mechanisms in Central Asia from 1950 to 2019. J. Hydrol. 2023, 620, 129417. [Google Scholar] [CrossRef]
  31. Chen, Z.; Yin, L.; Chen, X.; Wei, S.; Zhu, Z. Research on the characteristics of urban rainstorm pattern in the humid area of Southern China: A case study of Guangzhou City. Int. J. Climatol. 2015, 35, 4370–4386. [Google Scholar] [CrossRef]
  32. Kukulies, J.; Chen, D.; Wang, M. Temporal and spatial variations of convection and precipitation over the Tibetan Plateau based on recent satellite observations. Part I: Cloud climatology derived from CloudSat and CALIPSO. Int. J. Climatol. 2019, 39, 5396–5412. [Google Scholar] [CrossRef]
  33. Baig, F.; Abrar, M.; Chen, H.; Sherif, M. Evaluation of Precipitation Estimates from Remote Sensing and Artificial Neural Network Based Products (PERSIANN) Family in an Arid Region. Remote Sens. 2023, 15, 1078. [Google Scholar] [CrossRef]
  34. Valencia, S.; Marín, D.E.; Gómez, D.; Hoyos, N.; Salazar, J.F.; Villegas, J.C. Spatio-temporal assessment of Gridded precipitation products across topographic and climatic gradients in Colombia. Atmospheric Res. 2023, 285, 106643. [Google Scholar] [CrossRef]
  35. Zhou, Z.; Lu, D.; Yong, B.; Shen, Z.; Wu, H.; Yu, L. Evaluation of GPM-IMERG Precipitation Product at Multiple Spatial and Sub-Daily Temporal Scales over Mainland China. Remote Sens. 2023, 15, 1237. [Google Scholar] [CrossRef]
  36. Zhang, X.; Song, Y.; Nam, W.-H.; Huang, T.; Gu, X.; Zeng, J.; Huang, S.; Chen, N.; Yan, Z.; Niyogi, D. Data fusion of satellite imagery and downscaling for generating highly fine-scale precipitation. J. Hydrol. 2024, 631, 130665. [Google Scholar] [CrossRef]
  37. Chen, M.; Nabih, S.; Brauer, N.S.; Gao, S.; Gourley, J.J.; Hong, Z.; Kolar, R.L.; Hong, Y. Can Remote Sensing Technologies Capture the Extreme Precipitation Event and Its Cascading Hydrological Response? A Case Study of Hurricane Harvey Using EF5 Modeling Framework. Remote Sens. 2020, 12, 445. [Google Scholar] [CrossRef]
  38. Roversi, G.; Pancaldi, M.; Cossich, W.; Corradini, D.; Nguyen, T.T.N.; Nguyen, T.V.; Porcu’, F. The Extreme Rainfall Events of the 2020 Typhoon Season in Vietnam as Seen by Seven Different Precipitation Products. Remote Sens. 2024, 16, 805. [Google Scholar] [CrossRef]
  39. Mazza, E.; Chen, S. Tropical Cyclone Rainfall Climatology, Extremes, and Flooding Potential from Remote Sensing and Reanalysis Datasets over the Continental United States. J. Hydrometeorol. 2023, 24, 1549–1562. [Google Scholar] [CrossRef]
  40. Li, R.; Guilloteau, C.; Kirstetter, P.; Foufoula-Georgiou, E. A New Event-Based Error Decomposition Scheme for Satellite Precipitation Products. Geophys. Res. Lett. 2023, 50, e2023GL105343. [Google Scholar] [CrossRef]
  41. Pang, Z.; Zhang, Y.; Shi, C.; Gu, J.; Yang, Q.; Pan, Y.; Wang, Z.; Xu, B. A Comprehensive Assessment of Multiple High-Resolution Precipitation Grid Products for Monitoring Heavy Rainfall during the “7.20” Extreme Rainstorm Event in China. Remote Sens. 2023, 15, 5255. [Google Scholar] [CrossRef]
  42. Alexander, L.V.; Bador, M.; Roca, R.; Contractor, S.; Donat, M.G.; Nguyen, P.L. Intercomparison of annual precipitation indices and extremes over global land areas from in situ, space-based and reanalysis products. Environ. Res. Lett. 2020, 15, 055002. [Google Scholar] [CrossRef]
  43. Sun, Q.; Zhang, X.; Zwiers, F.; Westra, S.; Alexander, L.V. A Global, Continental, and Regional Analysis of Changes in Extreme Precipitation. J. Clim. 2021, 34, 243–258. [Google Scholar] [CrossRef]
  44. Li, R.; Wang, K.; Qi, D. Event-Based Evaluation of the GPM Multisatellite Merged Precipitation Product From 2014 to 2018 Over China: Methods and Results. J. Geophys. Res. Atmos. 2021, 126, e2020JD033692. [Google Scholar] [CrossRef]
  45. Wang, T.; Li, Z.; Ma, Z.; Gao, Z.; Tang, G. Diverging identifications of extreme precipitation events from satellite observations and reanalysis products: A global perspective based on an object-tracking method. Remote Sens. Environ. 2023, 288, 113490. [Google Scholar] [CrossRef]
  46. Davis, C.; Brown, B.; Bullock, R. Object-Based Verification of Precipitation Forecasts. Part I: Methodology and Application to Mesoscale Rain Areas. Mon. Weather. Rev. 2006, 134, 1772–1784. [Google Scholar] [CrossRef]
  47. Feng, Z.; Leung, L.R.; Houze, R.A.; Hagos, S.; Hardin, J.; Yang, Q.; Han, B.; Fan, J. Structure and Evolution of Mesoscale Convective Systems: Sensitivity to Cloud Microphysics in Convection-Permitting Simulations Over the United States. J. Adv. Model. Earth Syst. 2018, 10, 1470–1494. [Google Scholar] [CrossRef]
  48. Jiang, H.; Zipser, E.J. Contribution of Tropical Cyclones to the Global Precipitation from Eight Seasons of TRMM Data: Regional, Seasonal, and Interannual Variations. J. Clim. 2010, 23, 1526–1543. [Google Scholar] [CrossRef]
  49. Lau, W.K.M.; Zhou, Y.P. Observed recent trends in tropical cyclone rainfall over the North Atlantic and the North Pacific. J. Geophys. Res. Atmos. 2012, 117, D03104. [Google Scholar] [CrossRef]
  50. Song, Y.; Achberger, C.; Linderholm, H.W. Rain-season trends in precipitation and their effect in different climate regions of China during 1961–2008. Environ. Res. Lett. 2011, 6, 034025. [Google Scholar] [CrossRef]
  51. Xu, C.; Chen, Z.; Zhu, Z. Spatiotemporal patterns and evolution of heavy rainfall trajectories in China. Int. J. Climatol. 2022, 42, 8632–8651. [Google Scholar] [CrossRef]
  52. Shen, Y.; Zhao, P.; Pan, Y.; Yu, J. A high spatiotemporal gauge-satellite merged precipitation analysis over China. J. Geophys. Res. Atmos. 2014, 119, 3063–3075. [Google Scholar] [CrossRef]
  53. Tang, S.; Li, R.; He, J.; Wang, H.; Fan, X.; Yao, S. Comparative Evaluation of the GPM IMERG Early, Late, and Final Hourly Precipitation Products Using the CMPA Data over Sichuan Basin of China. Water 2020, 12, 554. [Google Scholar] [CrossRef]
  54. Chen, T.; Li, J.; Zhang, Y.; Chen, H.; Li, P.; Che, H. Evaluation of Hourly Precipitation Characteristics from a Global Reanalysis and Variable-Resolution Global Model over the Tibetan Plateau by Using a Satellite-Gauge Merged Rainfall Product. Remote Sens. 2023, 15, 1013. [Google Scholar] [CrossRef]
  55. Zhang, G.; Zhang, X.; Yang, Z. Effect of Horizontal Resolution on a Meso-β-Scale Vortex Simulation in an Extreme Rainstorm on 22 May 2020 Over South China: A Contrastive Study Based on Different-Resolution Ensembles. Earth Space Sci. 2024, 11, e2023EA002921. [Google Scholar] [CrossRef]
  56. Gao, Z.; Huang, B.; Ma, Z.; Chen, X.; Qiu, J.; Liu, D. Comprehensive Comparisons of State-of-the-Art Gridded Precipitation Estimates for Hydrological Applications over Southern China. Remote Sens. 2020, 12, 3997. [Google Scholar] [CrossRef]
  57. Jiang, S.; Liu, R.; Ren, L.; Wang, M.; Shi, J.; Zhong, F.; Duan, Z. Evaluation and Hydrological Application of CMADS Reanalysis Precipitation Data against Four Satellite Precipitation Products in the Upper Huaihe River Basin, China. J. Meteorol. Res. 2020, 34, 1096–1113. [Google Scholar] [CrossRef]
  58. Sun, R.; Yuan, H.; Liu, X.; Jiang, X. Evaluation of the latest satellite–gauge precipitation products and their hydrologic applications over the Huaihe River basin. J. Hydrol. 2016, 536, 302–319. [Google Scholar] [CrossRef]
  59. White, R.H.; Battisti, D.S.; Skok, G. Tracking precipitation events in time and space in gridded observational data. Geophys. Res. Lett. 2017, 44, 8637–8646. [Google Scholar] [CrossRef]
  60. Wu, X.; Guo, S.; Yin, J.; Yang, G.; Zhong, Y.; Liu, D. On the event-based extreme precipitation across China: Time distribution patterns, trends, and return levels. J. Hydrol. 2018, 562, 305–317. [Google Scholar] [CrossRef]
  61. Li, X.; Zhang, K.; Bao, H.; Zhang, H. Climatology and changes in hourly precipitation extremes over China during 1970–2018. Sci. Total. Environ. 2022, 839, 156297. [Google Scholar] [CrossRef] [PubMed]
Figure 1. Identifying objects at the same interval. (a) Finding the different core objects and identifying the corresponding extended area based on the cascading thresholds in the precipitation rate. (b) Identifying the areas with precipitation rate above the lowest threshold. (c) Identifying the core object. (d) Growth of the object, and finding the new object. (e) Identifying the spatial boundaries of different objects.
Water 16 02345 g001
Figure 2. Determining the objects of the same precipitation event forward in time. In the figure, the grey areas represent precipitation objects at different time intervals. Event A and Event B represent different precipitation events.
Water 16 02345 g002
Figure 3. (a) The spatial distribution of China’s topography and climate zones (PM: plateau mountain climate, TC: temperate continental climate, TM: temperate monsoon climate, ST: subtropical and tropical monsoon climate). (b) The spatial distribution of the average annual precipitation.
Water 16 02345 g003
Figure 4. The average characteristics of precipitation events.
Water 16 02345 g004
Figure 5. The spatial distribution of Pearson correlation coefficients.
Water 16 02345 g005
Figure 6. Percentage of all precipitation events at each grid in different durations (note changes in color scale for each plot).
Water 16 02345 g006
Figure 7. Heavy precipitation events at each grid in different durations (note changes in color scale for each plot).
Water 16 02345 g007
Disclaimer/Publisher’s Note: The statements, opinions and data contained in all publications are solely those of the individual author(s) and contributor(s) and not of MDPI and/or the editor(s). MDPI and/or the editor(s) disclaim responsibility for any injury to people or property resulting from any ideas, methods, instructions or products referred to in the content.

