Author Contributions
Conceptualization, H.L.; methodology, H.L.; software, Y.T.; validation, Y.T. and W.W.; formal analysis, Y.T. and W.W.; investigation, Y.W.; resources, B.Z.; data curation, Y.T. and W.W.; writing—original draft preparation, Y.T.; writing—review and editing, H.L.; visualization, H.L.; supervision, H.L.; project administration, H.L.; funding acquisition, B.Z. All authors have read and agreed to the published version of the manuscript.
Figure 1.
COD value and COD removal efficiency at different PAC doses.
Figure 1.
COD value and COD removal efficiency at different PAC doses.
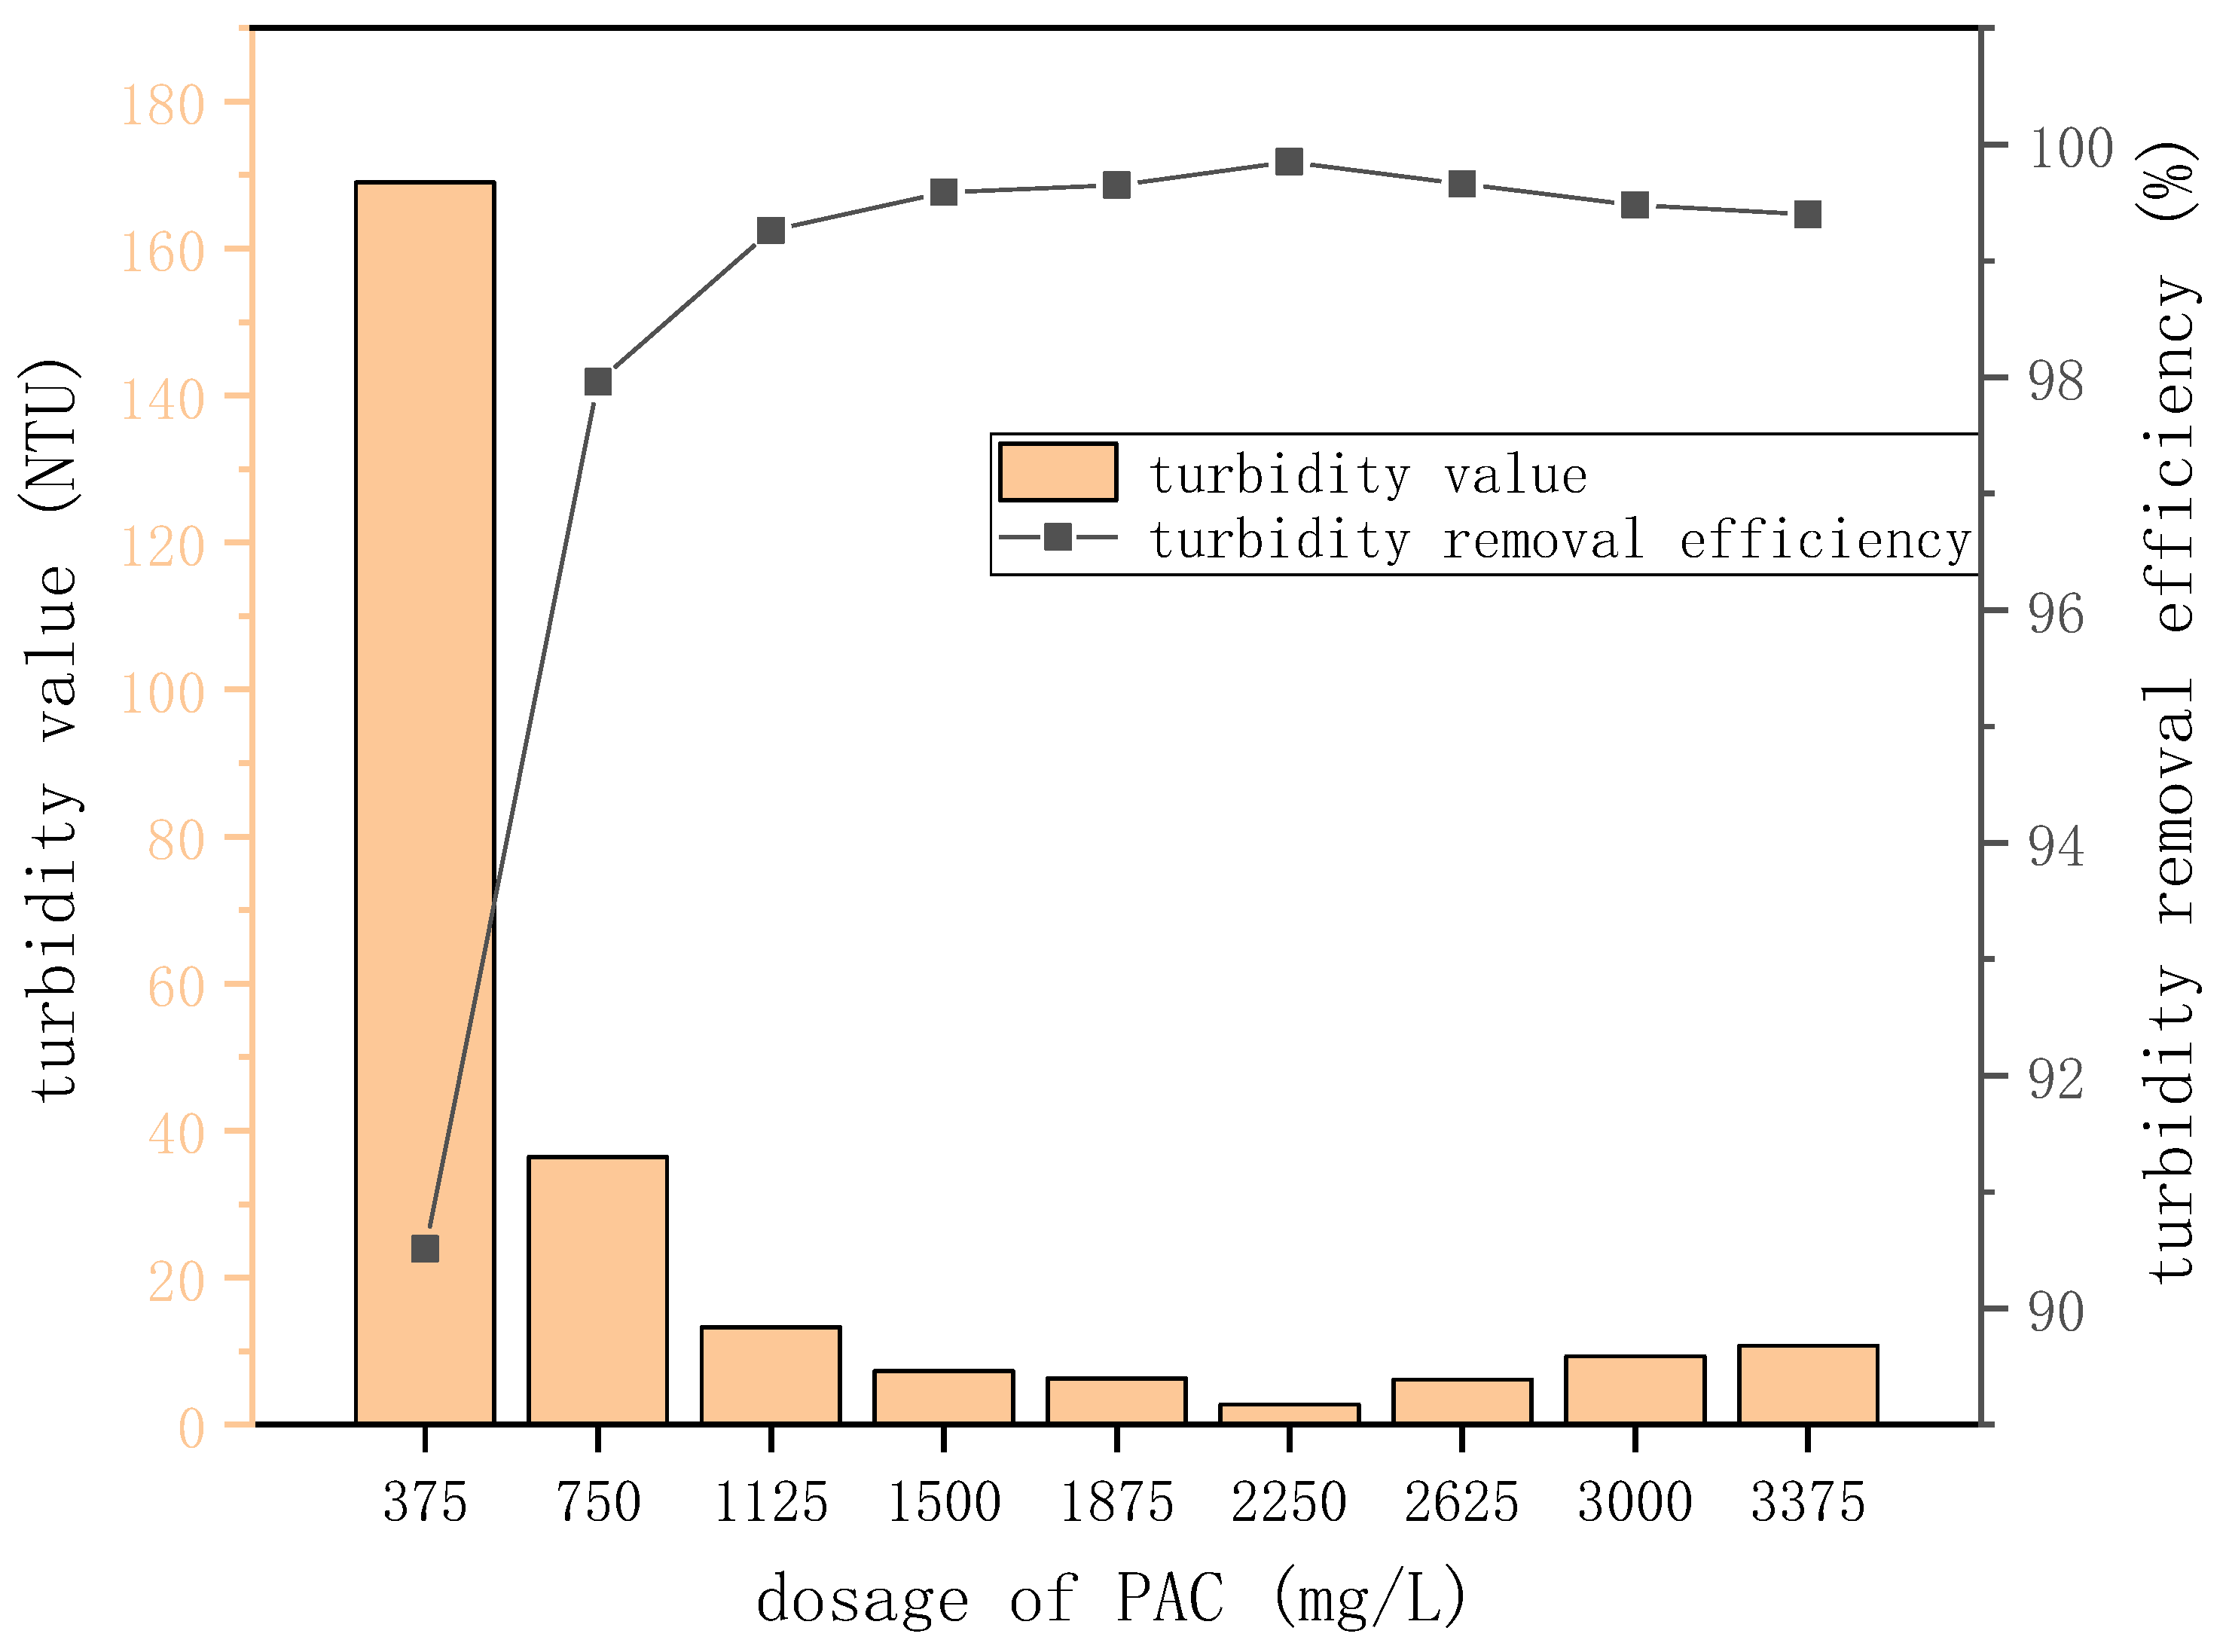
Figure 2.
Turbidity value and turbidity removal efficiencies at different PAC doses.
Figure 2.
Turbidity value and turbidity removal efficiencies at different PAC doses.
Figure 3.
Comparison of different settling times for a PAC dosing of 2250 mg/L.
Figure 3.
Comparison of different settling times for a PAC dosing of 2250 mg/L.
Figure 4.
COD value and COD removal efficiency at different PFC doses.
Figure 4.
COD value and COD removal efficiency at different PFC doses.
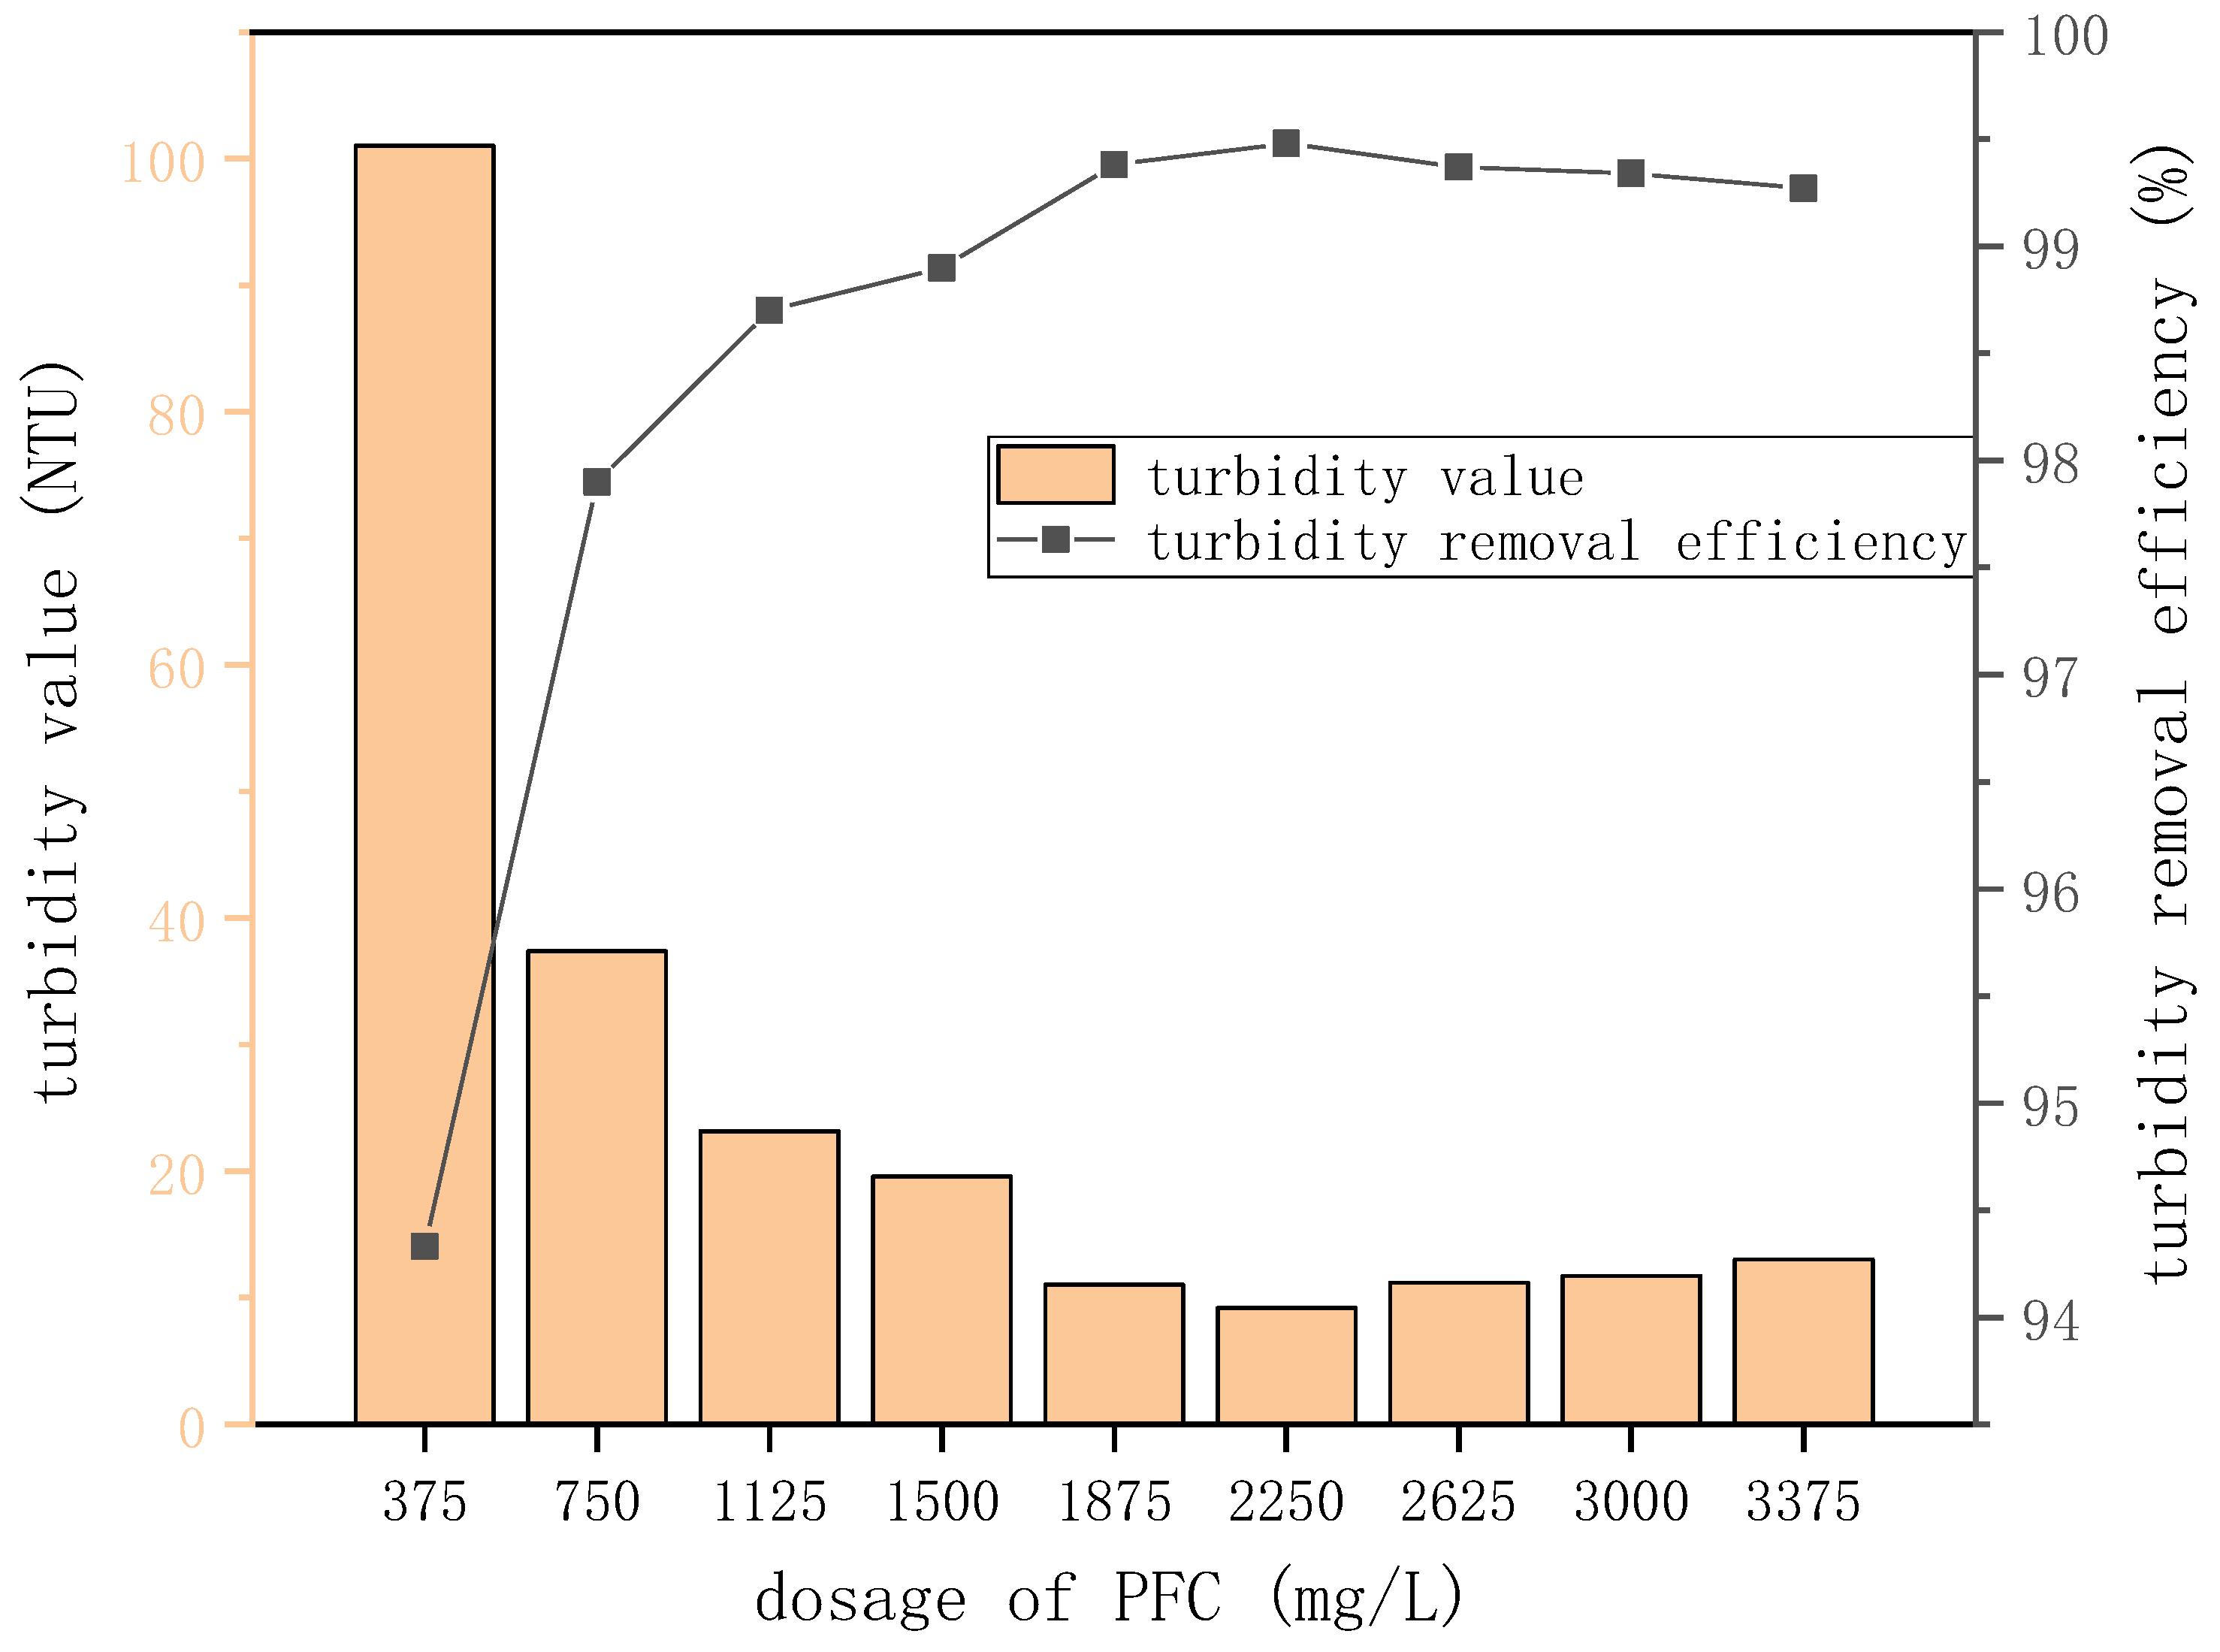
Figure 5.
Turbidity value and turbidity removal efficiency at different PFC doses.
Figure 5.
Turbidity value and turbidity removal efficiency at different PFC doses.
Figure 6.
Comparison of different settling times for 2250 mg/L PFC.
Figure 6.
Comparison of different settling times for 2250 mg/L PFC.
Figure 7.
COD value and COD removal efficiency at different PSAF doses.
Figure 7.
COD value and COD removal efficiency at different PSAF doses.
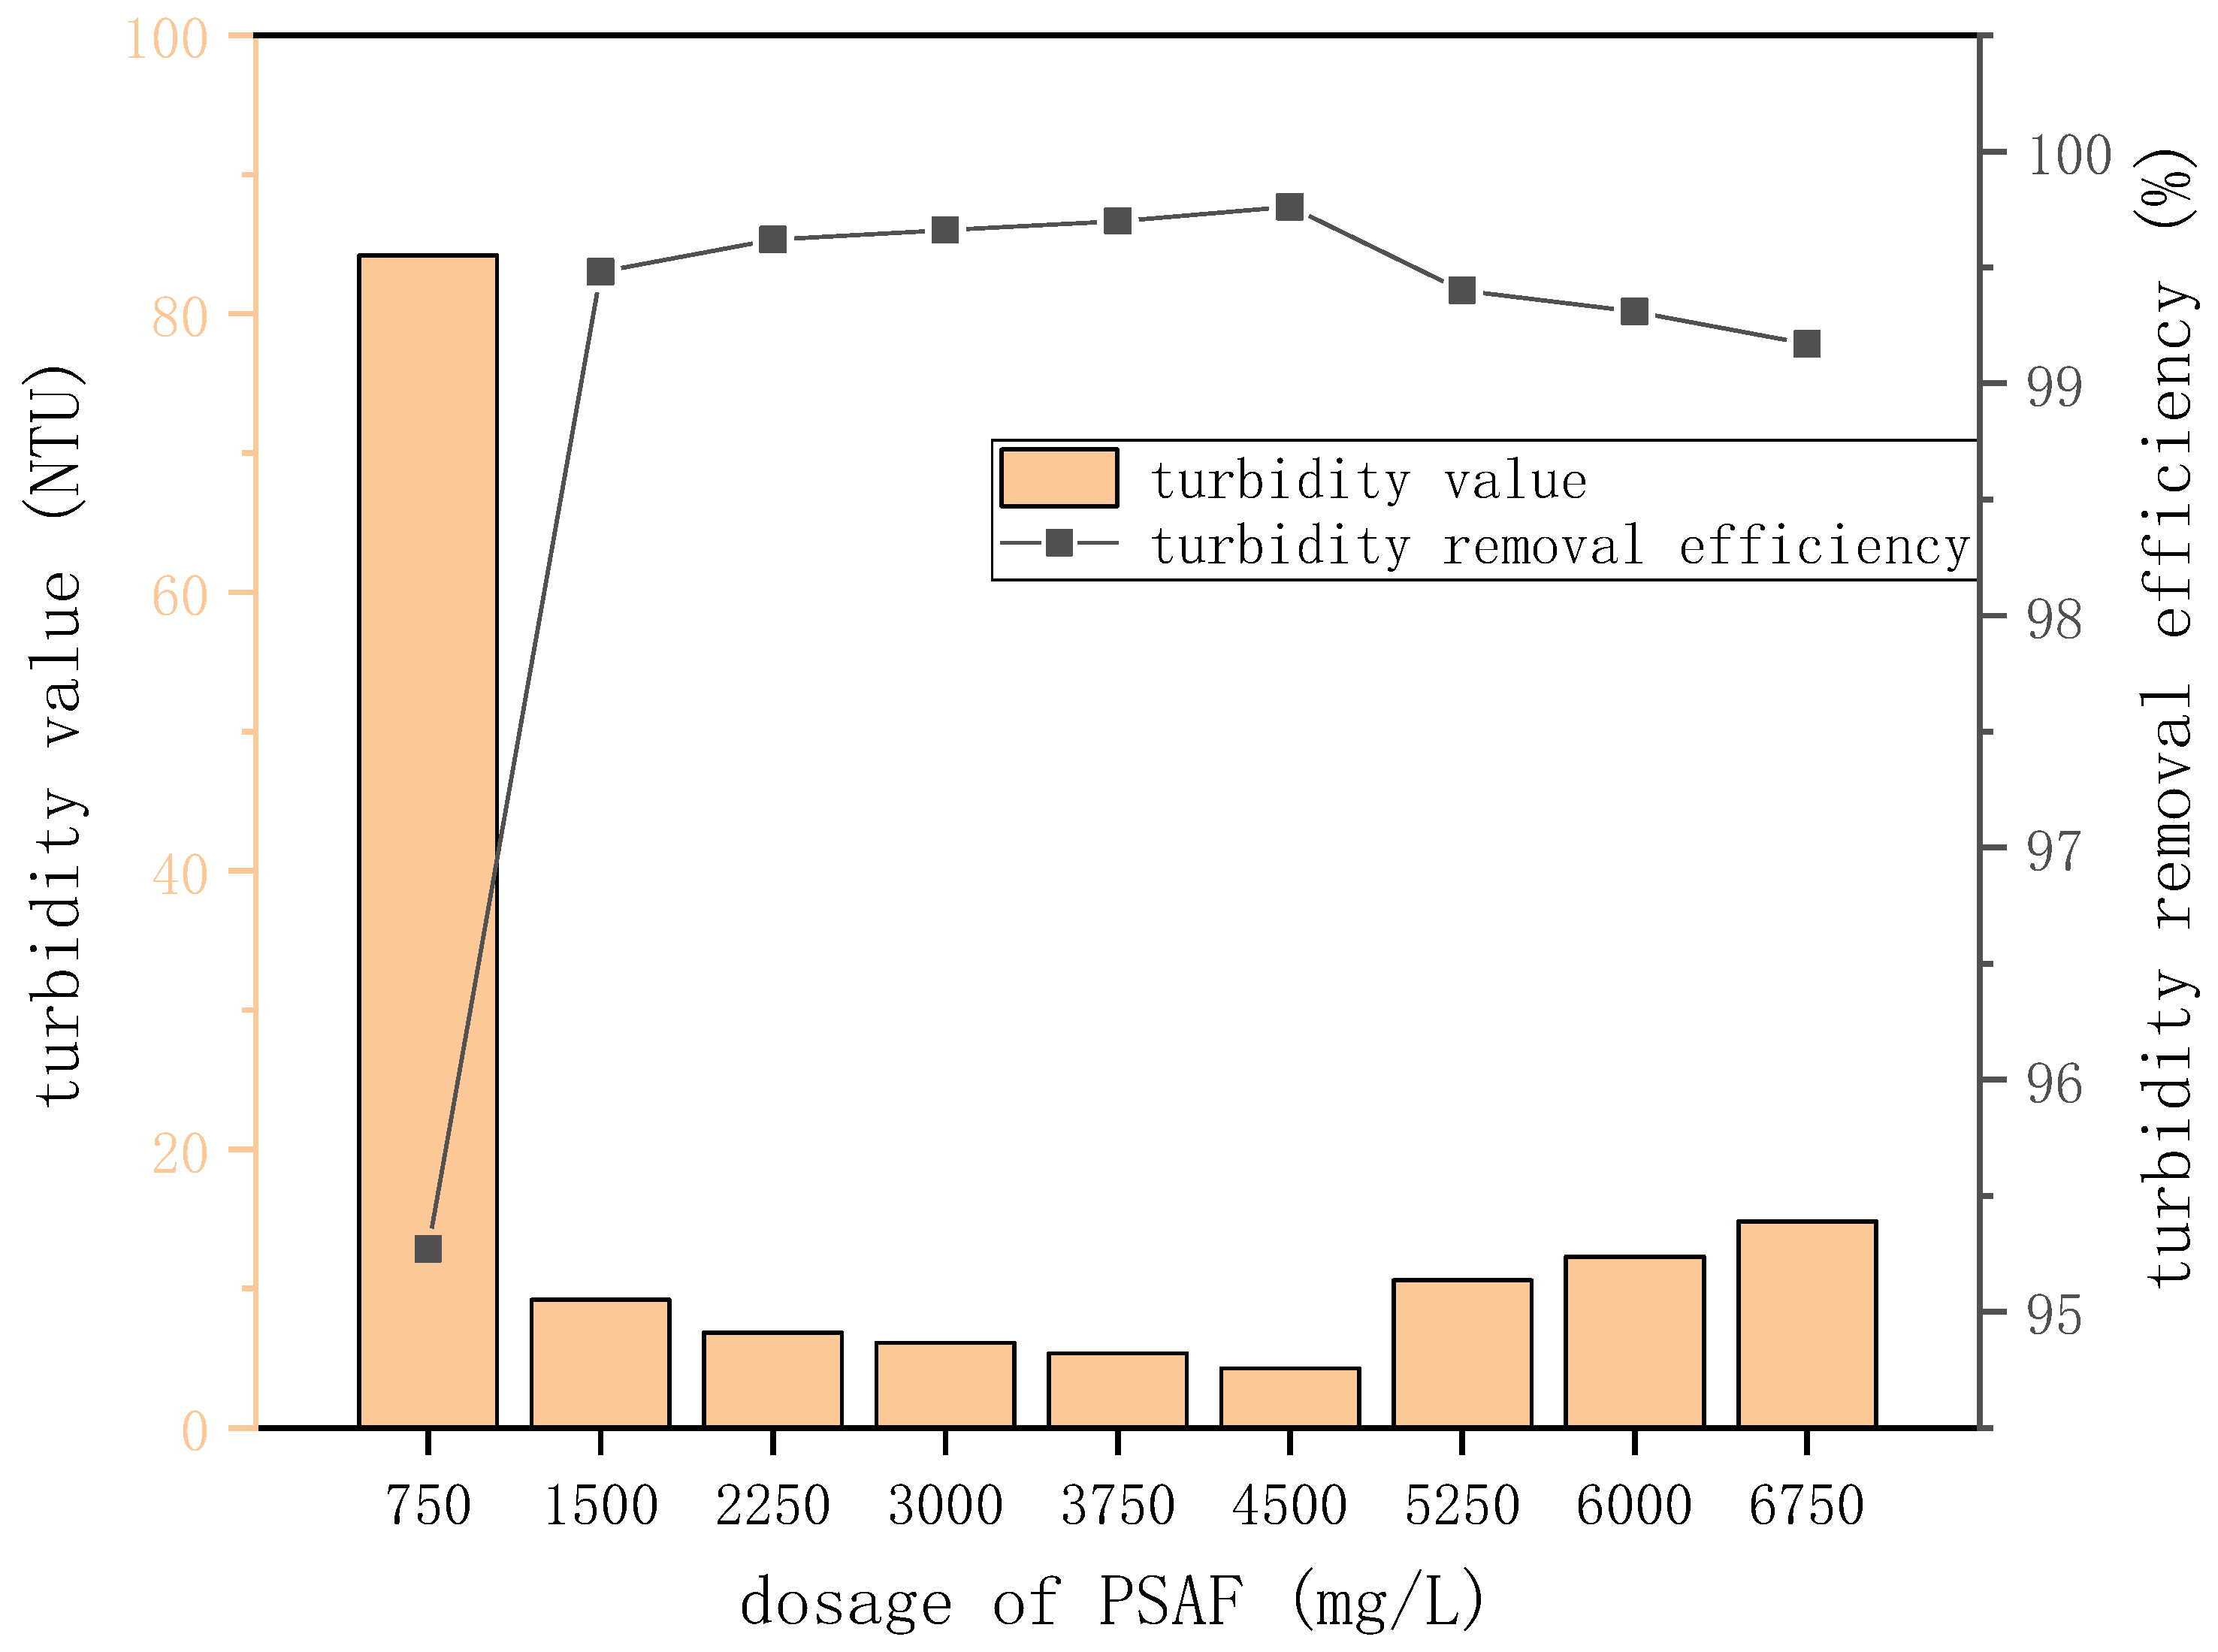
Figure 8.
Turbidity value and turbidity removal efficiency at different PSAF doses.
Figure 8.
Turbidity value and turbidity removal efficiency at different PSAF doses.
Figure 9.
Comparison of different settling times for 4500 mg/L PSAF.
Figure 9.
Comparison of different settling times for 4500 mg/L PSAF.
Figure 10.
Precipitation effect of APAM at different doses after 2 h.
Figure 10.
Precipitation effect of APAM at different doses after 2 h.
Figure 11.
Precipitation effect of CPAM at different doses after 2 h.
Figure 11.
Precipitation effect of CPAM at different doses after 2 h.
Figure 12.
Precipitation effect of NPAM at different doses after 2 h.
Figure 12.
Precipitation effect of NPAM at different doses after 2 h.
Figure 13.
COD value and COD removal efficiency at different APAM doses.
Figure 13.
COD value and COD removal efficiency at different APAM doses.
Figure 14.
Turbidity value and turbidity removal efficiency at different APAM doses.
Figure 14.
Turbidity value and turbidity removal efficiency at different APAM doses.
Figure 15.
Comparison of different settling times for 2250 mg/L PFC and 5 mg/L APAM.
Figure 15.
Comparison of different settling times for 2250 mg/L PFC and 5 mg/L APAM.
Figure 16.
COD value and COD removal efficiency at different CPAM doses.
Figure 16.
COD value and COD removal efficiency at different CPAM doses.
Figure 17.
Turbidity value and turbidity removal efficiency at different CPAM doses.
Figure 17.
Turbidity value and turbidity removal efficiency at different CPAM doses.
Figure 18.
Comparison of different settling times for 2250 mg/L PFC and 7.5 mg/L CPAM.
Figure 18.
Comparison of different settling times for 2250 mg/L PFC and 7.5 mg/L CPAM.
Figure 19.
COD value and COD removal efficiency at different NPAM doses.
Figure 19.
COD value and COD removal efficiency at different NPAM doses.
Figure 20.
Turbidity value and turbidity removal efficiency at different NPAM doses.
Figure 20.
Turbidity value and turbidity removal efficiency at different NPAM doses.
Figure 21.
Comparison of different settling times for 2250 mg/L PFC and 12.5 mg/L NPAM.
Figure 21.
Comparison of different settling times for 2250 mg/L PFC and 12.5 mg/L NPAM.
Table 1.
Experimental reagents and chemicals.
Table 1.
Experimental reagents and chemicals.
| Chemicals | Specifications | Purity | Manufacturer |
|---|
| PAC | Industrial Grade | 30% | China National Pharmaceutical Group Corporation Chemical Reagent Company Limited, Shanghai, China |
| PFC | Industrial Grade | 30% | China National Pharmaceutical Group Corporation Chemical Reagent Company Limited, Shanghai, China |
| PSAF | Industrial Grade | 30% | China National Pharmaceutical Group Corporation Chemical Reagent Company Limited, Shanghai, China |
| PAM | Industrial Grade | 99% | China National Pharmaceutical Group Corporation Chemical Reagent Company Limited, Shanghai, China |
| COD Testing Reagent | HR 20~1500 mg/L | - | HACH, Nanjing, China |
| NaOH | Analytical Grade | 99.9% | Chengdu Kelong Chemical Reagent Factory, Chengdu, China |
| Distilled Water | Grade One | - | Laboratory Preparation, Nanjing, China |
Table 2.
Water quality indicators for emulsified wastewater.
Table 2.
Water quality indicators for emulsified wastewater.
| Water Quality Indicators | Numerical Value |
|---|
| COD (mg/L) | 7060 |
| NH4+-N (mg/L) | 300 |
| Turbidity (NTU) | 1780 |
Table 3.
Experimental equipment.
Table 3.
Experimental equipment.
| Experimental Name | Model | Manufacturer |
|---|
| Analytical Balance | EX2242H | OHAUS, Nanjing, China |
| Laboratory Ultra-pure Water System | Plus-E3 TS | Nanjing Pudi Technology Development, Nanjing, China |
| Electric Stirrer | JJ-3 Six-Position Electric Stirrer | Jiangsu Jinyi Instrument Technology, Changzhou, China |
| Digestion Apparatus | DRB200 | HACH, Nanjing, China |
| Portable Visible Spectrophotometer | DRB1900-05C | Shanghai Surl Instrument, Shanghai, China |
| pH Meter | Leici PHS-3C | Shanghai Yidian Scientific Instrument, Shanghai, China |
| Nephelometer | 2100Q | HACH, Nanjing, China |
| Pipette | TOPAID800230 | Zhejiang Top Medical Equipment, Zhejiang, China |
| Pipette | NK6010329 | NuoKe Biology, Shanghai, China |
Table 4.
COD value and COD removal efficiency at different PAC doses.
Table 4.
COD value and COD removal efficiency at different PAC doses.
| Dose (mg/L) | COD Value (mg/L) | COD Removal Efficiency (%) |
|---|
| 375 | 1930 | 72.66 |
| 750 | 1810 | 74.36 |
| 1125 | 1760 | 75.07 |
| 1500 | 1690 | 76.06 |
| 1875 | 1600 | 77.34 |
| 2250 | 1510 | 78.61 |
| 2625 | 1790 | 74.65 |
| 3000 | 1980 | 71.95 |
| 3375 | 2320 | 67.14 |
Table 5.
Turbidity value and turbidity removal efficiency at different PAC doses.
Table 5.
Turbidity value and turbidity removal efficiency at different PAC doses.
| Dose (mg/L) | Turbidity Value (NTU) | Turbidity Removal Efficiency (%) |
|---|
| 375 | 169 | 90.51 |
| 750 | 36.4 | 97.96 |
| 1125 | 13.26 | 99.26 |
| 1500 | 7.28 | 99.59 |
| 1875 | 6.28 | 99.65 |
| 2250 | 2.72 | 99.85 |
| 2625 | 6.12 | 99.66 |
| 3000 | 9.31 | 99.48 |
| 3375 | 10.75 | 99.40 |
Table 6.
COD value and COD removal efficiency at different PFC doses.
Table 6.
COD value and COD removal efficiency at different PFC doses.
| Dose (mg/L) | COD Value (mg/L) | COD Removal Efficiency (%) |
|---|
| 375 | 2100 | 70.25 |
| 750 | 2070 | 70.68 |
| 1125 | 1950 | 72.38 |
| 1500 | 1710 | 75.78 |
| 1875 | 1290 | 81.73 |
| 2250 | 840 | 88.10 |
| 2625 | 1480 | 79.04 |
| 3000 | 1860 | 73.65 |
| 3375 | 2370 | 66.43 |
Table 7.
Turbidity value and turbidity removal efficiency at different PFC doses.
Table 7.
Turbidity value and turbidity removal efficiency at different PFC doses.
| Dose (mg/L) | Turbidity Value (NTU) | Turbidity Removal Efficiency (%) |
|---|
| 375 | 101 | 94.33 |
| 750 | 37.38 | 97.9 |
| 1125 | 23.18 | 98.7 |
| 1500 | 19.6 | 98.9 |
| 1875 | 11.05 | 99.38 |
| 2250 | 9.2 | 99.48 |
| 2625 | 11.2 | 99.37 |
| 3000 | 11.72 | 99.34 |
| 3375 | 13.03 | 99.27 |
Table 8.
COD value and COD removal efficiency at different PSAF doses.
Table 8.
COD value and COD removal efficiency at different PSAF doses.
| Dose (mg/L) | COD Value (mg/L) | COD Removal Efficiency (%) |
|---|
| 750 | 2110 | 70.11 |
| 1500 | 2080 | 70.54 |
| 2250 | 1960 | 72.24 |
| 3000 | 1740 | 75.35 |
| 3750 | 1560 | 77.90 |
| 4500 | 1520 | 78.47 |
| 5250 | 2070 | 70.68 |
| 6000 | 2310 | 67.28 |
| 6750 | 2520 | 64.31 |
Table 9.
Turbidity value and turbidity removal efficiency at different PSAF doses.
Table 9.
Turbidity value and turbidity removal efficiency at different PSAF doses.
| Dose (mg/L) | Turbidity Value (NTU) | Turbidity Removal Efficiency (%) |
|---|
| 750 | 84.2 | 95.27 |
| 1500 | 9.2 | 99.48 |
| 2250 | 6.84 | 99.62 |
| 3000 | 6.12 | 99.66 |
| 3750 | 5.35 | 99.7 |
| 4500 | 4.28 | 99.76 |
| 5250 | 10.6 | 99.4 |
| 6000 | 12.31 | 99.31 |
| 6750 | 14.81 | 99.17 |
Table 10.
COD value and COD removal efficiency at different APAM doses.
Table 10.
COD value and COD removal efficiency at different APAM doses.
| Dose (mg/L) | COD Value (mg/L) | COD Removal Efficiency (%) |
|---|
| 1 | 1586 | 77.54 |
| 2 | 1407 | 80.07 |
| 3 | 1260 | 82.15 |
| 4 | 1136 | 83.91 |
| 5 | 1077 | 84.75 |
| 10 | 1062 | 84.96 |
Table 11.
Turbidity value and turbidity removal efficiency at different APAM doses.
Table 11.
Turbidity value and turbidity removal efficiency at different APAM doses.
| Dose (mg/L) | Turbidity Value (NTU) | Turbidity Removal Efficiency (%) |
|---|
| 1 | 32.86 | 98.15 |
| 2 | 9.17 | 99.48 |
| 3 | 5.23 | 99.71 |
| 4 | 3.12 | 99.82 |
| 5 | 2.56 | 99.86 |
| 10 | 2.39 | 99.87 |
Table 12.
COD value and COD removal efficiency at different CPAM doses.
Table 12.
COD value and COD removal efficiency at different CPAM doses.
| Dose (mg/L) | COD Value (mg/L) | COD Removal Efficiency (%) |
|---|
| 1.5 | 2540 | 65.30 |
| 3 | 2260 | 67.99 |
| 4.5 | 2100 | 70.25 |
| 6 | 1970 | 72.10 |
| 7.5 | 1730 | 75.50 |
| 15 | 1720 | 75.64 |
Table 13.
Turbidity value and turbidity removal efficiency at different CPAM doses.
Table 13.
Turbidity value and turbidity removal efficiency at different CPAM doses.
| Dose (mg/L) | Turbidity Value (NTU) | Turbidity Removal Efficiency (%) |
|---|
| 1.5 | 20.90 | 98.83 |
| 3 | 6.15 | 99.65 |
| 4.5 | 4.95 | 99.72 |
| 6 | 3.26 | 99.82 |
| 7.5 | 2.65 | 99.85 |
| 15 | 2.51 | 99.86 |
Table 14.
COD value and COD removal efficiency at different NPAM doses.
Table 14.
COD value and COD removal efficiency at different NPAM doses.
| Dose (mg/L) | COD Value (mg/L) | COD Removal Efficiency (%) |
|---|
| 2.5 | 2340 | 66.86 |
| 5 | 2090 | 70.40 |
| 7.5 | 1720 | 75.64 |
| 10 | 1560 | 77.90 |
| 12.5 | 1350 | 80.88 |
| 25 | 1320 | 81.30 |
Table 15.
Turbidity value and turbidity removal efficiency at different NPAM doses.
Table 15.
Turbidity value and turbidity removal efficiency at different NPAM doses.
| Dose (mg/L) | Turbidity Value (NTU) | Turbidity Removal Efficiency (%) |
|---|
| 2.5 | 47.52 | 97.33 |
| 5 | 36.59 | 97.94 |
| 7.5 | 27.84 | 98.44 |
| 10 | 22.18 | 98.75 |
| 12.5 | 19.62 | 98.90 |
| 25 | 18.23 | 98.98 |
Table 16.
Statistics on the flocculation effect of different flocculants on emulsions.
Table 16.
Statistics on the flocculation effect of different flocculants on emulsions.
| Flocculant | Optimal Dose (mg/L) | COD Removal Efficiency (%) | Turbidity Removal Efficiency (%) | Solid/Liquid Ratio | Sediment Size | Settling Time (h) |
|---|
| PAC | 2250 | 78.61 | 99.85 | 4:1 | small | 2 |
| PFC | 2250 | 88.10 | 99.48 | 1:1 | small | 2 |
| PSAF | 4500 | 78.47 | 99.76 | 5:1 | small | 2 |
| APAM | — | — | — | — | — | — |
| CPAM | — | — | — | — | — | — |
| NPAM | — | — | — | — | — | — |
| PFC + APAM | 2250 + 5 | 84.75 | 99.86 | 3:4 | large | 0.5 |
| PFC + CPAM | 2250 + 7.5 | 75.50 | 99.85 | 4:5 | large | 0.5 |
| PFC + NPAM | 2250 + 12.5 | 80.88 | 98.90 | 1:1 | large | 0.5 |


