Article

A Theoretical Derivation and Comparison Method for the Optimal Location for Energy Dissipation Boxes

State Key Laboratory of Hydrology-Water Resources and Hydraulic Engineering, Nanjing Hydraulic Research Institute, Nanjing 210029, China
*
Author to whom correspondence should be addressed.
Water 2024, 16(15), 2189; https://doi.org/10.3390/w16152189
Submission received: 1 July 2024 / Revised: 25 July 2024 / Accepted: 30 July 2024 / Published: 1 August 2024
(This article belongs to the Section Hydraulics and Hydrodynamics)

Abstract

:
In long-distance, high-elevation gravitational water supply systems, it is essential to incorporate energy dissipation to lower pipeline pressures. The energy dissipation box is a novel device for pressure reduction, extensively utilized in gravitational flow transition systems. Despite its appealing contribution, systematic selection methods still need to be used regarding its optimum location. Hence, this paper considers the sum-of-the-maximum hydrostatic pressure head (SMHPH) and derives an extreme location equation for the energy dissipation box (EDB) in the design stage, and then, it comprehensively accounts for the overcurrent capacity and proposes a theoretical comparison and selection method for the optimal location (OL) between the critical and extreme locations. A theoretical analysis with an engineering case study is conducted to compare the theoretical OL, and numerical simulations are carried out to compare the pressure protection effect of the same box cross-sectional area and initial water volume of the theoretical OL and other possible locations with different initial water depths. The results show that the location of the EDB in the design stage should comprehensively consider the overcurrent capacity and the SMHPH. On the basis of both conditions, the oscillation amplitudes of the pressure gradient beyond the box are significantly decreased as the OL approaches closer to the downstream pipe. If the initial water depth in the box is large, the EDB provides greater protection to the pressure head (PH) by decreasing the cross-sectional area and then maximizing the utilization of water depth in the box and decreasing the volume of the EDB.

1. Introduction

Constructing long-distance water supply systems allows for the transportation of water from water-rich areas to regions experiencing water shortages, effectively addressing severe water resource deficiencies [1]. These systems typically employ either gravity flow or pumping station pressurization. Gravity flow systems are favored for their reliability and cost-effectiveness since they operate without the need for external power to maintain flow [2]. In a long-distance gravitational water supply system (LDGWSS), when the hydrostatic pressure head (PH) approaches or exceeds the specified design pressure, sudden changes in flow rate can lead to overpressure events. Such hydraulic shocks can potentially deform or rupture pipelines and their components under high pressures, while low pressures may cause pipeline collapse [3,4]. Consequently, pipelines are equipped with overpressure protection systems, including pressure relief valves (PRVs), surge tanks combined with PRVs [5,6], and valves paired with energy dissipation boxes (EDBs).
The PRV, an essential element in hydraulic systems, is typically positioned at the supply line inlet or at the highest-pressure location. It functions by automatically opening its valve port when the pressure exceeds a predetermined threshold, thereby maintaining a constant pressure within the controlled system or loop [7]. The valve stability profoundly influences the performance of a pipe system, and thus, a nonlinear model was established to obtain the PRV system’s actual dynamic characteristics and stability criteria [8]. In addition, Izuchi [9] studied the stability of the PRV through experiments and identified that dynamic instability arose from the interaction between pressure wave propagation in the inlet pipe and movement of the valve disk. Li and co-workers [10], concentrating on a numerical analysis, observed that the axial force exerted by the fluid on the valve flap initially decreased as the valve opened, followed by an increase.
Several works have focused on designing and applying water hammer protective systems employing PRVs and surge suppressors. For instance, Foster [11] and Alireza [12] studied transient flow dynamics with a surge tank and PRV integrated into a pump valve reservoir system. These protective measures successfully mitigated pressure surges within the spiral case and prevented turbine overspeed. In addition, the flux split technology has led to an efficient numerical method with first- and second-order accuracy that simulates the water hammer problem in a comprehensive hydraulic network with PRVs and surge tanks [13]. The numerical evidence showed that the protective devices had desirable properties. Various PRVs and surge tanks have been proposed to analyze the multi-level decompression in LDGWSSs [14,15], with the corresponding results demonstrating that the protective devices above could mitigate excess water head, minimize negative pressure, and assure the safe operation of the pipeline.
PRVs have been used successfully under various hydraulic conditions to mitigate harmful transient pressures in distribution systems. PRVs require low inertia or a highly responsive control system to promptly address detected overpressures [16]. However, careful selection of the PRV is essential, as improper choices can compromise the system’s ability to manage transients effectively [17]. PRVs are often accompanied by intermittent significant energy loss and frequent vibration, significantly affecting their discharge capacity and safety pressure protection [8]. Furthermore, PRVs function reactively, which limits their applicability in many hydraulic systems where broader or more cost-effective mitigation strategies may be preferred over localized, rapid protection provided by PRVs.
The EDB examined in this study is an innovative device designed for energy dissipation and reducing PHs. It integrates an energy dissipation valve (EDV) with the EDB, allowing water to pass through the valve structure to achieve multi-stage energy dissipation. This is because the EDB eliminates the requirement of a large water head and avoids the sustained functionality of the EDB with a narrow aperture. Meanwhile, EDBs have the function of surge regulation and storage, cutting off the transmission of the water hammer, and alleviating the pressure oscillation. Therefore, the LHGWSSs should employ a setup combining EDVs and EDBs. In [18,19], the authors investigated the regulation of valve operation for the hydraulic transition within the EDB by establishing a one-dimensional numerical model to simulate hydraulic transients. Most of the previous EDB locations are influenced by pipeline layouts and are blindly built in designated places; there is still a lack of systematic theoretical analyses for the optimal location. Therefore, motivated by the shortcomings above, in the condition of considering the overcurrent capacity following EDB installation, [20] theoretically derived the critical location equation and analyzed the magnitude of the water level (WL) with upstream location. The results indicated that the theoretical critical location offered better PH reduction protection for the identical valve response time.
However, the study above ignores the optimization of SMHPHs to reduce the initial PHs along the pipeline as much as possible in the design stage; the critical location of the EDB is not necessarily the optimal location. Therefore, considering the overcurrent capacity and the SMHPH, there still remains a need for comprehensive theoretical evaluation regarding the OL of the EDB. This paper derives the extreme location for the EDB on the basis of decreasing the SMHPH. Zhang [21] established a theoretical analysis model of the one-way surge tank location under the assumption that the centerline elevation was straight. Meanwhile, Zhang [22] also established a theoretical analysis model of the air valve location by dividing the actual water transmission system into sections; each section was assumed to be a straight line. Through the aforementioned method, the optimal location of the one-way surge tank and air valve in water supply pipelines was presented, and the results were validated using a numerical model for one-dimensional hydraulic transients. At present, there is still a lack of theoretical equations for SMHPHs along pipes. Considering the intricate nature of pipelines in actual gravitational flow transition systems, which encompass both ascending and descending sections, the calculation amount is huge when the extreme location for the EDB is calculated repeatedly each time according to specific trends. Hence, this paper establishes the theoretical equation of SMHPHs by dividing the water transmission system into sections and ignoring the local topographic trend of each section. Then, this paper proposes a theoretical comparison and selection method for the optimal location (OL) between critical and extreme locations and analyzes the impact of the locations in protecting against the water hammer in an LHGWSS.
The major innovations of this paper are as follows: (1) Deriving the theoretical equations for determining the extreme location of the EDB under the condition of minimizing SMHPHs, (2) proposing a discrimination method for identifying the theoretical OL of the EDB considering the overcurrent capacity and SMHPHs, and (3) comparing and analyzing the effect of the EDB location on water hammer protection.

2. Theoretical Equations for the OL of the EDB

This paper adopts the combined working modes of EDBs and EDVs in an LHGWSS. The EDB comprises a rear riprap, energy dissipation bottom sill, energy dissipation partition, and folding stilling board. Figure 1 illustrates the corresponding structural diagram, highlighting that the water flow energy is primarily distributed through mixing/turbulence/breaking. Energy dissipation occurs through the exchange of mass, energy, and momentum between the box, water, gas, and internal friction. Examining the structural configuration of the EDB reveals that despite its initial small size, it absorbs the majority of flow energies due to hydraulic friction. The second part occupies a larger volume within the EDB, mainly adjusting the flow patterns and stabilizing flow velocities, functioning as a surge chamber.
Assuming that the regulating valve before the box is non-operational and the friction resistance and elasticity of the water in the pipeline are negligible, we use the harmonic vibration theory and obtain the oscillation period T and the magnitude of the WL in the EDB ∆Hst [20]:
T = 2 π L 2 A s t g f H s t = v 0 L 2 f g A s t
where L2 is the pipeline length behind the EDB, Ast is the cross-sectional region of the EDB, v0 denotes the initial pipeline flow velocity, f represents the pipe cross-sectional region, and g indicates the gravity acceleration. Equation (1) describes the downstream pipeline’s pressure fluctuation intensity. When the EDB is near the downstream reservoir, the pressure fluctuations and oscillation periods along the downstream pipeline decrease for a given valve closure. Consequently, for LHGWSS, it is advisable to position the EDB as near as possible to the downstream reservoir.
After installing the EDB, both conditions must be met: (1) ensuring the absence of a negative PH within the pipeline during standard operational conditions and (2) maintaining the hydrostatic PH within permissible limits per pipeline PH standards.

2.1. Theoretical Equations for the EDB’s Critical Location

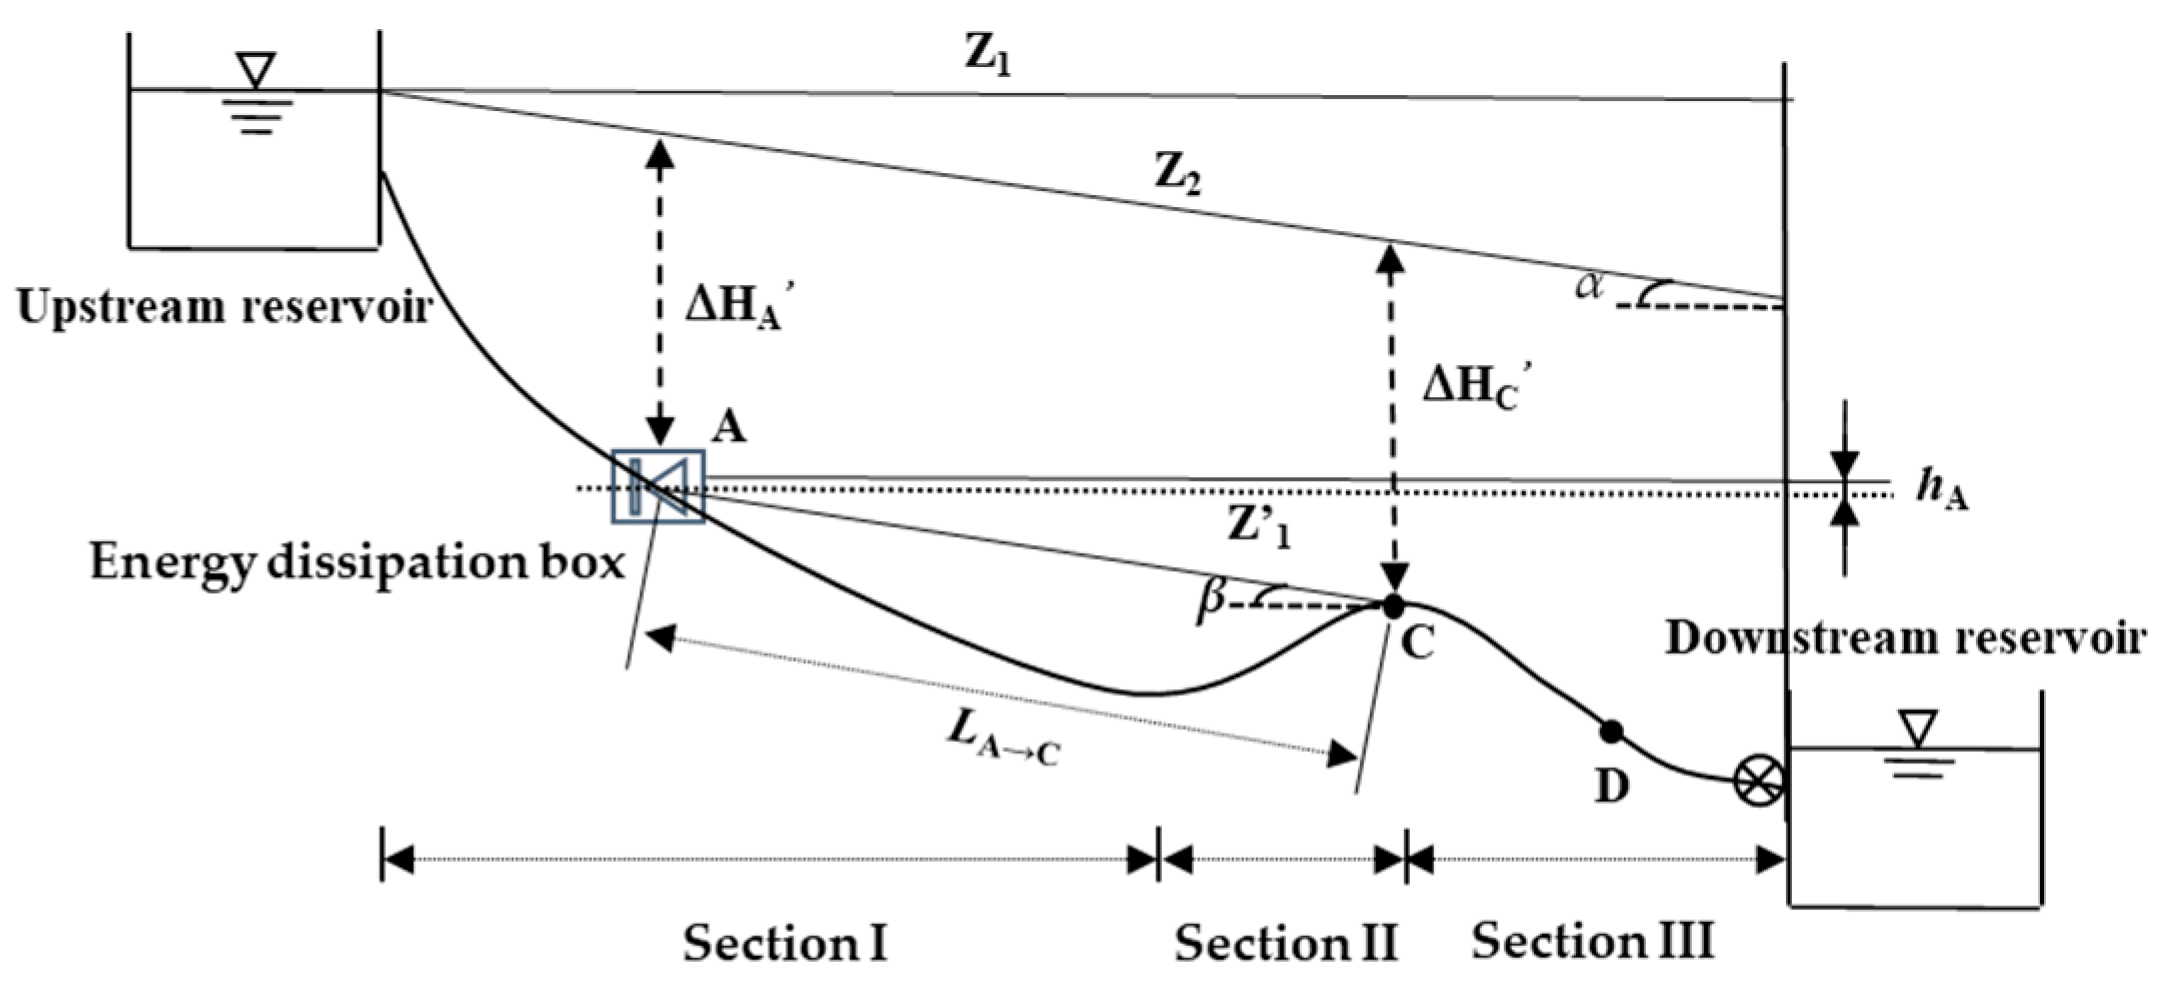
Figure 2 depicts the visual representation of the EDB position in an LHGWSS. H A and H C are the internal water PHs between the piezometric head and centerline elevation at points A and C, respectively, L A C denotes the pipe’s length between points A and C, α and β represent the gradient angles of the hydraulic line and the angle formed by pipe points A and C, and hA is the water depth in the EDB measured in meters.
Figure 2 reveals that if the PH downstream of point D beyond the standard pipe PH, an EDB is installed at point A, situated between the upstream reservoir and point C (overcurrent point). The critical location of the EDB satisfies the condition outlined in [20]:
β = α
H A = H C
Equations (2) and (3) represent the critical location equations for determining EDBs’ locations, which satisfies the pipeline’s current overload capacity requirement. When β = α, the EDB’s location is where a line parallel to the hydraulic slope intersects the upstream pipeline at the overcurrent point C.

2.2. Theoretical Equations for the EDB’s Extreme Location

Considering the topographic trend of the gravity flow system, it is difficult to fully represent the SMHPH in a mathematical manner. Firstly, the position of the extreme point for EDBs based on either section of the pipe, which can be assumed to be straight, is analyzed theoretically. The water hammer protection measures should ensure that the maximum PH does not exceed 1.3–1.5 times the maximum working PH [23]. Therefore, 1 + m times the maximum working PH is accepted as the pipeline PH standard, m ∈ (0.3, 0.5).
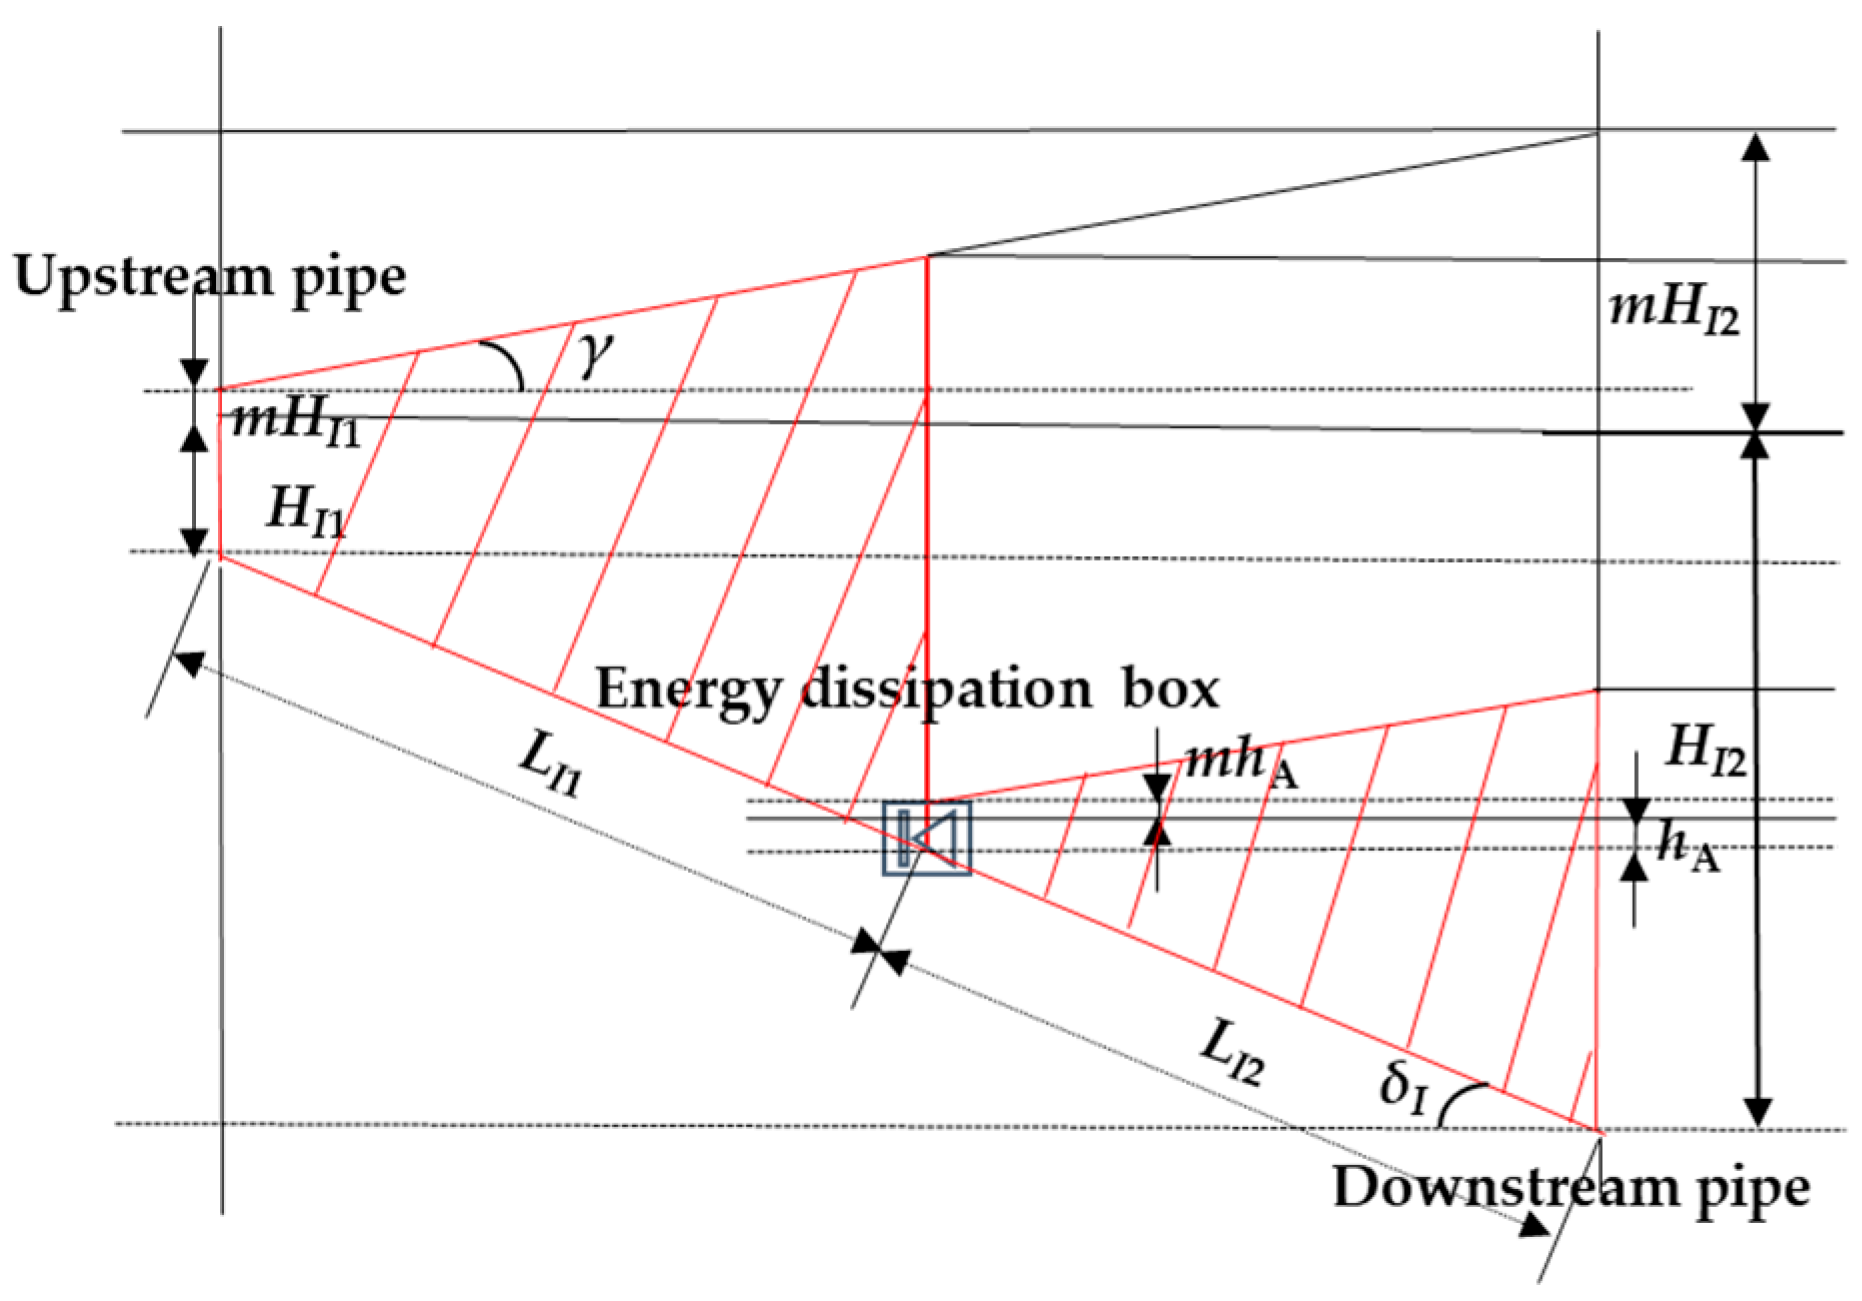
Figure 3 presents a schematic diagram of the hydrostatic PH along Section I of the pipe for EDBs. The shaded region, AI1, is the SMHPH along the pipeline for the EDB (m2), HI1 is the upstream pipe PH of Section I (m), HI2 is the downstream pipe PH of Section I (m), LI1 is the pipe length in front of the EDB (m), LI2 is the pipe length behind the EDB (m), δI is the slope angle of Section I, the angle is positive when upstream is higher than downstream, and hA is water depth, which is assumed to remain constant across different locations.
According to Figure 3, HI2 = HI1 + LIsinδI, where LI is the pipe length (m). Therefore, AI1 can be obtained as follows:
A I 1 = 0.5 1 + m H I 1 + H I 2 L I cos δ I + 1 + m h A H I 1 L I 1 sin δ I L I L I 1 cos δ I
Equation (4) is the theoretical equation for SMHPHs. When LI1 = 0, the EDB is located upstream of the pipe; when LI1 = LI, the EDB is located downstream of the pipe, namely,
A I 2 = 0.5 1 + m H I 2 H I 1 + 2 h A L I cos δ I
A I 3 = 0.5 1 + m H I 1 + H I 2 L I cos δ I
where AI2 and AI3 are the SMHPHs for the EDB, located at the beginning and end of the pipe (m2).
For a given pipeline system, AI1 is a second-order equation concerning LI1. Therefore, the derivative of Equation (4) can be expressed as follows:
d A I 1 d L I 1 = 1 + m h A H I 1 cos δ I + 1 + m L I 2 L I 1 sin δ I cos δ I
when dAI1/dLI1 = 0, one can obtain the following:
L I 1 e x = 1 2 L I H I 1 h A sin δ I
where LI1−ex is the pipe length before the EDB located at the extreme location. The SMHPH along the pipeline is optimized to achieve minimal value at LI1−ex.
As shown in Figure 2, the pipe is divided into three sections (Section I, II, and III), and the EDB is located at Section I. By ignoring the local topographic trend of each section, we theoretically derive the theoretical equation for the SMHPH along the overall pipe based on a straight line connecting the starting and ending centerline elevations in each section. Therefore, A I→III can be obtained as follows:
A I I I I = 0.5 1 + m { L I cos δ I 2 H I 1 + L I 1 sin δ I + L I L I 1 cos δ I 2 h A + L I L I 1 sin δ I   + L I I cos δ I I 2 h A + 2 L I L I 1 sin δ I + L I I sin δ I I   + L I I I cos δ I I I 2 h A + 2 L I L I 1 sin δ I + 2 L I I sin δ I I + L I I I sin δ I I I }
where LII is the pipe length of Section II (m), LIII is the pipe length of Section III (m), and δII and δIII are the slope angle of the pipe of Section II and III (m), respectively.
When d A I→III/dLI1 = 0, one can obtain the following:
L I 1 e x = 1 2 L I H I 1 h A sin δ I + L I I sin δ I I + L I I I sin δ I I I cos δ I
For extending the extreme location to the general pipe in gravity flow (the pipe can be divided to n sections, index 1, …, m, …, n), one can obtain the following:
L m e x = 1 2 L m H m 1 h A sin δ m + L m + 1 sin δ m + 1 + + L n sin δ n cos δ n
where Lm−ex is the pipe length in front of the EDB located at Section m (m) and Hm1 is the upstream pipe PH of Section m (m). Equation (11) is the general theoretical equation for the extreme location under the assumption that each section of pipe can be approximated as a straight line. Equation (11) can basically represent the SMHPH in a complex pipe under the condition of refining the section of pipe.

2.3. Comparison Method for OL of the EDB

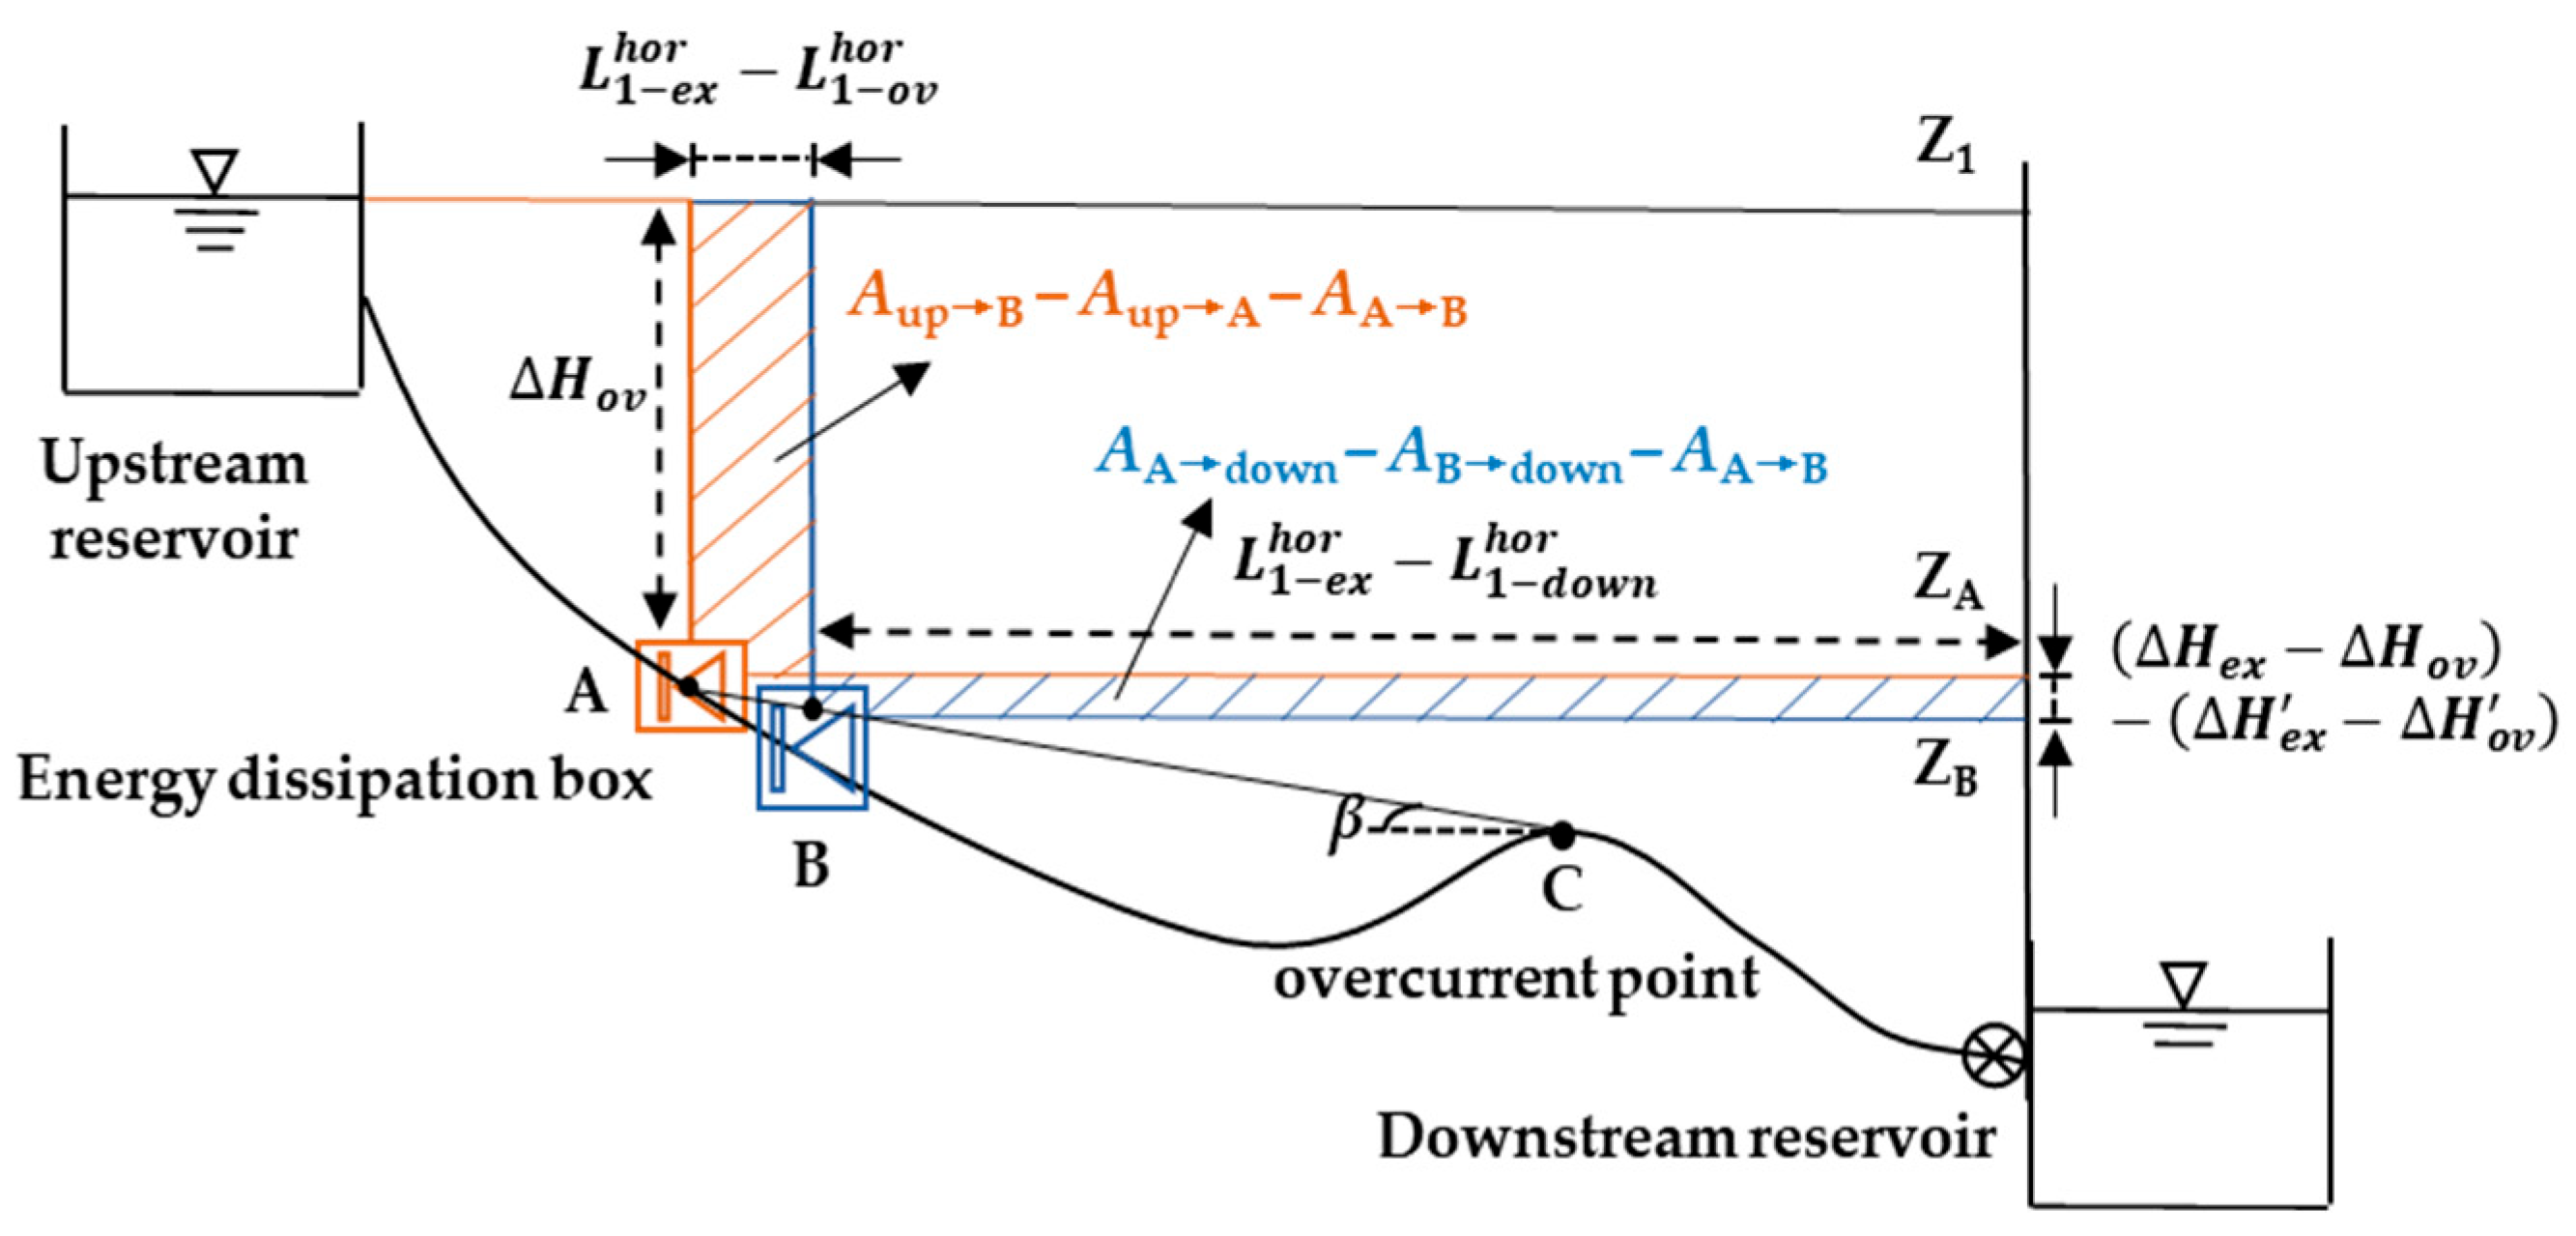
The analysis presented above reveals that the OL of the EDB is influenced by overcurrent capacity and the sum of the hydrostatic PH. As depicted in Figure 4, point A and point B are the critical and extreme locations for the EDB, respectively, L 1 o v is the pipeline length before the EDB situated at the critical location, Aij represents the sum of the maximum hydrostatic PH from index i to j, and L 1 k h o r represents the horizontal length of pipe before the EDB at point k (k is the index). ΔHov and ΔHex denote the internal PH between the hydrostatic PH and centerline elevation at critical and extreme locations, respectively, and H o v and H e x are the internal water PH between the piezometric head and centerline elevation at the critical and extreme locations.
To prevent negative PHs alongside the pipeline in the design stage, the minimum WL at the EDB can be determined as follows:
h A m i n = Const ,             critical   point   Const ,       exreme   point   located   before   critical   point H e x H o v + Const ,         extreme   point   located   behind   critical   point  
According to Equation (12), the installation of the EDB before the critical location can be performed at any elevation of the water. To maintain a defined margin for internal PH behind the EDB, the constant in Equation (12) is typically set to 3–5 m.
Based on Equation (1), it is preferable to position the EDB as proximate to the lower reservoir as feasible to alleviate pressure fluctuations. Therefore, when the difference in the SMHPH with an EDB located at critical and extreme locations is negligible, the OL is preferably closer to the downstream. However, when there is a significant difference between the two locations above, the SMHPH should be considered to determine the OL if the EDB corresponding to the extreme location is located prior to the critical location, and fluctuations of the WL inside the box and along the pipeline behind the box can be alleviated by reducing the valve operation time
If the extreme location is located downstream of the critical location, theoretically the OL is at the extreme location. However, the general trend of the pipe centerline elevations in gravity flow are typically from higher to lower, thus necessitating measures to avoid the significant water depth; the theoretical extreme location should be located near the critical location. Certain end segment pipelines are disregarded while retaining the extreme location downstream of the critical location. The position of the extreme point with respect to the EDB with lower water depth is determined through a comprehensive comparison.
The criterion of SMHPHs between the critical location and extreme location downstream of former location for certain terminal segment pipelines is not taken into consideration, as discussed below.
(1)
When L 1 e x = L 1 o v , the extreme location coincides with the critical location.
(2)
When L 1 e x < L 1 o v , the comparison of SMHPHs for EDBs located at the extreme location and critical location is between Aup→A   Aup→B   AB→A and AB→down  AA→down   AB→A, i.e., H o v H e x L 1 o v h o r L 1 d o w n h o r and H e x L 1 o v h o r L 1 e x h o r . If H o v H e x L 1 o v h o r L 1 d o w n h o r < H e x L 1 o v h o r L 1 e x h o r , the OL of the EDB is at the extreme point where the SMHPH reaches the minimum.
The dimension of the EDB and fluctuation of the WL inside the box should be also comprehensively considered to determine the OL during the operational control stage. The theoretical comparative methods presented above can offer direction and serve as a reference for the initial selection of EDB positions in practical engineering applications. Moreover, the methods can be flexibly utilized based on specific project requirements. It is worth noting that numerical simulations must be employed to determine an appropriate size for the EDB and establish valve operation protocols to prevent overflow or leakage.

3. Impact of EDB Position on the Water Transition System

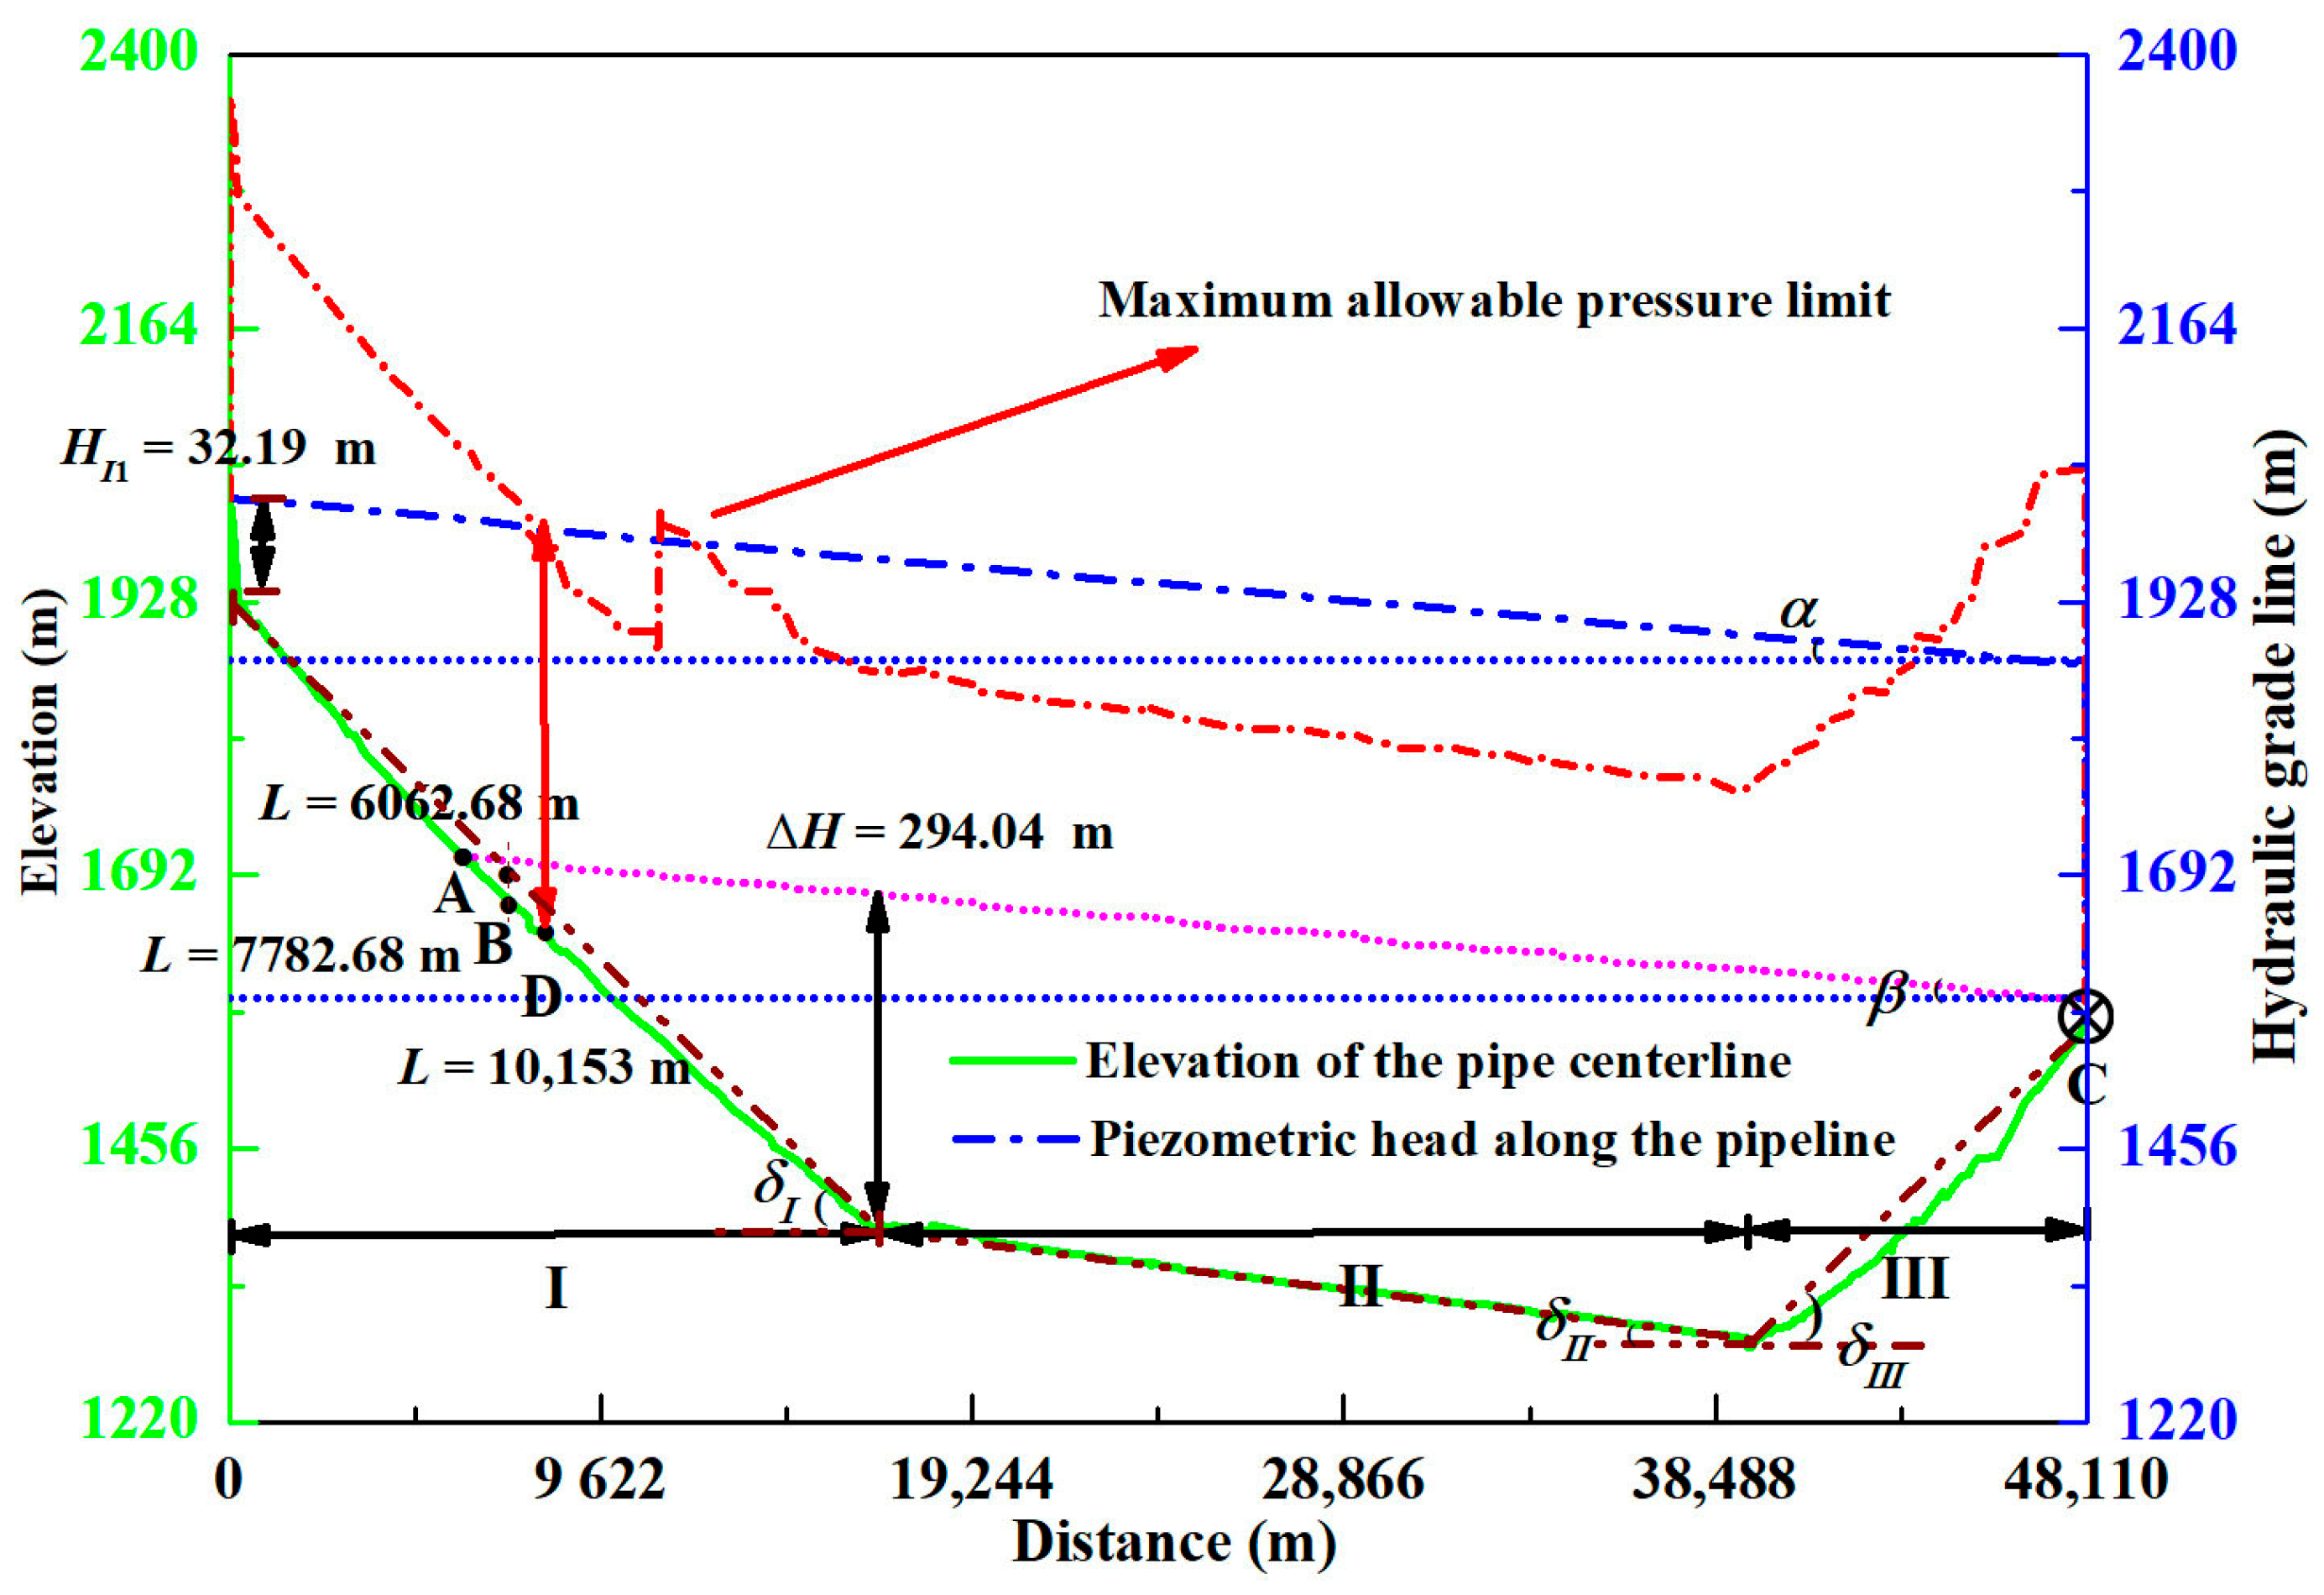
This section analyzes the LHGWSS illustrated in Figure 5, showcasing a pipeline with a total length of 48.09 km, a design flow rate of 2.1 m3/s, and a pipe diameter of 1.2 m. The WLs of the upstream and downstream reservoirs are 2017.50 m and 1567.00 m, respectively, resulting in a head drop of 450.5 m between the two reservoirs. At the end of the pipe, two parallel-installed flow-regulating valves (DN800 and DN1200) are present. Employing the characteristic line method establishes a 1D hydraulic transient numerical model for the water transition system. Herein, to guarantee the stable and safe operation of the system, it is crucial to ensure that there are no negative PHs alongside the pipeline when closing the valves and that the maximum PH remains below the pipeline PH standard. Figure 5 depicts the pressure pipe headline and pipe PH standard line for pipes under continuous flow.

3.1. Constant Flow Assessment of Gravity Flow System with No EDB

As illustrated in Figure 5, the piezometric head surpasses the pipe PH standard at L = 10,153 m (point D). From stake 10 + 153.00 to 11 + 753.00 and from stake 13 + 022.28 to stake 43 + 957.34, the water PH along the pipeline exceeds the maximum allowable positive PH (stake 0 + 00.00 to 6 + 033.00, 350 m; 6 + 033.00 to 11 + 753.00, 400 m; and stake 11 + 753.00 to 48 + 103.18, 480 m). Notably, at stake 39 + 352.63, the disparity between the piezometric head and the maximum working PH achieves a peak of 133.19 m. Hence, it is crucial that an EDB is installed to lower the PH for LHGWSSs, thereby preventing extreme conditions such as pipe bursts and ensuring safe operation.

3.2. Theoretical Evaluation of the EDB’s OL

Referring to the hydraulic slope angle shown in Figure 5, we determine that sinα = 0.002912 and cosα ≈ 1. Based on Equation (2), the critical EDB location satisfies the condition β = α, resulting in sinβ = 0.002912 and cosβ ≈ 1. To prevent the occurrence of negative PHs in the pipeline caused by the EDB, the overflow point C should be positioned at the highest point at the pipeline’s end (stake 48 + 079.04 with the internal PH). Using Equation (2), a hypothetical straight line parallel to the hydraulic slope line is established between point C and the upstream pipeline. The intersection of this line with the centerline elevation (point A, stake 6 + 062.68) identifies the theoretical critical location of the EDB, with the internal PH at point A being 293.62 m.
According to the pipeline centerline elevation trend, the pipe is divided into three sections, as analyzed in Figure 5. The position of the extreme point for the EDB is theoretically analyzed based on a straight line connecting the starting and ending centerline elevations in each section. Considering the WL requirement in the EDB under overcurrent capacity, it is determined that the initial water depth of the EDB located in Section II exceeds 294.04 m, thus positioning the extreme location at Section I. In the design stage, the calculated water depth is initially selected to be identical to the initial water depth of the critical location (3.26 m). Table 1 compares the pipe parameters of each section.
By introducing Equations (10) or (11), LI1−ex = 7782.68 m, and the internal PH at point B (extreme location) is 268.93 m. From the theoretical analysis of the EDB location presented above, it can be observed that L 1 e x > L 1 o v , H e x H o v H e x H o v ( L 1 e x h o r L 1 d o w n h o r ) = 255,541.44 m2, and H o v L 1 e x h o r L 1 o v h o r = 234,250.49 m2. Therefore, according to the comparison method for assessing the OL of the EDB, the theoretical OL is at the extreme location.

3.3. Comparative Study of Protective Effects at Various EDB Locations

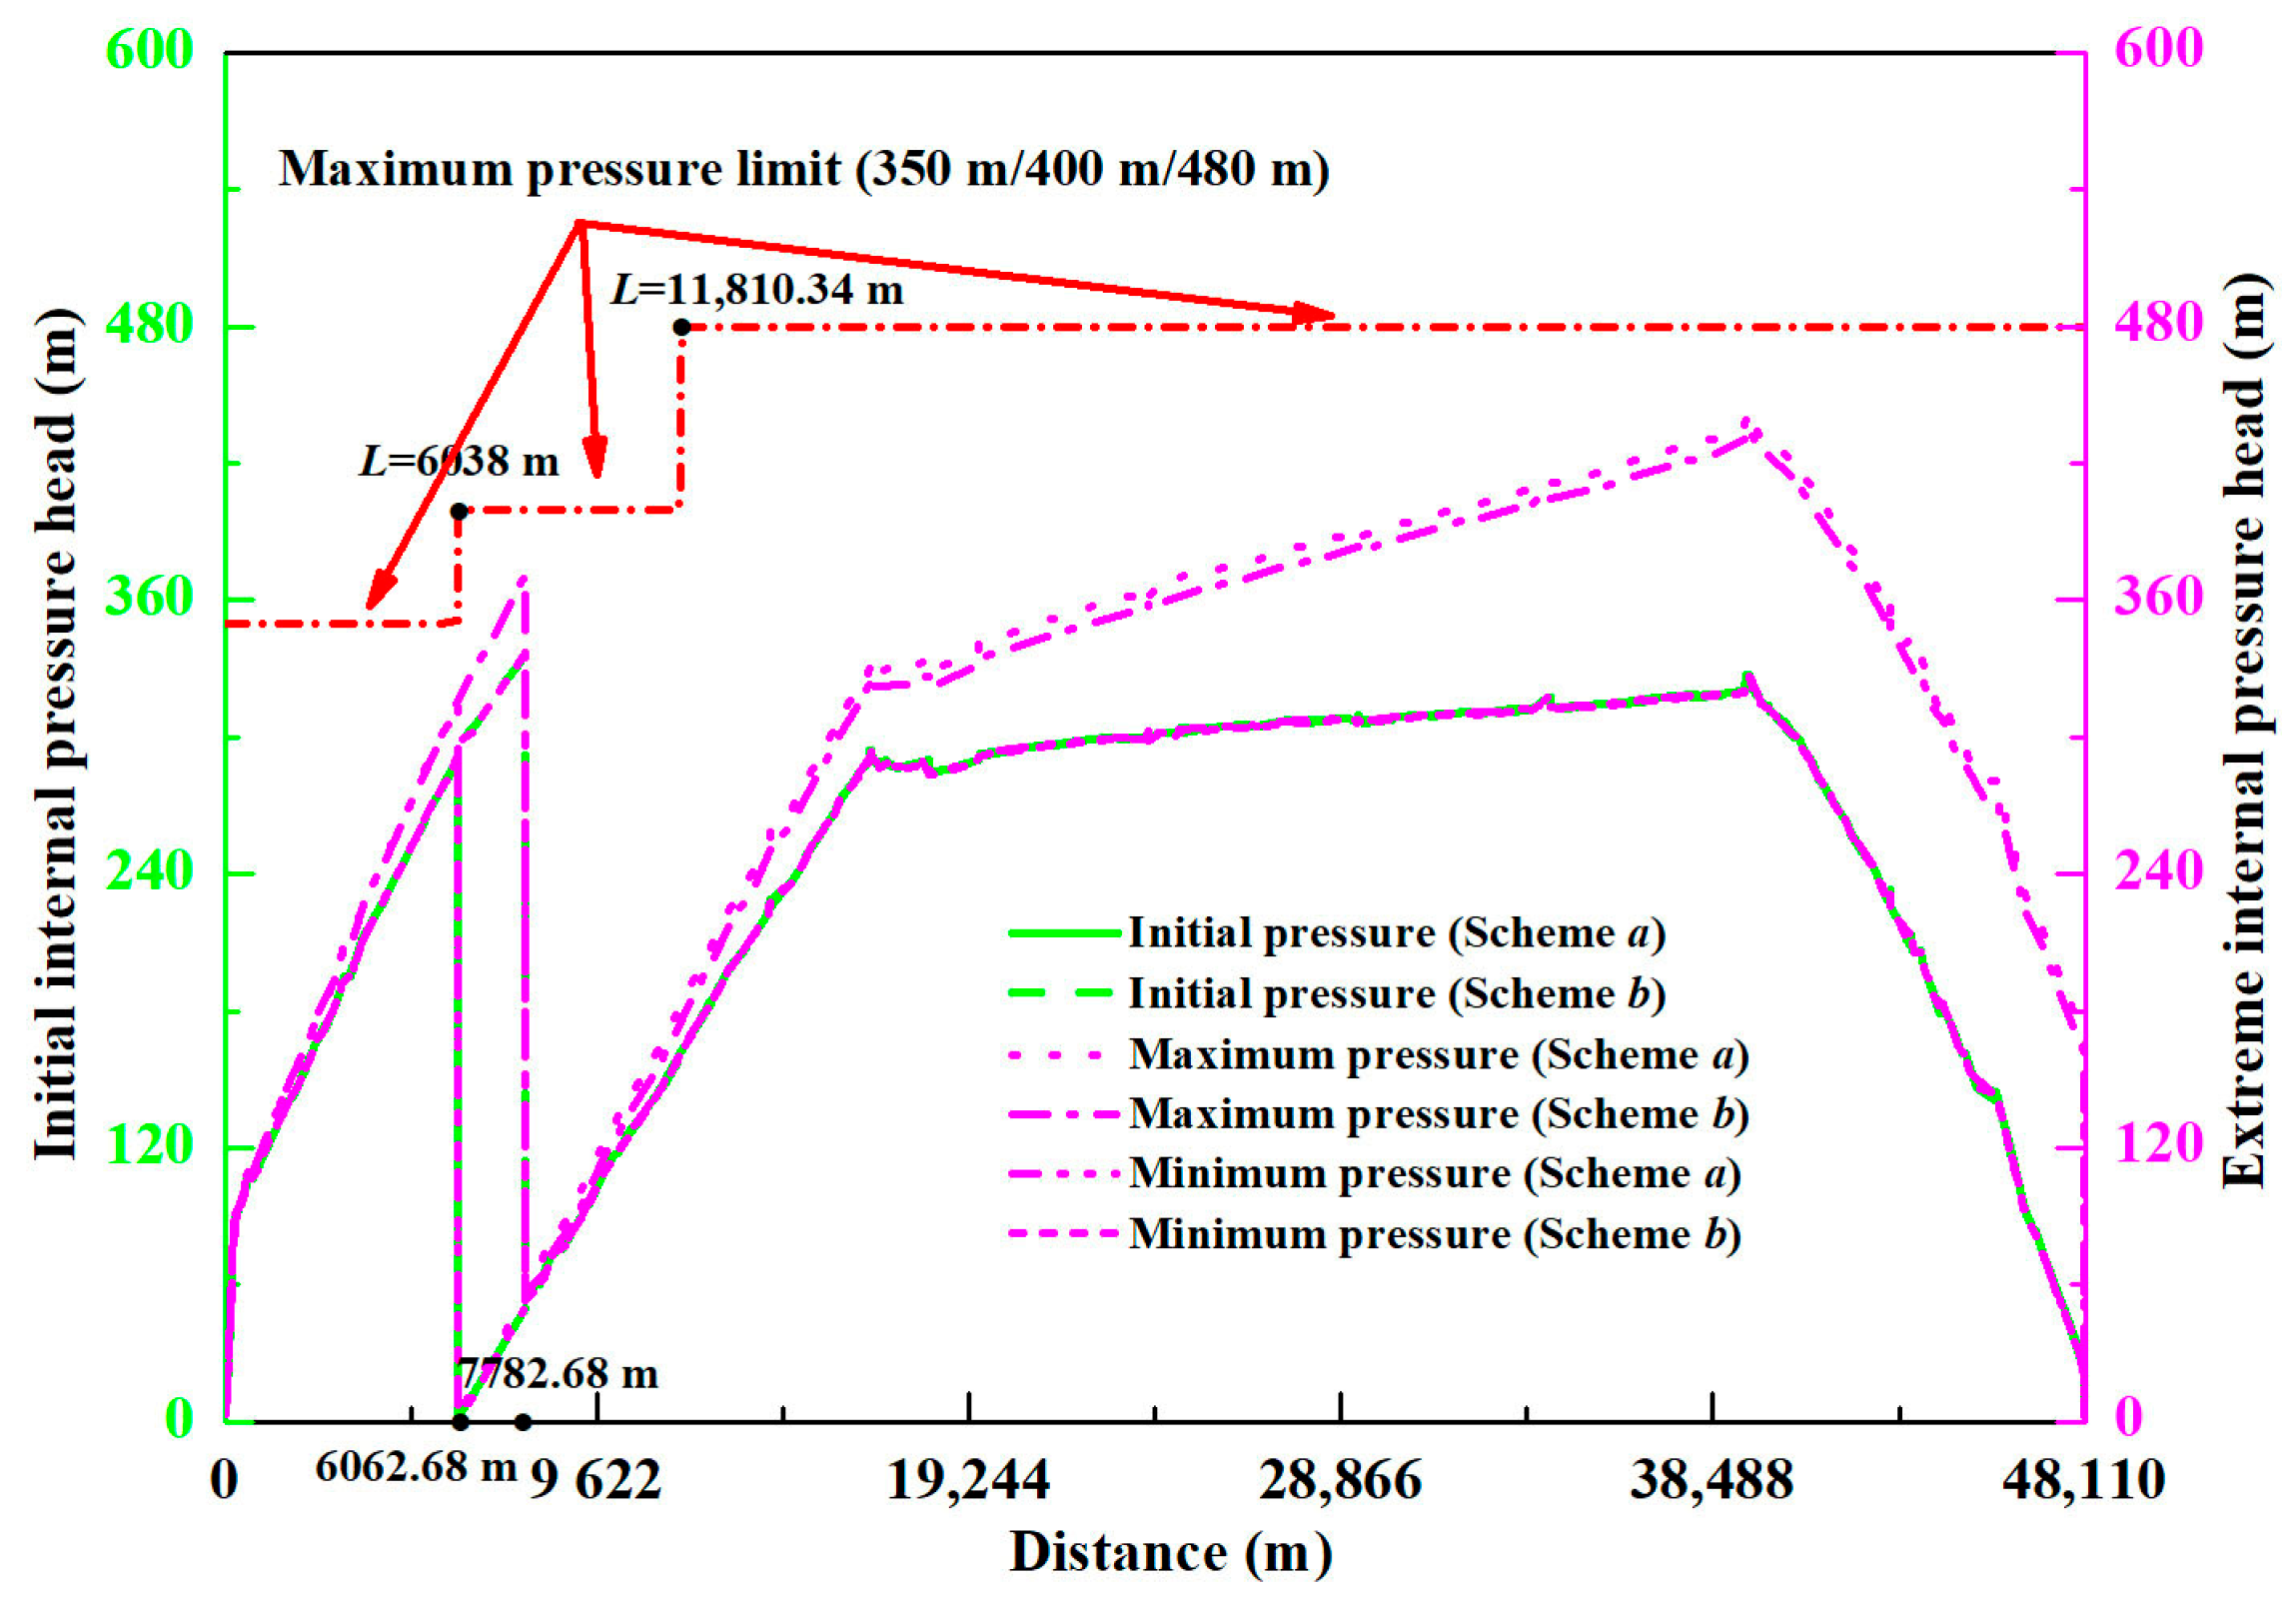
In this study, a DN1000 EDV is installed upstream of the box to ensure downstream overcurrent capacity. In all models, the reducing PHs of the EDVs are consistently 72.88 m to ensure the EDV remains fully open. At the critical locations (model a) and extreme locations (models b and c), considering the pipeline’s capacity requirement, the water depths of the EDB are set to 3.26 m and 54.5 m, respectively, and are basically primarily situated along the same line parallel to the hydraulic slope. Figure 6 illustrates that, following EDB installation, the initial PH along the pipeline significantly decreases compared to the maximum allowable PH. Furthermore, the initial minimum PH along the pipe are 1.43 m, 2.99 m, and 2.99 m, respectively. There are no occurrences of negative PHs along the pipeline, satisfying the overcurrent capacity requirements in the design stage. Moreover, the protective effects of models a and b are compared under identical valve closure times and cross-sectional areas (25 m2) but different initial water depths in the EDB. Additionally, for decreasing the dimension of the EDB, model a’s protection effect is compared to model c’s under the same valve operation and closure time, with identical initial water volume in the box (about 85.75 m2) but differing cross-sectional areas (from 25 m2 to 1.5 m2). The valve closure protocols for the three models are detailed in Table 2, and the critical pressures along the pipeline for each model are documented in Table 3. Table 4 compares the EDB parameters and variations in water depth among the different models, while Figure 6, Figure 7 and Figure 8 depict the protective effects against water hammer problems for models a, b, and c.
According to Figure 5, the water surface lines of the EDB at the extreme and critical points are along a straight line parallel to the hydraulic slope line, the EDV and the EDB, resulting in a joint reduction of 287.41 m in heads for both three models. The EDV upstream of the box is completely open, reducing 72.88 m in the PH, and the PHs of EDBs are decreased by 214.53 m. As presented in Figure 6, model b has a significantly higher initial internal PH than model a (6062.68 m versus 7782.68 m). In comparison, from 7782.68 m to the end, the initial internal PH in model b is less than in model a. The differences in the initial internal PH at the same stake behind the box remain at 0.84 m, namely, the hydraulic loss in the pipeline between the two locations. As presented in Table 2, when the EDB cross-sectional area and valve closing time are the same, the maximum PHs for models a and b are 304.06 m and 344.9 m before the box and 442.29 m and 435.39 m behind the box, respectively.
In model b and c, the amplitude of maximum and minimum pressures after EDBs, particularly in regions with lower elevation at the centerline, is lower than in model a. This is because, according to Equation (1), the proximity of the EDB is lower to the reservoir in model b, resulting in a faster reflection of pressure waves induced by the closure of downstream valves, effectively reducing pressure oscillations along the pipeline. The highest internal water pressures in the models above do not surpass the pipeline’s working pressure, and the lowest difference between the maximum value in model a and the pressure criteria is 37.71 m positioned at L = 39,426.45 m at the point of minimum pipeline centerline elevation. Additionally, the minimum PH along the pipe in three models are 1.47 m, 2.26 m, and 2.24 m, respectively. Both models ensure there are no negative pressure heads and significant positive pressure heads because of the appropriate valve operation protocols.
Table 3 highlights that the maximum PHs of models a, b, and c are 442.29, 435.39, and 421.64 m, respectively. Additionally, the minimum PHs downstream of the EDB in models a, b, and c are 1.47, 3.81, and 3.93 m, respectively. Figure 7a reveals that in model c, the maximum pressure does not surpass its maximum working pressure. The model c exhibits lower maximum pressure compared to model b, while its minimum pressure is greater than in model b. In Figure 7b, the highest magnitudes of the maximum PH pointing downstream of the EDB in models a, b, and c are 115.14, 109.08, and 95.33 m, respectively. It is worth noting that reducing the cross-sectional region of the EDB from 25 m2 to 1.5 m2 results in model c having a maximum pressure amplitude 13.75 m lower than that of model b, significantly reducing pipeline pressure. This is because the WL magnitude velocity of the EDB varies inversely with its cross-sectional area. Therefore, a smaller cross-sectional region for the EDB is needed to further alleviate the pressure oscillation. However, the smaller the cross-sectional area, the greater the WL fluctuation in the box, leading to the leakage or overflow of the EDB and consequently requiring higher EDB height requirements and increasing project costs.
Figure 8 depicts the water depth variation across various EDB positions. Owing to the effect of valve timing, the EDB’s WL undergoes an initial rise followed by a decline in all three scenarios. Figure 8a suggests that in the half-water hammer wave period of model b and c (t = L 1 d o w n /c = 40,356.56/1000 ≈ 40.36 s), the water depth is still constant. Beyond t = 40.36 s, the downstream positive wave reaches the EDB base, causing fluctuations in its water depth and altering the water depth ratio accordingly. According to Table 4, models a, b, and c show highest water depth amplitudes of 0.47 m, 0.43 m, and 4.54 m, respectively, with lowest depths of 1.25 m, 1.31 m, and 17.77 m. In Figure 7b, models a, b, and c show highest flow velocity in the EDB entering and exiting the pressurized pipeline of 0.084 m/s, 0.084 m/s, and 1.4 m/s. The flow velocity ratio undergoes an initial rise followed by a decline, and the initial, maximum, and minimum flow velocity ratio between models b and c are 0.6, 0.064, and 0.059, respectively. The flow velocity ratio remains nearly constant.
From Equation (1), it is noted that the closer the EDB is to the downstream reservoir, the smaller the WL fluctuation in the box is and the larger the oscillation period is. Model b places the EDB closer to the lower reservoir compared to model a, resulting in a smaller highest amplitude and longer fluctuation period of WL variation. Additionally, model a places the EDB closer to the upper reservoir compared to model b; this configuration allows for faster upstream replenishment of water into the EDB in model a when the water level drops under identical valve closure conditions, resulting in smaller lowest amplitude of WL variation (1.25 m versus 1.31 m). In addition, Equation (1) reveals that the WL magnitude of the EDB varies inversely with its cross-sectional area. After reducing the cross-sectional region of the EDB from 25 m2 to 1.5 m2; the magnitude of the EDB WL in model c is much more violent than that of model b (highest amplitudes of 0.43 m and 4.54 m, lowest amplitudes of 1.31 m and 17.77 m).
As depicted in Figure 8b, the flow velocity in models a, b, and c remain constant. After 120 s—the action time of EDVs—the flow velocity initially falls before stabilizing, and the flow velocity is measured at 0 m/s after the valves are completely closed. From the theory, it is noted that the flow velocity of the EDB is inversely proportional to its cross-sectional area. Hence, after reducing the cross-sectional area, the flow velocity of the EDB in model c is much higher than that of model b until the valves are completely closed (highest velocities of 1.4 m/s and 0.084 m/s), and the flow velocities in models a and b remain the same, as does the cross-sectional area. It is worth noting that reducing the cross-sectional region of the EDB from 25 m2 to 1.5 m2 results in model c having a maximum pressure amplitude 13.75 m lower than that of model b, significantly reducing pipeline pressure. This is because the WL magnitude velocity of the EDB varies inversely with its cross-sectional area. The analysis above also elucidates that model c exhibits a more pronounced protective effect on the pressure amplitude along the downstream pipe compared to other models.
Compared to model b, the total volume in model b is reduced from 1364.5 m2 to 87.42 m2, and the volume requirements are almost the same in model a and c despite the large difference in the initial water depth (3.26 m versus 54.5 m). Although there is relatively significant fluctuation in WL within model c, no leakage occurs and a substantial margin of 36.73 − 1.2/2 = 36.13 m remains for the water depth. By reducing the cross-sectional region of the EDB with a significant initial water depth, not only can it provide further protection against pressure fluctuations along the downstream pipeline, but it can also optimize the utilization of available water height within the box, thereby reducing overall costs associated with the water supply system. These aforementioned findings demonstrate that theoretical analysis aligns with the numerical simulations.

4. Conclusions

From the findings presented in this paper, the following conclusions are evident:
  • A simplified theoretical equation for the extreme location of the EDB is derived by assuming that the local topographic trend of the gravity flow system can be disregarded. This equation is based on a straight line connecting the starting and ending centerline elevations in each refining divided section, with the aim of minimizing SMHPHs along the overall pipe.
  • Given that the pipeline remains under positive pressure during regular operations and SMHPHs reach a lower value, we propose a comprehensive comparison method for assessing the OL of EDBs between the critical and the extreme locations. It is preferable to position an EDB as proximate to the lower reservoir as feasible to alleviate pressure fluctuations. Therefore, when the difference in SMHPHs is negligible, the OL is preferably closer to the downstream. When there is a significant difference between these two locations, the control indicator of SMHPHs in the design stage and the PH fluctuation in the pipelines and the WL fluctuation inside an EDB in the transition process should be considered to determine the OL. In particular, we propose methods for addressing the situation where the initial water depth of the theoretical extreme location downstream of the critical location is excessively large: adjusting the position of the extreme location by disregarding the certain end segment pipelines and determining whether the SMHPH at the adjusted extreme location is lower than that at the critical location.
  • Taking the following project as an example, through the utilization of the comprehensive comparison method, the OL of an EDB is located at the extreme location in the design stage. The SMHPH of the OL is smaller than that of the upstream critical location in terms of lowering the initial PH in a broader range of the pipeline, and the result validates the feasibility of the position adjustment methodology. Under the same cross-sectional area of the EDB, the OL could mitigate the pressure oscillations along the pipeline compared to the upstream position. Additionally, due to the larger water depth in the box, given a fixed initial water volume in the box through reducing the cross-sectional area, the OL provides superior protection from water hammer positive pressure compared to the precise location with a larger area. It maximizes the utilization of water depth in the box, reducing the total volume and saving in project investment.
  • This research offers a certain theoretical and numerical backing for choosing the OL for an EDB in an LHGWSS rather than exclusively positioning the EDB at the designated places or critical location that meets the overcurrent capacity along the pipe. This approach can reduce the design workload associated with positioning the EDB to some extent.

Author Contributions

Conceptualization, W.N. and Y.H.; Methodology, W.N.; Software, W.N.; Validation, Y.H. and Z.L.; Formal analysis, W.N. and Y.H.; Investigation, W.N.; Writing—original draft, W.N.; Writing—review and editing, Y.H. and Z.L. All authors have read and agreed to the published version of the manuscript.

Funding

This study was jointly funded by the National Natural Science Foundation of China (grant no.: 52309099), and Nanjing Hydraulic Research Institute (Youth) Project (Y122008).

Data Availability Statement

The data presented in this study are available on request from the corresponding author. The data are not publicly available due to funder restrictions.

Acknowledgments

The authors extend their sincere appreciation to the reviewers for their expertise and thoughtful review of this manuscript.

Conflicts of Interest

The authors declare no conflict of interest.

Abbreviations

PHpressure head
OLoptimal location
EDBenergy dissipation box
EDVenergy dissipation valve
LHGWSSlong-distance and high-drop gravitational flow transition system
PRVpressure relief valve
SMHPHsum-of-maximum hydrostatic pressure head

References

  1. Fan, J.L.; Wang, J.D.; Zhang, X.; Kong, L.S.; Song, Q.Y. Exploring the changes and driving forces of water footprints in China from 2002 to 2012: A perspective of final demand. Sci. Total Environ. 2019, 650, 1101–1111. [Google Scholar] [CrossRef] [PubMed]
  2. Swamee, P.K.; Sharma, A.K. Gravity flow water distribution system design. J. Water Supply Res. Technol. AQUA 2000, 49, 169–179. [Google Scholar] [CrossRef]
  3. Hashemi, S.; Filion, Y.; Speight, V.; Long, A. Effect of pipe size and location on water-main head loss in water distribution systems. J. Water Resour. Plann. Manag. 2020, 146, 06. [Google Scholar] [CrossRef]
  4. Zhang, K.Q.; Karney, B.W.; Mcpherson, D.L. Pressure-relief valve selection and transient pressure control. J. Am. Water Works Assoc. 2008, 100, 62–69. [Google Scholar] [CrossRef]
  5. Kim, H.; Kim, S. Optimization of pressure relief valve for pipeline system under transient induced cavitation condition. Urban Water J. 2020, 16, 718–726. [Google Scholar] [CrossRef]
  6. Zhang, B.; Wan, W.; Shi, M. Experimental and Numerical Simulation of Water Hammer in Gravitational Pipe Flow with Continuou Air Entrainment. Water 2018, 10, 928. [Google Scholar] [CrossRef]
  7. Desai, S.; Desai, A.; Karande, V. Design and weight optimization of buffer relief valve using FEA with experimental validation. Mater. Today Proc. 2020, 27, 1466–1472. [Google Scholar] [CrossRef]
  8. Jia, W. Dynamic Characteristics and Stability Analysis of Conical Relief Valve. Mechanika 2019, 25, 25–31. [Google Scholar] [CrossRef]
  9. Izuchi, H. Stability analysis of safety valve. In Proceedings of the 10th Topical Conference on Gas Utilization, San Antonio, TX, USA, 21–25 March 2010; AICE: Sydney, NSW, Australia, 2010. [Google Scholar]
  10. Li, D.F.; Xia, X.L.; Dai, G.L.; Ruan, L.M. Numerical simulation on fluid dynamic behavior of high-pressure safety valves. In Proceedings of the 2010 Asia-Pacific Power and Energy Engineering Conference, Chengdu, China, 28–31 March 2010; IEEE: New York, NY, USA, 2010; pp. 1–4. [Google Scholar]
  11. Foster, R.S. Surge protection design for the city and county of San Francisco water transmission system. Pipelines Constr. Environ. 1998, 103–112. Available online: https://trid.trb.org/view/498654 (accessed on 30 June 2024).
  12. Riasi, A.; Tazraei, P. Numerical analysis of the hydraulic transient response in the presence of surge tanks and relief valves. Renew. Energy 2017, 107, 138–146. [Google Scholar] [CrossRef]
  13. Geng, Y.F.; Wang, Z.L.; Jin, S. FVS scheme for severe transient flow in pipe networks. J. Hydrodyn. 2005, 17, 621–628. [Google Scholar]
  14. Gang, H.; Meiling, D.; Jinliang, G.; Guobin, L. Optimization of multi-level pressure reduction program with super high drop gravity in long distance distribution pipelines. Water Technol. 2012, 6, 51–53. (In Chinese) [Google Scholar]
  15. Jiang, G.; BaoJun, Z.; Tao, Y. Study on water hammer elimination in long distance water pipeline with combined application of various protection measures. Jiangsu Vocat. Inst. Archit. Technol. 2019, 19, 38–41. (In Chinese) [Google Scholar]
  16. Elshorbagy, W.E.; Al Maamari, M.S. Pressure Utilization In Water Transmission Pipelines considering Transient Conditions. In Proceedings of the Water Distribution System Analysis 2010—WDSA2010, Tucson, AZ, USA, 12–15 September 2010. [Google Scholar]
  17. Bolin, C.; Engeda, A. Analysis of flow-induced instability in a redesigned steam control valve. Appl. Therm. Eng. 2015, 83, 40–47. [Google Scholar] [CrossRef]
  18. Yanting, L. Calculation and analysis of gravitational flow transition of Yintao water supply project in Tianshui city. Water Conserv. Sci. Technol. Econ. 2016, 22, 31–36. (In Chinese) [Google Scholar]
  19. Jiang, X.; Jie, S. Research on water hammer characteristics of long distance water supply system with high fall head. Yellow River 2015, 37, 103–106. (In Chinese) [Google Scholar]
  20. Ni, W.; Zhang, J.; Chen, S. Optimal Location of Energy Dissipation Box in Long Distance and High Drop Gravitational Water Supply System. Water 2021, 13, 461. [Google Scholar] [CrossRef]
  21. Zhang, J.; Suo, L.; Hu, J.; Ma, S. Study on water hammer control by one-way surge tank in long-distance water-supply project. J. Hydroelectr. Eng. 2011, 30, 49–56. (In Chinese) [Google Scholar]
  22. Zhang, J.; Zhu, X.; Qu, X.; Ma, S. Study on theoretical analysis of air valve in long-distance water-supply project. J. Hydraul. Eng. 2011, 9, 1025–1033. (In Chinese) [Google Scholar]
  23. SL 511-2011; Technical Code for Mechanical and Electrical Design of Water Conservancy and Hydropower Projects. National Standards of the People ‘s Republic of China: Beijing, China, 2011.
Figure 1. Structural diagram of a conventional EDB.
Water 16 02189 g001
Figure 2. Visual representation of the theoretical, critical location of the EDB.
Water 16 02189 g002
Figure 3. Schematic diagram of the theoretical extreme location of the EDB in Section I.
Water 16 02189 g003
Figure 4. Schematic diagram of the comparative analysis for the EDB location in LHGWSS (L1−ex > L1−ov).
Water 16 02189 g004
Figure 5. LHGWSS in a real-world application.
Water 16 02189 g005
Figure 6. Impact of EDB positions on pipeline pressures (models a and b).
Water 16 02189 g006
Figure 7. (a) PH changes in models b and c, (b) PH changes at maximum PH point downstream of EDB in models a, b, and c.
Water 16 02189 g007
Figure 8. (a) Impact of EDB position on water depth and water depth amplitude and on (b) flow velocity and velocity ratio in EDB.
Water 16 02189 g008
Table 1. The pipe parameters of each section throughout the pipeline.
Section ISection IISection IIIWater Depth
LI (m)HI1 (m)sinδIcosδILII (m)sinδIILIII (m)sinδIIIhA (m)
16,626.5632.190.0330.99922,701.440.0048684.41−0.0323.26
Table 2. Valve activation and deactivation guidelines for models a, b, and c.
Valve DiameterOpening DegreeAction Time (s)Valve Closing SlopeValve Closing Time (s)
Model aDN100011201/400400
DN12000.976601/600585
DN8000.6928415
Models b and cDN100011201/400400
DN12000.998401/586585
DN8000.69961/593415
Table 3. The PH across pipelines for various models.
ModelMaximum PH before Box (m)Minimum PH before Box (m)Maximum PH behind Box (m)Minimum PH behind Box (m)
Model a304.062.27442.291.47
Model b344.92.26435.393.81
Model c344.992.24421.643.93
Table 4. Comparison of EDB parameters and variation in water depth for various models.
ModelInitial Water DepthCross-Sectional RegionMaximum Water DepthMinimum Water DepthHighest Water Depth AmplitudeLowest Water Depth AmplitudeVolume
Model a3.26 m25 m2
25 m2
3.73 m2.01 m0.47 m1.25 m85.75 m2
Model b54.5 m54.93 m53.19 m0.43 m1.31 m1364.5 m2
Model c54.5 m1.5 m259.04 m36.73 m4.54 m17.77 m87.42 m2
Disclaimer/Publisher’s Note: The statements, opinions and data contained in all publications are solely those of the individual author(s) and contributor(s) and not of MDPI and/or the editor(s). MDPI and/or the editor(s) disclaim responsibility for any injury to people or property resulting from any ideas, methods, instructions or products referred to in the content.