Abstract
Agricultural water productivity is crucial for sustainability amidst the escalating demand for food. Cereals are pivotal in providing nutritious food at affordable prices. This study was based on Ghanaian data spanning from 1992 to 2021 to evaluate water usage in the cultivation of major cereals. It also examined the virtual water losses or gains in cereal trade alongside influencing factors. The analysis utilized secondary data encompassing the virtual water content, production quantity, export and import quantities, distance, GDP per capita, population, and land per capita of Ghana and its 75 trade partners. In the last 5 years, crop water use (CWU) reached an average of 7.08 billion m3/yr for maize, 3.48 billion m3/yr for rice, 1.08 billion m3/yr for sorghum, and 0.63 billion m3/yr for millet production. Ghana’s major partners for exported virtual water (EVW) were Niger, Burkina Faso, South Africa, and Togo. Major partners for imported virtual water (IVW) were Argentina, South Africa, Ukraine, Togo, Russia, Burkina Faso, Canada, Senegal, Nigeria, Portugal, UK, Niger, and the USA. The Panel Least Squares Method of regression was used to apply the Gravity Model principle in assessing influencing factors. The findings indicate that Ghana is a net importer of virtual water in the cereal trade, with significant influences from geographical distance, GDP per capita, population, land per capita, and cereal water use.
1. Introduction
Cereal grains are very significant because they serve as the foundational nutritional source not just for humans but also for animals [1]. While the types of cereals may vary from region to region, they have played an essential role in diets and nutrition. In the future, cereals are going to prove vital in food development and security, considering that they are major staples. This arises from the fact that cereals are cheap sources of calories and proteins that are environmentally sustainable [2,3].
Ghana, in West Africa, home to a population of about 33.5 million people, has witnessed a continuous rise in both population and GDP per capita, particularly exponential in the 21st century [4]. It is known that rapid urbanization and growing populations place burdens on social infrastructure and resources [5,6]. This suggests that the country’s food demand is rising, with even greater needs anticipated in the future. The majority of the food and cereal production in Ghana comes from small-scale rain-fed farming systems with limited options for irrigation water availability [7]. Combined with the incidence of climate change causing high temperatures [8], farmers find it very difficult to achieve optimum yields to improve their incomes. Meanwhile, a growing population requires the efficient management of land and water resources for development [9].
Sustainable cereal production is a very critical factor in achieving global food security. The primary focus on higher yields and disease-resistant varieties, initially termed the “green revolution”, has now switched to the “golden revolution”, which considers achieving healthy yields with the responsible use of resources despite an ever-increasing global population [10]. Paying attention to the contribution of local cereals and their production is imperative for promoting food security and sustainability in Africa [11]. The proper management of water resources in the production of local cereals contributes to sustainable production and the promotion of the golden revolution.
The water footprint (WF) measures the amount of water utilized in the production of goods, while the virtual water trade (VWT) focuses on the exchange of water embedded in food products [12]. The virtual water content (VWC) for a crop also describes the amount of water that is used in its production process, usually made up of the green water footprint (due to rainfall), blue water footprint (due to irrigation), and grey water footprint (due to pollutant assimilation) [13]. This implies that VWC and WF are the same concept. The occurrence of the trade of agricultural commodities also implies the flow of hidden resources, such as water, embedded in these products [14]. This further highlights virtual water (VW) and its trade as major indicators for assessing the quantity of water consumed and transferred through agricultural products.
It is important to assess water quality and quantity in agricultural water resource management since they impact human lives and ecological systems [15,16]. Using the WF concept proves valuable in assessing the amount of embedded water traded. However, further assessing the factors influencing these flows is key. Examining the influencing factors of a system or any process over time has proven vital in research [17,18]. An appropriate model for VWT factor assessments is the Gravity Model, which is based on Newton’s Law of Gravity [19,20]. It primarily regards GDP and the geographical distance between countries as major factors in trade volume. It has been modified in its use over the years to improve upon its application and value. With respect to VWT, other known influencing factors include socioeconomic, institutional, and environmental factors [21]. Models are considered very instrumental in understanding real-life scenarios [22,23].
Since cereals are common, cheap, and very important to the diets of Ghanaians, understanding water usage patterns in their production and trade is extremely important. Presently, there are very few studies on crop water use and the virtual water trade of agricultural products in Ghana. Comprehending and evaluating water-related cycles and processes is important [24]. By analyzing how water usage patterns vary across different locations and over time, policymakers can develop strategies to optimize and responsibly allocate available water resources [25]. Water resource management is primarily linked to understanding rainfall, surface water, and groundwater [26]. However, including VWT consideration is also vital. Thus, the significance of this study is that it helps to fill the awareness gap concerning water use and trade related to Ghanaian cereal production in recent times.
A lack of knowledge about how much water is directly or indirectly used in the production of goods can limit water conservation [27]. Thus, this study aims to evaluate how much water has been used in the production of the major Ghanaian cereals, evaluate how much virtual water has been lost or gained in the trade of these cereals, and further evaluate the driving factors of water use and virtual water trade. This provides comprehensive information about Ghana’s cereal-and-water security status based on recent data. This study also hypothesizes that GDP per capita and geographical distance, alongside population, land per capita, water use, and the geographical location of a partner country (African or not), significantly influence the virtual water trade of Ghana’s cereals.
2. Materials and Methods
2.1. Study Area
On the African continent, Ghana is located in the west between latitudes 4°71′ N and 11°20′ N and longitudes 1°20′ E and 3°28′ W [28]. It shares borders with Burkina Faso in the north, Togo in the east, Ivory Coast in the west, and the Gulf of Guinea to the south. Figure 1 displays the map of Ghana with its 16 administrative regions and capitals. The nation encompasses a total land area of 238,533 km2, with 11,000 km2 (4.6%) covered with water [29]. As of 2022, the country comprised a population of 33.48 million people, with an average increase of 2.3% per year between 2011 and 2020 [4,30].
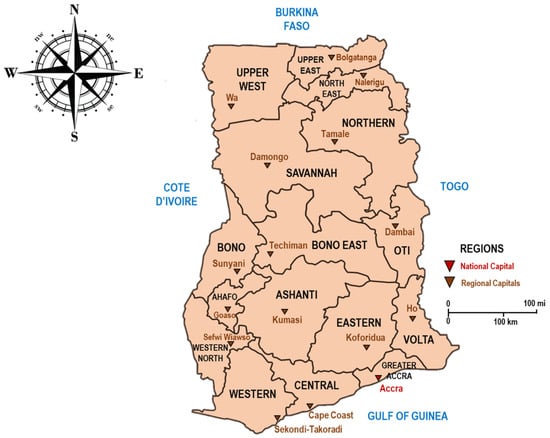
Figure 1.
Map of Ghana with its 16 administrative regions.
Ghana’s tropical climate is strongly shaped by the West Africa monsoon winds. The overall temperature is consistently warm but varies with seasons and elevation. In the northern region, there is a singular rainy season extending from May to September. In contrast, the southern part of Ghana observes two rainy seasons—a major one from April to July and a minor one from September to November [31]. The country’s northern parts are relatively dry and hot, south-eastern coastal parts are warm and dry, and the lower central and south-western sections are hot and humid [29].
2.2. Selected Crops
This study specifically examined the water use and virtual water trade of Ghana’s four (4) major cereals, namely, maize, millet, rice, and sorghum [32]. These cereals are staples that hold significant importance in Ghanaian diets and so contribute crucially to the country’s food security status.
2.3. Data
2.3.1. Cereal VWC Data
The VWC data for maize, millet, rice, and sorghum production in Ghana and its 79 partners were obtained from two comprehensive studies that assessed the average water footprint of agricultural products on a global scale. The first study was conducted from 1997 to 2001 [33], and the second study spanned from 1996 to 2005 [34]. In reference, these data were also used in other studies to assess drivers of international water trade, to assess virtual water trade between Tamale and Ouagadougou, and for virtual water trade assessment between South Korea and its partners [12,35,36].
2.3.2. Distance, Production, Import, Export, GDP per Capita, and Population Data
The geographical distance between Ghana and its partner countries, as a straight airline from their mid-points, was obtained with a distance calculator (available at https://www.distance.to/ accessed on 2 May 2024). The annual production amounts and import and export quantities for the years 1992 to 2021 were obtained from the FAOSTAT database to cover 30 years (available at https://www.fao.org/faostat/en/#data accessed on 9 January 2024). The data consisted of information on maize, millet, rice, and sorghum trade for the host and partner countries. Population and GDP per capita datasets for each country were sourced from the World Bank Open Data platform spanning from 1992 to 2021 (available at https://data.worldbank.org/ accessed on 25 January 2024).
2.4. VWC Determination
Virtual water content (VWC) for Ghana and all partner countries was derived by finding the average VWCs from the two research works for each of the four (4) cereals. As such, Equation (1) was designed with data from the appendices of these two studies [33,34]. This was performed because some VWC values per country were comparatively different from the two studies. This study also could not determine situations where an import partner was re-exporting cereals received from another country. Hence, global averages per study were used for such countries.
where VWC is the average virtual water content per crop per country [m3/ton/yr], VWC04 is the average virtual water content per crop per country from the 2004 study [m3/ton/yr], and VWC11 is the average virtual water content per crop per country from the 2011 study [m3/ton/yr].
2.5. CWU Determination
Crop Water Use (CWU) for a specific crop in a country refers to the annual volume of water utilized at the farm level for production, measured in cubic meters per year (m3/yr) and represented by Equation (2) [33]. Essentially, CWU represents the total amount of water required to cultivate a particular crop in a given nation throughout the year.
where CWU is the crop water use [m3/yr], VWC is the virtual water content [m3/ton/yr], and Q is the total volume of crop produced [tons].
2.6. EVW, IVW, and NVW Determination
Determining Exported Virtual Water (EVW) and Imported Virtual Water (IVW) is based on the VWCs per crop of the exporter country, the import partners, and the amount traded [12]. In effect, they indicate how much water has been virtually traded between Ghana and its trade country partners. As such, Net Virtual Water (NVW) represents the difference between EVW and IVW in measuring the virtual water balance. The three Equations (3)–(5) representing these relationships were sourced directly [12].
where EVW is exported virtual water [m3/yr], VWCexp is the virtual water content per crop of exporter country [m3/ton], Qexp is the annual export amount [tons], IVW is the imported virtual water [m3/yr], VWCimp is the virtual water content per crop of importer country [m3/ton], Qimp is the annual export amount [tons], and NVWT is net virtual water traded [m3/yr].
2.7. Factors Influencing EVW and IVW
Identifying the drivers of virtual water trade is crucial for designing and evaluating environmental and economic policies effectively [35]. This is particularly crucial to the efficient use of related resources, particularly water. An extensive study by Odey et al. (2021) reviewed literature to identify and discuss the drivers of virtual water trade [21]. Their study revealed that GDP, water availability, arable land availability, population, human development index (HDI), geographical distance, agricultural productivity, technological effect, precipitation, irrigated area, water scarcity, and income were the key factors influencing virtual water trade in multiple studies. Table 1 consists of some of these major studies, models used and a brief summary of their findings. This confirms that virtual water trade is influenced by socioeconomic, institutional, geographical, and environmental factors.

Table 1.
Studies on factors influencing virtual water trade.
This study placed emphasis on six (6) factors, five (5) identified in existing research as influential on both crop virtual water trade and one dummy variable. These were GDP per capita, distance, population, land per capita, virtual water for production (VWP)—also the same as CWU—and whether the country is in the African continent or not (dummy). The gravity model was used to assess these factors.
2.8. The Gravity Model
Newton’s law of universal gravitation describes the force between particles as directly proportional to their mass (size) and inversely proportional to the distance between their centers [46]. This is the basis of the development of the gravity model of international trade, pioneered by Tinbergen and developed over the years [19]. The model states that the volume of trade between any two countries is directly proportional to the product of their GDPs and inversely proportional to the distance between them. Equation (6) describes this relationship in reference to the description of the Gravity Model by Tamea et al. (2014) [35].
where Tij represents the volume of trade between countries i and j; k represents the constant; GDPi and GDPj represent the GDPs of countries i and j; Dij represents the geographical distance between countries i and j.
After transforming the model using the natural log function, a regression equation, Equation (7), is derived [19]. This allows for the input of other variables to also determine their impact on trade volume:
where Vij represents any inclusive variable of interest, usually transformed unless a dummy variable; ɛ represents the error term.
A study by Shivaswamy et al. (2021) employed the use of the gravity model in determining the virtual water export and import of India based on data concerning the host country and its partners [20]. However, the export and import laws were applied, which is that exported virtual water from the host country is significantly dependent on its trade partners, but imported virtual water into the host country is dependent on the country itself [35]. This study, however, considered the features of both host and partner nations for either EVW or IVW, to confirm the validity of the law. Thus, Equation (8) is designed similarly to other studies [19,20]:
where variables with subscript G are related to Ghana, the host country; variables with subscript P are related to the partner countries; VW represents either EVW or IVW traded across the 30 years; G represents GDP per capita; D represents geographical distance; P represents population; L represents arable land per capita; U represents crop water use; A represents a continental dummy variable (whether country is African or not); and ɛ represents their error term.
3. Results
3.1. CWU Trend of Cereals
The calculated VWCs for the cereals indicated 3764 m3/t for rice, 3420 m3/t for sorghum, 3154 m3/t for millet, and 2575 m3/t for maize. Despite this, maize had the highest amount of CWU over time, followed by rice, sorghum, and then millet. This is indicated in Figure 2. During the 30 years (1992–2021), an average of 3.98 billion m3/yr of water was used to produce maize, 1.60 billion m3/yr for rice, 1.04 billion m3/yr for sorghum, and 0.55 billion m3/yr for millet. This was compared to current data from the Water Footprint Assessment Tool (available at https://www.waterfootprintassessmenttool.org/ accessed on 15 May 2024), where maize was said to be produced with 3.1 billion m3/yr of water, 0.54 billion m3/yr for rice, 0.55 billion m3/yr for millet, and 1.2 billion m3/yr for sorghum [47]. This shows that maize, millet, and sorghum values were slightly similar except for rice.
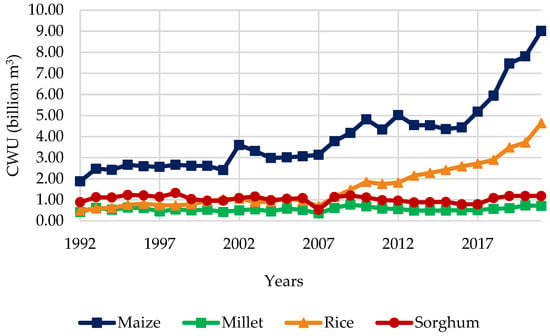
Figure 2.
CWU trend of major Ghanaian cereals.
Water use rates across the 30 years include 6% for maize, 4% for millet, 9% for rice, and 4% for sorghum per year. However, the period between 2017 and 2021, which shows a much more increased water use rate, indicates an average of 7.08 billion m3/yr for maize, 3.48 billion m3/yr for rice, 1.08 billion m3/yr for sorghum, and 0.63 billion m3/yr for millet production.
3.2. EVW, IVW, and NVW Trend of Cereals
The EVW and IVW trends of cereals both fluctuated. However, particularly after 2005, EVW indicated a more static fluctuating trend, whereas IVW indicated a slightly more increasing yet fluctuating trend. These are displayed in Figure 3 and Figure 4.
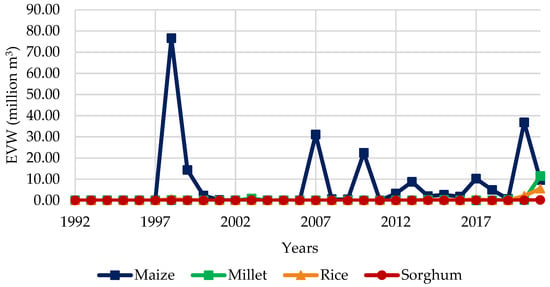
Figure 3.
EVW trend of major Ghanaian cereals.
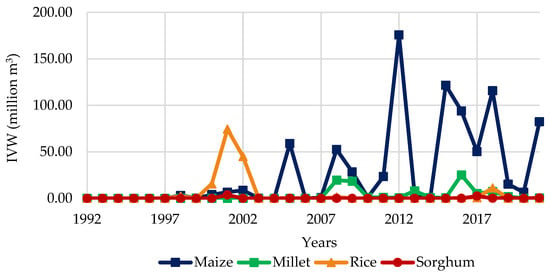
Figure 4.
IVW trend of major Ghanaian cereals.
Across the 30 years, maize resulted in the most EVW, averaging 7.63 million m3/yr (0.2% of Maize CWU). This was followed by millet (0.46 million m3/yr—0.08% of Millet CWU), rice (0.32 million m3/yr—0.02% of Rice CWU), and sorghum (0.01 million m3/yr—0.001% of Sorghum CWU). In the last 5 years, however, EVW was an average of 12.44 million m3/yr for maize, 2.43 million m3/yr for millet, 1.66 million m3/yr for rice, and 0.04 million m3/yr for sorghum.
In the same period, maize resulted in the most IVW, averaging 28.47 million m3/yr (0.7% of Maize CWU). This was again followed by millet (3.04 million m3/yr—0.5% more of Millet CWU), rice (5.10 million m3/yr—0.3% of Rice CWU), and sorghum (0.26 million m3/yr—0.03% of Sorghum CWU). In the last 5 years, however, IVW was an average of 54.03 million m3/yr for maize, 3.05 million m3/yr for millet, 2.42 million m3/yr for rice, and 0.75 million m3/yr for sorghum.
The amount of IVW for Ghana’s major cereals is more than EVW, indicating Ghana is a positive net cereal virtual water trade partner. This is shown in Figure 5.
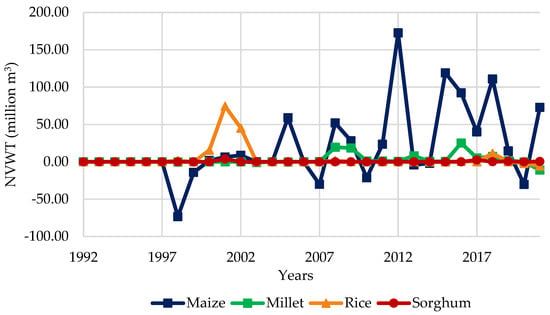
Figure 5.
NVWT trend of major Ghanaian cereals.
3.3. Partner Contributions to Ghana’s NVW (1992–2021)
Over the 30 years, Ghana traded cereals with multiple countries. Figure 6, Figure 7, Figure 8 and Figure 9 show how countries have contributed to Ghana’s net virtual water capacity with regard to cereals.
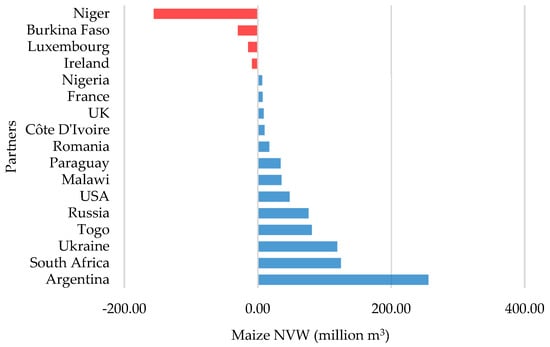
Figure 6.
Major maize NVW contributors.
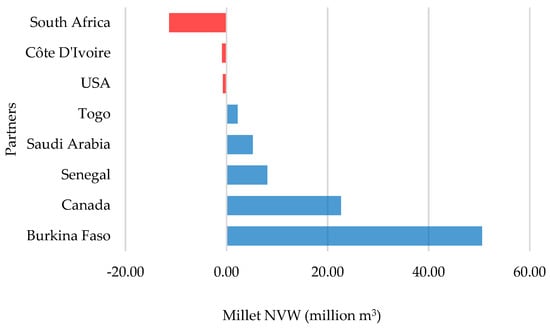
Figure 7.
Major millet NVW contributors.
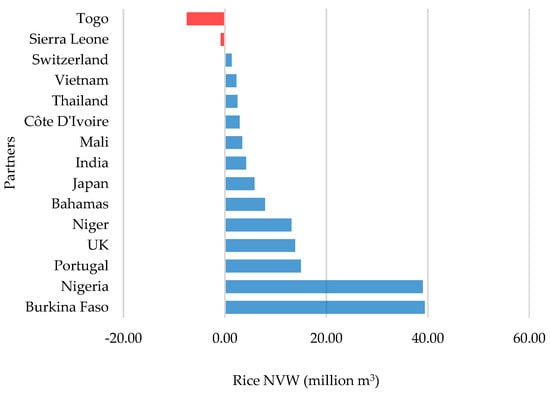
Figure 8.
Major rice NVW contributors.
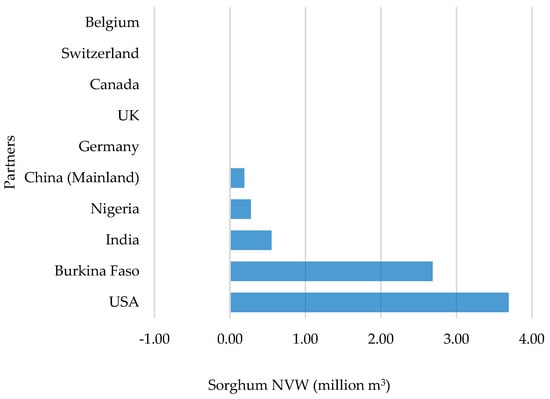
Figure 9.
Major sorghum NVW contributors.
Ghana exported most of its maize VW to Niger (156 million m3) and Burkina Faso (30 million m3/yr), but major import partners were Argentina (256 million m3/yr), South Africa (125 million m3/yr), Ukraine (119 million m3/yr), Togo (81 million m3/yr), and Russia (76 million m3/yr). For millet, Ghana lost most of its maize VW to South Africa (11 million m3/yr) but gained a greater part from Burkina Faso (51 million m3/yr), Canada (23 million m3/yr), and Senegal (8 million m3/yr).
In rice trade, Ghana exported mainly to Togo (8 million m3/yr) and Sierra Leone (0.8 million m3/yr) while deriving much more from Burkina Faso (39 million m3/yr), Nigeria (39 million m3/yr), Portugal (15 million m3/yr), UK (14 million m3/yr), and Niger (13 million m3/yr). Lastly, for sorghum, Ghana generally lost less than 0.01 million m3/yr of its VW per export partner but gained the most from the USA (3.7 million m3/yr) and Burkina Faso (2.7 million m3/yr).
3.4. Gravity Model Analysis
The gravity model was used to analyze 2250 cases, thus 30 years per 75 out of Ghana’s 79 cereal trade partners. Hong Kong, Taiwan, Pakistan, and Romania were excluded because of missing data. The method used was the panel least squares regression method, with the aid of the EViews v.10 software, defining cereal data as a total of maize, millet, rice, and sorghum in one. The results are displayed in Table 2 and Table 3.

Table 2.
EVW Gravity Model summary.

Table 3.
IVW Gravity Model summary.
Cereal EVW was significantly affected, in order of rank, by distance, partners’ population, partners’ land per capita, Ghana’s cereal water use, partners’ cereal water use, partners’ GDP, and Ghana’s land per capita. Insignificant factors included Ghana’s GDP, Ghana’s population, and whether the partner country is on the African continent or not. The results indicate that a 1% increase in EVW correlates with a 0.7% decrease in distance, 0.2% increase in partners’ population, 0.2% increase in partners’ land per capita, 1.5% increase in Ghana’s cereal water use, 0.03% increase in partners’ cereal water use, 0.1% increase in partners’ GDP, and 3.2% increase in Ghana’s land per capita.
In addition, cereal IVW was significantly affected, in order of rank, by distance, Ghana’s population, partners’ population, partner’s GDP, partners’ land per capita, Ghana’s GDP, and Ghana’s cereal water use. Insignificant factors included Ghana’s land per capita, partners’ cereal water use, and whether Ghana’s partner is on the African continent or not. The results indicate that a 1% increase in IVW correlates with a 0.9% decrease in distance, 7.9% increase in Ghana’s population, 0.6% increase in partners’ population, 0.4% increase in partner’s GDP, 0.2% increase in partners’ land per capita, 0.8% decrease in Ghana’s GDP, and 1.3% decrease in Ghana’ cereal water use.
4. Discussion
4.1. Ghana’s Cereal Water Use, Import, and Export
Despite maize requiring the least water per ton for production among the cereals, it has used the most water over the period. Its trade has also resulted in more imported virtual water as compared to other cereals. Even rice, which is known to have the highest yields amongst the four cereals due to a surge in the use of agrochemicals to improve productivity, uses much less water than maize in total [48]. On the other hand, millet and sorghum are cultivated for subsistence in the North and, hence, are not in high national demand [49]. This confirms that maize is the most highly demanded, produced, traded, and consumed cereal in Ghana, as mentioned in other studies [32,50]. Unfortunately, cereal yields in Ghana are quite below their potential [51,52]. More focus can be put into maize variety and yield development since maize uses the least water amount but is the most preferred cereal. This would greatly contribute to the nation’s food security in the existence of an ever-increasing Ghanaian population.
In comparison with the Water Footprint Network (WFN) dataset, there is a decent correlation between maize, sorghum, and millet WF values but not rice [47]. According to the WFN’s Water Footprint Assessment Tool (WFAT), rice has used much less water than sorghum, but similar to millet. This is likely due to the assumed VWC values. It is not clear what exact input values were used for computation by the WFAT, but for better validity of WF/VWC results, it is recommended that VWC values be directly derived from more accurate crop water requirement (CWR) and yield calculations [53]. Thus, results from WF studies can be enhanced with a dependency on primary data.
Having a surplus in net virtual water trade can have economic benefits for less developed countries [54]. Even though Ghana has used more and more water for cereal production over the years, this study’s results indicate that it is also a net importer of cereal water from other countries. This implies that even amidst low cereal productivity, Ghana is currently able to conserve its water resources in the production of cereals and has a large potential to enhance cereal food security domestically.
However, in terms of water resources, Ghana has sufficient water and groundwater systems [55] and yet suffers potential water scarcity due to pollution from chemicals, mining, waste, improper agricultural activities, and climate change [56]. Comparing the 30-year and 5-year averages of EVW and IVW also describes sharply increasing rates of cereal virtual water use, imports, and exports. These increasing rates suggest a greater consumption of water, which does not correlate as much with cereal yields [30]. Considering this, it is important to ensure that the concern of a projected increase in cereal water use and net virtual water imports can be countered with water resource restoration projects and a massive improvement in yield via sustainable practices to further promote water and food security.
4.2. Factors Influencing Ghana’s Cereal VWT
This study also confirms the significance and validity of the gravity model, which explains that GDP and distance are fundamental factors of trade [19]. However, it does not fully affirm the import and export laws mentioned in other studies, where only partner factors are considered significant for EVW analysis, and only host country factors are significant for IVW analysis [20,35]. It is shown that a few host country factors still influenced EVW, and some partner country factors influenced IVW. Together, both components of VWT indicate that the geographical distance, GDP, population, land per capita, and cereal water use are significant factors, as discovered in similar findings and displayed in Table 1.
Ghana is considered one of the fastest-growing economies in Africa [57,58]. In that light, Ghana is continuously more promising as a trade partner. It is therefore prudent to form trade policies or prospects based on Ghana’s and its partner’s GDP per capita, population, land per capita, and water use amounts per crop. This should help to foster alliances that benefit both countries economically whilst conserving both nations’ water resources. Practically, since some developed countries may use more water to produce sorghum and millet, Ghana could increase production and export them, building on its comparative advantage if possible. This still has to be performed sustainably using production resources, especially water.
Based on the high insignificance of whether or not a partner country is in the African continent, it is ascertained that Ghana’s cereal trade involves a diverse group of countries. Thus, the country has the potential to build trade alliances across the globe but will need to improve trade consistency since data show that trade with the various partners over the 30 years was generally sparse and not frequent.
4.3. Model Limitations
The Gravity Model derived for Ghana’s VWT indicates which factors have a significant effect on EVW and IVW. Nonetheless, the model can explain 8% of the variation in EVW and 14% of the variation in IVW despite having high significance based on p and F statistic values from Table 2 and Table 3. This is much lower than in other studies by Shivaswamy et al. (2021) [20], where EVW variation was between 52% and 66%, IVW variation was between 52 and 86%, and by Tamea et al. (2014) [35], where EVW variation was 57% and IVW variation was 47%. This is likely a result of data size and quality since the study focused on only four cereals. In comparison, the two aforementioned studies focused on India’s major food crops and international food crops, respectively.
In Ghana’s case, as a smaller-sized developing country in Africa, trade flows between each partner country were not as frequent over time. For example, large amounts of VWT could occur between Ghana and one country in just a few instances over 30 years. As such, it would be difficult to draw effective conclusions per that country. Insufficient data points lead to low Adjusted R2 values. Hence, more data points are needed to improve model fit and provide a clearer picture [59]. Focusing on larger food groups or food crop trade as a whole and considering the possible influence of other factors could provide a more reliable model explanation.
5. Conclusions
Cereal grains are very significant to nutrition in developing countries and very critical to achieving global food security. Analyzing how water usage patterns vary across different locations and over time can help develop strategies to optimize the use of water resources. This study provides insight into water use and trade related to Ghanaian cereal production between 1992 and 2021.
In the last 5 years, average CWU, EVW, and IVW amounts have been much higher compared to the 30-year average. Ghana has a more significant number of IVW partners than EVW partners and is hence considered a net cereal virtual water importer. Since maize uses the least water but is the most preferred cereal, more focus can be put on maize variety and yield development. Water resource restoration projects and improved yields through sustainable practices are required to deal with the projected increase in cereal water use and net virtual water imports.
The Gravity Model derived for Ghana’s VWT can explain 8% of the variation in EVW and 14% of the variation in IVW. Larger and more consistent trade datasets could, however, help improve model reliability. VWC calculations could be based on more recently recorded weather and yield data as well. Considering independent factors of both host and partner countries in either IVW or EVW analysis can still be key to a better understanding of VWT. The analysis indicates that the geographical distance, GDP per capita, population, land per capita, and cereal water use are significant factors of IVW and EVW, as reported in other studies. Ghana is encouraged to foster sustainable trade alliances for its benefit and that of its partners whilst conserving both nations’ water resources.
Author Contributions
Conceptualization, A.S.K.T., G.O., M.J.A., B.A. and K.-S.C.; methodology, A.S.K.T., G.O., M.J.A. and B.A.; software, A.S.K.T.; validation, G.O., M.J.A. and B.A.; formal analysis, A.S.K.T.; investigation, A.S.K.T.; resources, K.-S.C.; data curation, A.S.K.T.; writing—original draft preparation, A.S.K.T.; writing—review and editing, G.O., M.J.A., B.A. and K.-S.C.; visualization, A.S.K.T.; supervision, K.-S.C. All authors have read and agreed to the published version of the manuscript.
Funding
This research received no external funding.
Data Availability Statement
The raw data supporting the conclusions of this article will be made available by the authors upon request.
Acknowledgments
This research was supported by guidance and training from the Institute of International Research & Development (IIRD) at the Kyungpook National University (KNU) through the KOICA Scholarship Program. We extend our sincerest appreciation for the support and guidance toward being part of the academic community to aid our countries’ development.
Conflicts of Interest
The authors declare no conflicts of interest.
References
- Giraldo, P.; Benavente, E.; Manzano-Agugliaro, F.; Gimenez, E. Worldwide Research Trends on Wheat and Barley: A Bibliometric Comparative Analysis. Agronomy 2019, 9, 352. [Google Scholar] [CrossRef]
- Grigg, D. The Starchy Staples in World Food Consumption. Ann. Assoc. Am. Geogr. 1996, 86, 412–431. [Google Scholar] [CrossRef]
- Poutanen, K.S.; Kårlund, A.O.; Gómez-Gallego, C.; Johansson, D.P.; Scheers, N.M.; Marklinder, I.M.; Eriksen, A.K.; Silventoinen, P.C.; Nordlund, E.; Sozer, N.; et al. Grains—A Major Source of Sustainable Protein for Health. Nutr. Rev. 2022, 80, 1648–1663. [Google Scholar] [CrossRef] [PubMed]
- World Bank. World Bank Open Data. Available online: https://data.worldbank.org/ (accessed on 25 January 2024).
- Dai, Z.; Peng, L.; Qin, S. Experimental and Numerical Investigation on the Mechanism of Ground Collapse Induced by Underground Drainage Pipe Leakage. Environ. Earth Sci. 2024, 83, 32. [Google Scholar] [CrossRef]
- Bhattarai, K.; Budd, D. Effects of Rapid Urbanization on the Quality of Life. In Multidimensional Approach to Quality of Life Issues: A Spatial Analysis; Springer: Singapore, 2019; pp. 327–341. [Google Scholar] [CrossRef]
- Twumasi, G.B.; Junaid, A.M.; Shin, Y.; Choi, K.S. Prediction of Corn Yield Based on Different Climate Scenarios Using Aquacrop Model in Dangme East District of Ghana. J. Korean Soc. Agric. Eng. 2017, 59, 71–79. [Google Scholar] [CrossRef]
- Yamba, E.I.; Aryee, J.N.A.; Quansah, E.; Davies, P.; Wemegah, C.S.; Osei, M.A.; Ahiataku, M.A.; Amekudzi, L.K. Revisiting the Agro-Climatic Zones of Ghana: A Re-Classification in Conformity with Climate Change and Variability. PLoS Clim. 2023, 2, e0000023. [Google Scholar] [CrossRef]
- Hu, Q.; Zhao, Y.; Hu, X.; Qi, J.; Suo, L.; Pan, Y.; Song, B.; Chen, X. Effect of Saline Land Reclamation by Constructing the “Raised Field -Shallow Trench” Pattern on Agroecosystems in Yellow River Delta. Agric. Water Manag. 2022, 261, 107345. [Google Scholar] [CrossRef]
- Evans, J.R.; Lawson, T. From Green to Gold: Agricultural Revolution for Food Security. J. Exp. Bot. 2020, 71, 2211–2215. [Google Scholar] [CrossRef] [PubMed]
- Raheem, D.; Dayoub, M.; Birech, R.; Nakiyemba, A. The Contribution of Cereal Grains to Food Security and Sustainability in Africa: Potential Application of UAV in Ghana, Nigeria, Uganda, and Namibia. Urban Sci. 2021, 5, 8. [Google Scholar] [CrossRef]
- Odey, G.; Adelodun, B.; Lee, S.; Adeyemi, K.A.; Cho, G.; Choi, K.S. Environmental and Socioeconomic Determinants of Virtual Water Trade of Grain Products: An Empirical Analysis of South Korea Using Decomposition and Decoupling Model. Agronomy 2022, 12, 3105. [Google Scholar] [CrossRef]
- Hoekstra, A.Y.; Hung, P.Q. Virtual Water Trade: A Quantification of Virtual Water Flows between Nations in Relation to International Crop Trade, International Institute for Infrastructural Hydraulic and Environmental Engineering (IHE Delft), Netherlands. 2002. Available online: https://www.waterfootprint.org/resources/Report11.pdf (accessed on 15 November 2023).
- Odey, G.; Adelodun, B.; Adeyi, Q.; Hammed, A.A.; Abiodun, S.R.; Choi, K.S. Quantifying Resource Nexus: Virtual Water Flows, Water Stress Indices, and Unsustainable Import Fraction in South Korea’s Grain Trade Landscape. Sustainability 2024, 16, 2419. [Google Scholar] [CrossRef]
- Sikka, A.K.; Alam, M.F.; Mandave, V. Agricultural Water Management Practices to Improve the Climate Resilience of Irrigated Agriculture in India. Irrig. Drain. 2022, 71, 7–26. [Google Scholar] [CrossRef]
- Liu, J.; Wang, Y.; Li, Y.; Peñuelas, J.; Zhao, Y.; Sardans, J.; Tetzlaff, D.; Liu, J.; Liu, X.; Yuan, H.; et al. Soil Ecological Stoichiometry Synchronously Regulates Stream Nitrogen and Phosphorus Concentrations and Ratios. Catena 2023, 231, 107357. [Google Scholar] [CrossRef]
- Chen, J.; Wang, H.; Yin, W.; Wang, Y.; Lv, J.; Wang, A.J. Deciphering Carbon Emissions in Urban Sewer Networks: Bridging Urban Sewer Networks with City-Wide Environmental Dynamics. Water Res. 2024, 256, 121576. [Google Scholar] [CrossRef]
- Lafta, N.; Al-Bazi, A. Modelling Influential Factor Relationships Using System Dynamics Methodology (Fibre Cement Buildings as a Case Study). 2013. pp. 3–5. Available online: https://core.ac.uk/download/pdf/228143206.pdf (accessed on 19 July 2024).
- Krisztin, T.; Fischer, M.M. The Gravity Model for International Trade: Specification and Estimation Issues. Spat. Econ. Anal. 2015, 10, 451–470. [Google Scholar] [CrossRef]
- Shivaswamy, G.P.; Kallega, H.K.; Anuja, A.R.; Singh, K.N. An Assessment of India’s Virtual Water Trade in Major Food Products. Agric. Econ. Res. Rev. 2021, 34, 133–141. [Google Scholar] [CrossRef]
- Odey, G.; Adelodun, B.; Kim, S.H.; Choi, K.S. Conflicting Drivers of Virtual Water Trade: A Review Based on the “Virtual Water Concept”. Water Econ. Policy 2021, 7, 2150011. [Google Scholar] [CrossRef]
- Hu, C.; Dong, B.; Shao, H.; Zhang, J.; Wang, Y. Toward Purifying Defect Feature for Multilabel Sewer Defect Classification. IEEE Trans. Instrum. Meas. 2023, 72, 1–11. [Google Scholar] [CrossRef]
- Majnooni, S.; Fooladi, M.; Nikoo, M.R.; Al-Rawas, G.; Haghighi, A.T.; Nazari, R.; Al-Wardy, M.; Gandomi, A.H. Smarter Water Quality Monitoring in Reservoirs Using Interpretable Deep Learning Models and Feature Importance Analysis. J. Water Process Eng. 2024, 60, 105187. [Google Scholar] [CrossRef]
- Zhang, K.; Li, Y.; Yu, Z.; Yang, T.; Xu, J.; Chao, L.; Ni, J.; Wang, L.; Gao, Y.; Hu, Y.; et al. Xin’anjiang Nested Experimental Watershed (XAJ-NEW) for Understanding Multiscale Water Cycle: Scientific Objectives and Experimental Design. Engineering 2022, 18, 207–217. [Google Scholar] [CrossRef]
- Bawa, A.; Senay, G.B.; Kumar, S. Regional Crop Water Use Assessment Using Landsat-Derived Evapotranspiration. Hydrol. Process. 2021, 35, e14015. [Google Scholar] [CrossRef]
- Jiang, Y.; Li, J.; Zuo, R.; Sun, C.; Zhai, Y.; Tian, L.; Dai, W.; Wang, S.; Shang, Z.; Liu, Y.; et al. The Transmission of Isotopic Signals from Precipitation to Groundwater and Its Controls: An Experimental Study with Soil Cylinders of Various Soil Textures and Burial Depths in a Monsoon Region. J. Hydrol. 2024, 631, 130746. [Google Scholar] [CrossRef]
- Odey, G.; Adelodun, B.; Lee, S.; Adeyi, Q.; Choi, K.S. Assessment of the Factors Shaping the Public’s Perception of Physical and Virtual Water: A Case Study of Korean Households. Environ. Sci. Policy 2024, 151, 103629. [Google Scholar] [CrossRef]
- Bessah, E.; Amponsah, W.; Ansah, S.O.; Afrifa, A.; Yahaya, B.; Wemegah, C.S.; Tanu, M.; Amekudzi, L.K.; Agyare, W.A. Climatic Zoning of Ghana Using Selected Meteorological Variables for the Period 1976–2018. Meteorol. Appl. 2022, 29, e2049. [Google Scholar] [CrossRef]
- Ghana Statistical Service (GSS). Ghana Factsheet. Available online: https://statsghana.gov.gh/ghfactsheet.php (accessed on 26 January 2024).
- FAOSTAT. Data—Food and Agriculture Organization of the United Nations. Available online: https://www.fao.org/faostat/en/#data (accessed on 9 January 2024).
- CCKP. Ghana—Climatology. Climate Change Knowledge Portal—World Bank Group. Available online: https://climateknowledgeportal.worldbank.org/country/ghana/climate-data-historical#:~:text=The northern part of the,minor from September to November (accessed on 26 January 2024).
- Darfour, B.; Rosentrater, K.A. Grain Cultivation and Its Associated Problems: Overview of Ghana. In 2016 American Society of Agricultural and Biological Engineers Annual International Meeting, ASABE 2016; American Society of Agricultural and Biological Engineers (ASABE): St. Joseph, MI, USA, 2016. [Google Scholar] [CrossRef]
- Chapagain, A.K.; Hoekstra, A.Y. Water Footprints of Nations: Volume 1—Main Report; UNESCO-IHE: Delft, The Netherlands, 2004; Available online: https://www.waterfootprint.org/resources/Report16Vol1.pdf (accessed on 15 November 2023).
- Mekonnen, M.M.; Hoekstra, A.Y. The Green, Blue and Grey Water Footprint of Crops and Derived Crop Products. Hydrol. Earth Syst. Sci. 2011, 15, 1577–1600. [Google Scholar] [CrossRef]
- Tamea, S.; Carr, J.A.; Laio, F.; Ridolfi, L. Drivers of the Virtual Water Trade. Water Resour. Res. 2014, 50, 17–28. [Google Scholar] [CrossRef]
- Akoto-Danso, E.K.; Karg, H.; Drechsel, P.; Nyarko, G.; Buerkert, A. Virtual Water Flow in Food Trade Systems of Two West African Cities. Agric. Water Manag. 2019, 213, 760–772. [Google Scholar] [CrossRef]
- Ramirez-Vallejo, J.; Rogers, P. Virtual Water Flows and Trade Liberalization. Water Sci. Technol. 2004, 49, 25–32. [Google Scholar] [CrossRef]
- Liu, J.; Wu, P.; Wang, Y.; Zhao, X.; Sun, S.; Cao, X. Virtual Water Flows Related to Grain Crop Trade and Their Influencing Factors in Hetao Irrigation District, China. J. Agric. Sci. Technol. 2015, 17, 201–211. [Google Scholar]
- Duarte, R.; Pinilla, V.; Serrano, A. Understanding Agricultural Virtual Water Flows in the World from an Economic Perspective: A Long Term Study. Ecol. Indic. 2016, 61, 980–990. [Google Scholar] [CrossRef]
- Duarte, R.; Pinilla, V.; Serrano, A. Long Term Drivers of Global Virtual Water Trade: A Trade Gravity Approach for 1965–2010. Ecol. Econ. 2019, 156, 318–326. [Google Scholar] [CrossRef]
- Garcia, S.; Mejia, A. Characterizing and Modeling Subnational Virtual Water Networks of US Agricultural and Industrial Commodity Flows. Adv. Water Resour. 2019, 130, 314–324. [Google Scholar] [CrossRef]
- Schwarz, J.; Mathijs, E.; Maertens, M. A Dynamic View on Agricultural Trade Patterns and Virtual Water Flows in Peru. Sci. Total Environ. 2019, 683, 719–728. [Google Scholar] [CrossRef]
- Zhao, D.; Hubacek, K.; Feng, K.; Sun, L.; Liu, J. Explaining Virtual Water Trade: A Spatial-Temporal Analysis of the Comparative Advantage of Land, Labor and Water in China. Water Res. 2019, 153, 304–314. [Google Scholar] [CrossRef]
- Qian, Y.; Tian, X.; Geng, Y.; Zhong, S.; Cui, X.; Zhang, X.; Moss, D.A.; Bleischwitz, R. Driving Factors of Agricultural Virtual Water Trade between China and the Belt and Road Countries. Environ. Sci. Technol. 2019, 53, 5877–5886. [Google Scholar] [CrossRef]
- Wang, J.; Qin, L.; He, H. Assessing Temporal and Spatial Inequality of Water Footprint Based on Socioeconomic and Environmental Factors in Jilin Province, China. Water 2019, 11, 521. [Google Scholar] [CrossRef]
- Kembhavi, A.; Khare, P. Gravity: The Force That Governs the Universe. In Gravitational Waves; Springer: Singapore, 2020. [Google Scholar] [CrossRef]
- WFN. Water Footprint Assessment Tool—Water Footprint Network. Available online: https://www.waterfootprintassessmenttool.org/ (accessed on 15 May 2024).
- Addai, K.N.; Ng’ombe, J.N.; Kaitibie, S. A Dose–Response Analysis of Rice Yield to Agrochemical Use in Ghana. Agriculture 2022, 12, 1527. [Google Scholar] [CrossRef]
- Kudadjie, C.Y.; Struik, P.C.; Richards, P.; Offel, S.K. Assessing Production Constraints, Management and Use of Sorghum Diversity in North-East Ghana: A Diagnostic Study. NJAS Wagening. J. Life Sci. 2004, 52, 371–391. [Google Scholar] [CrossRef][Green Version]
- Abdulai, S.; Nkegbe, P.K.; Donkor, S.A. Assessing the Economic Efficiency of Maize Production in Northern Ghana. Ghana J. Dev. Stud. 2017, 14, 123–145. [Google Scholar] [CrossRef]
- GYGA. Ghana: Agriculture in Ghana. Global Yield Gap Atlas (GYGA): University of Nebraska-Lincoln, Wagnigen University & Research. Available online: https://www.yieldgap.org/Ghana#:~:text=There are six agro-ecological,southwest corner of the country (accessed on 25 January 2024).
- Boullouz, M.; Bindraban, P.S.; Kissiedu, I.N.; Kouame, A.K.K.; Devkota, K.P.; Atakora, W.K. An Integrative Approach Based on Crop Modeling and Geospatial and Statistical Analysis to Quantify and Explain the Maize (Zea Mays) Yield Gap in Ghana. Front. Soil Sci. 2022, 2, 1037222. [Google Scholar] [CrossRef]
- Hoekstra, A.Y.; Chapagain, A.Y.; Aldaya, M.M.; Mekonnen, M.M. The Water Footprint Assessment Manual: Setting the Global Standard; Earthscan: London, UK; Washington, DC, USA, 2011; Available online: https://waterfootprint.org/resources/TheWaterFootprintAssessmentManual_English.pdf (accessed on 15 November 2023).
- Sinha, J.; Sharma, A.; Marshal, L. Hyrodrological Sustainablity of International Virtual Water Trade. Environ. Res. Lett. 2023, 18, 124037. [Google Scholar] [CrossRef]
- Agodzo, S.K.; Bessah, E.; Nyatuame, M. A Review of the Water Resources of Ghana in a Changing Climate and Anthropogenic Stresses. Front. Water 2023, 4, 973825. [Google Scholar] [CrossRef]
- Owusu, P.A.; Asumadu-Sarkodie, S.; Ameyo, P. A Review of Ghana’s Water Resource Management and the Future Prospect. Cogent Eng. 2016, 3, 1164275. [Google Scholar] [CrossRef]
- Dwumfour, E.Y.; Li, W. A Review of International Trade and Ghana’s Economic Growth Amidst the COVID-19 Pandemic. Int. J. Acad. Res. Bus. Soc. Sci. 2020, 10, 651–659. [Google Scholar] [CrossRef]
- Osei, E. The Impact of Manufacturing Industries on Ghana’s Economy. Int. J. Res. Stud. Manag. 2017, 6, 73–94. [Google Scholar] [CrossRef]
- Barch, D.M. The Dangers of Small Samples and Insufficient Methodological Detail. Schizophr. Bull. 2023, 49, 5–6. [Google Scholar] [CrossRef]
Disclaimer/Publisher’s Note: The statements, opinions and data contained in all publications are solely those of the individual author(s) and contributor(s) and not of MDPI and/or the editor(s). MDPI and/or the editor(s) disclaim responsibility for any injury to people or property resulting from any ideas, methods, instructions or products referred to in the content. |
© 2024 by the authors. Licensee MDPI, Basel, Switzerland. This article is an open access article distributed under the terms and conditions of the Creative Commons Attribution (CC BY) license (https://creativecommons.org/licenses/by/4.0/).