1. Introduction
In line with the energy transition precepts and electrical matrices decarbonization targets, several countries have encouraged the expansion of their matrices by promoting the insertion of renewable sources. In 2023, there was a 13,9% increase in the installed capacity of renewable energy plants worldwide, amounting to a growth of 346 GW [
1].
Despite clean energy characteristics, renewable sources such as wind and solar power plants exhibit high production variability, as they are dependent on weather conditions such as wind speed and solar irradiation, which occur intermittently. Consequently, the increasing implementation of such renewable sources leads to a heightened need for resources that provide operational flexibility to the system, enabling it to meet demand fluctuations in a timely manner [
2,
3].
Among the possibilities for increasing an electrical system’s operational flexibility, the expansion of thermal power capacity [
4] and the enhancement of interconnection between systems [
5] are typically adopted solutions. However, the proposal to increase thermal power capacity contradicts sustainability goals by raising the consumption of fossil fuels in the energy mix, while the option of enhancing transmission capacity aids in resource sharing among regions but does not result in an increase in the overall system capacity. In situations where the global resource is insufficient, bolstering the interconnection between systems will be ineffective.
One alternative involves exploiting the complementary profiles of diverse sources in the composition of hybrid projects. The authors of [
6] demonstrate that the addition of a photovoltaic solar power plant (SPP) at the Sobradinho Hydropower Plant (HPP), located in the northeast of Brazil, can generate a significant amount of power using an area less than 0.5% of the reservoir’s surface. The authors of [
7] suggest that the complementarity between solar and wind sources, coupled with the use of a storage system in a hybrid project to be installed in the northeast of Brazil, can lead to an 11% reduction in the necessary transmission capacity for the transmission line.
In addition to reducing the production variability of intermittent sources and increasing operational flexibility, the composition of hybrid projects leads to greater efficiency in transmission usage agreements due to the complementary hourly and seasonal profiles between the sources (which result in joint production with less variation). Thus, where regulation allows, it is possible to optimize the contracting of flow capacity due to the reduction in idleness resulting from hourly variation in generation. Benefits to investors can also be highlighted, such as reduced associated risk (due to a more stable generation profile) and lower investment, operation, and maintenance costs due to the sharing of land; infrastructure; connections to the interconnected grid; and control, maintenance, and operation teams.
Given the benefits arising from the composition of hybrid power plants, different countries have promoted regulatory adjustments in recent years to pave the way for the insertion of these types of plants in their markets, and they currently stand out in terms of installed capacity. These are the cases of China, the USA, Australia, and India [
8,
9,
10,
11]. Among the examples, the Chinese project Kela stands out, considered the largest hydro–solar hybrid project under construction in the world, with an expected capacity of 3 GW [
12].
In Brazil, due to the large installed capacity of existing hydropower plants (108 GW) and the high availability of solar resources, the composition of hydro–solar hybrid plants is understood as an important combination to be explored, which would lead to important savings in terms of management of hydropower plants reservoirs and use of the grid.
Some studies in the literature assess the benefits of the joint operation of a hydropower plant with an intermittent generation source. For example, in [
13], the authors analyze the complementarity in the joint operation of a hydropower plant and a wind power plant installed close to each other, in a hybrid composition, in Argentina. Their study concludes that managing the power output of the projects in a combined and complementary manner results in significant reductions in wind energy curtailment, thereby increasing the efficiency of transmission line usage.
In [
14], it is verified that the installation of a floating solar power plant in a 2.8% area of the Santa Branca hydropower plant reservoir, in Brazil, would add about 50% to historical generation over 20 years, resulting in a total of 5.90 TWh for the entire period. Despite proposing the use of energy complementarity between hydro and solar sources through hybrid composition, considering the historical data and the addition of the solar plant, the study presents how some regulatory and operation rules gaps could be circumvented, such as the challenges arising from not considering the optimization of hydroelectric generation and, as a result, not obtaining a signal for the best moment for energy generation or examining the impact only on one reservoir and not on a cascade.
Aiming to contribute with innovations and originalities in relation to studies on this highlighted topic, our article presents a model for optimizing the generation of a hybrid plant composed of hydro–solar power plants and measuring the benefits for the reservoir operation of the hybridized plant and the other hydropower plants in the cascade.
The remainder of this paper is structured as follows:
Section 2 describes the proposed hydro–solar optimization model,
Section 3 presents the case study, and
Section 4 provides the final discussion.
2. Model Description
This section presents an energy system management model for hybrid plants composed of hydro and solar sources, aiming to optimize joint operation and measure the operational consequences at the local level and in the cascade. The benefits of the hydro–solar association are considered in terms of generation and reservoir conditions (level, volume, and spillage).
Figure 1 illustrates the general schematic of the modeled problem involving the hybridization of a hydropower plant (HPP) with a solar power plant (SPP), belonging to a cascade with other hydropower plants.
The model aims to maximize the generation of the hybrid plant (Equation (1)) based on hourly price signals and the natural flow conditions of the cascade, conditioned by the capacity to inject the energy produced by the group into the grid and the operating restrictions of all hydropower plants belonging to the cascade.
where
defines the power supplied to the grid [MW] for a specific power plant (p), depending on the day (d), month (m), and hour (h).
is the monthly average spot price [BRL/MW].
is spot price modulation characteristic of the day (d), month (m), and hour (h) [%].
represents a typology for days, where the model simplifies the number of days to be simulated each month. This reduction decreases the total number of equations required. In this study, the problem is approached by categorizing each month into two typical days: workdays and non-workdays.
is the total number of hours of the same typical days in each month.
is the monthly interest rate.
In Equation (1), the only decision variable is the power supplied to the grid. This variable is constrained to be greater than zero and less than [MW], which represents the maximum network capacity for a specific power plant (p). All other terms are parameters of the problem.
Equation (2) is used to determine the composition of the power supplied to the grid.
where
represents the input of the modulated photovoltaic power [MW]. It is important to note that there is no differentiation in the typical day values within the month.
represents the hydroelectric power [MW], which is defined for, at most, four different types of turbines within the same hydroelectric power plant (HPP). The variable
denotes the number of identical turbines per set, simplifying the number of constraints.
The most important hourly decision variable is the turbine flow
[m
3/s]. These variables determine
, as shown in Equation (3).
where
is the hydroelectric power plant (p) productivity
.
is height of water fall from the hydroelectric power plant (p), in the month (m) [m].
In addition, the model represents the operation of all hydropower plants within the cascade for all the simulation horizons, thereby creating spatial coupling and temporal coupling. The design also incorporates a mechanism to link hourly values to monthly values.
The spatial coupling by the set of constraints is expressed in Equation (4).
where
defines the inflow discharge [m
3s], which is an input parameter for the model, and
represents the incremental flow [m
3s].
is the outflow discharge [m
3s].
denotes the set of upstream HPP. The constraints defining
are shown in Equation (5) in such a manner that
defines the monthly spillage [m
3/s] and
turbined flow [m
3/s].
Temporal coupling is ensured by the constraints in Equations (6) and (7).
where
defines the initial volume of the HPP reservoir [hm
3] for each HPP and month. The model ensures that the initial volume matches the previous month’s final volume (
). For the first and last months, the model utilizes user-provided input values.
The volumes are linked to the flow variables in Equation (7), where accounts for an estimated evaporated volume, and represents the number of seconds of each month multiplied by .
The model operates on a monthly scale while also considering hourly values. These hourly values are simplified using the premise of two typical days. Within the model, a dedicated section ensures that the decision variables for monthly and hourly scales are linked. These links are defined by three main formulas, i.e., Equations (8)–(10).
Equations (8)–(10) ensure the monthly decisions variables , , and are constrained by the weighted average values of the corresponding hourly variables.
3. The Brazilian Electric Power System Overview
The Brazilian electricity power system had 223 GW of installed capacity in 2024, where hydropower plants represented 48.5% of the total installed capacity. The hydropower predominance implies that the medium-term planning and the short-term system operation depend on affluence’s stochastic behaviors.
Also, given the fact that several hydropower plants from different owners are in the same river, and many of the reservoirs are multiannual, the combined effect of those characteristics led to a regulatory decision (made several years ago) that the generation dispatch in Brazil should be centralized (centralized dispatch model). In this model, the decision of how much each power plant generates at any given time is made by the national system operator, in a process in which the goal is the optimization of hydro resources. Note that in such a centralized dispatch model, not all hydropower plants’ concession holders have the autonomy to manage water storage in their reservoirs due to the operational planning rules of the national system (for more detail on hydroelectric operation and dispatch in the Brazilian National Interconnected System, see [
15]).
The Brazilian Independent System Operator uses optimization models, termed NEWAVE for medium-term planning and DECOMP for short-term operation, to find the generating plants’ dispatch that minimizes the system operating cost. The problem formulation considers future water inflows to river basins, as well as the stored water at system reservoirs, demand forecasts, thermal power plant operating costs, and operational restrictions. Furthermore, the models calculate the system’s SRMC (short-range marginal cost), which represents the spot price on the Brazilian electricity market after a cap and floor applied by the electric energy clearing chamber (CCEE). More information about the mathematical formulation, as well as the restrictions applied in the Brazilian centralized dispatch models, can be found in [
16,
17,
18,
19].
However, the official models currently consider renewable source generation in a deterministic manner, and in monthly planning, these sources are directly deducted from the load. Furthermore, the official models are not able to simulate hybrid power plant operation, and thus, when considering the participation of hydropower plants in the hybrid arrangement, it becomes necessary to develop a model capable of representing its individual and cascade operation, responding to the system operator’s commands (economic signal).
Therefore, for a detailed representation of the association of a hydropower plant with a solar power plant, as proposed in this study, it is necessary to represent the hybrid operation based on customized models, which is the case of the model presented and analyzed in this article.
4. Case Study
4.1. Description
For the case study, we considered the hybridization of the Promissão HPP located in the Tietê River cascade, which comprises seven HPPs (including three run-of-river hydropower plants), as presented in
Figure 2.
To estimate the benefits arising from the hybridization of the Promissão HPP, four cases were studied as described below and summarized in
Table 1:
Case 1: Promissão HPP operating under current conditions (without association with SPP);
Case 2: Promissão HPP with an association of a 60 MW SPP;
Case 3: Promissão HPP with an association of a 60 MW SPP and an additional 60 MW network throughput contract;
Case 4: Promissão HPP with an association of a 200 MW SPP and an additional 200 MW network throughput contract.
Case 1 represents the “business as usual” situation (reference case). The total generation in this case is defined as the generation required by the operator dispatch. This amount represents the sum that must be met in the other cases (Cases 2, 3, and 4), where the SPP installed capacity and network capacity are sensitized.
As the three cases aim to meet the reference dispatch (Case 1), SPP’s participation in the hybrid plant configuration tends to change the reservoirs’ conditions, since its generation will contribute to the cascade generation, thus facilitating water savings.
The simulation horizon spans from January 2024 to December 2028. To counteract the natural characteristic of hydrothermal optimization models, where reservoirs are drained to the lowest possible level at the end of the simulated horizon, the problem is constrained to ensure that the volume at the end of the 60 months is equal to the initial volume at the start of the simulation.
4.2. Scenarios
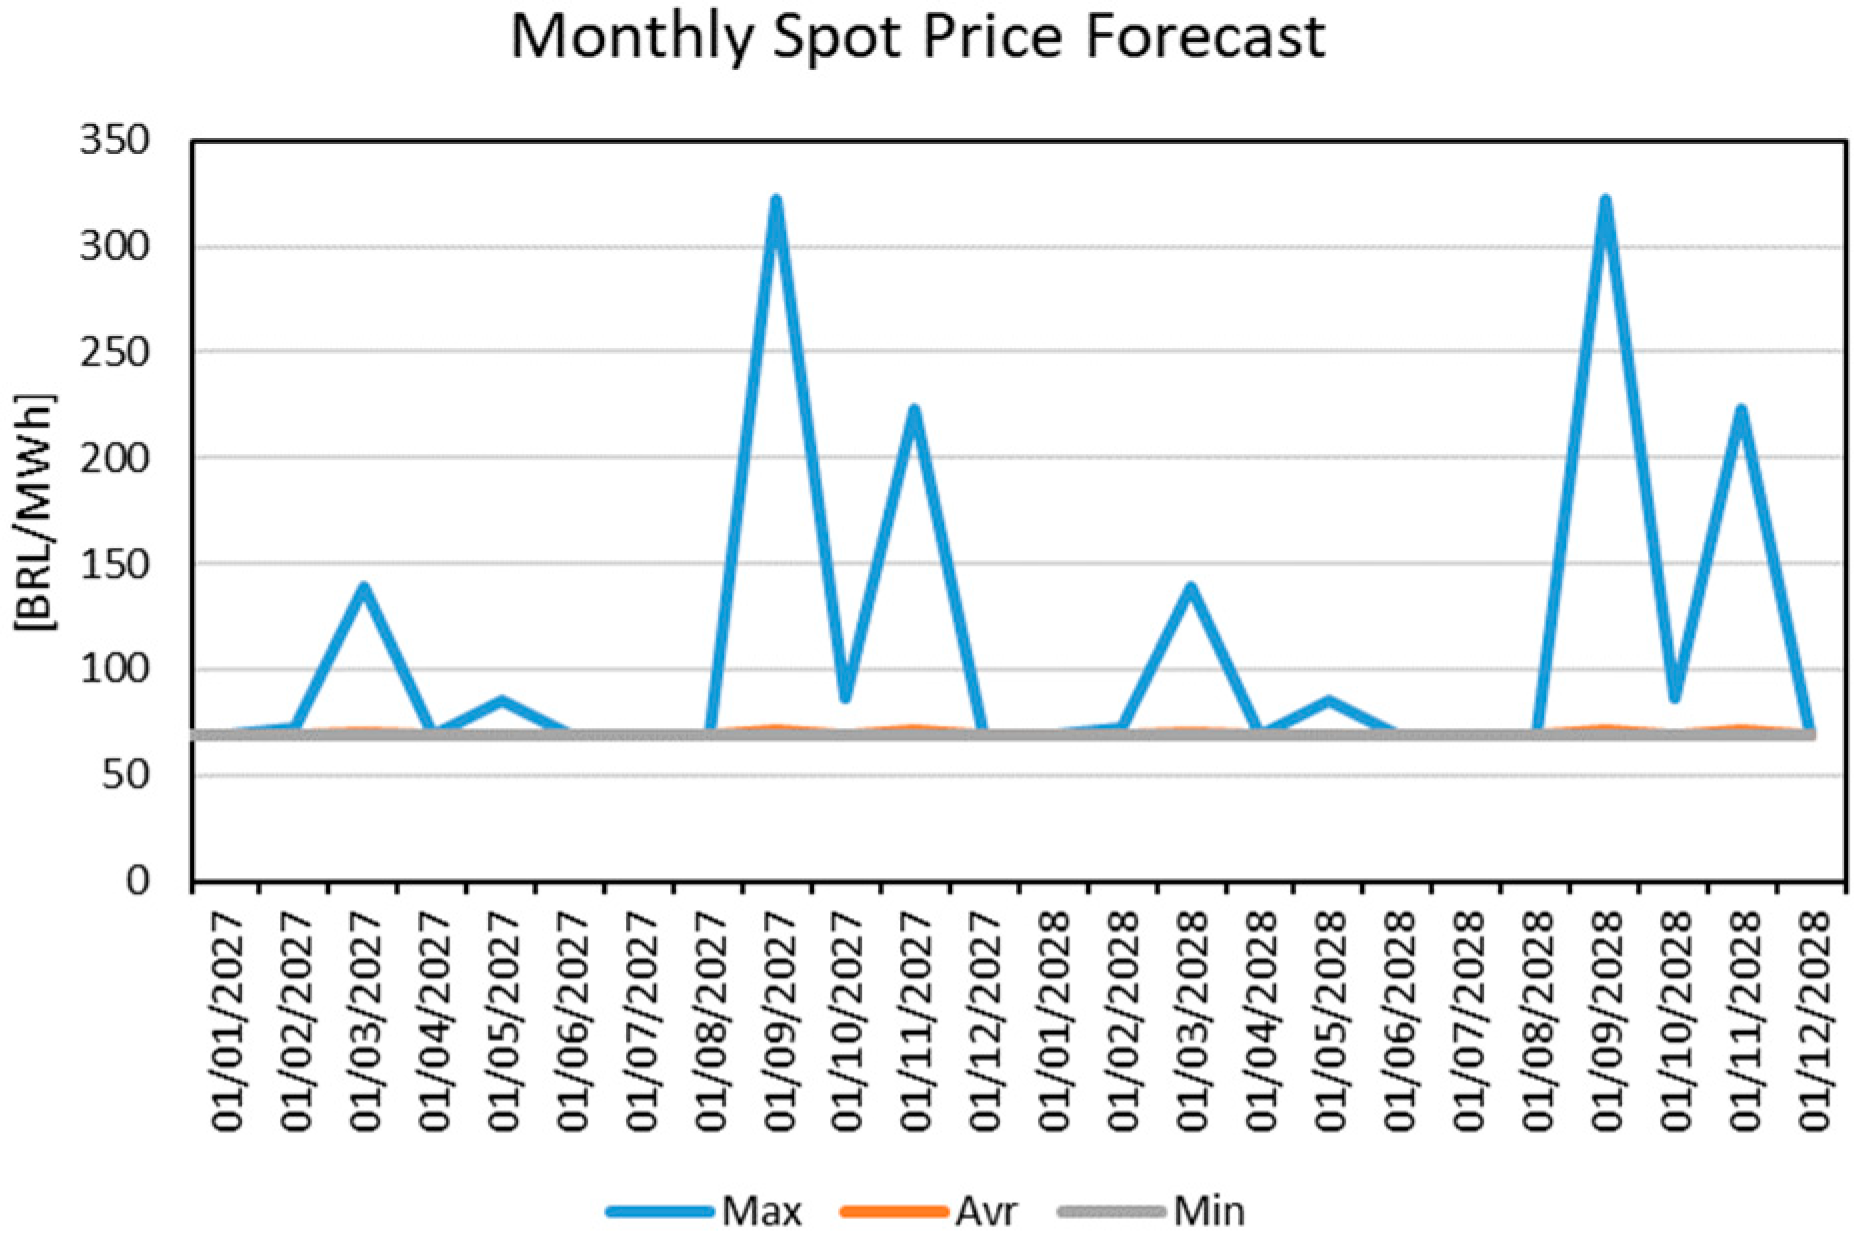
To apply our cases with statistical significance, the model utilized 90 time series comprising correlated historical inflows for the HPP and spot price forecasts. These series were sourced from the NEWAVE model (reference deck of October 2023). The
Figure 3 shows the average value of the forecasted monthly price.
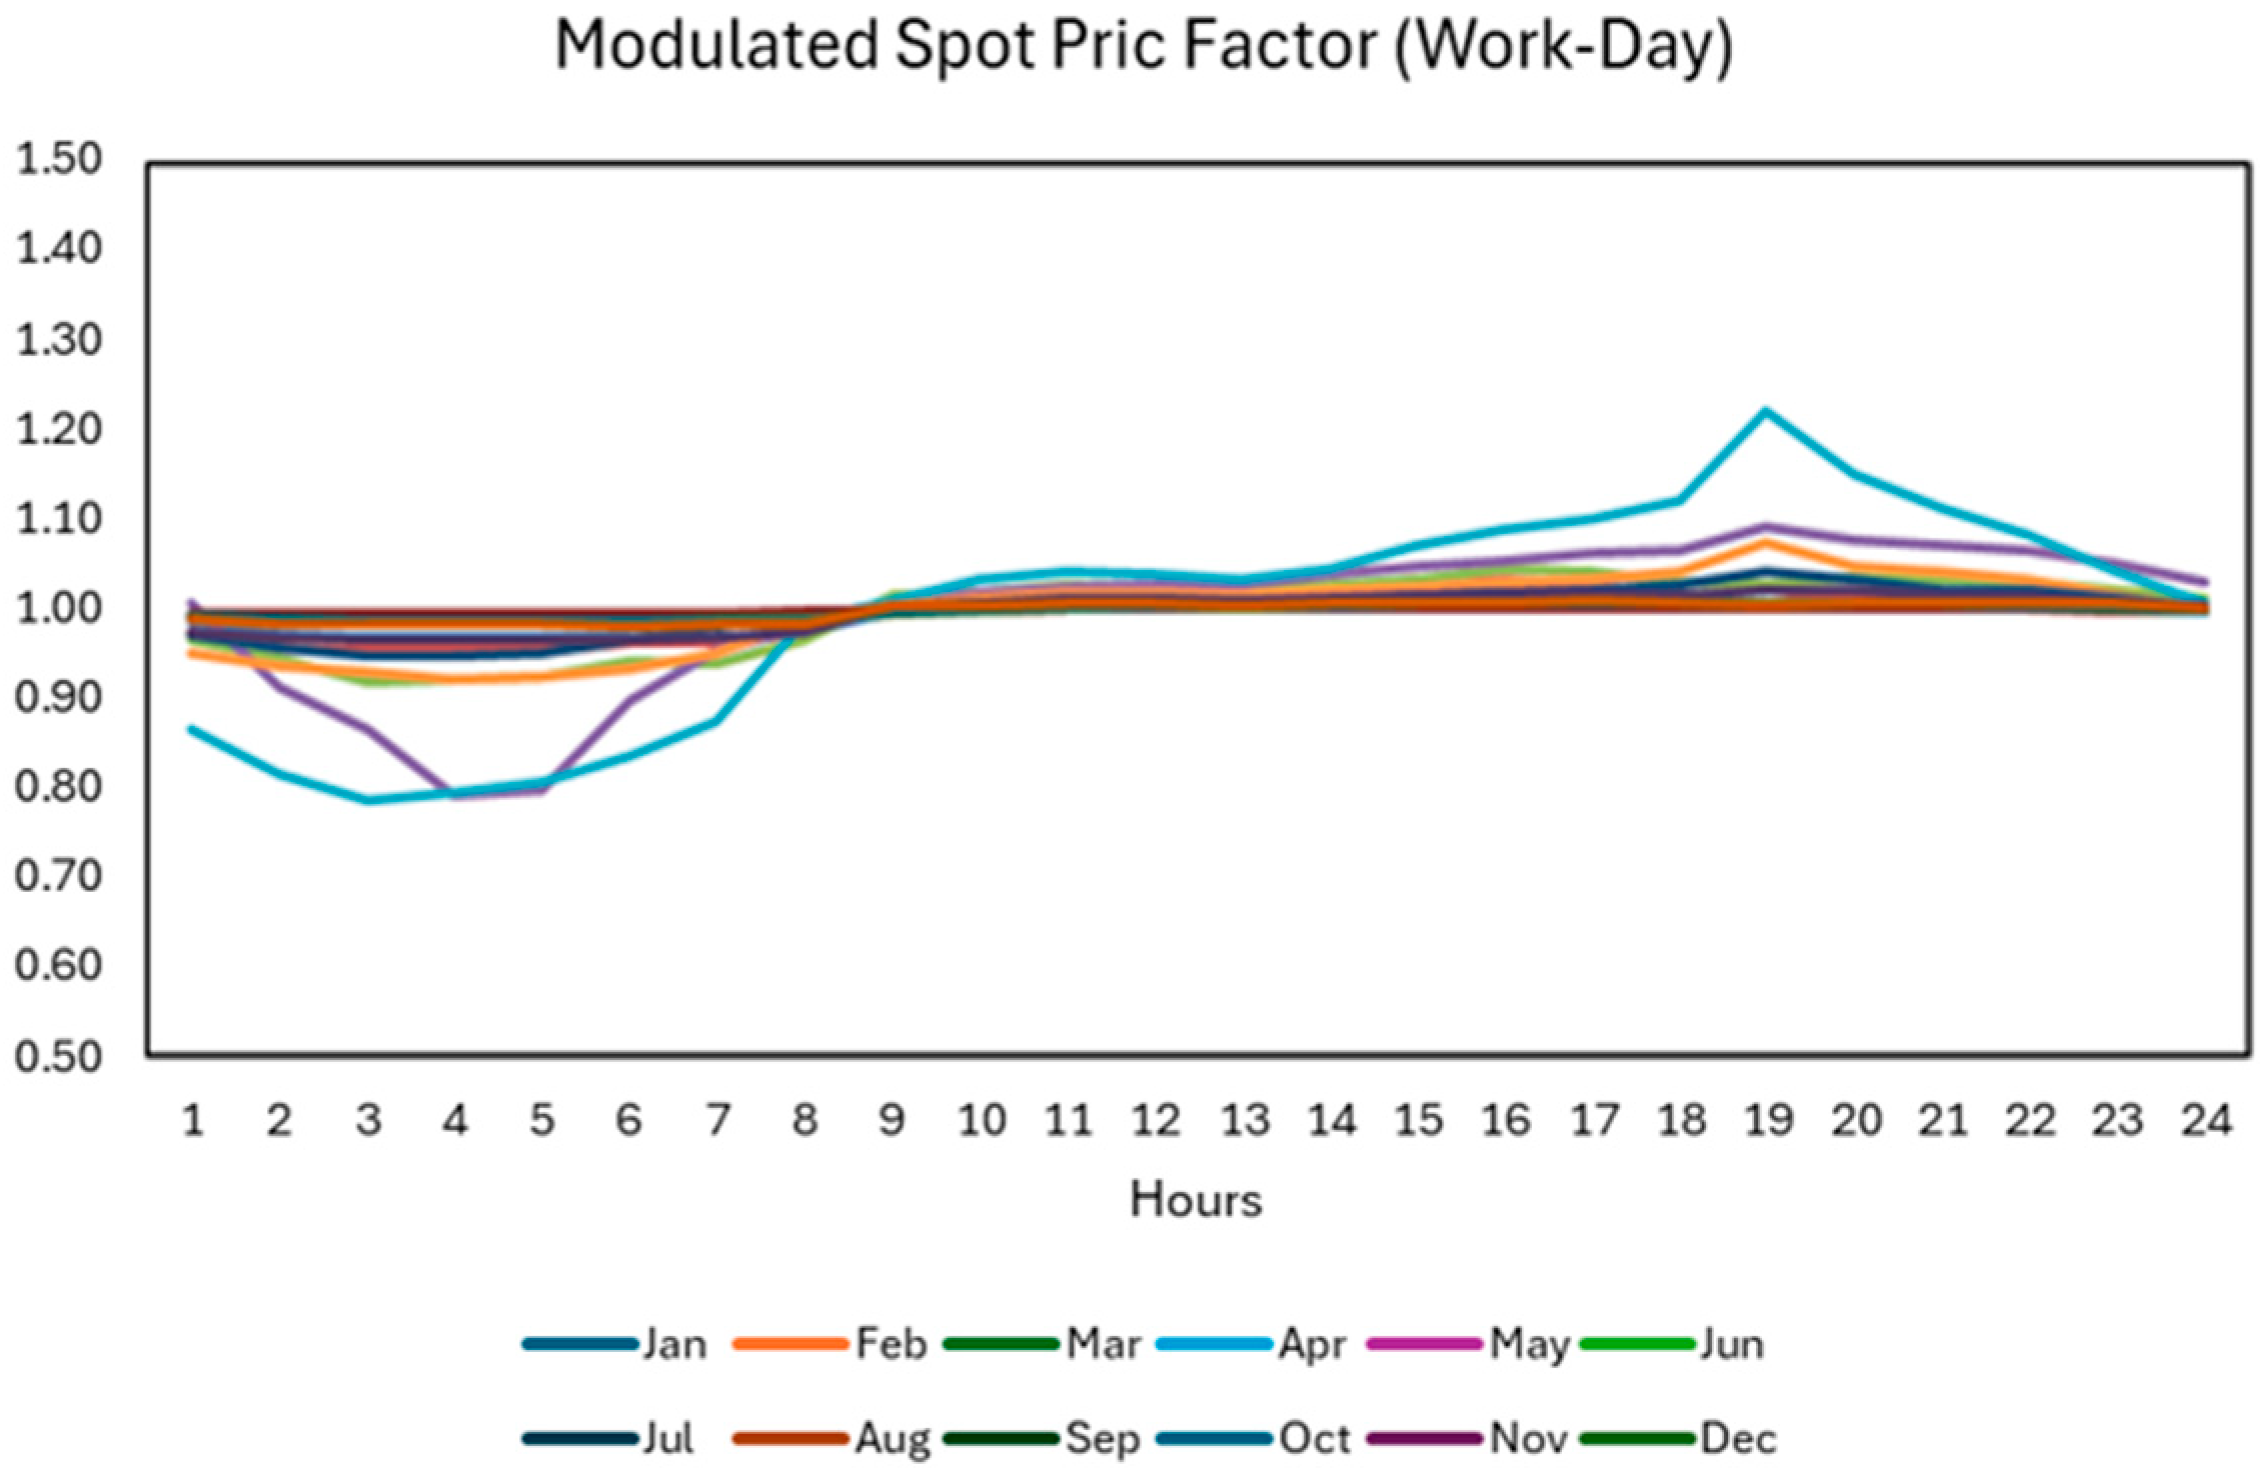
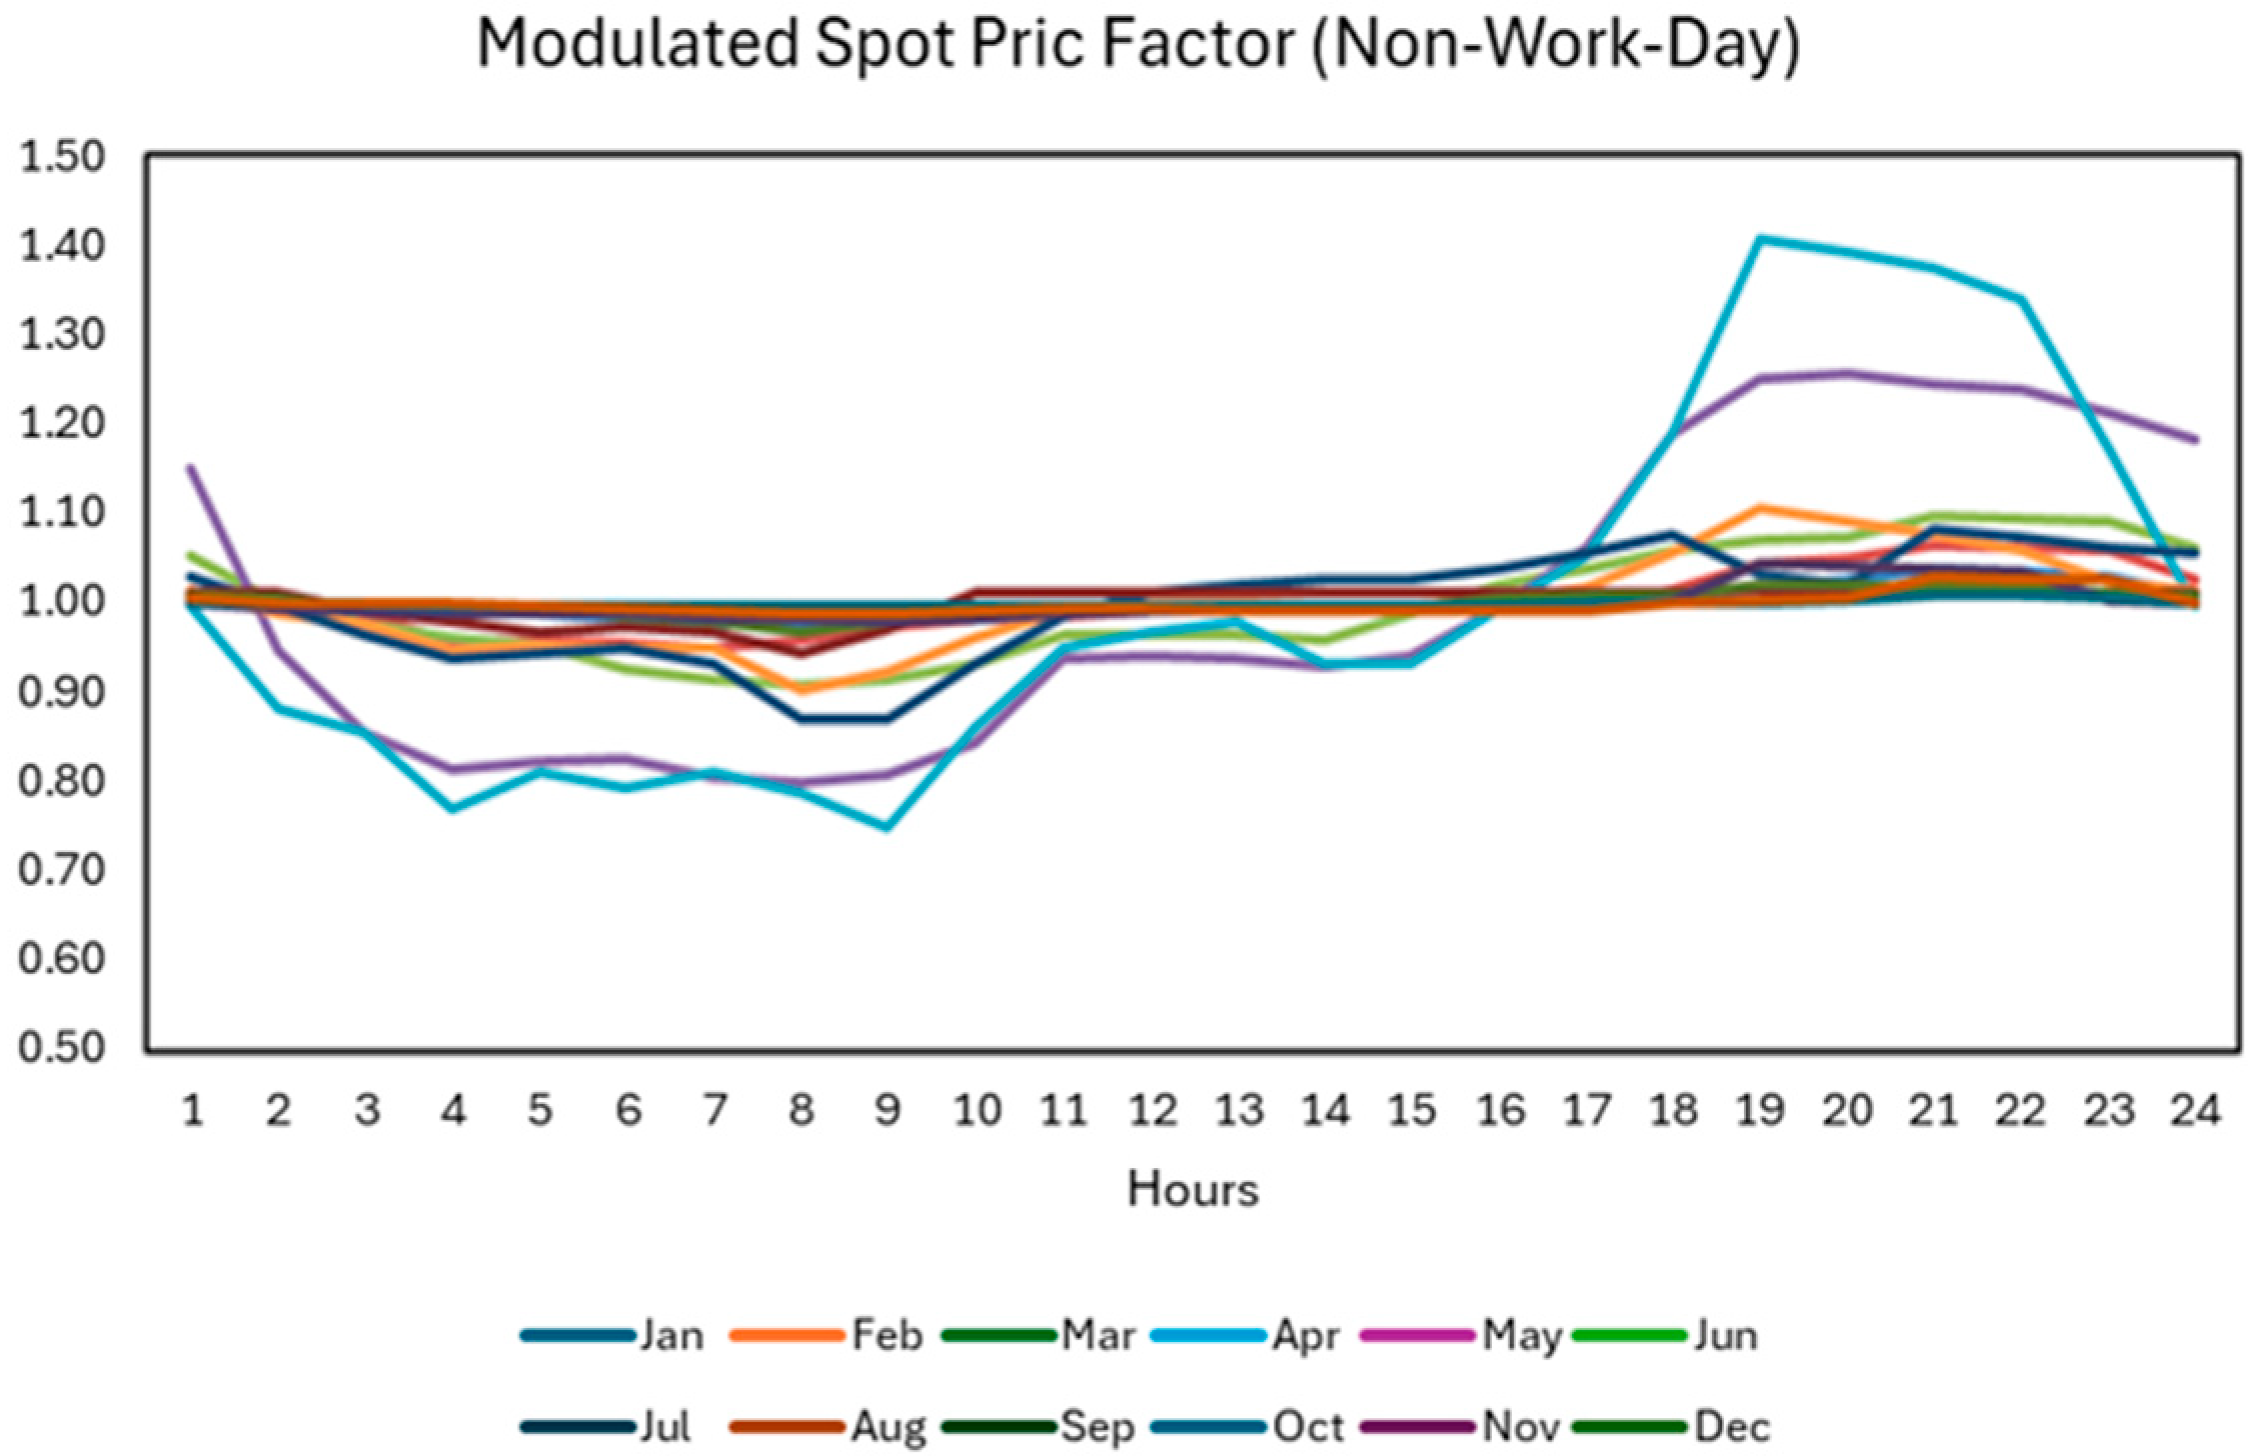
For the hourly simulation, the monthly average was modulated according to a typical modulation for weekdays and non-weekdays, which consists of the average modulation of hourly spot prices from 2021 to 2022 (
Figure 4 and
Figure 5).
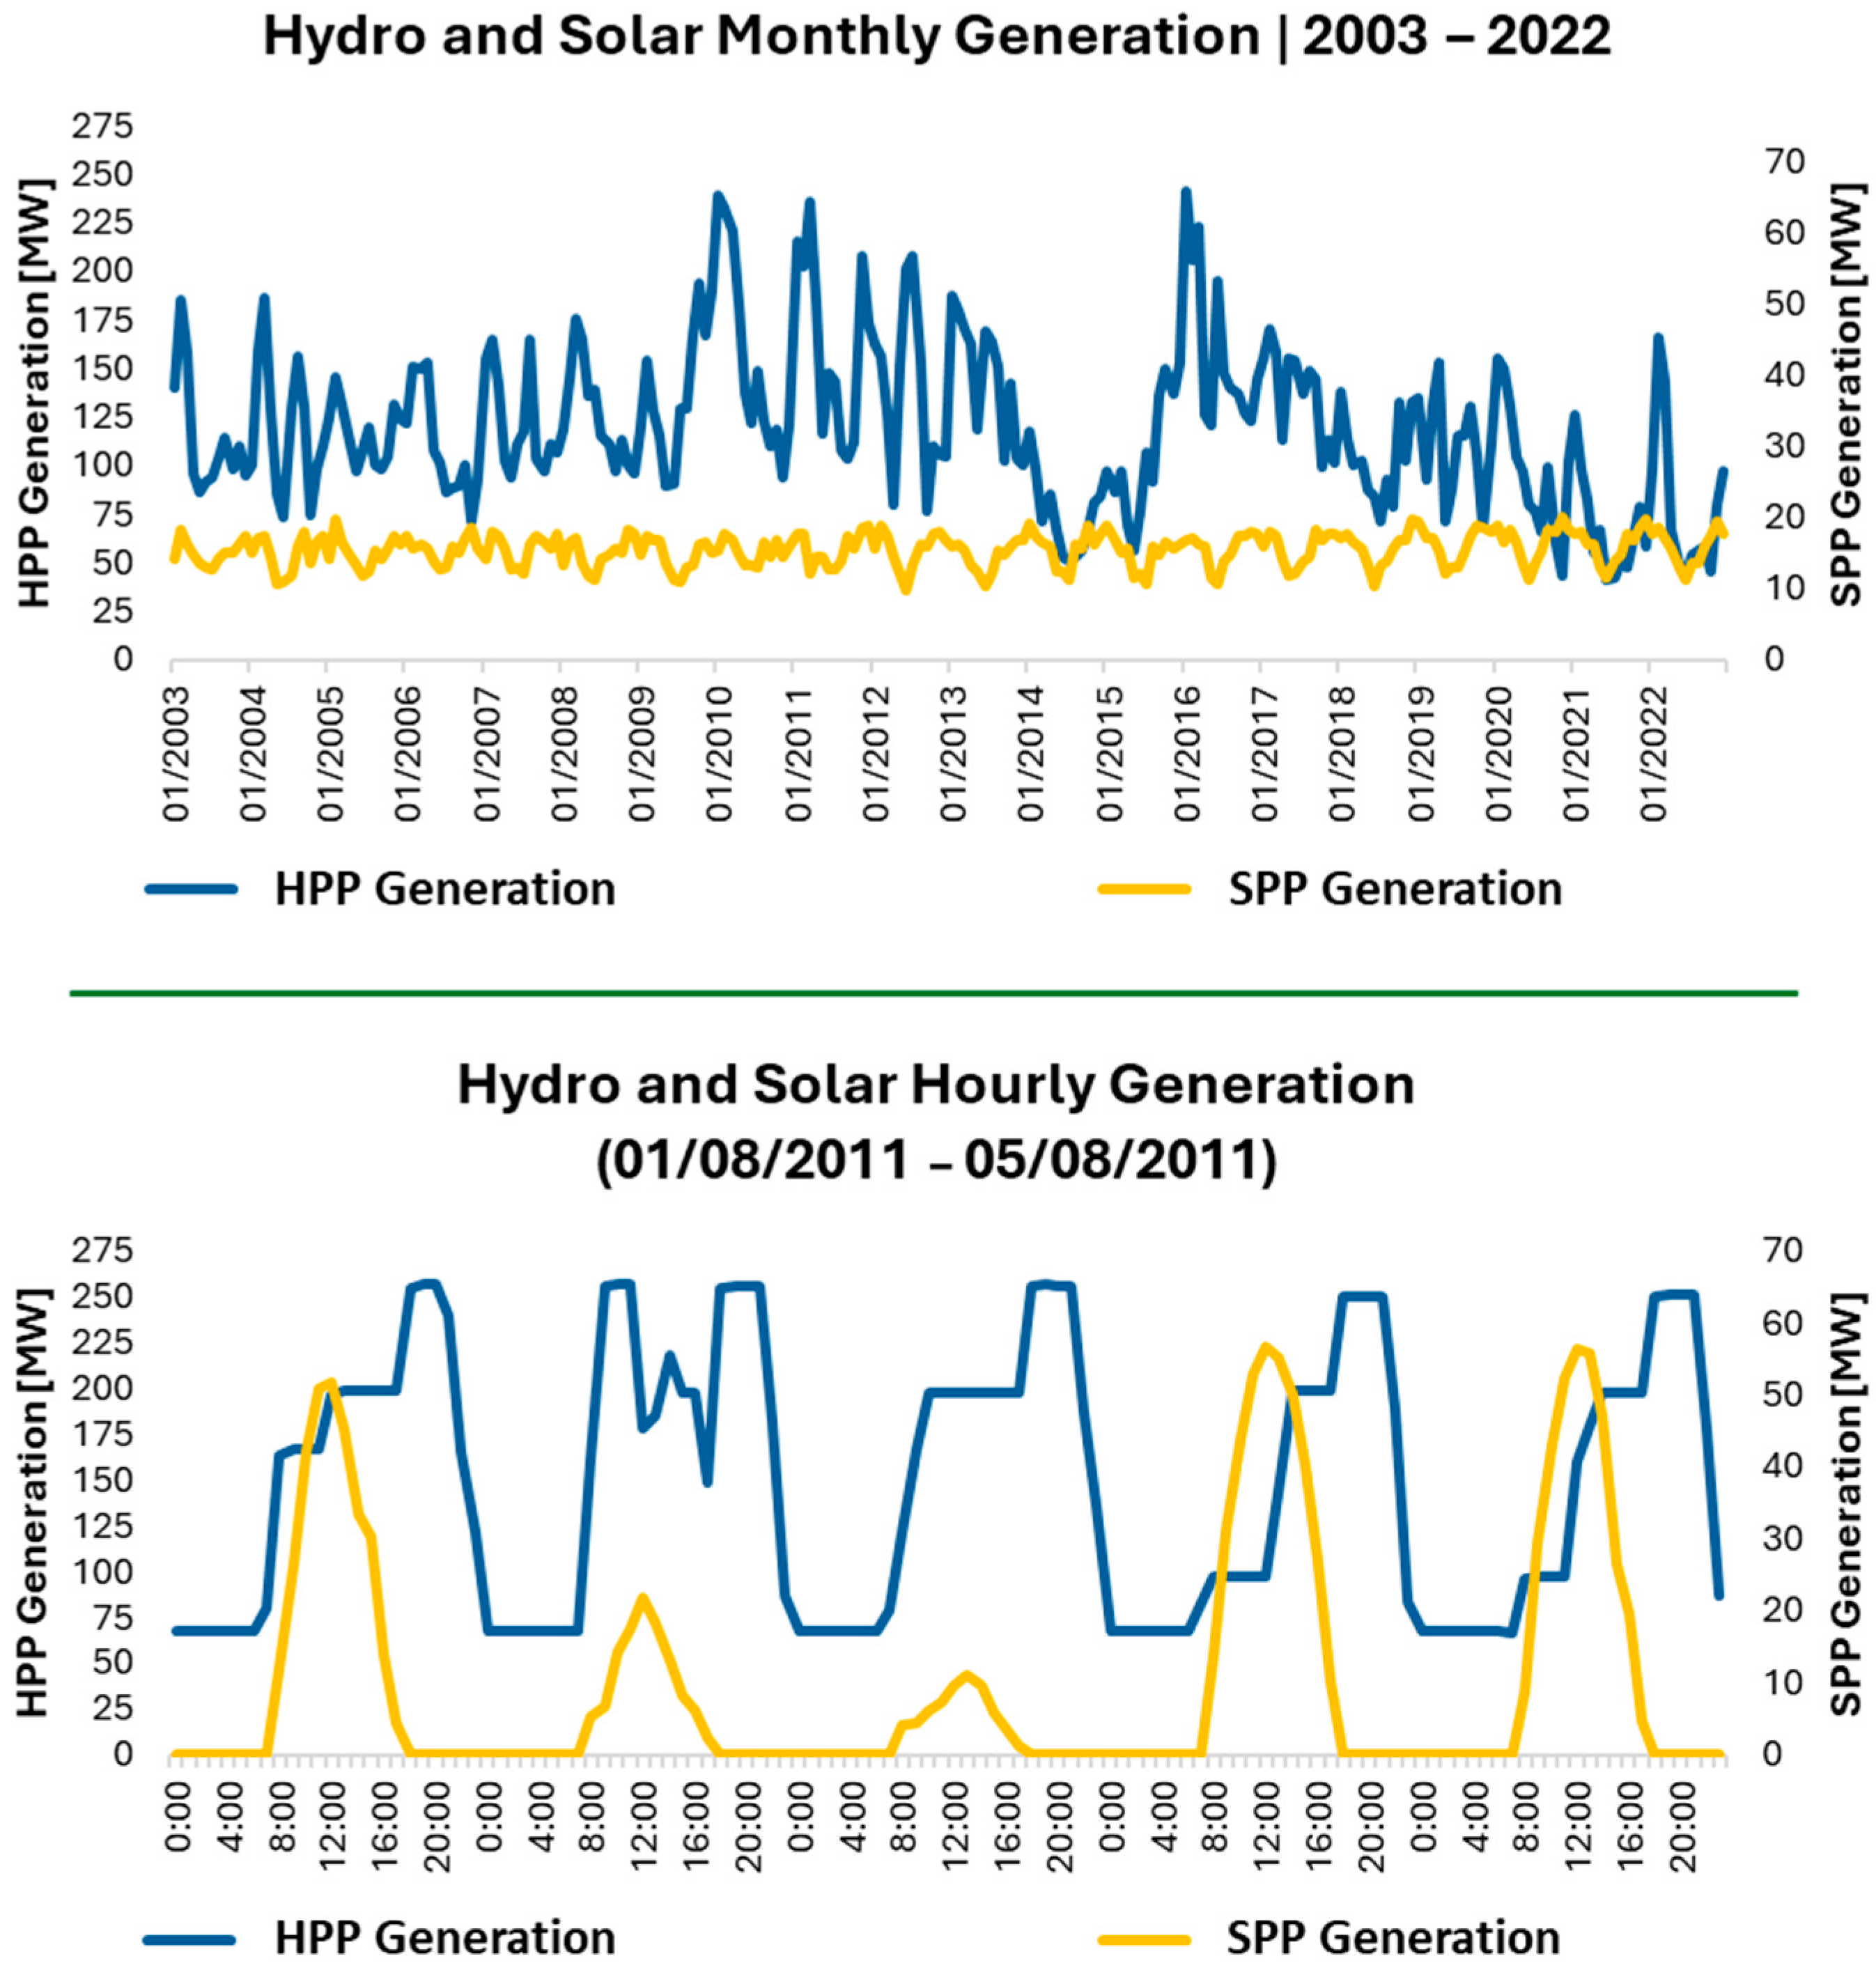
The generation scenarios for the HPP were simulated based on historical natural flow series obtained from the official sector model (NEWAVE). The flows were transformed into hydroelectric generation with the support of the model presented in this article. To create solar generation scenarios, based on synthetic irradiation series (from Vortex-Solar (
https://vortexfdc.com/ (accessed on 10 November 2023))), the technical characteristics of photovoltaic modules (LR5-72HPH STC) and inverter (SG 350HX)) were considered, for transformation irradiation to solar generation.
Figure 6 presents an example of a historical generation series on an hourly and monthly basis.
4.3. Results
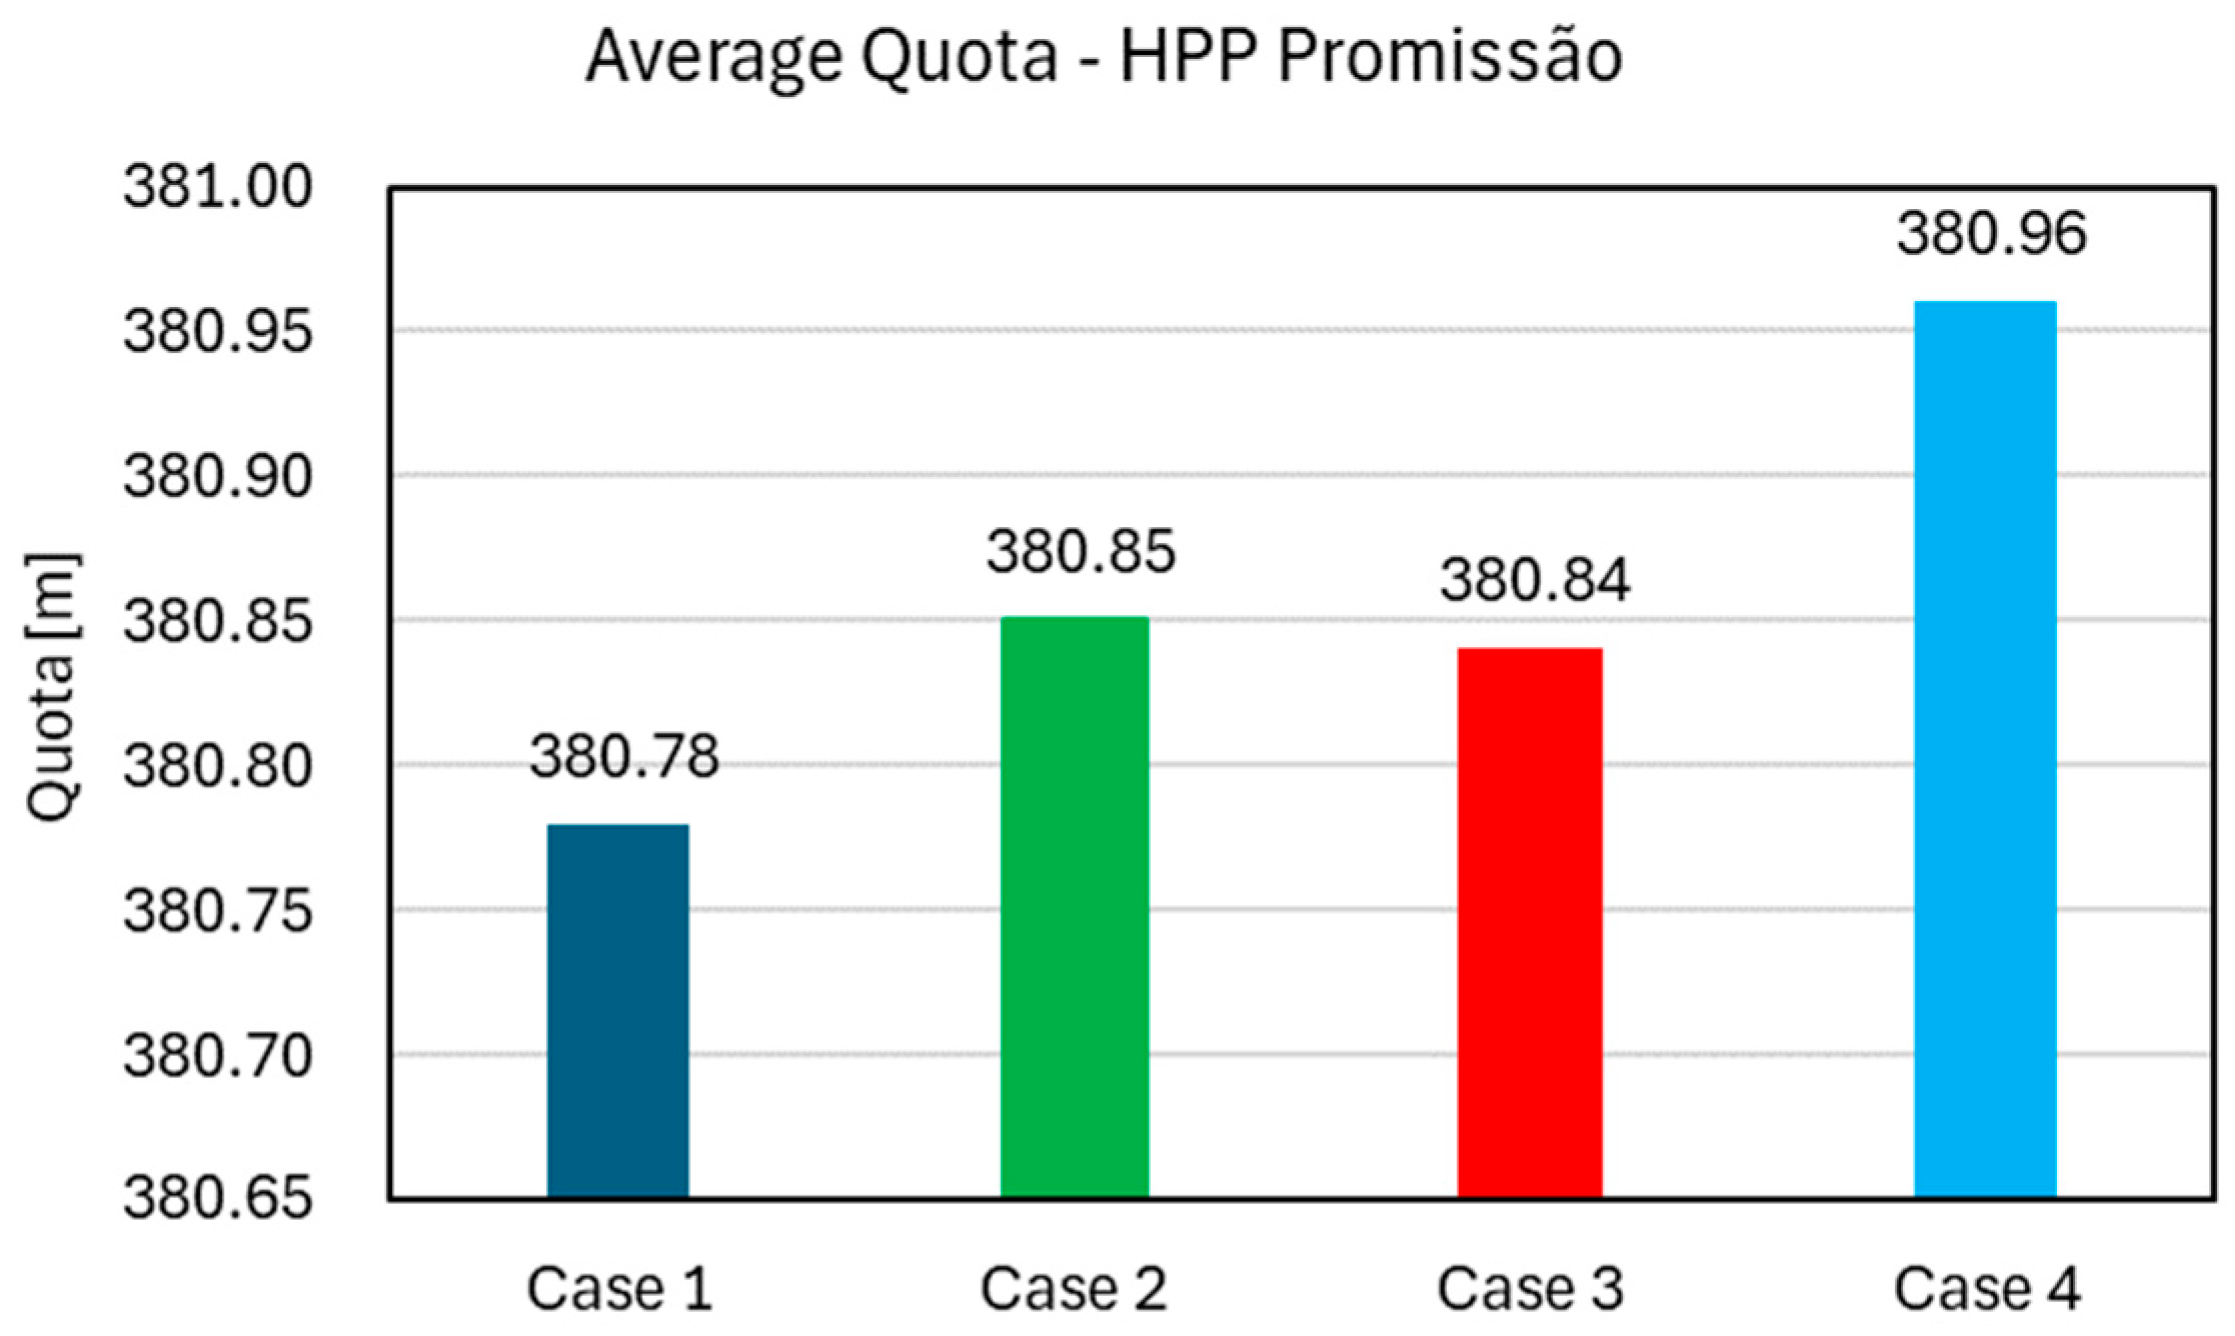
Throughout the simulated period, the average increase in the HPP Promissão Quota with the addition of 60 MW of SPP is 7 cm, and with the addition of 200 MW of solar, it can reach up to 18 cm, as shown in
Figure 7.
Although an increase of 7 cm may appear small, it is significant when considering that this is a small-scale SPP compared to the HPP. Given the vast area of the reservoir, this increment represents a considerable gain in reservoir volume.
The simulations demonstrate that the hydro generation of Promissão is not significantly affected. The addition of 60 MW of solar and an additional 60 MW in network flow capacity contracting (Case 2) reduces generation by 0.23 MWavg.
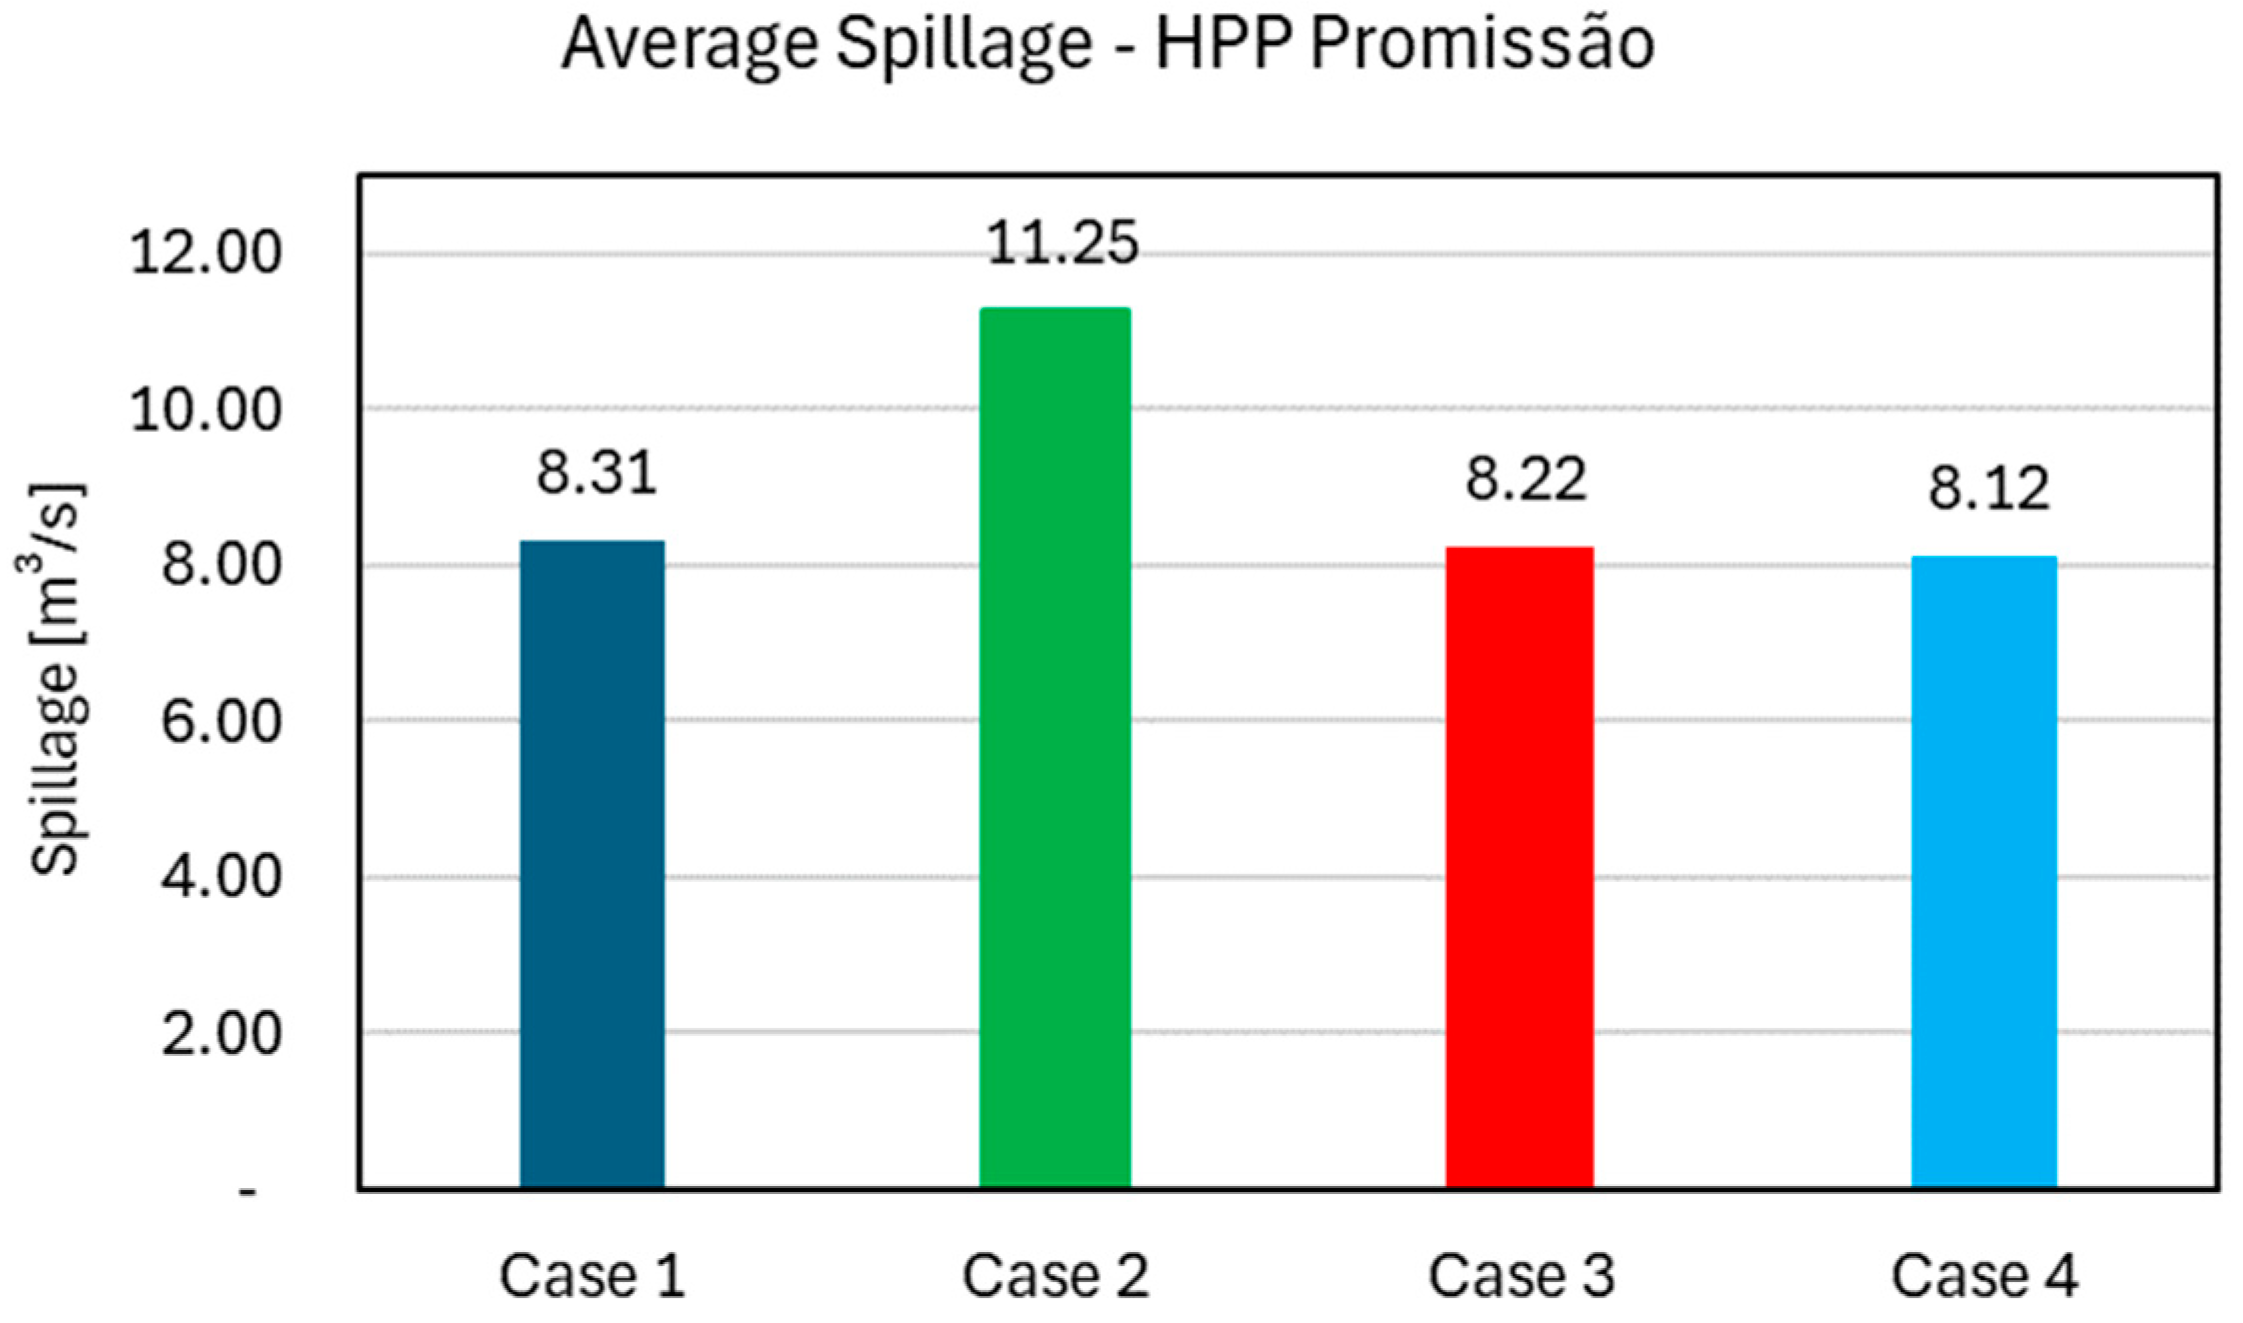
The average spillage of Promissão decreases with the SPP installation (
Figure 8). The results show that there is a slight decrease in spillage with solar in Promissão: a decrease of 0.9 m
3/s with 60 MW solar and a decrease of 0.19 m
3/s with 200 MW solar. Another highlight is that by limiting the generation of the plant (HPP + SPP) without additional flow to the network, an increase in spillage is observed (2.94 m
3/s).
In terms of volume, the addition of 60 MW of solar in Promissão (reaching a total capacity of 324 MW) generates an increase between 0.7 and 4.6 percentage points in the reservoir volume over a period of 60 months (
Table 2).
Regarding the cascade, the results presented in
Table 3 show that the implementation of 60 MW of solar in Promissão decreases the generation of all power plants; however, the decrease is small in each one of them.
The HPP most affected by the exchange from hydroelectric to solar generation is the equivalent plant Ilha Solteira. Although in percentage terms, the values appear to be small, it must be considered that the reservoir of this plant covers a large area, which is why in absolute values, the numbers are representative.
Regarding the reservoir levels, Barra Bonita, Promissão, and Ilha Solteira experience slight increases, with no reductions observed. It is possible to affirm that photovoltaic solar generation under these conditions contributes to the increase in the levels of all reservoirs.
5. Discussion
This study presents an energy system management model for hybrid plants composed of hydro and solar sources, aiming to optimize joint operation and to measure the operational consequences at the local level and in the cascade. It is important to highlight that although the proposed model is applied in the Brazilian context, it can be replicated with small adjustments to the context of other countries that have the potential to hybridize hydropower plants with reservoirs via association with solar.
The results from the case study of a hydro–solar power plant hybridization in the Tietê River (Brazil) revealed increased energy production and improvement in the operating conditions of the cascade’s reservoirs, while the grid capacity was found to be an important constraint that limits the capture of synergies resulting from the generation sources complementarity and thus on the benefits to the cascade.
Although only small benefits were found, the alterations to the cascade dispatch were also minimal. This suggests that, at the small scale tested in this study, the national operator could support hybridization without needing to modify the current dispatch system (no regulatory changes are required).
In addition, it is observed that in the case of the Tietê River, the management of the power plants’ reservoirs has a key role in maintaining the river’s navigability, as well as water availability in an important economic region of the country characterized by high energy consumption.
With the current climate change, hydroelectric power plants (HPPs) are experiencing a consistent reduction in their generation capacity. The proposed hybridization model could benefit operators by offsetting the impacts caused by the increased frequency of low-inflow events.
Future studies will focus on evaluating the hybridization of other hydropower plants with solar power in this basin to assess the macro benefits to the system derived from the expansion of capacity in this region.


