Article

Responses of Soil Moisture to Gully Land Consolidation in Asian Areas with Monsoon Climate

by
Mingyi Lin
1,2,3,*,
Jing Zhang
4,
Guofan Cao
4,
Hao Han
2,5,
Zhao Jin
2,6,
Da Luo
7 and
Guang Zeng
1
1
Aerial Photogrammetry and Remote Sensing Bureau of China Administration of Coal Geology, Xi’an 710199, China
2
State Key Laboratory of Loess and Quaternary Geology, Institute of Earth Environment, Chinese Academy of Sciences, Xi’an 710061, China
3
University of Chinese Academy of Sciences, Beijing 100049, China
4
Xi’an Institute for Innovative Earth Environment Research, Xi’an 710061, China
5
Key Laboratory of Ecological Geology and Disaster Prevention, Ministry of Natural Resources, Xi’an 710054, China
6
National Observation and Research Station of Earth Critical Zone on the Loess Plateau of Shaanxi, Xi’an 710061, China
7
Shaanxi Key Laboratory of Ecological Restoration in North Shaanxi Mining Area, College of Life Sciences, Yulin University, Yulin 719000, China
*
Author to whom correspondence should be addressed.
Water 2024, 16(14), 2001; https://doi.org/10.3390/w16142001
Submission received: 4 June 2024 / Revised: 5 July 2024 / Accepted: 10 July 2024 / Published: 15 July 2024
(This article belongs to the Section Soil and Water)

Abstract

:
Groundwater resources are essential for sustaining ecosystems and human activities, especially under the pressures of climate change. This study employed Electrical Resistivity Tomography (ERT) to assess the impact of Gully Land Consolidation (GLC) engineering on the groundwater hydrological field of small watersheds in the China Loess Plateau (CLP). Results revealed ample subsurface water storage in backfilled areas, primarily migrating along the original river path owing to topographical limitations. Although the distribution patterns of soil moisture in each backfilling block varied slightly, the boundaries of soil moisture content and variation mainly appeared at depths of 8 m and 20 m underground. Significant moisture variation occurred across the 0–20 m underground layers, suggesting the 8–20 m layer could function as a groundwater collection zone in the study area. Human activities could disturb groundwater, altering migration pathways from the original river path. An optimized “Drainage–Conveyance–Barrier” system is proposed to enhance GLC sustainability, involving upstream groundwater level control, midstream soil moisture management, and downstream hydrological connectivity improvement. These findings carry substantial implications for guiding the planning and execution of GLC engineering initiatives. The novelty of this study lies in its application of ERT to provide a detailed spatial and temporal understanding of soil moisture dynamics in the GLC areas. Future research should focus on factors such as soil types and topographical changes for a comprehensive assessment of GLC’s impact on small watershed groundwater hydrology.

1. Introduction

The hydrological cycle is crucial for maintaining global ecological balance [1]. As human activities intensify, including land use changes, major engineering constructions, and large-scale ecological restoration, disruptions (or modifications) have occurred in the hydrological processes of watershed systems, particularly affecting surface water and shallow groundwater [2,3,4]. This threatens regional ecological security, agricultural production, and socio-economic sustainability. Small watersheds, the most important hydrological units within watershed systems, play a key role in regulating ecological protection and water resource security. In recent decades, human modification of small watersheds has been increasing, with the construction of numerous small reservoirs or dams, watershed landscape remediation, and expansion of cultivated land area. These anthropogenic disturbances have significantly affected the hydrological processes in small watersheds. The rapid development of tourism, aquaculture, and agriculture within the watershed further exacerbates these issues, leading to severe environmental pollution [5]. Therefore, understanding the impact of human activities on the hydrological processes of small watersheds and elucidating the interaction between surface water and shallow groundwater under human disturbance is crucial for watershed ecological security and sustainable management.
The CLP is recognized as one of the region’s most significantly affected by climate change and human activities, exemplifying one of the most representative ecologically fragile areas globally. Extensive research evidence suggests that over the past 70 years of large-scale ecological construction and soil and water conservation efforts on the Loess Plateau, human activities have emerged as the primary drivers of eco-hydrological and erosion-sediment processes on the CLP, particularly exerting significant impacts on the hydrological processes in small watersheds. In recent decades, the widespread implementation of the “Grain for Green Program” on the slopes of the CLP and the “Gully Land Consolidation” (GLC) engineering executed in the gullies have led to substantial modifications in the underlying surface characteristics and watershed geomorphic structure of small watersheds. GLC engineering, initiated in Yan’an in 2012, aims to modify the geomorphic characteristics of the watershed by cutting and filling the foot slopes of the mountains and filling the gullies to expand the area of terraces within the channels, thereby increasing the area of high-quality arable land [6]. Existing research findings have indicated that the hydrological cycle, pollutant migration, erosion and sediment output, and salt accumulation in small watersheds have been significantly disrupted by GLC engineering [7,8,9], leading to an increase in soil moisture content [10], a rise in groundwater levels, and an exacerbation of salinization [11]. In these processes, changes in the hydrological cycle of small watersheds, particularly alterations in shallow groundwater, emerge as key factors contributing to these issues. However, the current understanding of the groundwater hydrological characteristics of the GLC watersheds remains insufficient, hindering the further advancement of drainage system design and soil salinization prevention in gully land treatment watersheds.
Obtaining comprehensive soil moisture measurements is often a time-consuming and expensive process [12]. Previous studies have relied on methods such as Time Domain Reflectometry (TDR) and Frequency Domain Reflectometry (FDR) to investigate soil moisture content and groundwater distribution. While practical for shallow soil moisture measurements, these methods have limitations in deep soil and groundwater exploration due to their constrained spatial resolution and measurement depth. Additionally, their accuracy can be compromised by heterogeneous underground environments where soil conductivity variations introduce instability and errors. In recent years, advancements in satellite remote sensing and Electrical Resistivity Tomography (ERT) have effectively addressed many of the shortcomings of traditional methods [13]. However, compared to ERT, satellite remote sensing exhibits limitations in groundwater monitoring, mainly due to its lower spatial resolution and insufficient detail for site-specific analyses.
ERT is an important method for rapid and non-destructive acquisition of deep soil and groundwater characteristics. Initially applied in geological exploration and landslide hazard detection [14], ERT has been widely used in recent years in land hydrological process research, facilitating the expansion of near-surface hydrological investigations beyond the land systems [15]. The principle of ERT is to invert the physical properties of underground media by measuring the distribution of electrical resistivity at different underground positions. During the measurement process, a set of electrodes is placed on the ground, and a current is applied to one pair of electrodes to measure the potential difference between the other electrodes. Based on the relationship between electrical resistivity and underground media, the electrical resistivity distribution image of underground media can be reconstructed through mathematical models and calculation methods, revealing underground hydrological characteristics.
ERT has proven successful in numerous applications for detecting underground hydrological characteristics. For example, researchers have successfully employed ERT to reveal information such as underground water flow paths, storage and distribution, and interactions between underground water and surface water [16,17,18,19,20]. One study employing ERT technology to detect the flow characteristics of underground water in a certain area revealed that underground water mainly migrates and distributes along the positions of river channels, with deviations from the original river channels also being identified [17,21,22]. These cases substantiate that ERT is a viable and dependable tool for detecting deep-soil hydrological information. Furthermore, recent advancements in ERT technology have enhanced its resolution and accuracy, enabling more detailed imaging of subsurface structures and hydrological processes. This includes the development of time-lapse ERT, which allows for the monitoring of dynamic changes in soil moisture and groundwater over time, providing valuable insights into the temporal variability of subsurface hydrological phenomena [23,24,25]. Additionally, integrating ERT data with other geophysical methods and hydrological models has improved the understanding of complex subsurface environments and the interactions between different hydrological components [26,27]. These advancements highlight the growing potential of ERT in addressing a wide range of hydrological and environmental challenges, from assessing groundwater resources and quality to monitoring soil moisture dynamics and supporting sustainable land management practices.
To address these knowledge gaps, this study employed ERT technology to detect underground hydrological information in GLC watersheds. Ongoing refinements of ERT inversion and prediction models will ensure cross-scale soil moisture monitoring and improve measurement accuracy [28,29]. The Gutun GLC watershed in Yan’an City was selected as the research area, emphasizing representative areas undergoing gully land treatment. ERT technology was employed for in-depth detection of the GLC engineering area to acquire electrical resistivity data. Subsequently, a quantitative relationship between electrical resistivity and soil moisture content was developed. By inverting this relationship to analyze the spatial distribution patterns and seasonal variations of soil moisture within the backfilled area, the study sought to elucidate the underground hydrological characteristics of the GLC watershed and identify potential hydrological pathways (HP). Our findings have enhanced our understanding of the dynamics of shallow groundwater movement within the gully land treatment engineering area and provide valuable theoretical foundations for the design of appropriate drainage facilities. Ultimately, the findings of this study aspire to offer scientific support for groundwater management and hydrological regulation in gully land treatment projects while also contributing valuable insights and guidance for similar land remediation initiatives in other regions.
To address these aims, the following research questions are posed:
  • How can the application of ERT technology improve our understanding of underground hydrological characteristics in GLC watersheds?
  • What are the spatial distribution patterns and seasonal variations of soil moisture content in the backfilled area, as revealed by ERT measurements?
  • How can the relationship between electrical resistivity and soil moisture content be modeled to enhance the accuracy of soil moisture monitoring?
  • What insights can be gained regarding the hydrological pathways and shallow groundwater movement dynamics within the GLC engineering area?

2. Materials and Methods

2.1. Study Area

The study site was situated within the Gutun watershed of the CLP, approximately 50 km from the urban area of Yan’an (Figure 1). The Gutun Watershed encompasses a total area of roughly 24 km2 and boasts a main channel measuring about 12.5 km in length. The region experiences a typical continental monsoon climate characterized by hot and rainy summers transitioning to cold and dry winters, with an average annual precipitation of 541 mm [30].
The Gutun Watershed, located in Yan’an City, is a typical small watershed where GLC engineering has been implemented. The project, initiated in 2012 and completed in 2014, led to the creation of approximately 200 hectares of newly cultivated land within the watershed [31]. The area is characterized by abundant groundwater resources. However, significant groundwater upwelling has been observed in areas upstream of Reservoir 3 (Re3), downstream of Reservoir 2 (Re2), and in the vicinity downstream of Re3 [10,11]. This upwelling has resulted in extensive areas of agricultural land becoming salinized, negatively impacting land productivity. For this investigation, representative backfilling sections within the Gutun gully land treatment watershed were chosen (Figure 1). The selected area is divided into four backfilling blocks: Fa1, Fa2, Fa3, and Fa4. Fa1 is located near the upstream of Re2, Fa4 is situated near the downstream of Re3, Fa2 represents a typical agricultural cultivation area, and Fa3 is a greenhouse agricultural cultivation area. The selection of these study area segments ensured representativeness regarding continuity, land use types, and the influence of human activities.
Falling within the monsoon zone, this area experiences a monsoon climate with hot and rainy summers transitioning to cold and dry winters. Data collected from the flux tower in the study area (Figure 1) revealed that the total annual precipitation from 2021 to 2022 was 987.4 mm, with the majority (86.33%) falling between July and October. Precipitation decreased from April to June, while November to March represented dry periods. The mean daily temperature was 9.91 °C, with a maximum of 26.6 °C and a minimum of −11.92 °C. The average daily relative humidity in this region was 65.88%, with minimum and maximum values of 21.15% and 96.66%, respectively (Figure 2).

2.2. Data Collection and Analysis Processing

2.2.1. Electrical Resistivity

The ERT technique has become a prominent tool for investigating the spatial and temporal distribution of soil moisture [32]. This study employed the Syscal Pro Switch 48, a four-electrode electrical resistivity imaging instrument (IRIS Instruments, Orléans, France). It utilizes two current electrodes (C1 and C2) and two potential electrodes (P1 and P2) to measure the voltage difference (V) between P1 and P2 upon applying current (I) between C1 and C2. This allows for the calculation of apparent resistivity (ρ) based on the established relationship between current and voltage. The device features 48 electrodes evenly distributed along two cables, with a maximum spacing of 5 m between electrodes. This configuration enables a maximum measurement range of 235 m (47 × 5 m). To ensure sufficient signal strength, comprehensive measurement coverage, and sensitivity to vertical variations in subsurface resistivity, a robust Wenner array configuration was chosen for this study [33].
To ensure consistency with conventional parameter collection during field measurement, electrode spacing was determined based on site conditions. To characterize the groundwater hydrological conditions of the study area, electrical resistivity measurements were conducted for four backfilled plots during both the rainy season (December 2021) and the dry season (April 2022) (Table 1). Due to constraints in the field conditions of the Fa3 backfilled plot, resistivity data were only obtained upstream and downstream of this area. Additionally, repeated data collection processes were conducted to mitigate systematic and random errors.
ERT data processing and analysis typically involve the following steps: Firstly, the field measurement results are converted into apparent resistivity values using Equation (1). Subsequently, these apparent resistivity values are inverted into true resistivity values using the Res2dinvx64 software (ver. 4.05). This software employs the smooth constrained least squares method, as described by Equation (2) [34,35]. During the inversion process, termination criteria are set to ensure the accuracy of the results. These criteria typically involve a maximum number of iterations (e.g., 7) or a threshold for the root mean square error (e.g., less than 5% change for two consecutive iterations).
ρ = K Δ V I
where ρ is the apparent resistivity, ΔV is the voltage difference, and I is the input current. K is a geometric parameter connected to the arrangement of the electrodes; K = 2πa, and a is the electrode spacing.
J T J + λ F Δ q k = J T g λ F q k
where F is the smoothing matrix, J is the Jacobian matrix of partial derivatives, JT is the transpose of J; q is the model change vector, and g is the data misfit vector, representing the difference between calculated values and actual measurements.

2.2.2. Soil Moisture Content

After acquiring electrical resistivity data, soil samples were collected from various depths using soil augers. The samples were immediately sealed in plastic bags to minimize errors during sample transport and storage. The volumetric water content (θ) of the soil samples was determined using the oven-drying method. Soil temperatures at each sampling layer were measured using the EM50 (Decagon Devices Inc., Pullman, WA, USA) and Takeme-20 (Dalian Zheqin Technology Co., Ltd., Dalian, Liaoning, China) instruments. For data accuracy, electrode spacing was carefully matched to the depths of soil sample collection. Consequently, high-precision resistivity profiles were collected within the study area (Fa1, Fa2, and Fa4) and nearby areas in December 2021 and April 2022, resulting in seven profiles (Figure 1). Although electrode spacing variations between profiles led to minor deviations in soil sample collection depths across the backfilled plots, these experimental data provided comprehensive coverage of the study area. Samples were collected during the rainy and dry seasons, ensuring spatial coverage of soil moisture content data within and near the area. This spatiotemporal data collection approach aimed to establish a comprehensive understanding of the relationship between regional electrical resistivity and soil moisture content.

2.3. Electrical Resistivity—Soil Moisture Content Model

In the context of studying deep soil moisture in the GLC watersheds, establishing a model correlating electrical resistivity with soil moisture content is crucial for comprehending spatiotemporal distribution changes. During the modeling process, it is essential to consider various factors influencing soil resistivity, including soil texture, porosity, moisture content, and temperature [36,37]. Studies have shown a negative correlation between soil clay content and resistivity, attributed to the matrix conduction effect caused by ion movement on clay surfaces [38]. Although mechanical compaction of the backfilled soil may alter the original pore structure, the soil type within a specific backfilled plot likely remains relatively consistent [6,30].
Temperature can significantly affect electrical resistivity by influencing the conductivity of pore water. However, the Keller and Frischknecht formula (Equation (3)) was employed to correct temperature variations, and the results suggested a minimal influence of temperature on the established relationship model between electrical resistivity and soil moisture content. Additionally, considering the substantial challenges associated with acquiring deep soil temperature data, this study assumed that the measured electrical resistivity in the study area is primarily controlled by soil moisture content. Therefore, a model (Equation (4)) correlating electrical resistivity with soil moisture content was established using high-precision ERT data from the seven profiles collected during the field survey (Figure 1). The correlation between measured soil moisture content and the model was estimated, revealing a statistically significant correlation (R2 = 0.80, p < 0.01) with a root mean square error (RMSE) of 3.03% and a mean absolute error (MAE) of 2.43%, indicating a good fit of the model.
ρ 0 = ρ t 1 + α T T 0
where ρ0 is the corrected electrical resistivity value at the standard temperature T0 (25 °C) in Ohm·m, ρτ is the true electrical resistivity in Ohm·m, T represents the soil temperature at the point of the measurement, and α is the correction coefficient, typically set to 0.025.
θ = a × ρ τ b 2
where ρτ represents the true electrical resistivity in Ohm·m, while a and b are constants, with values of a = 96.85 ± 9.21 and b = −0.25 ± 0.03.

2.4. Statistical Analysis of Soil Moisture Content

2.4.1. Descriptive Statistics

Descriptive statistics, including mean, standard deviation, and coefficient of variation (CV), were initially computed using Microsoft Excel (2019).
  • Mean Soil Moisture Content
The mean soil moisture content ( x ¯ ) is calculated to provide an average value of the soil moisture content across all sampled points.
x ¯ = 1 n i = 1 n x i
where x ¯ is the mean soil moisture content (%), n is the number of samples, x i is the soil moisture content of the i-th sample.
2.
Standard Deviation
The standard deviation (s) measures the dispersion of soil moisture content values around the mean, indicating variability within the data.
s = 1 n 1 i = 1 n x i x ¯ 2
where s is the standard deviation, x i is the soil moisture content of the i-th sample, x ¯ is the mean soil moisture content, and n is the number of samples.

2.4.2. Cluster Analysis

To identify inherent patterns and potential groupings within the soil moisture content data, cluster analysis was performed using SPSS (version 26). The specific steps involved in this analysis are as follows:
  • Data Standardization
To eliminate the influence of differing scales, the soil moisture content data were standardized using z-scores.
z i = x i x ¯ s
where z i is the standardized value of the i-th sample, x i is the soil moisture content of the i-th sample, x ¯ is the mean soil moisture content, s is the standard deviation.
2.
Euclidean Distance Calculation:
The Euclidean distance between each pair of samples was calculated to measure similarity.
d i j = k = 1 m z i k z j k 2
where d i j is the Euclidean distance between sample i and sample j, z i k and z j k are the standardized values of the k-th variable for samples i and j, m is the number of variables.
3.
Hierarchical Clustering
Hierarchical clustering was used to group similar samples into clusters. Ward’s method was applied to minimize the variance within clusters.
D A , B = A B A + B i A , j B d i j 2
where D A , B is the dissimilarity between clusters, A and B are the sizes of clusters A and B, d i j is the Euclidean distance between samples i and j from clusters A to B.
The optimal number of clusters was determined by analyzing the dendrogram and applying the elbow method to identify the point where adding more clusters does not significantly improve the variance explained.
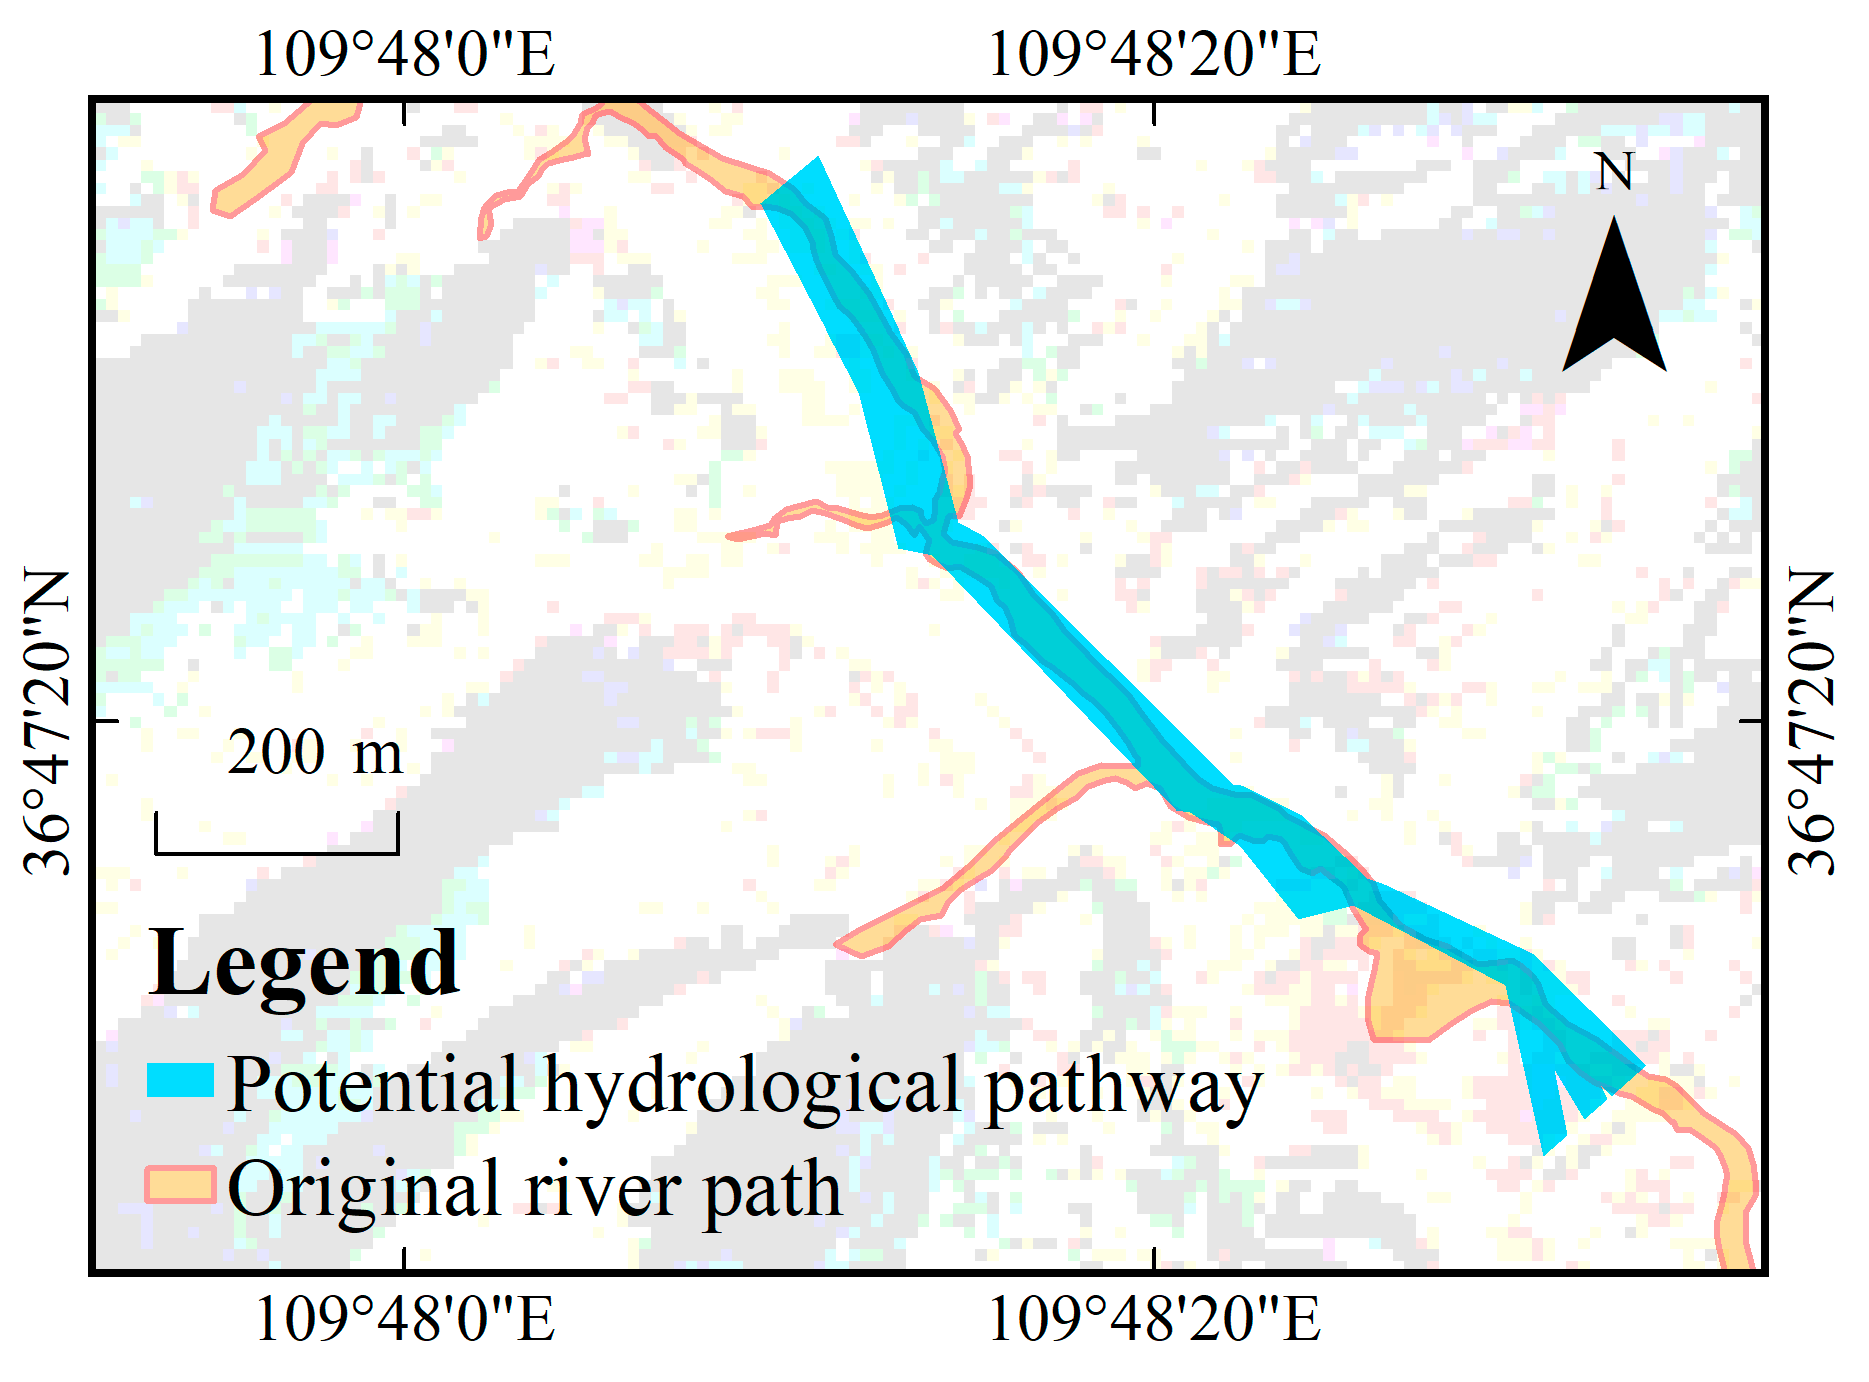
Leveraging the established model (Equation (4)), the electrical resistivity data were converted into corresponding soil moisture content information. To gain initial insights into the spatial distribution of soil moisture, the data were subjected to statistical analysis using Microsoft Excel (2019). This analysis yielded descriptive statistics, including mean soil moisture content, standard deviation, and coefficient of variation. Subsequently, cluster analysis was performed using SPSS (version 26) to identify areas with high soil moisture content. Finally, these areas were delineated as potential hydrological pathways within the subsurface using GIS software (version 10.7).

3. Results

3.1. Temporal and Spatial Distribution of Soil Moisture

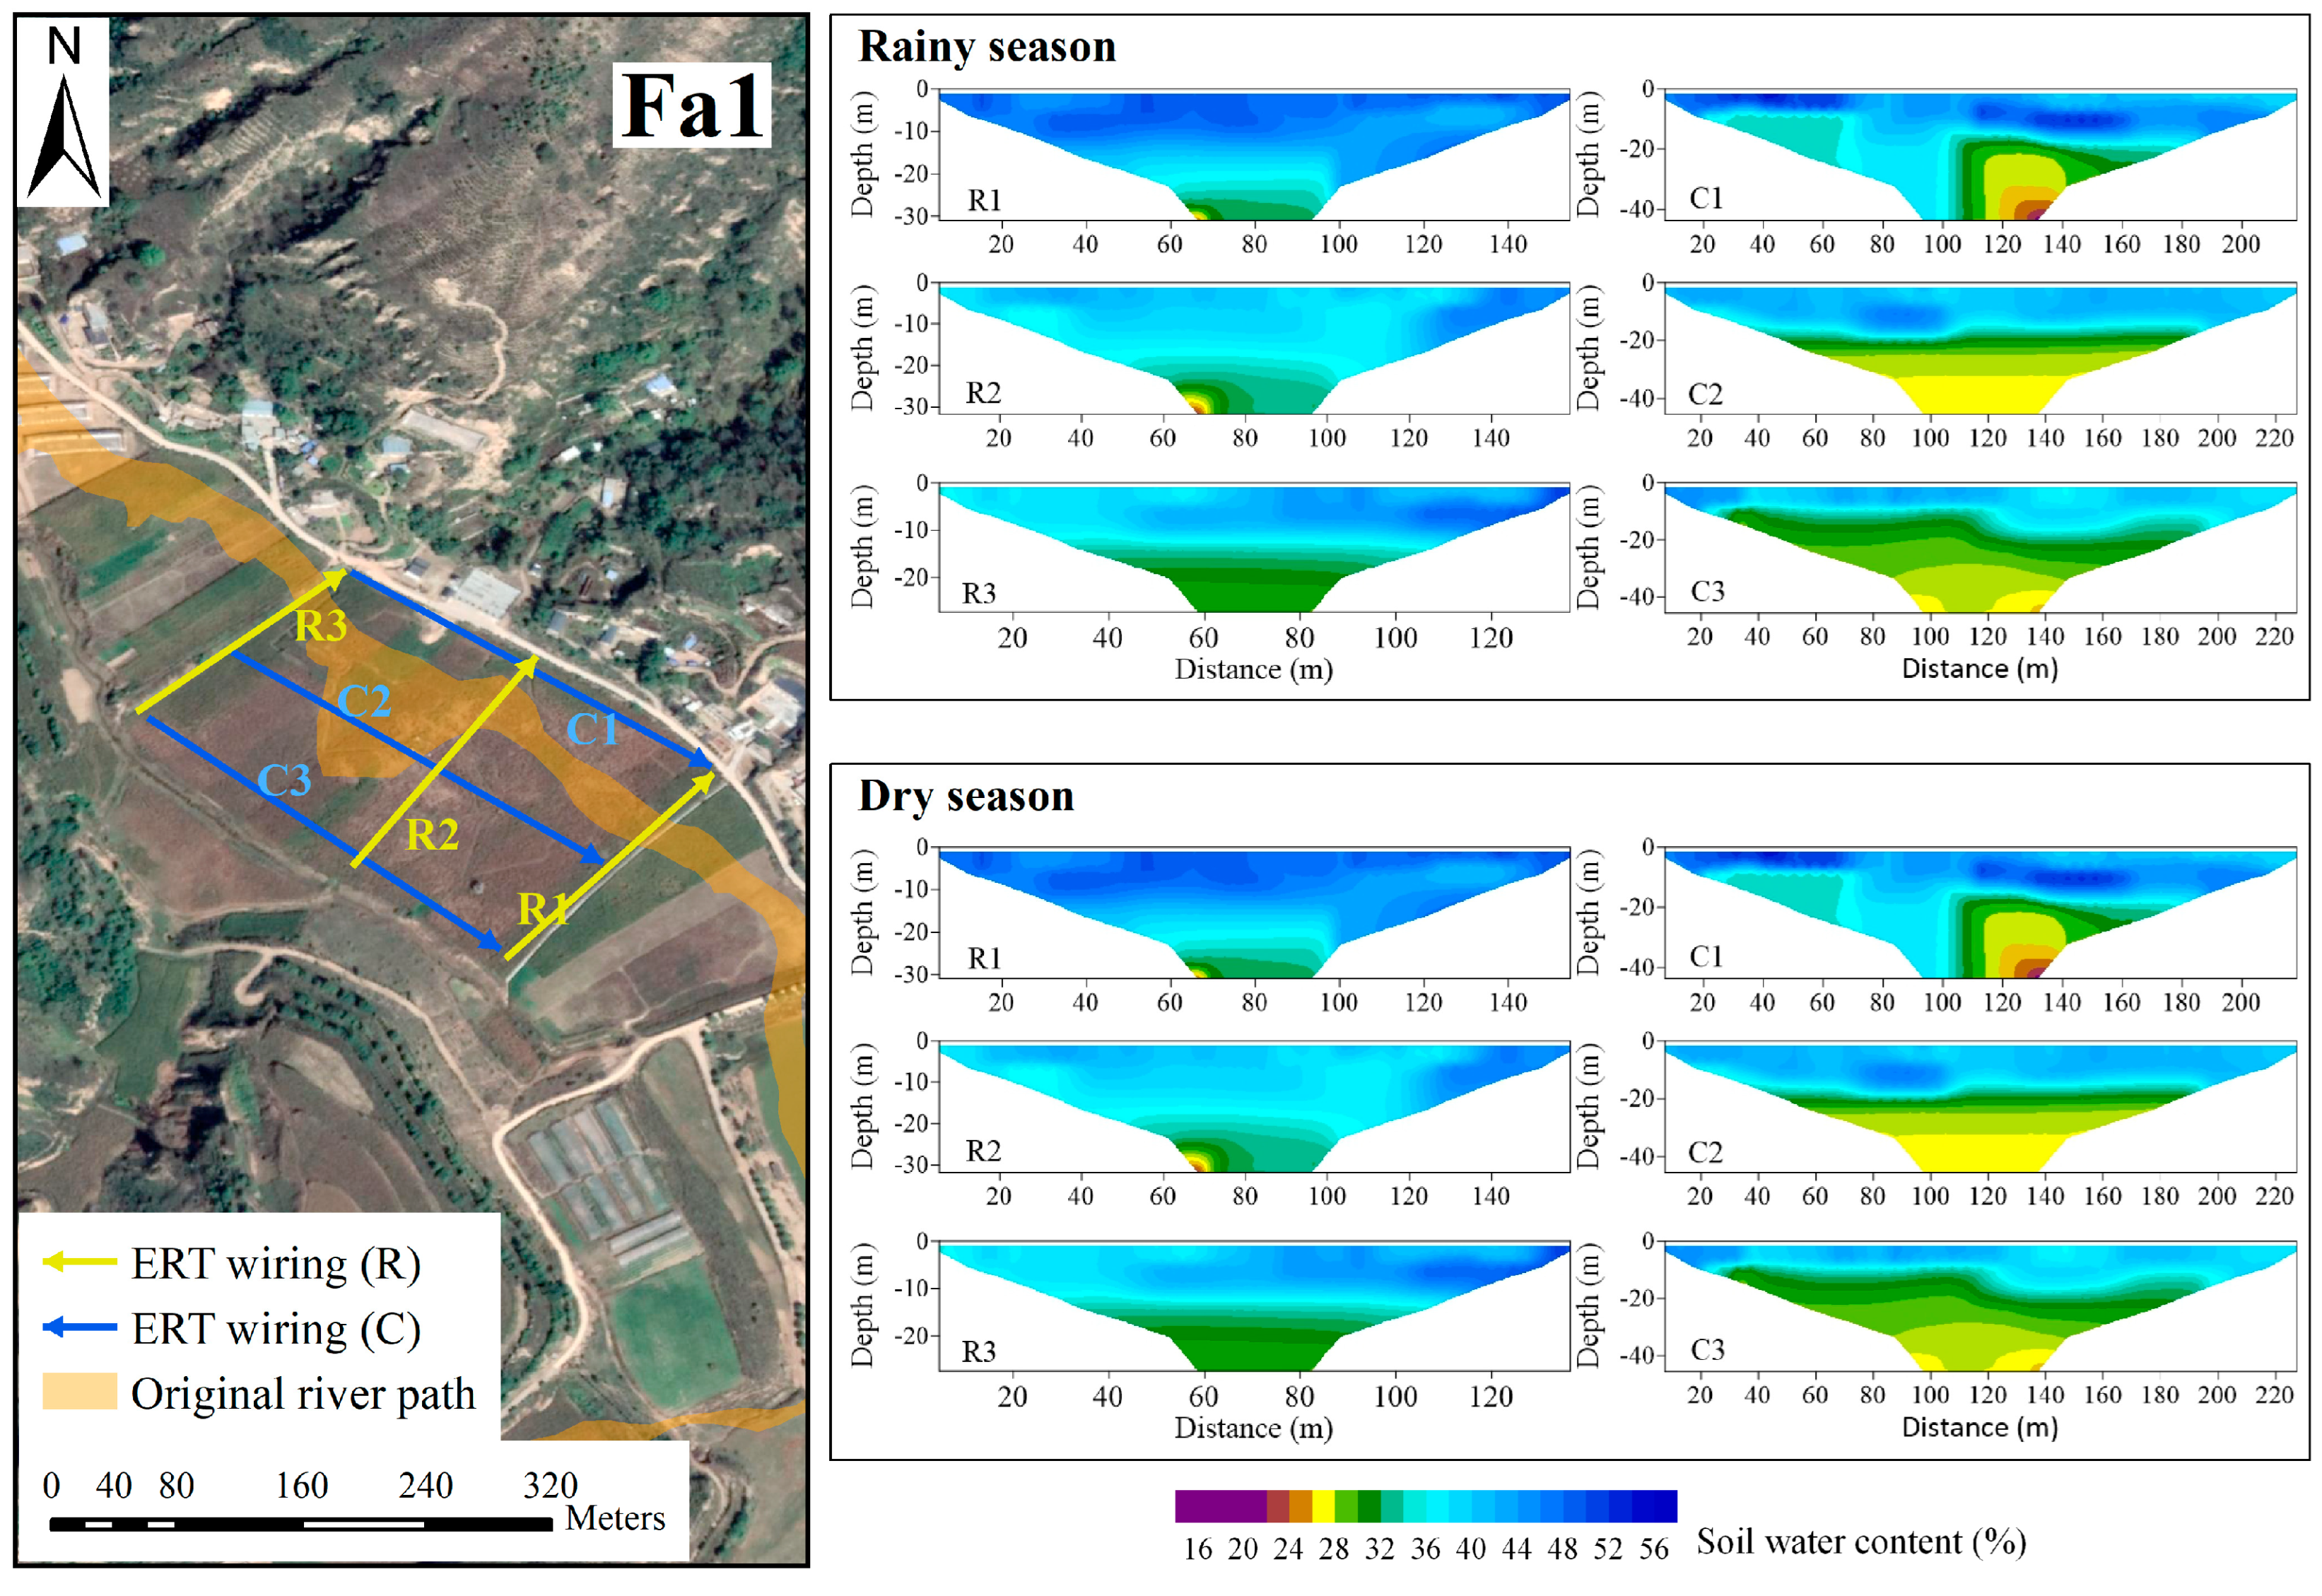
Field measurements at the surface observation points in the Fa1 backfilled plot revealed relatively high soil moisture content. As depicted in Figure 3, the soil moisture field of the vertical profile in this area exhibits two distinct zones: a zone of elevated soil moisture content near the surface and a zone of reduced soil moisture content at the bottom. During the rainy season, the mean soil moisture content along the lateral profiles (R1–R3) was 37.81 ± 3.24%, 38.65 ± 3.50%, and 38.77 ± 4.72%, respectively. These values decreased to 36.97 ± 2.87%, 38.07 ± 3.51%, and 38.18 ± 4.23%, respectively, during the dry season. Overall, soil moisture content was higher at the upstream and downstream ends of the backfilled plot, with lower values in the middle. Profiles farther from the road exhibited a gradual decrease in moisture content. The soil moisture content of profile C1 significantly differed from that of other profiles (p < 0.001), with its maximum electrical resistivity confirmed through multiple measurements to be 1529.20 Ω·m, located at coordinates (x = 132.00 m, y = 43.76 m). This outlier could be attributed to underground low-conductivity objects, such as rocks.
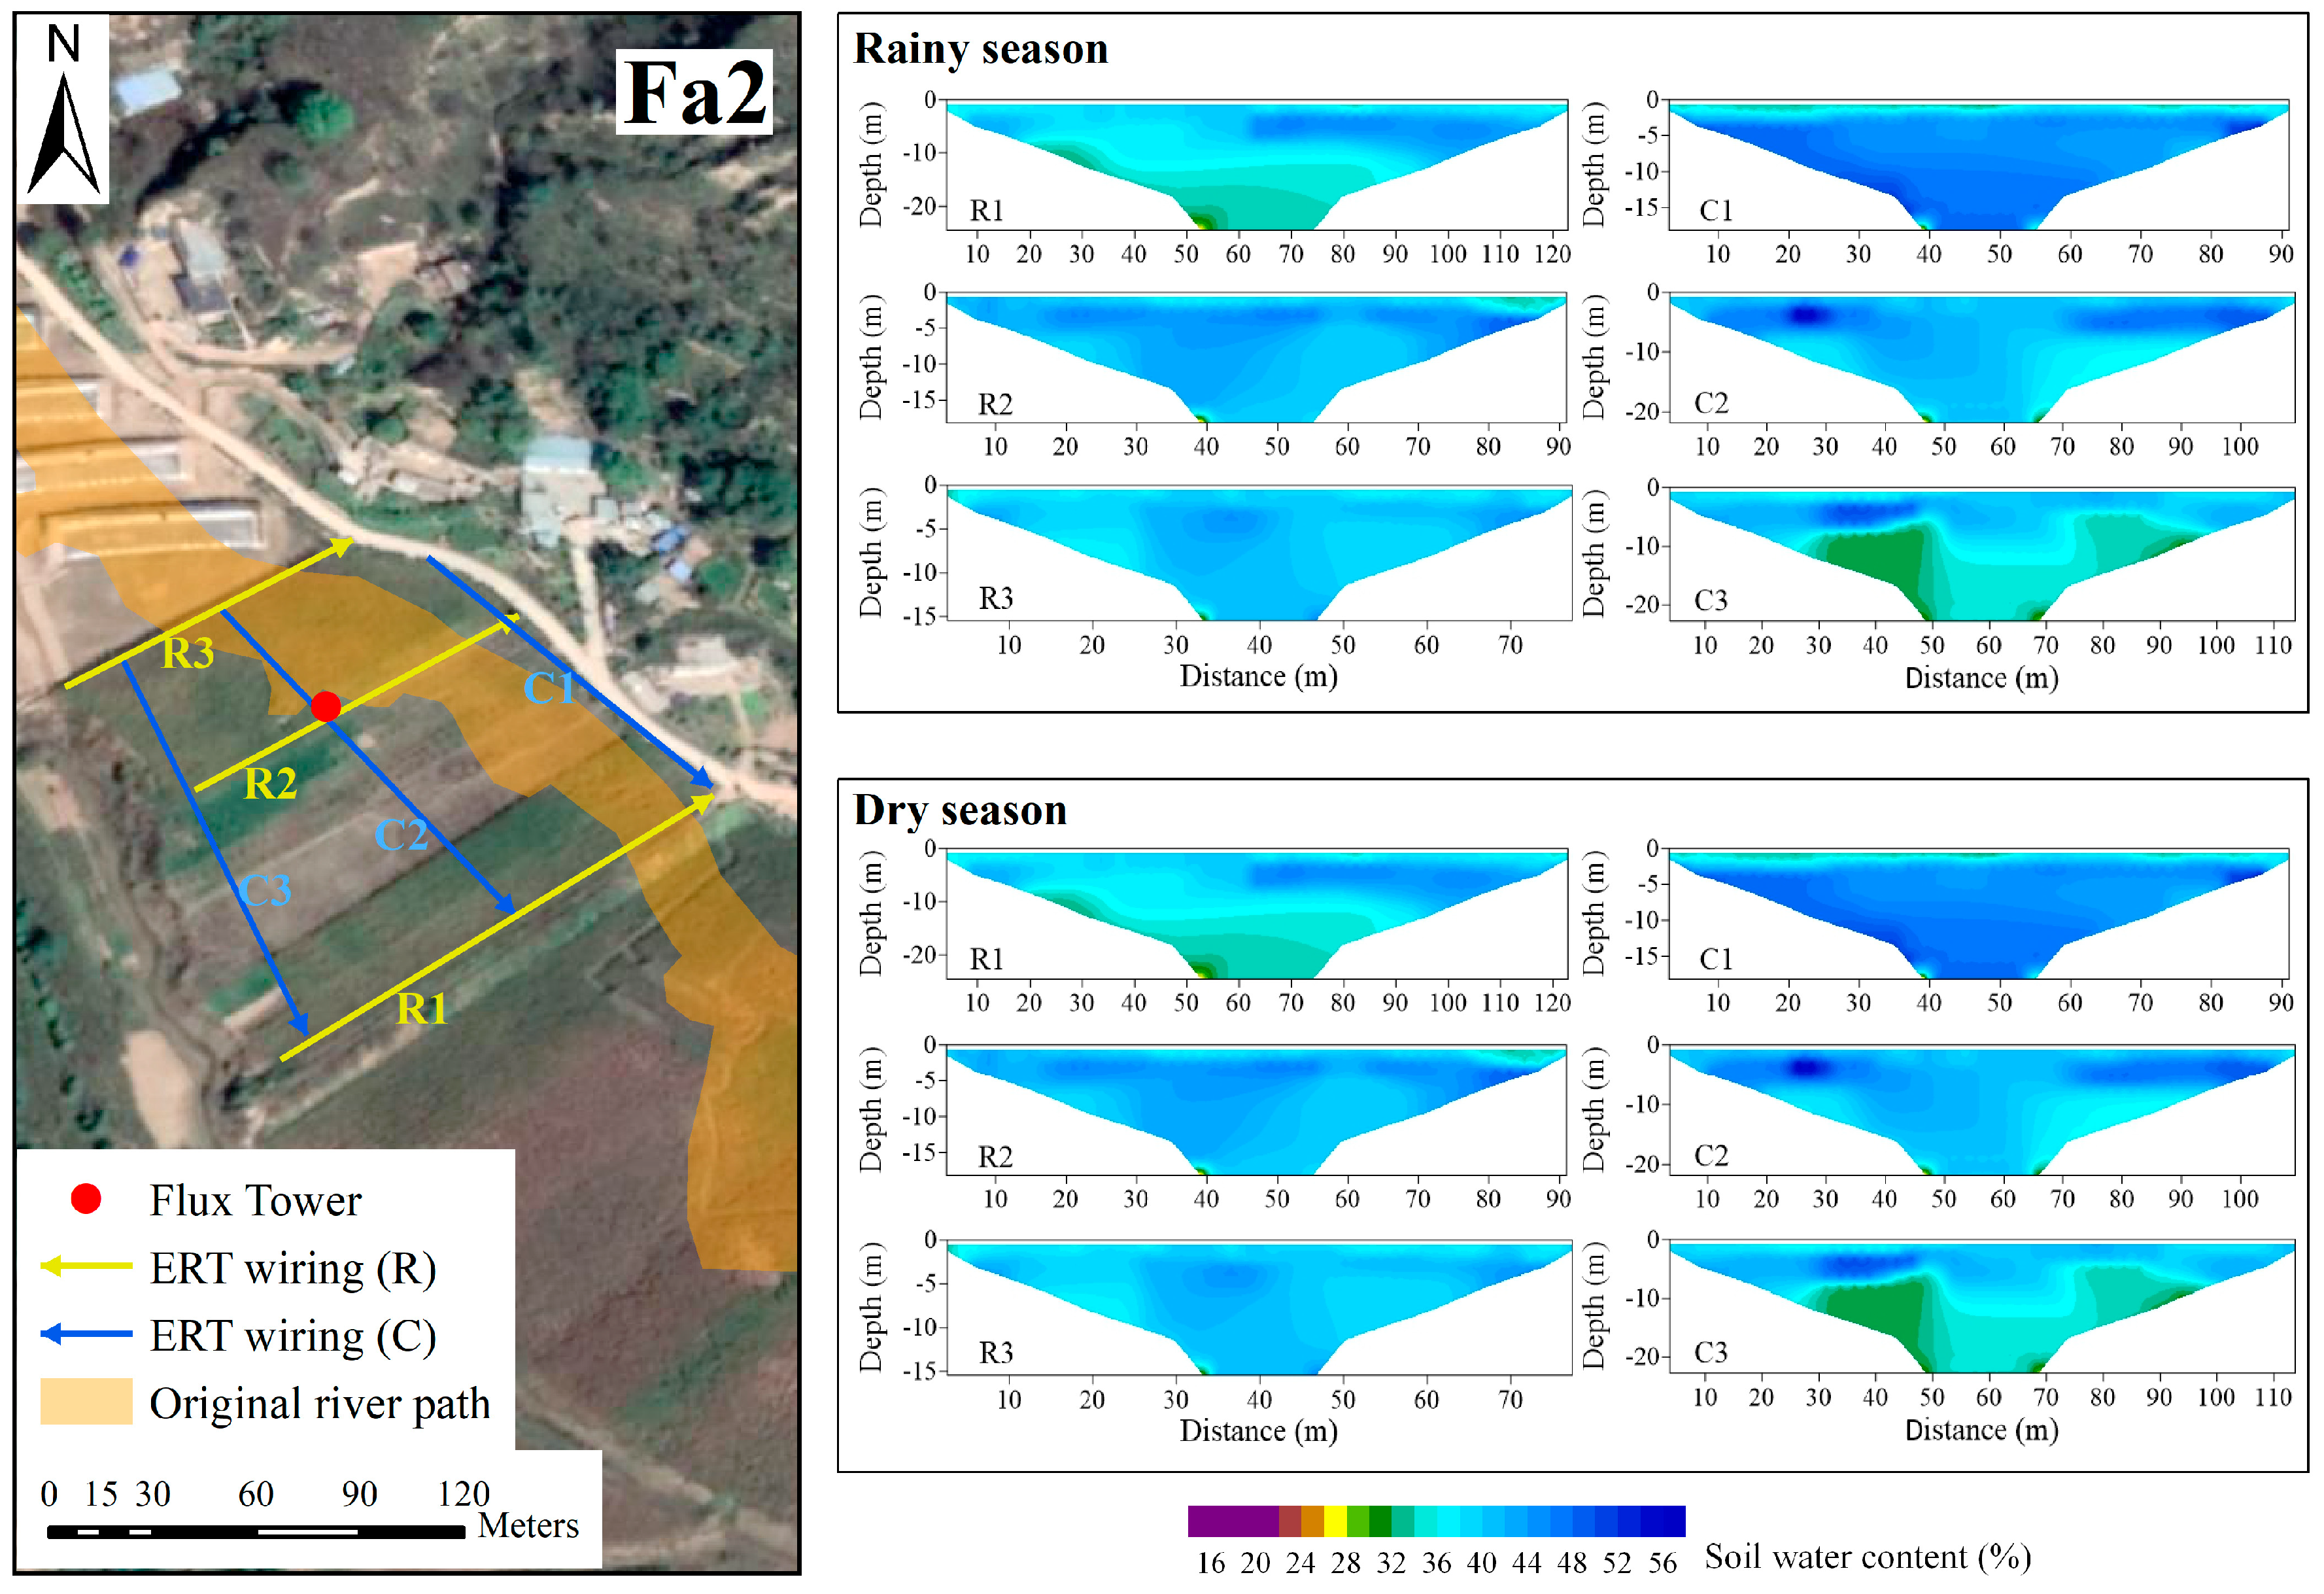
In the Fa2 backfilled plot, as depicted in Figure 4, areas with high soil moisture content were primarily distributed along the roadside (C1) and the central region (C2 and R2). During the rainy season, the mean soil moisture content measured at these locations was 40.68 ± 5.71%, 42.15 ± 5.31%, and 40.22 ± 3.17%, respectively. The dry season, however, resulted in a decrease in soil moisture content due to depletion and reduced recharge intensity. The means for these locations during the dry season were 41.61 ± 5.64%, 39.62 ± 2.10%, and 39.18 ± 3.60%, exhibiting a diminishing trend in variability. Profiles Fa3–R1 and Fa2–R3 displayed similar distributions of soil moisture content; however, they exhibited significant seasonal disparities (p < 0.01), suggesting substantial groundwater interference in the Fa3 backfilled plot.
Non-parametric analysis revealed a significant difference in soil moisture content between profiles Fa3–R1 and Fa3–R2 (p < 0.001), indicating a strong influence of land use types on soil moisture. As illustrated in Figure 5, the high soil moisture content patches in the surface layer (−5 to 0 m) of profile Fa3–R1 were likely caused by an extreme rainfall event in October 2021. Dry-season scans indicated a significant decrease in soil moisture within the surface layer, with a mean reduction of 8.4%. Notably, high soil moisture content patches in profile Fa3–R1 were primarily concentrated in the central area, while in profile Fa3–R2, they were more dispersed. Notably, both profiles are located near the original river path position.
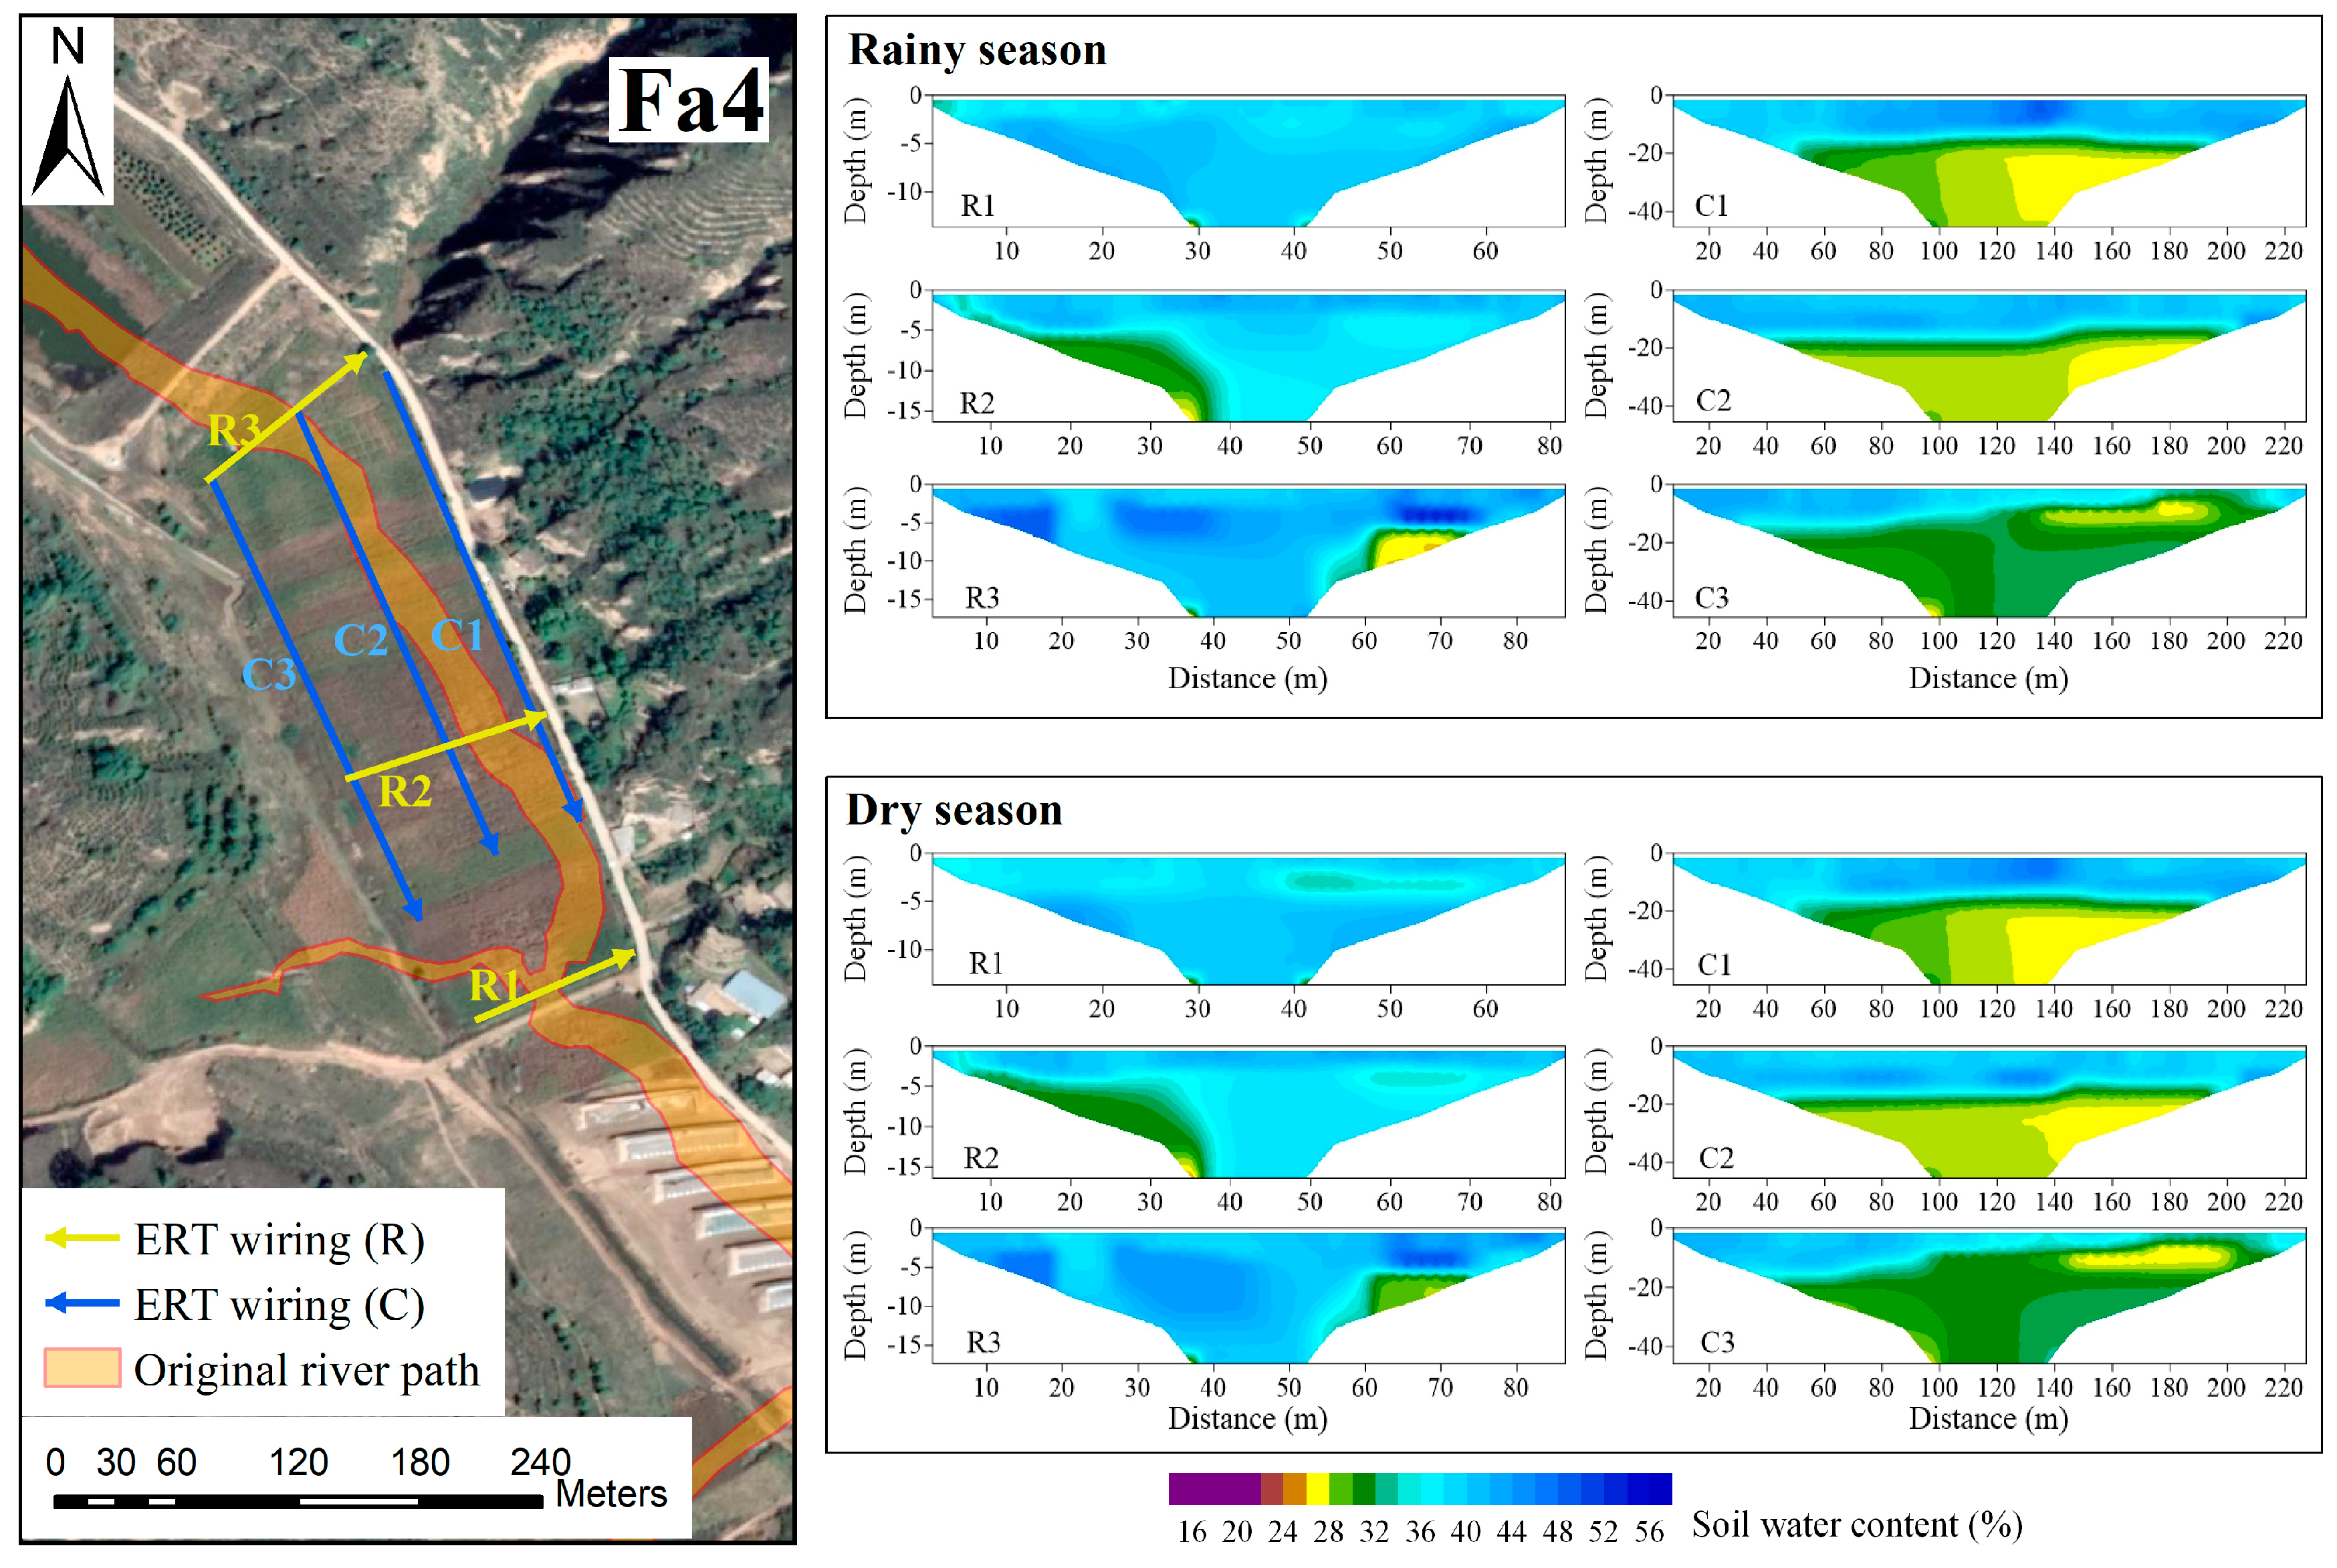
Continuing the trend observed near other reservoirs, the soil moisture content in the upstream area of the Fa4 backfilled plot was relatively high (Figure 6). During the rainy season measurements, the Fa4–R3 profile exhibited three zones of high soil moisture content distributed horizontally at 0–19.95 m, 25.65–50.35 m, and 59.85–76.95 m along the transect. Monitoring data during the dry season indicates significant differentiation in the soil moisture field, particularly in the middle section of the Fa4–R3 profile. Here, a tendency for moisture to migrate towards deeper layers was observed. In the deeper layers near the reservoir and roads, soil moisture content remained relatively stable, with mean soil moisture content change rates of −1.03% and −0.71% for the Fa4–R3 and Fa4–C1 profiles, respectively. Furthermore, profiles located farther away from roads and the reservoir exhibited increasing variability in soil moisture content.

3.2. Soil Moisture Variation in Deep Profiles

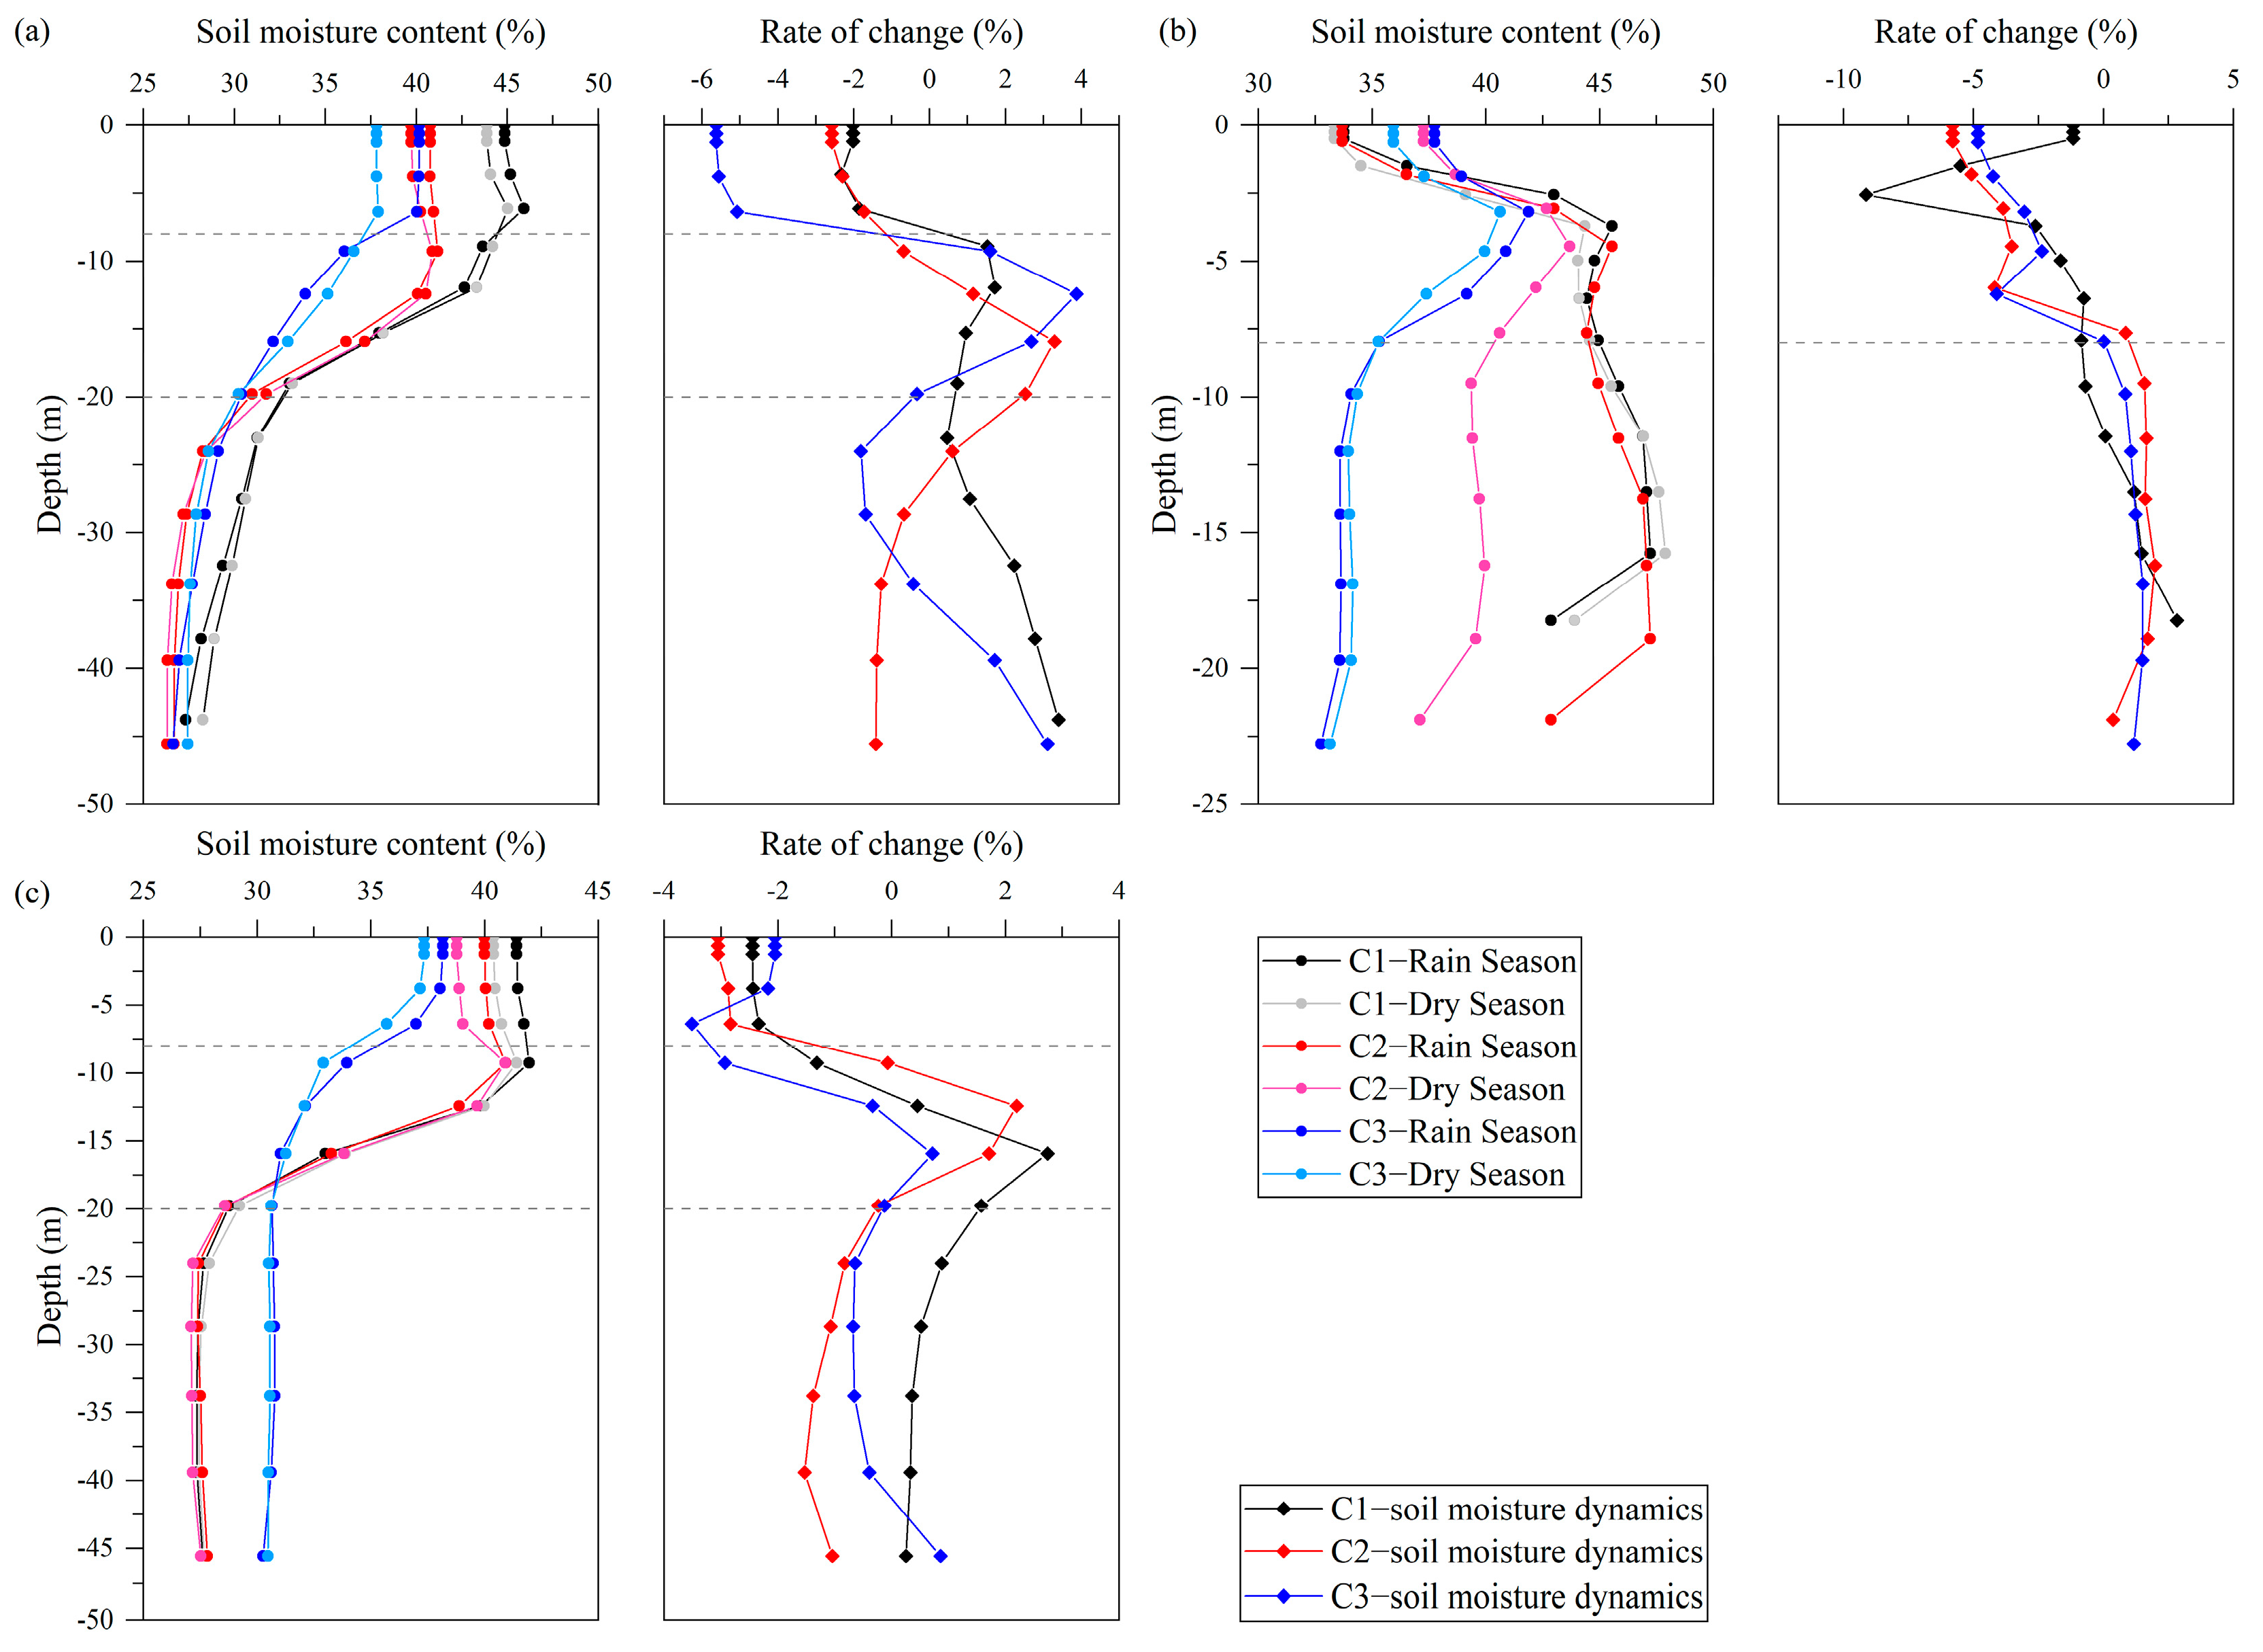
Analysis of soil moisture variations in deep profiles between the dry and wet seasons revealed distinct spatial differentiation patterns within the GLC area. Profiles in the Fa1 and Fa4 backfilled plots, located near reservoirs Re2 and Re3, respectively, exhibited consistently high soil moisture content (>35%) across profiles throughout the year. The differences in soil moisture content between dry and wet seasons in each backfilled plot were minor. Furthermore, the vertical fluctuation of soil moisture content within the shallow (0–8 m) depth range was minimal, with a maximum variation of only 1.64% observed across profiles. Soil moisture content decreased with increasing depth in the mid-depth range (8–20 m), with a maximum variation of −13.19%. However, soil moisture content in deeper layers (<−20 m) gradually returns to a steady state. Additionally, the surface and deep layers primarily functioned as zones of soil moisture loss, while the intermediate layer (−20 to −8 m) experienced an increase in moisture content, suggesting it could act as a recharge zone or a moisture transport layer.
A distinct pattern of groundwater accumulation was observed near the road in backfilled plot Fa2, likely influenced by the road structure and the drainage capacity of the area. The mean soil moisture content in profile Fa2–C1 during the rainy and dry seasons was 40.68% and 39.77%, respectively. As depicted in Figure 7b, spatial variations in soil moisture content were evident across this region. The mean soil moisture content along the longitudinal profiles (Fa2–C1 to Fa2–C3) exhibited a successive decrease with increasing distance from the original river path, suggesting a negative correlation. Additionally, in the shallow layer (>−8 m) of the Fa2 backfilled plot, soil moisture content exhibited significant seasonal variations and spatial fluctuations. It peaked at a depth of 3 m underground, with maximum and minimum ranges of 11.87% (C2–Rainy Season) and 6.28% (C3–Dry Season), respectively. These fluctuations could be influenced by factors such as spring water recharge and the original topography. The deep layer (<−8 m) exhibited relatively consistent soil moisture content, suggesting a certain water balance level in the deeper soil. Overall, the variation in soil moisture content along the depth of profiles could be primarily divided into two sections: the surface layer (−8 to 0 m) and the deep layer (<−8 m). A general trend of moisture migration towards the deeper layers was observed.

3.3. Distribution of Groundwater

This study identified a strong correlation between soil moisture distribution patterns and the original river path. Systematic cluster analysis results (Table 2) revealed variations in the correlation between the transverse profiles and the original river path across different backfilled plots. For instance, in the Fa1 backfilled plot, the R3 profile exhibited the highest correlation coefficient (R2) with the original river path, with the HP accounting for 87.50% of its area. This was followed by the R2 profile. In contrast, the distribution of the HP near the R1 profile was more scattered, even dividing into three distinct segments. Similarly, in the Fa2 backfilled plot, the high-moisture points of the R2 and R3 profiles were mainly concentrated near the original river path, while the soil moisture distribution around the R1 profile was relatively dispersed, covering a range 2.84 times wider than the width of the original river path. In the Fa3 backfilled plot, both upstream and downstream HP completely overlapped with the original river path, with the width of the downstream HP exceeding that of the upstream pathways. In the Fa4 backfilled plot, the correlation between the HP in the upstream and downstream areas of the plot and the original river path was higher than that in the middle area, and the distribution of moisture was relatively uniform. By connecting the boundaries of high-moisture areas across the transverse profiles, potential information about hydrological distribution can be uncovered, with results indicating that moisture is primarily accumulated near the original river path (Figure 8).

4. Discussion

4.1. Temporal and Spatial Dynamics of Groundwater

Numerous studies have indicated the existence of relationships between electrical resistivity and soil moisture content, with power functions being the most common [36,39,40,41]. These studies have explored the relationship between electrical resistivity and soil moisture content for various soil types and land uses, providing detailed analyses and justifications for the models employed. The observed relationship between electrical resistivity and soil moisture content in our study validates the findings of previous research, thus supporting the model’s feasibility for groundwater monitoring in the study area and laying the groundwork for further investigations. However, some differences were observed compared to the study by Sun et al. [34], which may be attributed to various factors such as different land use practices, terrain conditions, and human engineering activities. Further research is necessary to determine the reasons for these differences.
ERT has proven effective in various applications, including identifying underground features such as limestone cavities and dam leakage points [42,43,44]. It also serves as a valuable tool for exploring hydrological distributions and potential pathways within the subsurface. Furthermore, ERT technology has become a prominent method for investigating the spatial distribution patterns of soil moisture and groundwater. For instance, Leslie and Heinse [45] employed ERT to quantify the spatial distribution characteristics of soil pores, allowing them to analyze the connectivity of these pores. Similarly, Zeng et al. [46] used ERT to measure the electrical resistivity of the Heifangtai Terrace in the CLP, revealing that rainfall and groundwater interaction were the primary factors responsible for the formation of sinkholes or cracks.
The thick and uniform soil deposits characteristic of the CLP [47] are particularly favorable for monitoring deep soil moisture distribution patterns using ERT techniques. Due to this characteristic, ERT technology can accurately detect changes in soil moisture content at different depths [48,49], providing essential data for understanding the spatiotemporal variations of soil moisture in backfilled gullies. Furthermore, the heterogeneity of soil pores also plays a crucial role in soil moisture distribution, especially in the formation of potential hydrological interfaces [50,51,52]. Situated between two reservoirs, with dams constructed mainly from compacted loess deposits, the study area has a unique groundwater regime influenced by several factors. These factors include reservoir water storage, water level fluctuations, and existing groundwater flow paths. This influence leads to rising groundwater levels near the downstream ends of the reservoirs, consequently causing salt accumulation in surface soils and exacerbating soil salinization [11]. Our research findings provide significant implications for land use and water resource management in the CLP, offering a scientific basis for sustainable development.
This study confirmed that mechanical compaction significantly impacts the distribution and variation of soil moisture content, as evidenced by previous research [53,54,55]. Mechanically compacted soils exhibited a more uneven distribution of soil moisture content than untreated soils. This phenomenon could be attributed to alterations in soil particle arrangement and compaction during the mechanical process, which subsequently influence soil pore structure and moisture transport pathways [56,57,58,59]. Furthermore, mechanical compaction reduces soil porosity, limiting water storage and flow [60,61]. Consequently, in the process of land use planning and engineering construction, it is essential to thoroughly assess the implications of mechanical compaction on soil moisture distribution. Measures must be carefully devised and implemented to safeguard soil moisture resources, thereby mitigating both losses and the uneven distribution of soil moisture.
Human activities within engineered GLC areas exert diverse and complex influences on soil moisture dynamics, as evidenced by prior research [62,63]. Studies have shown that human activities under different land use conditions result in significant temporal and spatial differences in soil moisture [64,65]. During the rainy season, when soil moisture content is high, the influence of human activities on deep soil moisture is often less noticeable. However, during the dry season, with reduced precipitation and increased evaporation intensity, and under the influence of soil water potential, the influence of human activities on soil moisture becomes more pronounced [66,67,68]. In our study area, greenhouse agriculture, road embankments, and soil conservation measures are the main constraints on hydrological cycles. Greenhouse agriculture improves groundwater utilization, delaying the migration process of groundwater or deep soil moisture in the area and enriching groundwater content in downstream areas. Road embankments hinder the migration of soil moisture and gradually accumulate groundwater near them. Conversely, downstream soil conservation measures significantly hinder the downward migration of deep soil moisture, resulting in an uneven distribution pattern of water flow paths, which may contribute to severe retaining wall collapses [69,70]. This is also a common hydrological degradation problem that agricultural terraces face [71]. Therefore, a comprehensive understanding of surface and subsurface hydrological processes in engineered GLC areas is crucial. Considering and understanding the effects and outcomes of different human activities on hydrological cycles is key to assessing and managing dynamic changes in soil moisture. This will aid in formulating appropriate protection and management strategies to achieve sustainable development in the engineered GLC areas.

4.2. Potential Hydrological Pathway

Water is the primary driver of material migration and transformation, and systematic connectivity is essential for material distribution within a landscape [56,72,73,74]. In landscape ecology, connectivity refers to how organisms move between resource patches [75]. Furthermore, hydrological connectivity has both structural and functional aspects. Structural connectivity shapes river flow patterns and pathways, while functional connectivity ensures hydrological transfer processes within a watershed. Combining these aspects is key to determining hydrodynamic information [76]. Hydrological connectivity serves as a critical indicator reflecting watershed hydroecological processes, storage capacity, and restoration effectiveness. It is vital for regional and national water resource management [77]. The heterogeneity of watershed topography, geomorphology, and complexity hinders the development of universal mechanisms for hydrological connectivity. Current research primarily focuses on quantitatively characterizing surface hydrological connectivity, while the complex and varied underground groundwater conduit structures present significant challenges for assessing and analyzing their connectivity mechanisms.
The formation of potential subsurface HP in GLC areas is primarily influenced by two factors: the selection of water flow paths and the adjustment of soil pore structure [78,79]. Backfilled soil exhibits a significantly altered pore structure compared to undisturbed soil [80,81], and even after mechanical compaction, the interface between the two zones remains difficult to eliminate entirely. Within engineered GLC areas, water infiltrates through a network of channels and the adjacent soil pore system, moving downward due to the effects of gravity and capillary forces. The heterogeneous nature of soil pore structures leads to the formation of a complex network of water flow paths within different pore sizes. Additionally, the selection of these water flow paths is influenced by the sorting and arrangement of soil particles, potentially involving various channel formation mechanisms [82,83,84]. Therefore, further research on these factors’ influence on the formation of potential subsurface HP in GLC areas can contribute to a deeper understanding of groundwater migration processes and hydrological characteristics. In this study, we employed ERT solely for detecting the structural connectivity of groundwater in the study area. Although the spatiotemporal analysis revealed a significant overlap between the potential subsurface HP or flow paths and the positions of the original river path, it’s important to note that data from deep profiles only reflect the water distribution in their immediate vicinity. Consequently, the identification of potential subsurface HP should be interpreted as a trend analysis of groundwater flow paths within the study area.
Potential subsurface HP in GLCs exhibits diverse and dynamic hydrodynamic characteristics, reflecting both spatial and temporal variations. Primarily, the heterogeneity of soil pore structures and the complexity of conduit networks can lead to variations in the flow velocity and direction of groundwater. Secondly, these characteristics are intricately linked to porosity, soil type, and groundwater level [85,86]. For instance, high porosity and permeability in soils lead to increased water fluxes and rapid replenishment within HPs. Moreover, fluctuations in groundwater levels influence the hydrodynamic properties of potential subsurface HP within the GLC areas. Elevated water levels may induce drainage within the channels, while decreased water levels could facilitate channel replenishment [87]. Therefore, a comprehensive investigation into the hydrodynamic characteristics of potential subsurface HP in the GLC areas can offer a scientific foundation for the rational management and exploitation of groundwater resources.
Compacted loess exhibits a distinct pore structure compared to undisturbed loess, characterized by a higher horizontal permeability coefficient relative to the vertical coefficient [53]. This characteristic is a key factor influencing lateral preferential infiltration of soil moisture. After precipitation infiltrates the soil, it gradually moves to deeper soil layers and migrates downstream along the original river path (Figure 9). Soil heterogeneity plays a significant role throughout the process, contributing significantly to the spatially patchy distribution of deep soil moisture [88].
This study highlights the importance of investigating potential subsurface HP in GLCs for groundwater resource management and understanding hydrological processes. In-depth exploration of the hydrodynamic characteristics and formation mechanisms of potential subsurface HP in GLC areas can improve the prediction and evaluation of potential groundwater recharge. This knowledge could establish a scientific foundation for the rational utilization of groundwater resources. Moreover, a comprehensive understanding of the distribution and characteristics of potential subsurface HP in the GLC areas is essential for optimizing land use planning and mitigating the risks of groundwater pollution in the context of soil and water conservation efforts and land management.
This study has limitations that should be acknowledged, particularly concerning the generalizability of the results. The current investigation focused on a specific geological setting, limiting the generalizability of the results to other geological contexts. To validate and enhance our understanding, future research should prioritize investigating the spatial distribution and influencing mechanisms of subsurface hydrological pathways across diverse regions and land-use categories. Such efforts will contribute to the development of more precise strategies for soil and water conservation, as well as groundwater resource management.

5. Conclusions

This study developed a model that correlates electrical resistivity (ρ) with soil moisture content (θ), indicating its effectiveness in capturing soil moisture information within the deep profiles of the GLC area (R2 = 0.80). The findings reveal that the evolution of subsurface hydrology in the GLC area is significantly influenced by the original river path and topographical features. Groundwater primarily migrates along the original river path, and human activities further impact the distribution patterns of deep soil moisture. Notably, the potential HP in the middle regions of backfilled plots closely aligns with the original river path. In contrast, groundwater in the upstream and downstream regions is affected by reservoirs and concrete retaining walls, resulting in a more divergent hydrological distribution.
Our study suggests a potential boundary in soil moisture content within the GLC area, with a possible transition zone of around 8 m and another around 20 m below the surface. The zone above −8 m was characterized by more prominent soil moisture loss, while the zone between −8 and −20 m could act as a recharge zone for groundwater. Below 20 m, groundwater exhibited signs of excellent stability in terms of moisture content.
This study’s findings on groundwater flow and distribution can inform the optimization of the “Drainage–Conveyance–Barrier” system, a strategy crucial for the GLC area’s sustainable development. The optimization measures include controlling reservoir water levels to reduce the risk of localized soil salinization, upgrading the conveyance systems in the midstream area to improve agricultural irrigation efficiency and alleviate excessive waterlogging, and strengthening downstream water conservation measures to prevent soil erosion and enhance the overall stability of the project.
Utilizing data-driven strategies for soil moisture and groundwater management offers significant advantages. These strategies enable more effective control over these resources, leading to stabilized crop yields and reduced detrimental effects salinization and waterlogging. This approach not only contributes to sustainable development within the region but also establishes a scientific foundation for similar projects elsewhere. By promoting ecological safety, food security, and sustainable land use practices, data-driven management strategies offer a holistic solution for long-term environmental and agricultural well-being.

Author Contributions

Conceptualization, M.L. and Z.J.; methodology, M.L.; writing—original draft preparation, M.L.; writing—review and editing, M.L., Z.J., H.H. and G.Z.; visualization, M.L. and D.L.; project administration, J.Z. and G.C.; funding acquisition, Z.J. All authors have read and agreed to the published version of the manuscript.

Funding

The research is financially supported by the Strategic Priority Research Program of the Chinese Academy of Sciences (XDB40000000); the National Natural Science Foundation of China (41790444); and the Fundamental Research Funds for the Central Universities, CHD (300102263511).

Data Availability Statement

The raw data supporting the conclusions of this article can be requested from the corresponding author through the indicated email.

Conflicts of Interest

The authors declare no conflicts of interest.

References

  1. Wiesel, P.G.; Dresch, E.; de Santana, E.R.R.; Lobo, E.A. Urban afforestation and its ecosystem balance contribution: A bibliometric review. Manag. Environ. Qual. Int. J. 2021, 32, 453–469. [Google Scholar] [CrossRef]
  2. Cuo, L.; Zhang, Y.; Gao, Y.; Hao, Z.; Cairang, L.S. The impacts of climate change and land cover/use transition on the hydrology in the upper Yellow River Basin, China. J. Hydrol. 2013, 502, 37–52. [Google Scholar] [CrossRef]
  3. Liu, B.; Pan, L.; Qi, Y.; Guan, X.; Li, J. Land use and land cover change in the Yellow River Basin from 1980 to 2015 and its impact on the ecosystem services. Land 2021, 10, 1080. [Google Scholar] [CrossRef]
  4. Raimi, M.O.; Abiola, I.; Alima, O.; Omini, D.E. Exploring how human activities disturb the balance of biogeochemical cycles: Evidence from the carbon, nitrogen and hydrologic cycles. Nitrogen Hydrol. Cycles 2021, 02, 23–44. [Google Scholar]
  5. Lerch, R.N.; Baffaut, C.; Kitchen, N.R.; Sadler, E.J. Long-term agroecosystem research in the Central Mississippi River Basin: Dissolved nitrogen and phosphorus transport in a high-runoff-potential watershed. J. Environ. Qual. 2015, 44, 44–57. [Google Scholar] [CrossRef] [PubMed]
  6. Chen, S.; Jin, Z.; Zhang, J.; Yang, S. Soil quality assessment in different dammed-valley farmlands in the hilly-gully mountain areas of the northern Loess Plateau, China. J. Arid Land 2021, 13, 777–789. [Google Scholar] [CrossRef]
  7. Luo, K.; Moiwo, J.P. Sensitivity of the land surface hydrological cycle to human activities in China. Gondwana Res. 2023, 123, 255–264. [Google Scholar] [CrossRef]
  8. Wu, L.; Long, T.; Liu, X.; Guo, J. Impacts of climate and land-use changes on the migration of non-point source nitrogen and phosphorus during rainfall-runoff in the Jialing River Watershed, China. J. Hydrol. 2012, 475, 26–41. [Google Scholar] [CrossRef]
  9. He, X.; Zhou, J.; Zhang, X.; Tang, K. Soil erosion response to climatic change and human activity during the Quaternary on the Loess Plateau, China. Reg. Environ. Change 2006, 6, 62–70. [Google Scholar] [CrossRef]
  10. Zhao, Y.; Wang, Y.; Sun, H.; Lin, H.; Jin, Z.; He, M.; Yu, Y.; Zhou, W.; An, Z. Intensive land restoration profoundly alters the spatial and seasonal patterns of deep soil water storage at watershed scales. Agric. Ecosyst. Environ. 2019, 280, 129–141. [Google Scholar] [CrossRef]
  11. Jin, Z.; Guo, L.; Wang, Y.; Yu, Y.; Lin, H.; Chen, Y.; Chu, G.; Zhang, J.; Zhang, N. Valley reshaping and damming induce water table rise and soil salinization on the Chinese Loess Plateau. Geoderma 2019, 339, 115–125. [Google Scholar] [CrossRef]
  12. Francis, D.M.; Bryson, L.S. Proposed methodology for site-specific soil moisture obtainment utilizing coarse satellite-based data. Environ. Earth Sci. 2023, 82, 377. [Google Scholar] [CrossRef]
  13. Mirzaei, M.; Shirmohammadi, A. Utilizing Data-Driven Approaches to Forecast Fluctuations in Groundwater Table. Water 2024, 16, 1500. [Google Scholar] [CrossRef]
  14. Sasaki, Y. Resolution of resistivity tomography inferred from numerical-simulation. Geophys. Prospect. 1992, 40, 453–463. [Google Scholar] [CrossRef]
  15. Loke, M.H.; Chambers, J.E.; Rucker, D.F.; Kuras, O.; Wilkinson, P.B. Recent developments in the direct-current geoelectrical imaging method. J. Appl. Geophys. 2013, 95, 135–156. [Google Scholar] [CrossRef]
  16. Coscia, I.; Linde, N.; Greenhalgh, S.; Vogt, T.; Green, A. Estimating traveltimes and groundwater flow patterns using 3D time-lapse crosshole ERT imaging of electrical resistivity fluctuations induced by infiltrating river water. Geophysics 2012, 77, E239–E250. [Google Scholar] [CrossRef]
  17. McClymont, A.F.; Roy, J.W.; Hayashi, M.; Bentley, L.R.; Maurer, H.; Langston, G. Investigating groundwater flow paths within proglacial moraine using multiple geophysical methods. J. Hydrol. 2011, 399, 57–69. [Google Scholar] [CrossRef]
  18. González, J.A.M.; Comte, J.C.; Legchenko, A.; Ofterdinger, U.; Healy, D. Quantification of groundwater storage heterogeneity in weathered/fractured basement rock aquifers using electrical resistivity tomography: Sensitivity and uncertainty associated with petrophysical modelling. J. Hydrol. 2021, 593, 125637. [Google Scholar] [CrossRef]
  19. Soulsby, C.; Bradford, J.; Dick, J.; McNamara, J.P.; Geris, J.; Lessels, J.; Blumstock, M.; Tetzlaff, D. Using geophysical surveys to test tracer-based storage estimates in headwater catchments. Hydrol. Process. 2016, 30, 4434–4445. [Google Scholar] [CrossRef]
  20. McLachlan, P.J.; Chambers, J.E.; Uhlemann, S.; Binley, A. Geophysical characterisation of the groundwater–surface water interface. Adv. Water Resour. 2017, 109, 302–319. [Google Scholar] [CrossRef]
  21. Lesparre, N.; Robert, T.; Nguyen, F.; Boyle, A.; Hermans, T. 4D electrical resistivity tomography (ERT) for aquifer thermal energy storage monitoring. Geothermics 2019, 77, 368–382. [Google Scholar] [CrossRef]
  22. Comte, J.C.; Ofterdinger, U.; Legchenko, A.; Caulfield, J.; Cassidy, R.; Mézquita González, J.A. Catchment-scale heterogeneity of flow and storage properties in a weathered/fractured hard rock aquifer from resistivity and magnetic resonance surveys: Implications for groundwater flow paths and the distribution of residence times. Geol. Soc. Lond. Spec. Publ. 2019, 479, 35–58. [Google Scholar] [CrossRef]
  23. Lapenna, V.; Perrone, A. Time-lapse electrical resistivity tomography (TL-ERT) for landslide monitoring: Recent advances and future directions. Appl. Sci. 2022, 12, 1425. [Google Scholar] [CrossRef]
  24. Palis, E.; Lebourg, T.; Vidal, M.; Levy, C.; Tric, E.; Hernandez, M. Multiyear time-lapse ERT to study short-and long-term landslide hydrological dynamics. Landslides 2017, 14, 1333–1343. [Google Scholar] [CrossRef]
  25. Fäth, J.; Kunz, J.; Kneisel, C. Monitoring spatiotemporal soil moisture changes in the subsurface of forest sites using electrical resistivity tomography (ERT). J. For. Res. 2022, 33, 1649–1662. [Google Scholar] [CrossRef]
  26. Binley, A.; Hubbard, S.S.; Huisman, J.A.; Revil, A.; Robinson, D.A.; Singha, K.; Slater, L.D. The emergence of hydrogeophysics for improved understanding of subsurface processes over multiple scales. Water Resour. Res. 2015, 51, 3837–3866. [Google Scholar] [CrossRef] [PubMed]
  27. Claes, N.; Paige, G.B.; Grana, D.; Parsekian, A.D. Parameterization of a hydrologic model with geophysical data to simulate observed subsurface return flow paths. Vadose Zone J. 2020, 19, e20024. [Google Scholar] [CrossRef]
  28. Eekhout, J.P.; Jódar-Abellán, A.; Carrillo-López, E.; Boix-Fayos, C.; de Vente, J. Assessing the hillslope-channel contributions to the catchment sediment balance under climate change. Environ. Model. Softw. 2024, 171, 105890. [Google Scholar] [CrossRef]
  29. Ayogu, C.N.; Maduka, R.I.; Ayogu, N.O. Investigating early warning signs of gully propagation in southeastern Nigeria using erosion prediction potential models. Stoch. Environ. Res. Risk Assess. 2023, 37, 4783–4803. [Google Scholar] [CrossRef]
  30. Zhao, Y.; Wang, Y.; Wang, L. Exploring the role of land restoration in the spatial patterns of deep soil water at watershed scales. Catena 2019, 172, 387–396. [Google Scholar] [CrossRef]
  31. Jiang, R.; Zhang, M.; Feng, L.; Sun, P. Failure mechanisms and risk mitigation of check dams on the Chinese Loess Plateau: A case study at the Gutun Gully. J. Mt. Sci. 2022, 19, 1509–1524. [Google Scholar] [CrossRef]
  32. Vu, M.D.; Xayavong, V.; Do, C.A.; Pham, L.T.; Gómez-Ortiz, D.; Eldosouky, A.M. Application of the improved multi-electrode electrical exploration methods for groundwater investigation in Vientiane Province, Laos. J. Asian Earth Sci. X 2021, 5, 100056. [Google Scholar]
  33. Griffiths, D.H.; Turnbull, J.; Olayinka, A.I. Two-dimensional resistivity maping with a computer-controlled array. First Break 1990, 8, 1–9. [Google Scholar] [CrossRef]
  34. Sun, H.; Wang, Y.; Zhao, Y.; Zhang, P.; Song, Y.; He, M.; Zhang, C.; Tong, Y.; Zhou, J.; Qi, L. Assessing the value of electrical resistivity derived soil water content: Insights from a case study in the Critical Zone of the Chinese Loess Plateau. J. Hydrol. 2020, 589, 125132. [Google Scholar] [CrossRef]
  35. deGroot-Hedlin, C.; Constable, S. Occam’s inversion to generate smooth, two-dimensional models from magnetotelluric data. Geophysics 1990, 55, 1613–1624. [Google Scholar] [CrossRef]
  36. Calamita, G.; Brocca, L.; Perrone, A.; Piscitelli, S.; Lapenna, V.; Melone, F.; Moramarco, T. Electrical resistivity and TDR methods for soil moisture estimation in central Italy test-sites. J. Hydrol. 2012, 454, 101–112. [Google Scholar] [CrossRef]
  37. Archie, G.E. The electrical resistivity log as an aid in determining some reservoir characteristics. Trans. Am. Inst. Min. Metall. Eng. 1942, 146, 54–61. [Google Scholar] [CrossRef]
  38. Uhlemann, S.; Kuras, O.; Richards, L.A.; Naden, E.; Polya, D.A. Electrical resistivity tomography determines the spatial distribution of clay layer thickness and aquifer vulnerability, Kandal Province, Cambodia. J. Asian Earth Sci. 2017, 147, 402–414. [Google Scholar] [CrossRef]
  39. Michot, D.; Benderitter, Y.; Dorigny, A.; Nicoullaud, B.; King, D.; Tabbagh, A. Spatial and temporal monitoring of soil water content with an irrigated corn crop cover using surface electrical resistivity tomography. Water Resour. Res. 2003, 39, 1138. [Google Scholar] [CrossRef]
  40. Alamry, A.S.; van der Meijde, M.; Noomen, M.; Addink, E.A.; van Benthem, R.; de Jong, S.M. Spatial and temporal monitoring of soil moisture using surface electrical resistivity tomography in Mediterranean soils. Catena 2017, 157, 388–396. [Google Scholar] [CrossRef]
  41. Celano, G.; Palese, A.M.; Ciucci, A.; Martorella, E. Evaluation of soil water content in tilled and cover-cropped olive orchards by the geoelectrical technique. Geoderma 2011, 163, 163–170. [Google Scholar] [CrossRef]
  42. Redhaounia, B.; Ilondo, B.O.; Gabtni, H.; Sami, K.; Bédir, M. Electrical Resistivity Tomography (ERT) Applied to Karst Carbonate Aquifers: Case Study from Amdoun, Northwestern Tunisia. Pure Appl. Geophys. 2016, 173, 1289–1303. [Google Scholar] [CrossRef]
  43. Ducut, J.D.; Alipio, M.; Go, P.J.; Concepcion, R., II; Vicerra, R.R.; Bandala, A.; Dadios, E. A review of electrical resistivity tomography applications in underground imaging and object detection. Displays 2022, 73, 102208. [Google Scholar] [CrossRef]
  44. Arjwech, R.; Ruansorn, T.; Schulmeister, M.; Everett, M.E.; Thitimakorn, T.; Pondthai, P.; Somchat, K. Protection of electricity transmission infrastructure from sinkhole hazard based on electrical resistivity tomography. Eng. Geol. 2021, 293, 106318. [Google Scholar] [CrossRef]
  45. Leslie, I.N.; Heinse, R. Characterizing soil-pipe networks with pseudo-three-dimensional resistivity tomography on forested hillslopes with restrictive horizons. Vadose Zone J. 2013, 12, 1–10. [Google Scholar] [CrossRef]
  46. Zeng, R.Q.; Meng, X.M.; Zhang, F.Y.; Wang, S.Y.; Cui, Z.J.; Zhang, M.S.; Zhang, Y.; Chen, G. Characterizing hydrological processes on loess slopes using electrical resistivity tomography—A case study of the Heifangtai Terrace, Northwest China. J. Hydrol. 2016, 541, 742–753. [Google Scholar] [CrossRef]
  47. Liu, G.; Hu, F.; Abd Elbasit, M.A.; Zheng, F.; Liu, P.; Xiao, H.; Zhang, Q.; Zhang, J. Holocene erosion triggered by climate change in the central Loess Plateau of China. Catena 2018, 160, 103–111. [Google Scholar] [CrossRef]
  48. Whalley, W.R.; Binley, A.; Watts, C.W.; Shanahan, P.; Dodd, I.C.; Ober, E.S.; Ashton, R.W.; Webster, C.P.; White, R.P.; Hawkesford, M.J. Methods to estimate changes in soil water for phenotyping root activity in the field. Plant Soil 2017, 415, 407–422. [Google Scholar] [CrossRef]
  49. Beff, L.; Gunther, T.; Vandoorne, B.; Couvreur, V.; Javaux, M. Three-dimensional monitoring of soil water content in a maize field using Electrical Resistivity Tomography. Hydrol. Earth Syst. Sci. 2013, 17, 595–609. [Google Scholar] [CrossRef]
  50. Song, X.; Wang, S.; Xiao, G.; Wang, Z.; Liu, X.; Wang, P. A study of soil water movement combining soil water potential with stable isotopes at two sites of shallow groundwater areas in the North China Plain. Hydrol. Process. 2009, 23, 1376–1388. [Google Scholar] [CrossRef]
  51. Vanella, D.; Peddinti, S.R.; Kisekka, I. Unravelling soil water dynamics in almond orchards characterized by soil-heterogeneity using electrical resistivity tomography. Agric. Water Manag. 2022, 269, 107652. [Google Scholar] [CrossRef]
  52. Ju, X.; Gao, L.; She, D.; Jia, Y.; Pang, Z.; Wang, Y. Impacts of the soil pore structure on infiltration characteristics at the profile scale in the red soil region. Soil Tillage Res. 2024, 236, 105922. [Google Scholar] [CrossRef]
  53. Yue, F.; Ren, X.; Wang, X.; Tian, W. Experimental study on the influence of soil structure index on loess permeability. Adv. Mater. Sci. Eng. 2022, 2022, 9618732. [Google Scholar] [CrossRef]
  54. Liao, M.; Zhang, R.; Lv, J.; Yu, B.; Pang, J.; Li, R.; Xiang, W.; Tao, W. Subsidence monitoring of fill area in Yan’an new district based on Sentinel-1A time series imagery. Remote Sens. 2021, 13, 3044. [Google Scholar] [CrossRef]
  55. de Souza, P.R.; de Lima, H.V.; da Silva, G.B.; dos Santos Moura, A. Limiting water content for compaction induced by mechanized operations in the soil with oil palm in the Eastern Amazon. J. Soil Sci. Plant Nutr. 2023, 23, 6167–6182. [Google Scholar] [CrossRef]
  56. Alaoui, A.; Lipiec, J.; Gerke, H.H. A review of the changes in the soil pore system due to soil deformation: A hydrodynamic perspective. Soil Tillage Res. 2011, 115, 1–15. [Google Scholar] [CrossRef]
  57. Lipiec, J.; Hatano, R. Quantification of compaction effects on soil physical properties and crop growth. Geoderma 2003, 116, 107–136. [Google Scholar] [CrossRef]
  58. Qi, Z.H.; Shi, M.L. From micro to macro. Analysis of the effects of dynamic compaction to natural sedimentary clay in low mountain valley area. In Proceedings of the International Symposium on Geomechanics and Geotechnics, Shanghai, China, 10–12 October 2010. [Google Scholar]
  59. Li, K.P.; Chen, Y.G.; Ye, W.M.; Wang, Q. Modelling the evolution of dual-pore structure for compacted clays along hydro-mechanical paths. Comput. Geotech. 2023, 157, 105308. [Google Scholar] [CrossRef]
  60. Nawaz, M.F.; Bourrie, G.; Trolard, F. Soil compaction impact and modelling. A review. Agron. Sustain. Dev. 2013, 33, 291–309. [Google Scholar] [CrossRef]
  61. Pagliai, M.; Vignozzi, N. The soil pore system as an indicator of soil quality. In Proceedings of the International Conference on Sustainable Soil Management for Environmental Protection, Florence, Italy, 2–7 July 2001; Catena Verlag: Stuttgart, Germany, 2001; pp. 71–82. [Google Scholar]
  62. Chen, H.; Zhang, W.; Wang, K.; Fu, W. Soil moisture dynamics under different land uses on karst hillslope in northwest Guangxi, China. Environ. Earth Sci. 2010, 61, 1105–1111. [Google Scholar] [CrossRef]
  63. Liu, Y.; Yang, Y. Spatial-temporal variability pattern of multi-depth soil moisture jointly driven by climatic and human factors in China. J. Hydrol. 2023, 619, 129313. [Google Scholar] [CrossRef]
  64. Zucco, G.; Brocca, L.; Moramarco, T.; Morbidelli, R. Influence of land use on soil moisture spatial-temporal variability and monitoring. J. Hydrol. 2014, 516, 193–199. [Google Scholar] [CrossRef]
  65. de Queiroz, M.G.; da Silva, T.G.F.; Zolnier, S.; Jardim, A.M.D.R.F.; de Souza, C.A.A.; Júnior, G.D.N.A.; de Morais, J.E.F.; de Souza, L.S.B. Spatial and temporal dynamics of soil moisture for surfaces with a change in land use in the semi-arid region of Brazil. Catena 2020, 188, 104457. [Google Scholar] [CrossRef]
  66. Panwar, S.; Chakrapani, G.J. Climate change and its influence on groundwater resources. Curr. Sci. 2013, 105, 37–46. [Google Scholar]
  67. Zhang, E.; Liu, Y.; Pan, T.; Tan, Q.; Ma, Z. Evaluating the Effects of Climate Change and Human Activities on the Seasonal Trends and Spatial Heterogeneity of Soil Moisture. Remote Sens. 2022, 14, 4862. [Google Scholar] [CrossRef]
  68. Shi, D.; Tan, H.; Rao, W.; Liu, Z.; Elenga, H.I. Variations in water content of soil in apricot orchards in the western hilly regions of the Chinese Loess Plateau. Vadose Zone J. 2020, 19, e20034. [Google Scholar] [CrossRef]
  69. Abaci, O.; Papanicolaou, A.N.T. Long-term effects of management practices on water-driven soil erosion in an intense agricultural sub-watershed: Monitoring and modelling. Hydrol. Process. Int. J. 2009, 23, 2818–2837. [Google Scholar] [CrossRef]
  70. Cevasco, A.; Pepe, G.; Brandolini, P. The influences of geological and land use settings on shallow landslides triggered by an intense rainfall event in a coastal terraced environment. Bull. Eng. Geol. Environ. 2014, 73, 859–875. [Google Scholar] [CrossRef]
  71. Preti, F.; Guastini, E.; Penna, D.; Dani, A.; Cassiani, G.; Boaga, J.; Deiana, R.; Romano, N.; Nasta, P.; Palladino, M.; et al. Conceptualization of water flow pathways in agricultural terraced landscapes. Land Degrad. Dev. 2018, 29, 651–662. [Google Scholar] [CrossRef]
  72. Wilson, E.O.; MacArthur, R.H. The Theory of Island Biogeography, 2nd ed.; Princeton University Press: Princeton City, NJ, USA, 2016. [Google Scholar]
  73. Levin, S.A. Dispersion and population interactions. Am. Nat. 1974, 108, 207–228. [Google Scholar] [CrossRef]
  74. Fahrig, L.; Merriam, G. Habitat patch connectivity and population survival: Ecological archives e066-008. Ecology 1985, 66, 1762–1768. [Google Scholar] [CrossRef]
  75. Tischendorf, L.; Fahring, L. On the usage and measurement of landscape connectivity. Oikos 2000, 90, 7–19. [Google Scholar] [CrossRef]
  76. Turnbull, L.; Wainwright, J.; Brazier, R.E. A conceptual framework for understanding semi-arid land degradation: Ecohydrological interactions across multiple-space and time scales. Ecohydrology 2008, 1, 23–34. [Google Scholar] [CrossRef]
  77. Gao, C.; Gao, X.; Jia, P. Summary comments on hydrologic connectivity. Chin. J. Appl. Environ. Biol. 2017, 23, 586–594. [Google Scholar]
  78. Jiao, H.; Wu, Y.; Wang, H.; Chen, X.; Li, Z.; Wang, Y.; Zhang, B.; Liu, J. Micro-scale mechanism of sealed water seepage and thickening from tailings bed in rake shearing thickener. Miner. Eng. 2021, 173, 107043. [Google Scholar] [CrossRef]
  79. Hornberger, G.M.; Germann, P.F.; Beven, K.J. Throughflow and solute transport in an isolated sloping soil block in a forested catchment. J. Hydrol. 1991, 124, 81–99. [Google Scholar] [CrossRef]
  80. Zhang, B.; Horn, R.; Hallett, P.D. Mechanical resilience of degraded soil amended with organic matter. Soil Sci. Soc. Am. J. 2005, 69, 864–871. [Google Scholar] [CrossRef]
  81. Schaffer, B.; Stauber, M.; Muller, R.; Schulin, R. Changes in the macro-pore structure of restored soil caused by compaction beneath heavy agricultural machinery: A morphometric study. Eur. J. Soil Sci. 2007, 58, 1062–1073. [Google Scholar] [CrossRef]
  82. Shan, W.; Chen, H.; Yuan, X.; Ma, W.; Li, H. Mechanism of pore water seepage in soil reinforced by step vacuum preloading. Bull. Eng. Geol. Environ. 2021, 80, 2777–2787. [Google Scholar] [CrossRef]
  83. Zhou, G.G.D.; Cui, P.; Chen, H.Y.; Zhu, X.H.; Tang, J.B.; Sun, Q.C. Experimental study on cascading landslide dam failures by upstream flows. Landslides 2013, 10, 633–643. [Google Scholar] [CrossRef]
  84. Bianchi, M.; Zheng, C.; Wilson, C.; Tick, G.R.; Liu, G.; Gorelick, S.M. Spatial connectivity in a highly heterogeneous aquifer: From cores to preferential flow paths. Water Resour. Res. 2011, 47, 1–18. [Google Scholar] [CrossRef]
  85. Rapti-Caputo, D.; Martinelli, G. The geochemical and isotopic composition of aquifer systems in the deltaic region of the Po River plain (northern Italy). Hydrogeol. J. 2009, 17, 467–480. [Google Scholar] [CrossRef]
  86. Aubertin, G.M. Nature and Extent of Macropores in Forest Soils and Their Influence on Subsurface Water Movement; Northeastern Forest Experiment Station: Durham, NH, USA, 1971. [Google Scholar]
  87. Wang, S.; Song, X.; Wang, Q.; Xiao, G.; Liu, C.; Liu, J. Shallow groundwater dynamics in North China Plain. J. Geogr. Sci. 2009, 19, 175–188. [Google Scholar] [CrossRef]
  88. Vanelsas, J.D.; Trevors, J.T.; Vanoverbeek, L.S. Influence of soil properties on the vertical movement of genetically-marked Pseudomonas fluorescens through large soil microcosms. Biol. Fertil. Soils 1991, 10, 249–255. [Google Scholar] [CrossRef]
Figure 1. Location map of GLC in Gutun Watershed on the Loess Plateau of China (CLP) (a). (b) elevation map of the study area; (c) third sampling sub-region; (d) first sampling sub-region; (e) second sampling sub-region; (f) fourth sampling sub-region.
Water 16 02001 g001
Figure 2. Meteorological conditions at the study site throughout the hydrological year (2021–2022). Daily precipitation (mm), temperatures (°C), and relative humidity (HR). The annual mean temperature is depicted by the red dashed line.
Water 16 02001 g002
Figure 3. Soil moisture distribution in the Fa1 backfilled plot at different temporal and spatial scales.
Water 16 02001 g003
Figure 4. Soil moisture distribution in the Fa2 backfilled plot at different temporal and spatial scales.
Water 16 02001 g004
Figure 5. Soil moisture distribution in the Fa3 backfilled plot at different temporal and spatial scales.
Water 16 02001 g005
Figure 6. Soil moisture distribution in the Fa4 backfilled plot at different temporal and spatial scales.
Water 16 02001 g006
Figure 7. Soil moisture content and rate of change across depth profiles in Fa1 (a), Fa2 (b), and Fa4 (c).
Water 16 02001 g007
Figure 8. Spatial distribution of high soil moisture content points.
Water 16 02001 g008
Figure 9. The subsurface hydrological migration model in the GLC area.
Water 16 02001 g009
Table 1. Detailed information on ERT measurements: sampling dates, locations, profile lengths, and system types.
Sampling DateBackfilled PlotsProfileLength/mType
November 2021,
April 2022
Fa1C1225.60Wenner
C2235.00
C3235.00
R1159.80
R2164.50
R3141.00
November 2021,
April 2022
Fa2C194.00
C2112.80
C3117.50
R1126.90
R294.00
R379.90
November 2021,
April 2022
Fa3R179.90
R247.00
November 2021,
April 2022
Fa4C1235.00
C2235.00
C3235.00
R170.50
R284.60
R389.30
Table 2. Mathematical statistics of high soil moisture content points in transverse profiles.
Sub-RegionsProfileThe Length of Profile (m)Rainy SeasonDry Season
The HP Range (m)The Number of SamplesClassSampling DateThe HP Range (m)The Number of SamplesClassSampling Date
Fa1R1159.805.00~52.701141/330 November 2021~8 December 202128.90~66.00981/59 April 2022–15 April 2022
56.00~93.501081/369.70~93.50721/5
96.90~154.701481/396.90~130.90961/5
R2164.50127.75~159.25482/4124.00~159.00572/4
R3141.00109.50~136.50314/4106.50~136.50244/4
Fa2R1126.9063.45~120.15643/460.75~120.15803/4
R2945.00~85.001222/437.00~87.00803/4
R379.933.15~73.95244/516.15~75.652323/5
Fa3R179.916.15~36.562642/429.75~73.95892/6
R2476.50~43.501053/63.50~43.50314/5
Fa4R170.55.25~56.253672/32.25~50.253172/4
R284.631.50~74.701173/331.50~81.901222/4
R389.327.55~82.65552/427.55~86.451172/4
Disclaimer/Publisher’s Note: The statements, opinions and data contained in all publications are solely those of the individual author(s) and contributor(s) and not of MDPI and/or the editor(s). MDPI and/or the editor(s) disclaim responsibility for any injury to people or property resulting from any ideas, methods, instructions or products referred to in the content.