Article

Assessment of Changes in Hydrometeorological Indicators and Intra-Annual River Runoff in the Ile River Basin

by
Rustam G. Abdrakhimov
1,
Aigul N. Akzharkynova
1,*,
Javier Rodrigo-Ilarri
2,*,
Kh Md Nahiduzzaman
3,
Makpal E. Dautaliyeva
1 and
María-Elena Rodrigo-Clavero
2
1
Faculty of Geography and Environmental Sciences, Al-Farabi Kazakh National University, Almaty 05013, Kazakhstan
2
Instituto de Ingeniería del Agua y del Medio Ambiente (IIAMA), Universitat Politècnica de València (UPV), 46022 Valencia, Spain
3
School of Architecture, Planning and Design (SAP+D), Mohammed VI Polytechnic University (UM6P), Ben Guerir 43150, Morocco
*
Authors to whom correspondence should be addressed.
Water 2024, 16(13), 1921; https://doi.org/10.3390/w16131921
Submission received: 26 May 2024 / Revised: 1 July 2024 / Accepted: 3 July 2024 / Published: 5 July 2024
(This article belongs to the Special Issue Impacts of Climate Change on Water Resources: Assessment and Modeling)

Abstract

:
Water management strategies in the Ile River basin (Republic of Kazakhstan) have traditionally relied on historical data without fully considering the potential impacts of climate change. This gap can lead to underestimating the changes in temperature, precipitation patterns, and runoff, hindering effective water resource management. This study aimed to analyze how a changing climate is affecting the Ile River basin’s water regime. Specifically, it investigated trends in temperature, precipitation, and runoff within the basin, emphasizing the importance of incorporating these intra-annual variations when planning water management strategies and hydraulic structures. A detailed analysis of the long-term data was conducted, focusing on changes in meteorological indicators. This included average air temperatures and annual precipitation for elevations above and below 1500 m during cold and warm periods. The analysis aimed to identify and quantify trends of increase or decrease. Meteorological stations were strategically chosen to represent both arid and humid areas within the basin, accounting for the region’s significant altitude variations. The investigation revealed several key findings. Rising average annual air temperatures are leading to a larger area experiencing snowmelt and a longer warm period within the runoff formation zone. This directly impacts the water balance of the basin. Additionally, an increase in total annual precipitation, particularly during the cold season within the runoff formation zone, suggests a potential for future water resource growth, assuming that these trends persist. This study highlights the importance of considering intra-annual variations in water regimes when developing water management strategies. The observed changes in temperature and precipitation patterns within the Ile River basin necessitate adjustments to existing plans to ensure sustainable water resource management in a changing climate.

1. Introduction

Changes in climatic indicators, particularly air temperature and precipitation patterns, demonstrably exert a direct influence on the hydrological regimes of rivers. These alterations manifest as modifications in the characteristics of both annual and intra-annual runoff volumes. The World Meteorological Organization (WMO) estimated that by 2020, over 20% of the world’s river basins would experience significant changes in their water surface area, with some facing rapid increases, and others substantial decreases [1]. Such rapid variations in the flow of shared river systems heighten the risk of natural disasters like floods and droughts. This disrupts existing water-sharing agreements and escalates the potential for water conflicts between nations. The broader impacts of climate change on water resources significantly influence human health and livelihoods, posing challenges to security at the individual, national, regional, and global scales [1,2].
Furthermore, anthropogenic global warming is anticipated to intensify the hydrological cycle, leading to elevated temperatures and enhanced evaporation rates. Additionally, a warmer atmosphere possesses the capacity to hold more moisture, potentially leading to increased precipitation [3]. As previously noted, global warming is projected to contribute to greater rainfall, though snowfall may decrease during colder seasons, ultimately resulting in higher total runoff volumes [4]. Research by [5], employing the Climatic Research Unit’s (CRU) data from 1930 to 2009, identified a general trend of increasing annual precipitation across the surveyed area, with the exception of the southwestern region of Central Asia. Changes in climatic characteristics, observed globally, exert a significant influence on living conditions. This impact is particularly pronounced within the study basin, a region recognized as one of the most economically developed areas of Kazakhstan.
Climate change scenarios for the Republic of Kazakhstan, where this study was focused, were developed using an ensemble of 15 models from the Coupled Model Intercomparison Project (CMIP3) [6,7]. These models consistently projected warming trends in air temperature and precipitation across various scenarios. Scenario B1 exhibited the least significant changes, while scenarios A1B and A2 presented the most substantial alterations. Under B1, the average annual surface air temperatures in Kazakhstan are expected to rise by 1.6 °C by 2030 (range: 1.3–2.0 °C), 2.1 °C by 2050 (range: 1.4–2.9 °C), and 2.7 °C by 2085 (range: 2.1–3.2 °C) [8]. A vulnerability assessment of water resources in the context of climate change was conducted for all water management basins. Projections under scenario A2 for the period up to 2035 suggest an overall increase in water resources across Kazakhstan. Notably, changes in the southeastern region, encompassing the Ile, Koksu, and Karatal River basins, are anticipated to range from 9% to 10.9% [8]. Within the Ile River basin, the increase in average annual air temperature intensifies progressively downstream, with less pronounced warming observed in high mountain regions. Near the river delta, the temperature rise averages between 0.30 and 0.40 °C per decade [9]. Precipitation fluctuations exhibit both negative and positive trends over multiple years, with a notable decrease primarily observed in August and September at key monitoring stations [9].
In light of these anticipated changes in climatic conditions, this study aimed to assess the hydrological regime and analyze the factors influencing runoff formation in the main rivers of the Ile basin catchment.

2. Materials and Methods

2.1. Description of the Study Area

The Ile River serves as the principal watercourse within the Lake Balkash basin. Originating from the Tekes River in Kazakhstan, the Ile River traverses the territory of the People’s Republic of China (PRC) before merging with the Kunes and Kash Rivers. Re-entering Kazakhstan, the Ile River ultimately discharges into Lake Balkash after a total course of 1439 km. Within Kazakhstan, the river’s length is approximately 815 km. The Ile River basin encompasses 77,400 km2 within Kazakhstan, representing roughly 55% of the total basin area (140,000 km2). Notably, the runoff-generating portion of the basin lies within China, characterized by a river network density ranging from 0.6 to 3 km/km2. Kazakhstan contributes approximately 30% of the total water resources of the Ile River [10].
The assessment and forecasting of surface water regimes in relation to key meteorological indicators, particularly precipitation and air temperature, are crucial for understanding the water exchange dynamics. Such knowledge is becoming increasingly in demand for the informed planning of the region’s future economic development.

2.2. Collection of Observational Data and Processing

Systematic hydrological monitoring within the Ile Alatau began in the early 20th century, with the establishment of a gauging station on the Small (Kishi) Almaty River in 1908, followed by stations on the Kaskelen River (1909) and the Turgen, Talgar, and Yesik Rivers (1912) [11]. Initially, observations focused solely on the periodic water level and flow measurements. However, the 1930s marked the transition to a more comprehensive approach, encompassing the systematic monitoring of river discharge and other hydrological elements within the basin [11]. Despite these efforts, data coverage remains limited, particularly in high-altitude areas where significant runoff generation occurs and in vast lowland regions with specific runoff formation characteristics due to intensive water withdrawal for irrigation and other economic activities.
To address this research, all data were sourced from official channels [12] with a proven history of successful application in both research and practical contexts [12,13,14,15]. Daily time series data for precipitation, air temperature, and river discharge were obtained from publicly available annual reports published by the National Hydrometeorological Service of the Republic of Kazakhstan (Kazhydromet) [13,14,15]. It is important to note that the data utilized originated from Kazhydromet’s observation network, which employs widely accepted instruments and methods for systematic data collection.
This study focused on analyzing variations in air temperature and precipitation due to the extensive and reliable observation series available for these elements. Both factors are considered key determinants of runoff formation. Air temperature data serve as an indirect indicator of evaporation, a parameter inherently challenging to precisely calculate within water balance studies. For meteorological data analysis, statistical data from 12 meteorological stations across the Almaty and Zhetysu regions were utilized (Figure 1). It is important to note that the observation period for meteorological data is shorter in the foothill and low-mountain regions of Ile Alatau compared to high-mountain areas. Stations in Almaty city, Zharkent city, Big Almaty Lake, Mynzhylki, Yesik city, and Shelek boast observation series exceeding 80 years. Data from other stations within the network range from 50 to 70 years.
The analysis of long-term river runoff changes within the Ile River basin is based on observations collected at 16 hydrological stations strategically located throughout the basin and its main tributaries (see Figure 1, Tables S1 and S2, and Figure S1 in the Supplementary Materials).
HydroSHEDS data, along with Advanced Spaceborne Thermal Emission and Reflection Radiometer (ASTER) digital elevation models (DEMs) [16], were employed to delineate the catchment areas associated with each observation station. Stream network data were obtained from HydroRIVERS [17,18]. This online resource originates from HydroSHEDS, a global mapping project that provides stream network information suitable for regional and global-scale analyses at a grid resolution of 15 arcseconds.
The significant variations in elevation across the region necessitated the selection of stations that encompassed both drier and more humid areas within the catchment. This strategic selection allowed for the assessment of climatic indicator changes across a diverse range of ecological zones, spanning from the high-mountainous regions to the semi-arid lowlands surrounding Lake Balkhash.

2.3. Research Methods

Statistical methods were employed to analyze long-term fluctuations in the hydrometeorological characteristics, which serve as indicators of natural factors influencing runoff formation. The average value of each parameter for the entire observation period served as the baseline for the statistical calculations. However, it is acknowledged that natural processes are not random and may exhibit inhomogeneity over time. The statistical series of runoff characteristics can be influenced by both anthropogenic activities and climatic changes, both of which impact surface runoff.
Therefore, calculating a reliable long-term average (norm) requires demonstrably homogeneous data samples. To assess the homogeneity of observed hydrometeorological characteristics, cumulative integral curves were employed. These curves enable the identification of homogeneous periods within extended time series by analyzing changes in the average line that accounts for natural fluctuations such as high-water and low-water years observed in the annual discharge data.
Furthermore, linear trend coefficients determined by the least squares method were used to estimate changes in climatic characteristics over specific time intervals. The coefficient of determination (R2) serves as a measure of trend significance, indicating the percentage contribution of the trend component to the overall variability of the climatic variable during the analyzed period.
Gaps in streamflow observations were addressed using the method of analogy, which also allows for the evaluation of potential anthropogenic impacts on natural discharge values. When selecting an analogous station for hydrological data restoration, the primary criterion is the synchronicity of flow fluctuations between the reference station with missing data and the candidate analog station. This synchronicity is quantified by the coefficient of pair or multiple correlation, following established criteria outlined in [19], as shown in Equation (1):
n/ ≥ (6–10), R ≥ RKP; R/σR ≥ AKP; K/σK ≥ BKP
where n/ is the number of joint years of observations in the given point and point analogs (n/ ≥ 6 at one analogue, n/ ≥ 10 at two or more analogs); R is the coefficient of the pair or multiple correlation between the flow values of the investigated river and flow values in the point analogs, K is the coefficient of the regression equation; σK is the root mean square error of regression coefficient; RKP is the critical value of pair or multiple correlation coefficient (usually set ≥0.70); AKP and BKP are the critical values of ratios of R/σR and K/σK, respectively (usually set as ≥2.0).
The homogeneity of the time series for the chosen analysis period was evaluated using the Student’s t-test, Fisher’s F-test, and the Wilcoxon signed-rank test. These tests assess the presence of statistically significant trends or breaks within the data series, ensuring the validity of subsequent analyses. The following characteristics were determined: nx, Qx, σx, Cvx, where nx is the number of years of the studied series; Qx is the average water discharge for the period C; σx is the coefficient of variability of annual runoff in units; and Cvx is the coefficient of variation. The coefficient of variation (Cv, dimensionless) can be calculated from σx using the formula Cv = (σx/Qx) expressed in percentage.
Student’s (t) and Fisher’s (F) statistics were determined according to Equations (2) and (3) [20]:
t = y ¯ x ¯ n 1 σ y 2 + n 2 σ x 2 n 1 n n 1 + n 2 2 n 1 + n 2
F = σ 1 2 σ 2 2
For stations located downstream of large water storage structures including the Kapchagai Hydroelectric Power Plant (HPP) on the Ile River, the Bestobe HPP on the Sharyn River, and the Bartogai Reservoir on the Shelek River, the following methodology was employed to restore natural runoff conditions for the period of reservoir operation [21].
The impact of ponds and reservoirs on annual runoff was accounted for using reduction coefficients calculated by Equation (4):
δ = 1 W D / y b + W D
where δ   is the coefficient of change (decrease) of the annual runoff in fractions of a unit; y b is the household runoff changed under the influence of economic activity; and W D is the filling volume of ponds and reservoirs.
The filling volume of ponds and reservoirs was approximated due to the lack of regime observations of water level. The coefficient of change (decrease) of annual runoff for ponds and reservoirs on rivers ( δ ) was assumed to be equal in accordance with the recommendations of normative documents [19].
The filling volume of ponds and reservoirs is determined by the drawdown coefficient:
W D = K c p W n
where Kcp is the drawdown coefficient and Wn is the usable capacity of ponds or reservoirs (in hm3). Absolute changes (decreases) in runoff are determined by Equation (6):
Δ y c p = y c p ( 1 δ )
Natural runoff is calculated by Equation (7):
y e c m = y c p + y c p

3. Results and Discussion

This study examined the meteorological characteristics of the Ile-Balkhash region in Kazakhstan, specifically focusing on how they influence river regimes. Global warming is projected to alter air temperature and precipitation patterns across the territory, with the Ile-Balkhash region likely experiencing its own unique effects. These anticipated changes in temperature and precipitation are expected to directly impact river runoff indicators within the basin.
The Ile-Balkhash region falls within climatic region III, characterized by distinct warm and cold periods as defined by [22]. During the cold period (November to March), average monthly temperatures range from −20 °C to −2 °C. Winters experience negative air temperatures, while summers are hot with increased solar radiation. Precipitation data are categorized based on these warm and cold seasons, representing the theoretical height of a water layer that would form from liquid and melted solid precipitation if no runoff, evaporation, or seepage occurs [22]. This standardized approach facilitates comparisons across the entire study area, acknowledging that even within the “warm” season, highland regions may experience colder temperatures. Meteorological data encompassing the entire period of instrumental observations up to 2021 were utilized for the analysis.
Consistent with national trends, the Ile-Balkhash region exhibits a pattern of rising average annual air temperatures. On average, Kazakhstan experiences a temperature increase of 0.32 °C per decade [23]. Annual precipitation totals demonstrate a weak upward trend (2.6 mm/decade) primarily driven by increases in spring precipitation (10–20% per decade in some regions) [23]. Conversely, autumn precipitation shows a decreasing trend, ranging from 2 to 12% per decade in specific regions [23].
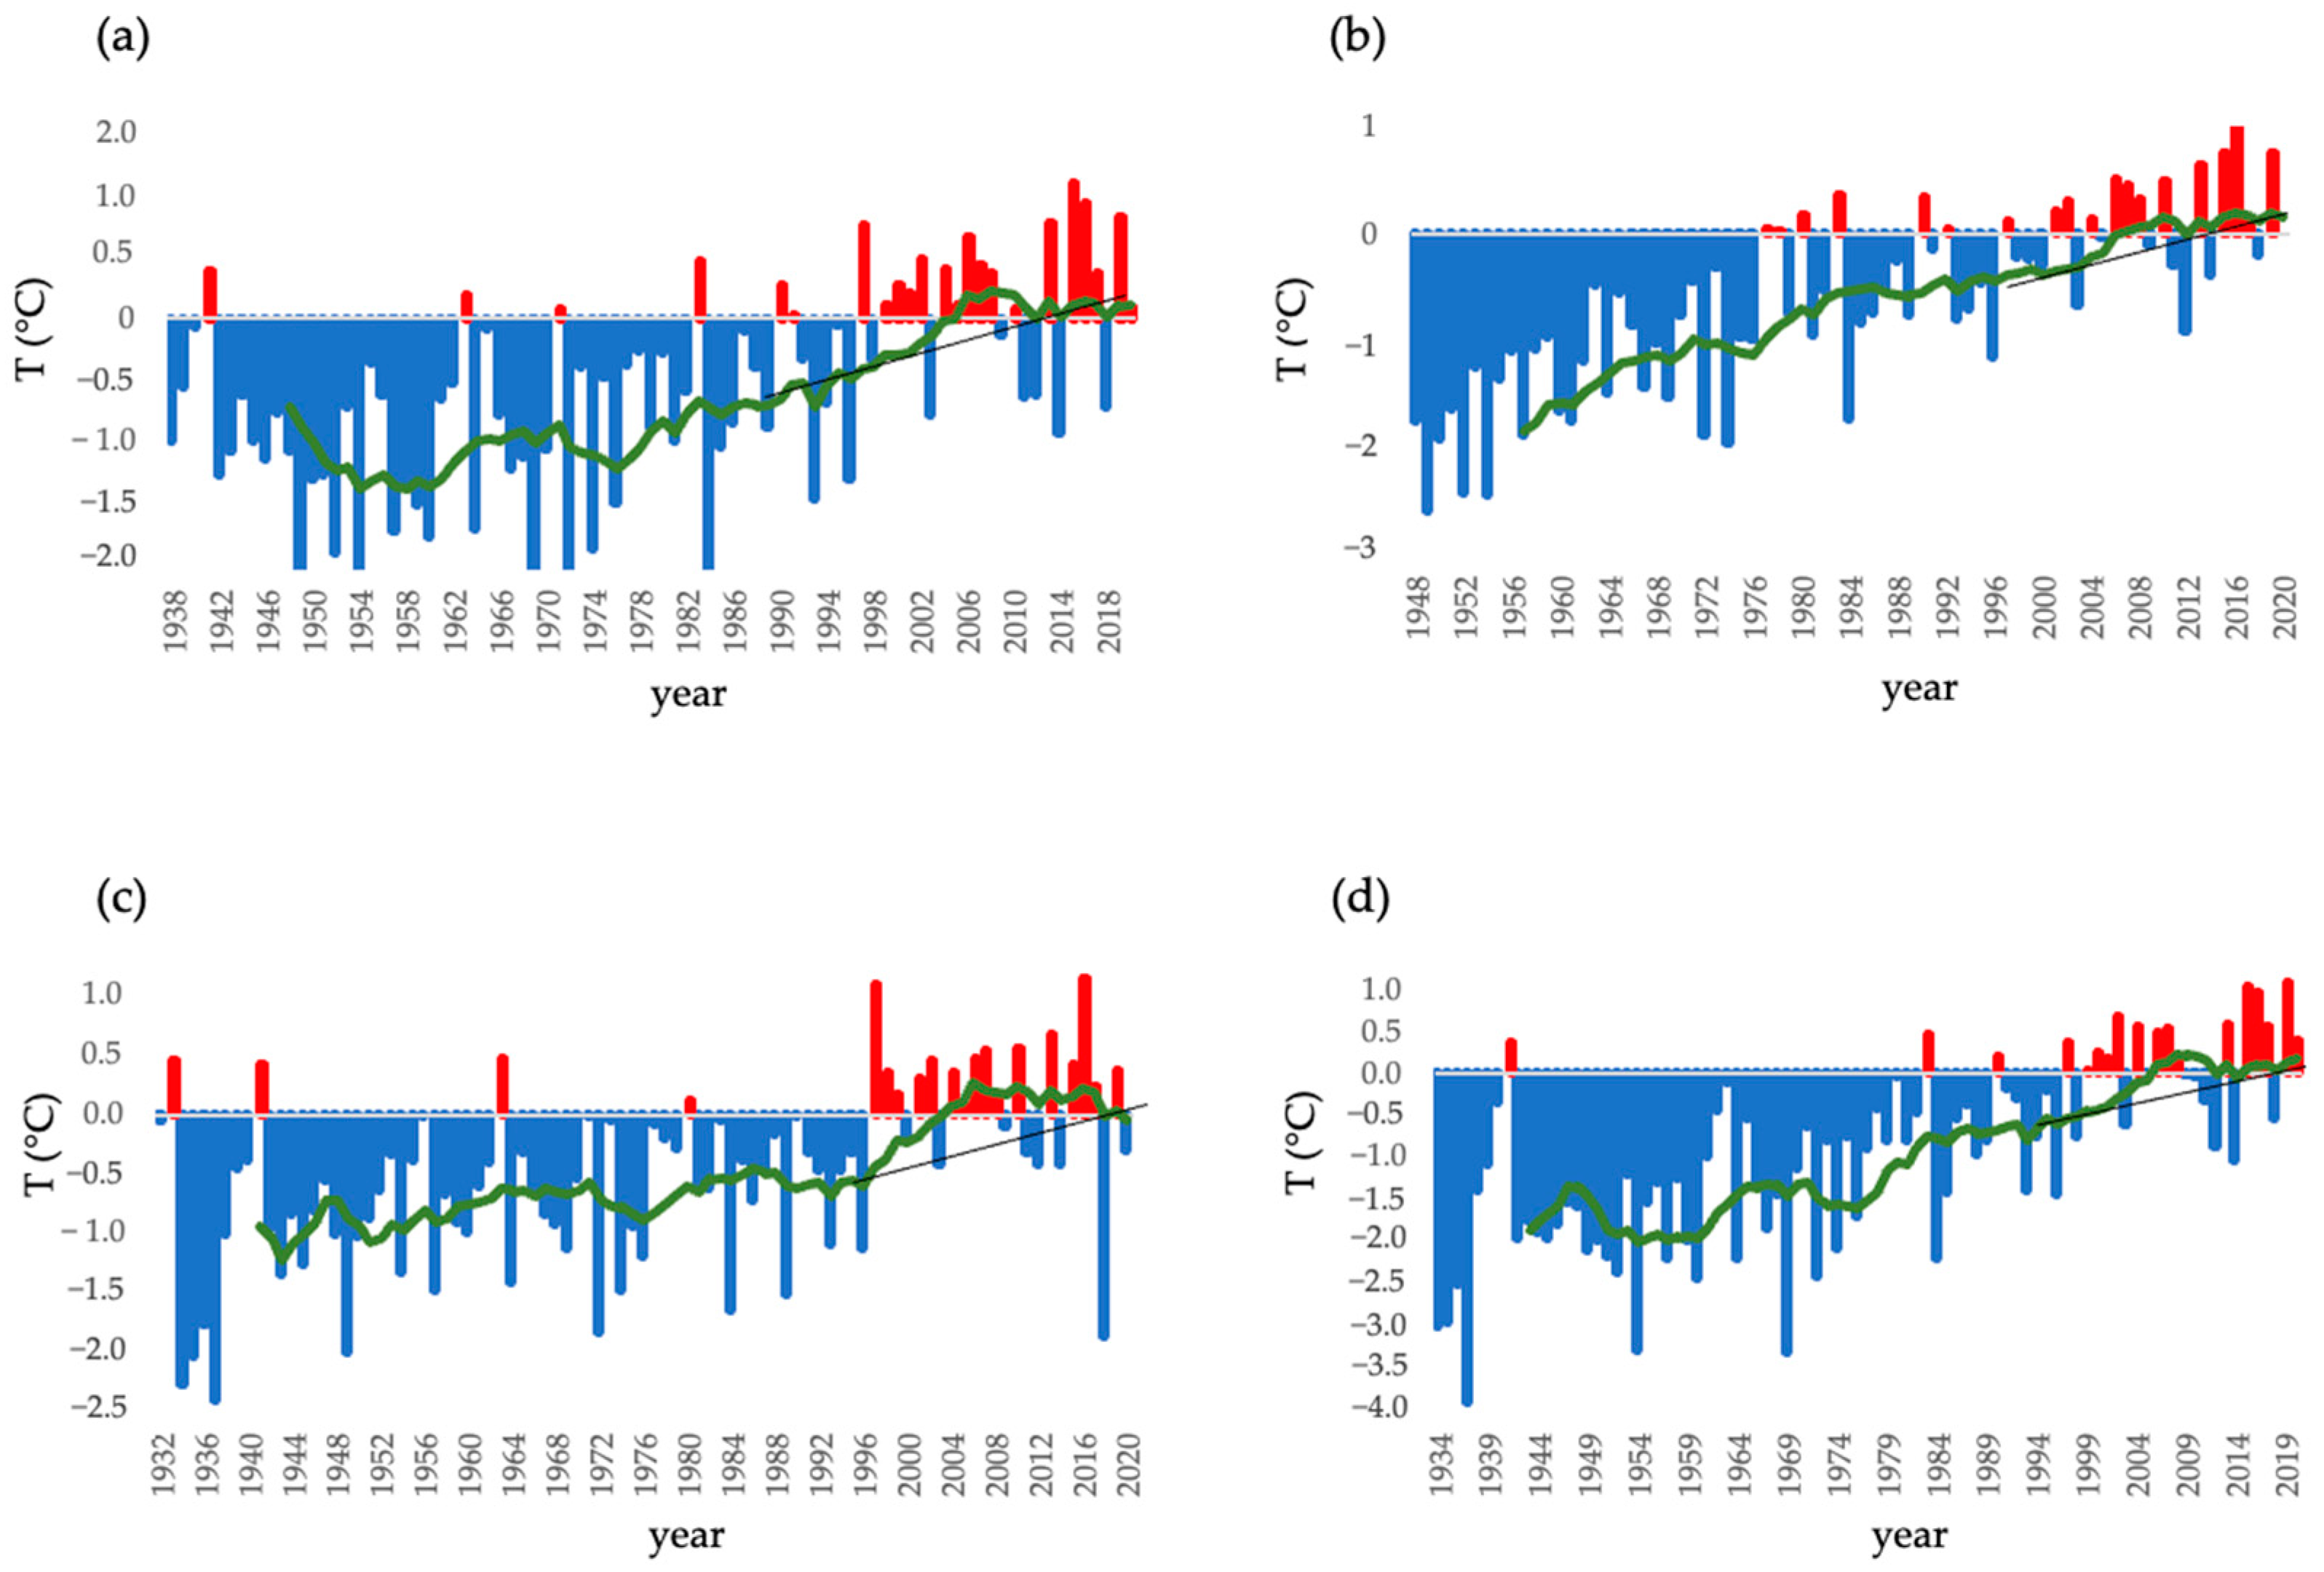
To quantify regional climate changes, air temperature anomalies were calculated relative to the 1991–2020 baseline period, as recommended by the World Meteorological Organization (WMO) [24]. These anomalies represent deviations from the established climatic norm. Analysis of the data (Figure 2) suggests two distinct periods within the mean annual temperature record: one reflecting the natural variability and the other incorporating the effects of climate change.
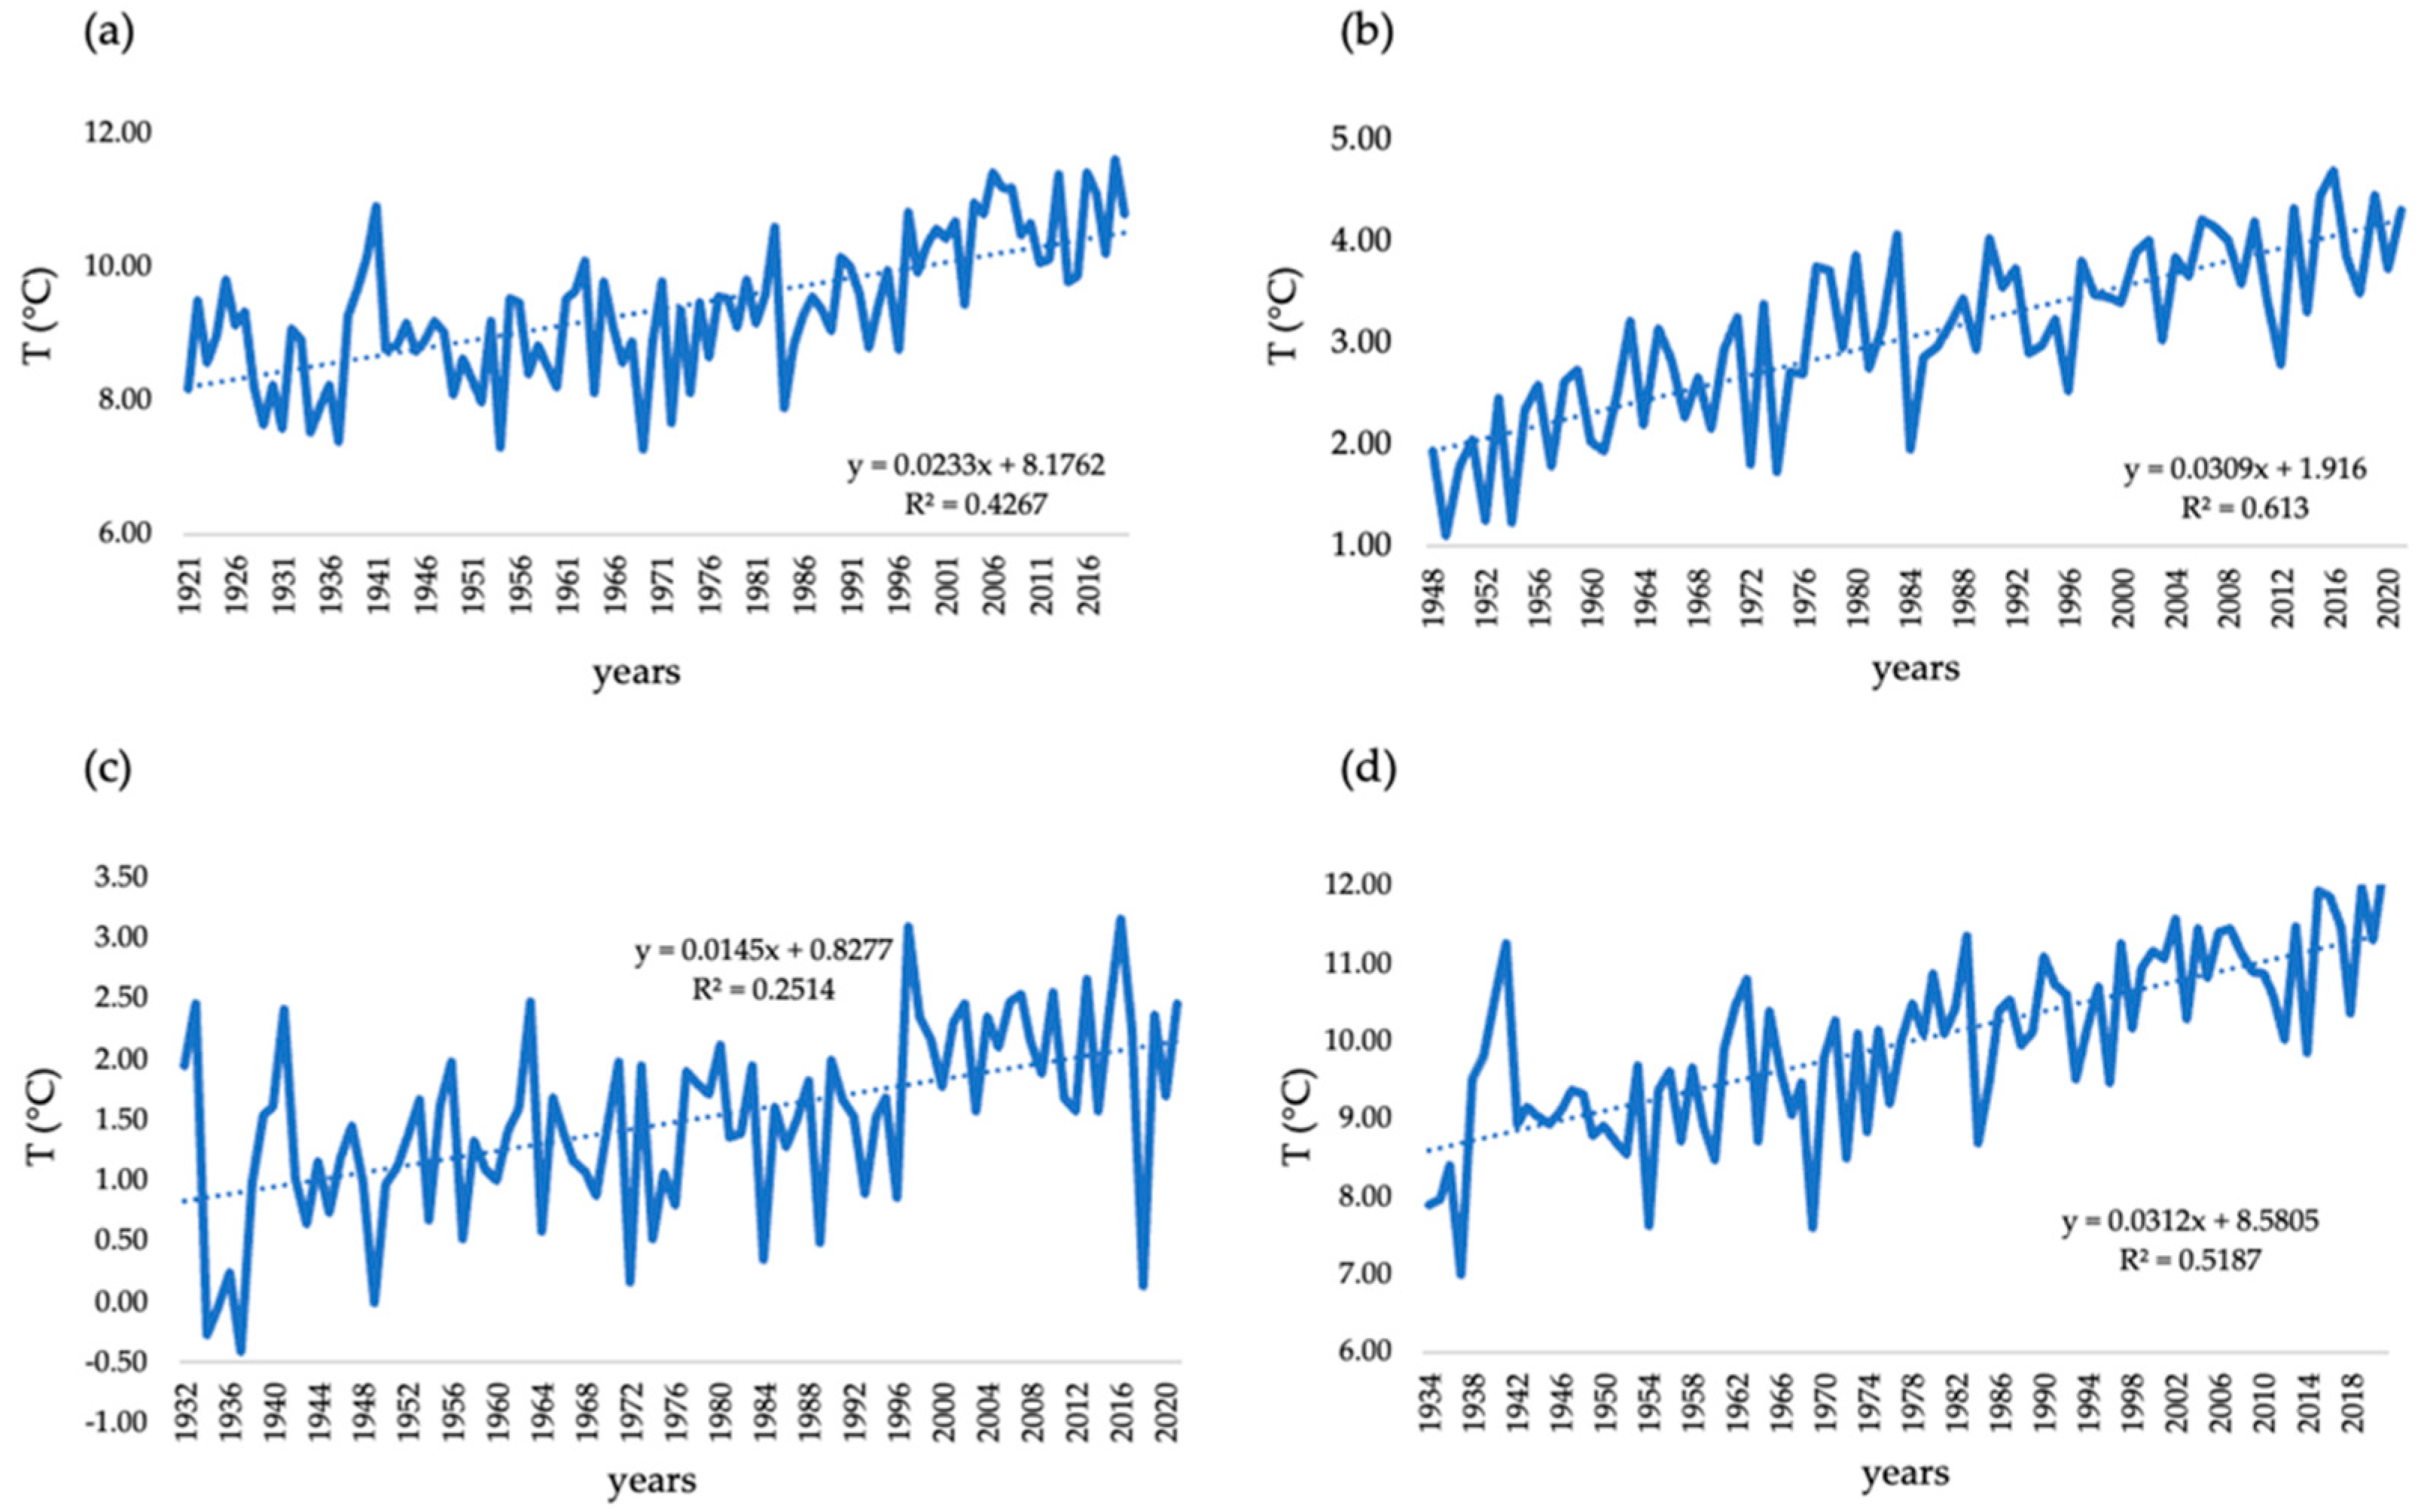
Linear trend analysis of multi-year mean annual air temperature data revealed a consistent pattern of temperature increase throughout the basin, encompassing all elevation zones. Figure 3 exemplifies these calculations for select meteorological stations within the study area.
While traditional trend assessments rely on analyzing deviations from long-term averages, these methods struggle to pinpoint the exact onset of climate change. Furthermore, long-term averages may not accurately represent the “norm” for a specific period.
To address these limitations and identify statistically robust periods for analysis, we employed cumulative integral curves of mean annual air temperature (Figure 4). These curves effectively reveal homogeneous periods within the data, allowing for a more precise evaluation of quantitative changes in air temperature.
As anticipated, rising air temperatures documented in the previous section translate into changes in evaporation rates and overall moisture balance within the basin, ultimately impacting river runoff. Analysis of the cumulative integral curves for mean annual air temperature across meteorological stations revealed a particularly significant acceleration in warming since the mid-1990s, following a general upward trend observed since the 1970s. Aligning with previous research [25], the year 1996, marking the onset of this intensified warming period, was adopted as the new reference point for the study area. Since 1997, average annual air temperatures have increased by 1.2 °C at elevations below 1500 m and by 0.9 °C at higher elevations (Table 1)
It is recognized that intra-annual runoff characteristics are controlled by both annual water balance elements and the thermal and moisture regimes of distinct warm and cold periods. These periods are characterized by specific thermal indicators, intensity of solar radiation, and type of precipitation. Construction norms established by the Republic of Kazakhstan define these periods for the entire country [22], with acknowledgement of potential altitudinal variations. In the study region, November to March is typically designated as the cold period, and April to October as the warm period. While deviations from this categorization may exist in high-mountainous areas, the average monthly air temperatures and, excluding these areas, the sums of liquid and solid precipitation, exhibited consistency across the broader basin. Therefore, for the sake of uniformity, the recommended division of cold and warm periods was adopted for this study.
An analysis of the temperature data revealed a significant increase in the average annual mean temperatures at basin altitudes below 1500 m. This increase was observed to be 2.5 °C during the cold season and 1.0 °C during the warm season, which aligns with the findings of previous research [26]. Linear trend coefficients calculated for both monthly and yearly average air temperatures indicated a warming trend in the recent period compared to the pre-1970 observations. Notably, the most pronounced temperature increase occurred during the colder seasons. Meteorological stations at Lepsy, Zharkent, and Ayagoz recorded the highest temperature rises in February and March, reaching 1.1 °C per decade and 1.4 °C per decade, respectively. Furthermore, the observed temperature changes were consistent with the statistical data presented in [27]. These data demonstrated an increase in the number of both warm days and nights, accompanied by a decrease in cold days and nights. These findings align with the expected consequences of an overall temperature rise. The results highlight significant shifts in temperature extremes since 1950, particularly evident in indices based on daily minimum temperatures. Statistical analysis of the global land area indicated a marked reduction in the annual duration of cold nights and a corresponding increase in warm nights across over 70% of the sampled area. While similar trends were observed in the daily maximum temperature readings, the magnitude of these increases was comparatively smaller.
Analysis of the research data suggested a notable increase in air temperature within the Ile River basin, observed both before 1973 and from 1974 to 2015. The most significant warming trend occurred during the latter period (1974–2015), with statistically significant temperature increases recorded at all meteorological stations across the basin. The magnitude of warming exhibited spatial variability, with the most pronounced increases observed at stations located in the Ile River delta, particularly Kuygan and Bakanas, where temperatures rose by more than 0.40 °C per decade from 1974 to 2015. Similarly, data from the Almaty meteorological station revealed a shift in the rate of warming, increasing from 0.04 °C per decade pre-1973 to 0.52 °C per decade from 1974 to 2015 [28].
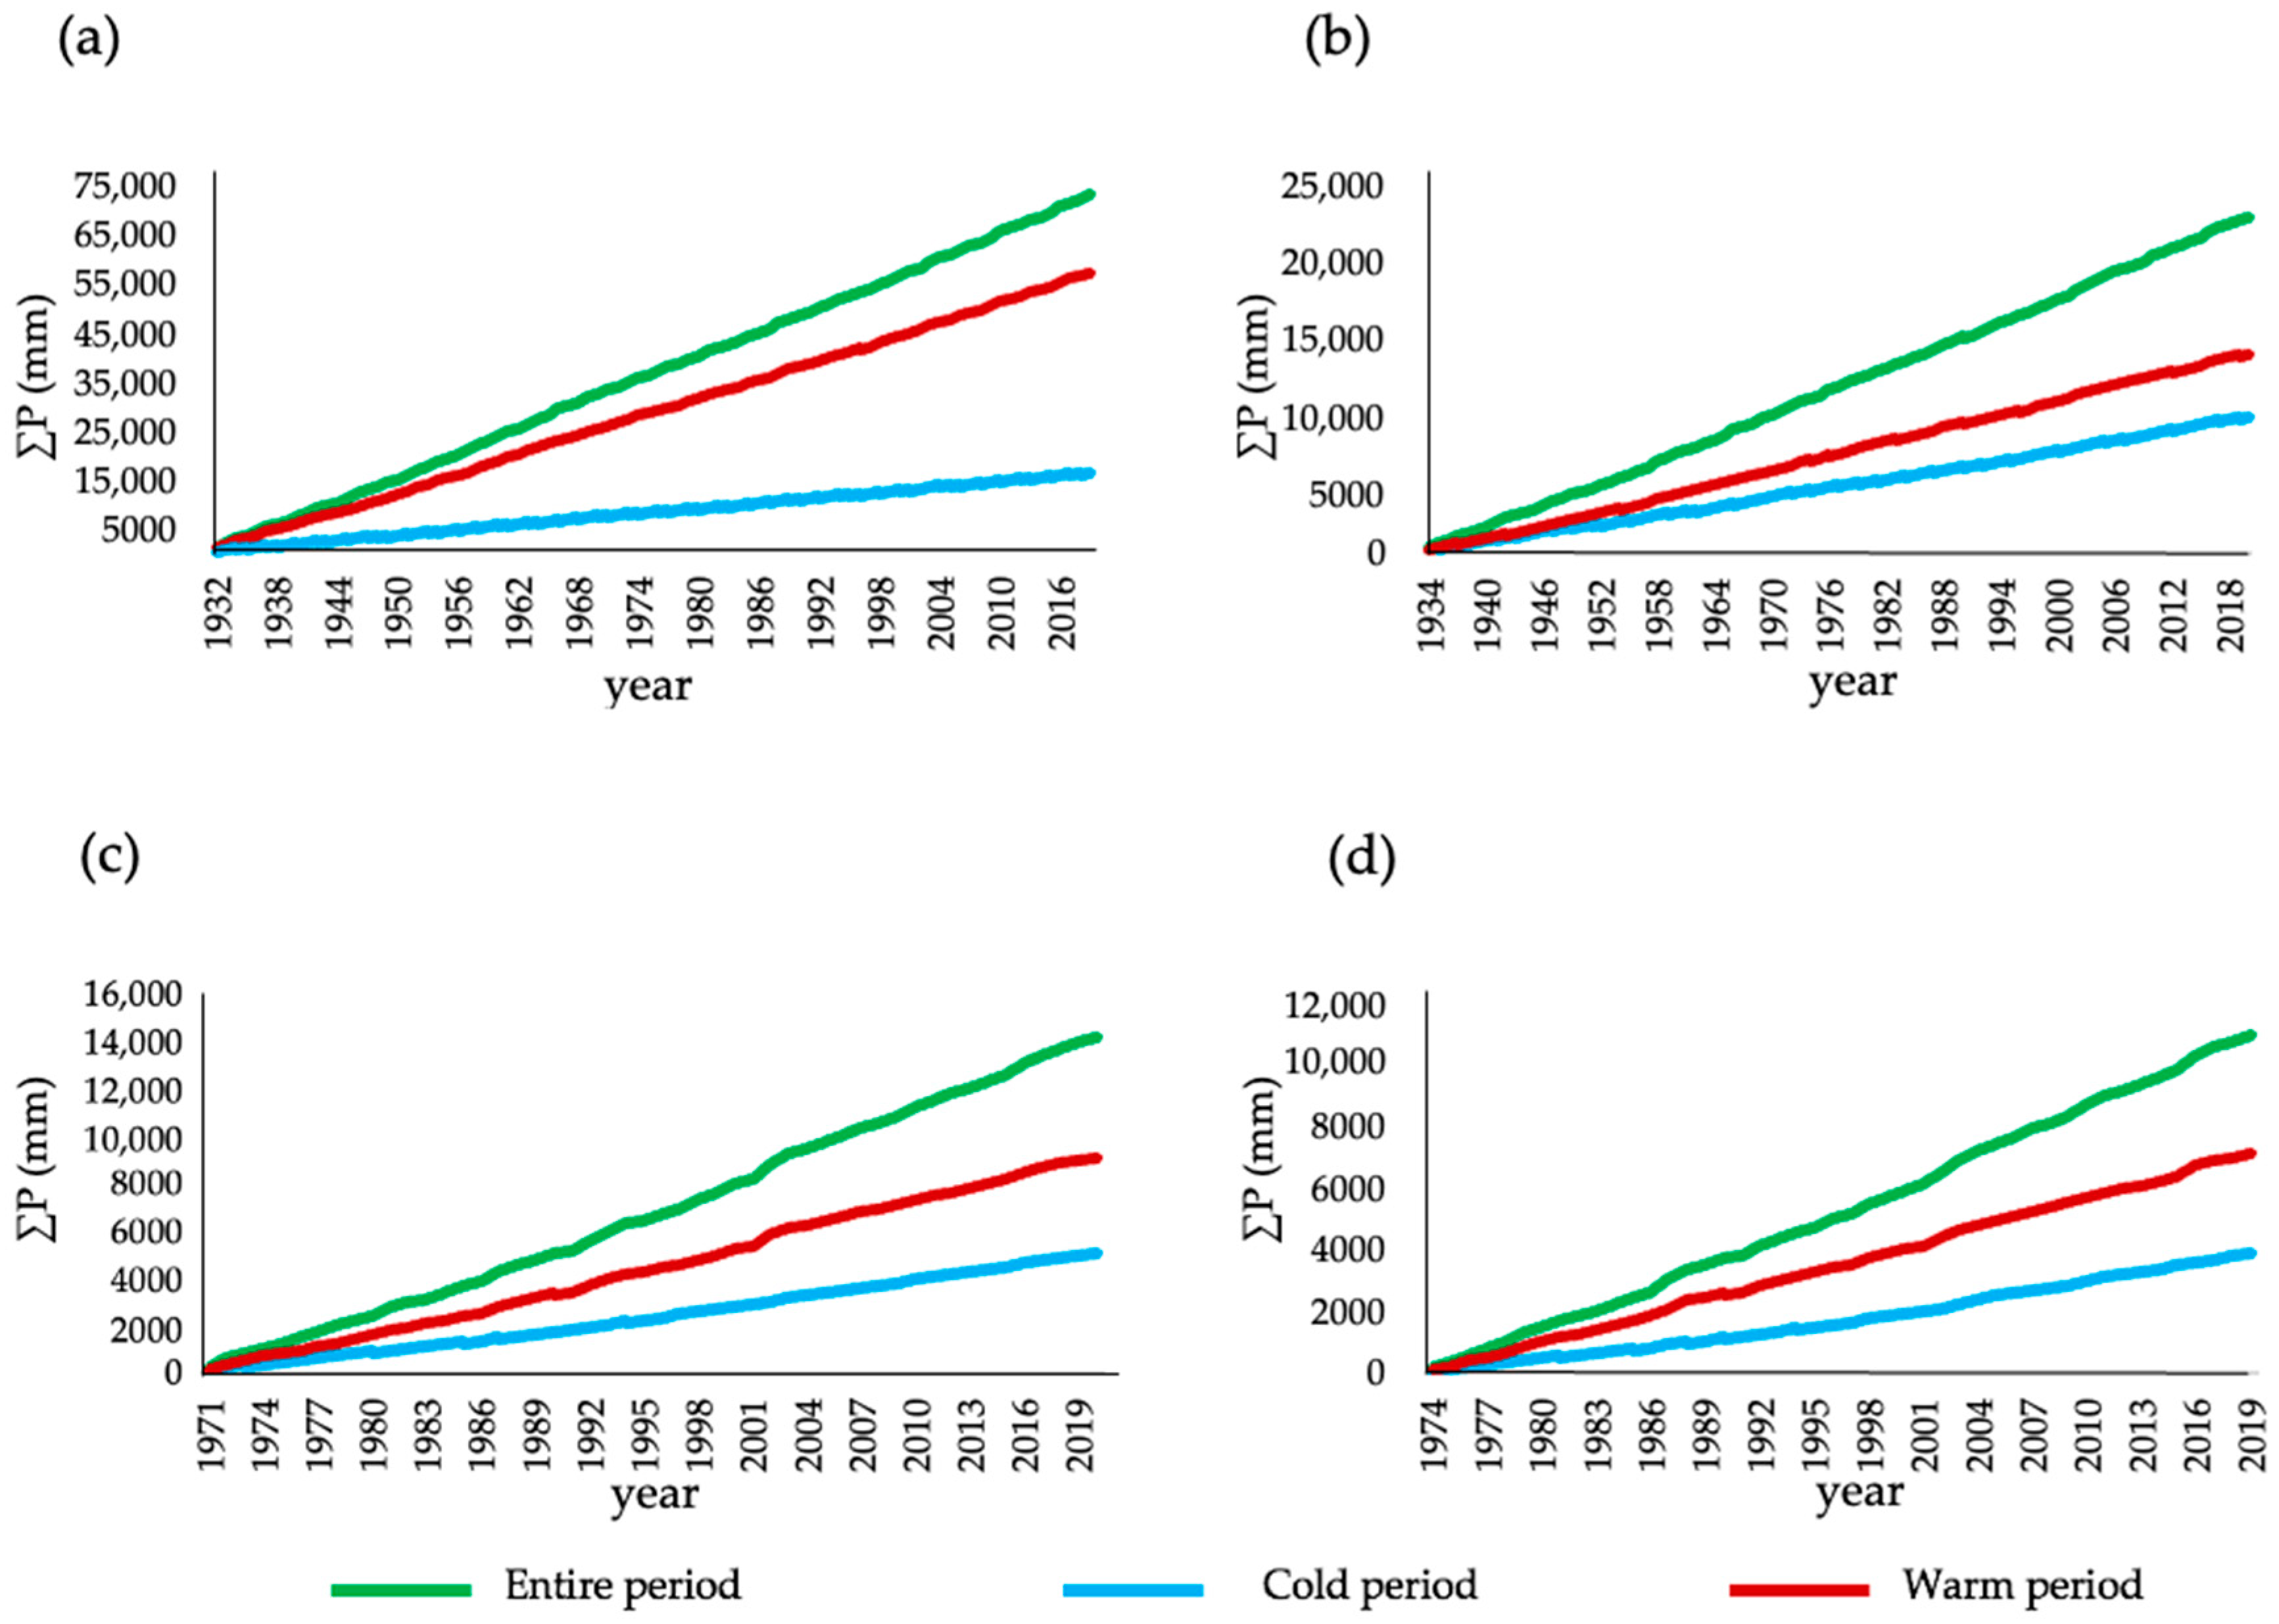
In contrast to the observed trends in air temperature, changes in the precipitation regime within the basin over the study period appear to be more complex. To elucidate the long-term dynamics of statistical precipitation parameters, cumulative integral curves depicting changes in the total annual precipitation were constructed using data from meteorological stations (MS data). The results for these stations are presented in Figure 5.
An examination of Figure 5 revealed that the annual precipitation across most meteorological stations within the Ile River basin has generally increased over recent decades. Exceptions were observed in the inner high-mountainous areas near the Assy meteorological station and the easternmost regions surrounding the Zharkent meteorological station (MS Zharkent), where a decrease in the average long-term annual precipitation of 21% and 9%, respectively, was evident. Conversely, the broader catchment area exhibited a discernible increase in precipitation.
Data shown in Table 2 and Table 3 indicated an average increase of 6% in annual precipitation at elevations below 1500 m. However, within a year, this was accompanied by a contrasting trend: a decrease of 3% in average precipitation during the warm season and a corresponding increase of 3% during the cold season. At elevations exceeding 1500 m, changes in the mean long-term precipitation values for the year as well as for warm and cold periods were less pronounced. Nevertheless, the overall upward trend for annual and cold season precipitation persisted, while warm season precipitation exhibited a decline. It is noteworthy that, expressed as a percentage of total annual precipitation for the catchment, a larger proportion fell during the warm period of the year.
An analysis of the long-term precipitation data divided into periods before and after 1997 revealed a shift in seasonal distribution at elevations below 1500 m. The proportion of precipitation falling during the warm season decreased on average from 65% to 62%, while the cold season conversely experienced an increase from 35% to 38%. At higher elevations (above 1500 m), a similar trend emerged, with the warm season share declining from 81% to 80% and the cold season share increasing from 19% to 20%. Notably, these higher elevations received a significantly larger portion of precipitation during the warm period. If this trend persists, the redistribution of precipitation is likely to impact the intra-annual runoff characteristics of rivers in the region.
Furthermore, an overall increase in precipitation since 1997 was observed across the region. Data from meteorological stations below 1500 m indicated an average increase of 4% and 20% in precipitation during the warm and cold seasons, respectively. At higher elevations, the increase was 1% and 7% for the warm and cold seasons, respectively. These changes are expected to influence the quantitative aspects of the water regimes in the rivers.
The observed changes in precipitation for the design period are consistent with the findings of [29]. Their study identified significant levels of extreme precipitation (R99p) in the mountainous areas of the south, southeast, northeast, and northern Kazakhstan, exhibiting a dependence on latitudinal relief. Precipitation amounts ranged from 31 to 41 mm, with the highest value recorded in Almaty, a mountainous region characterized by the most substantial precipitation.
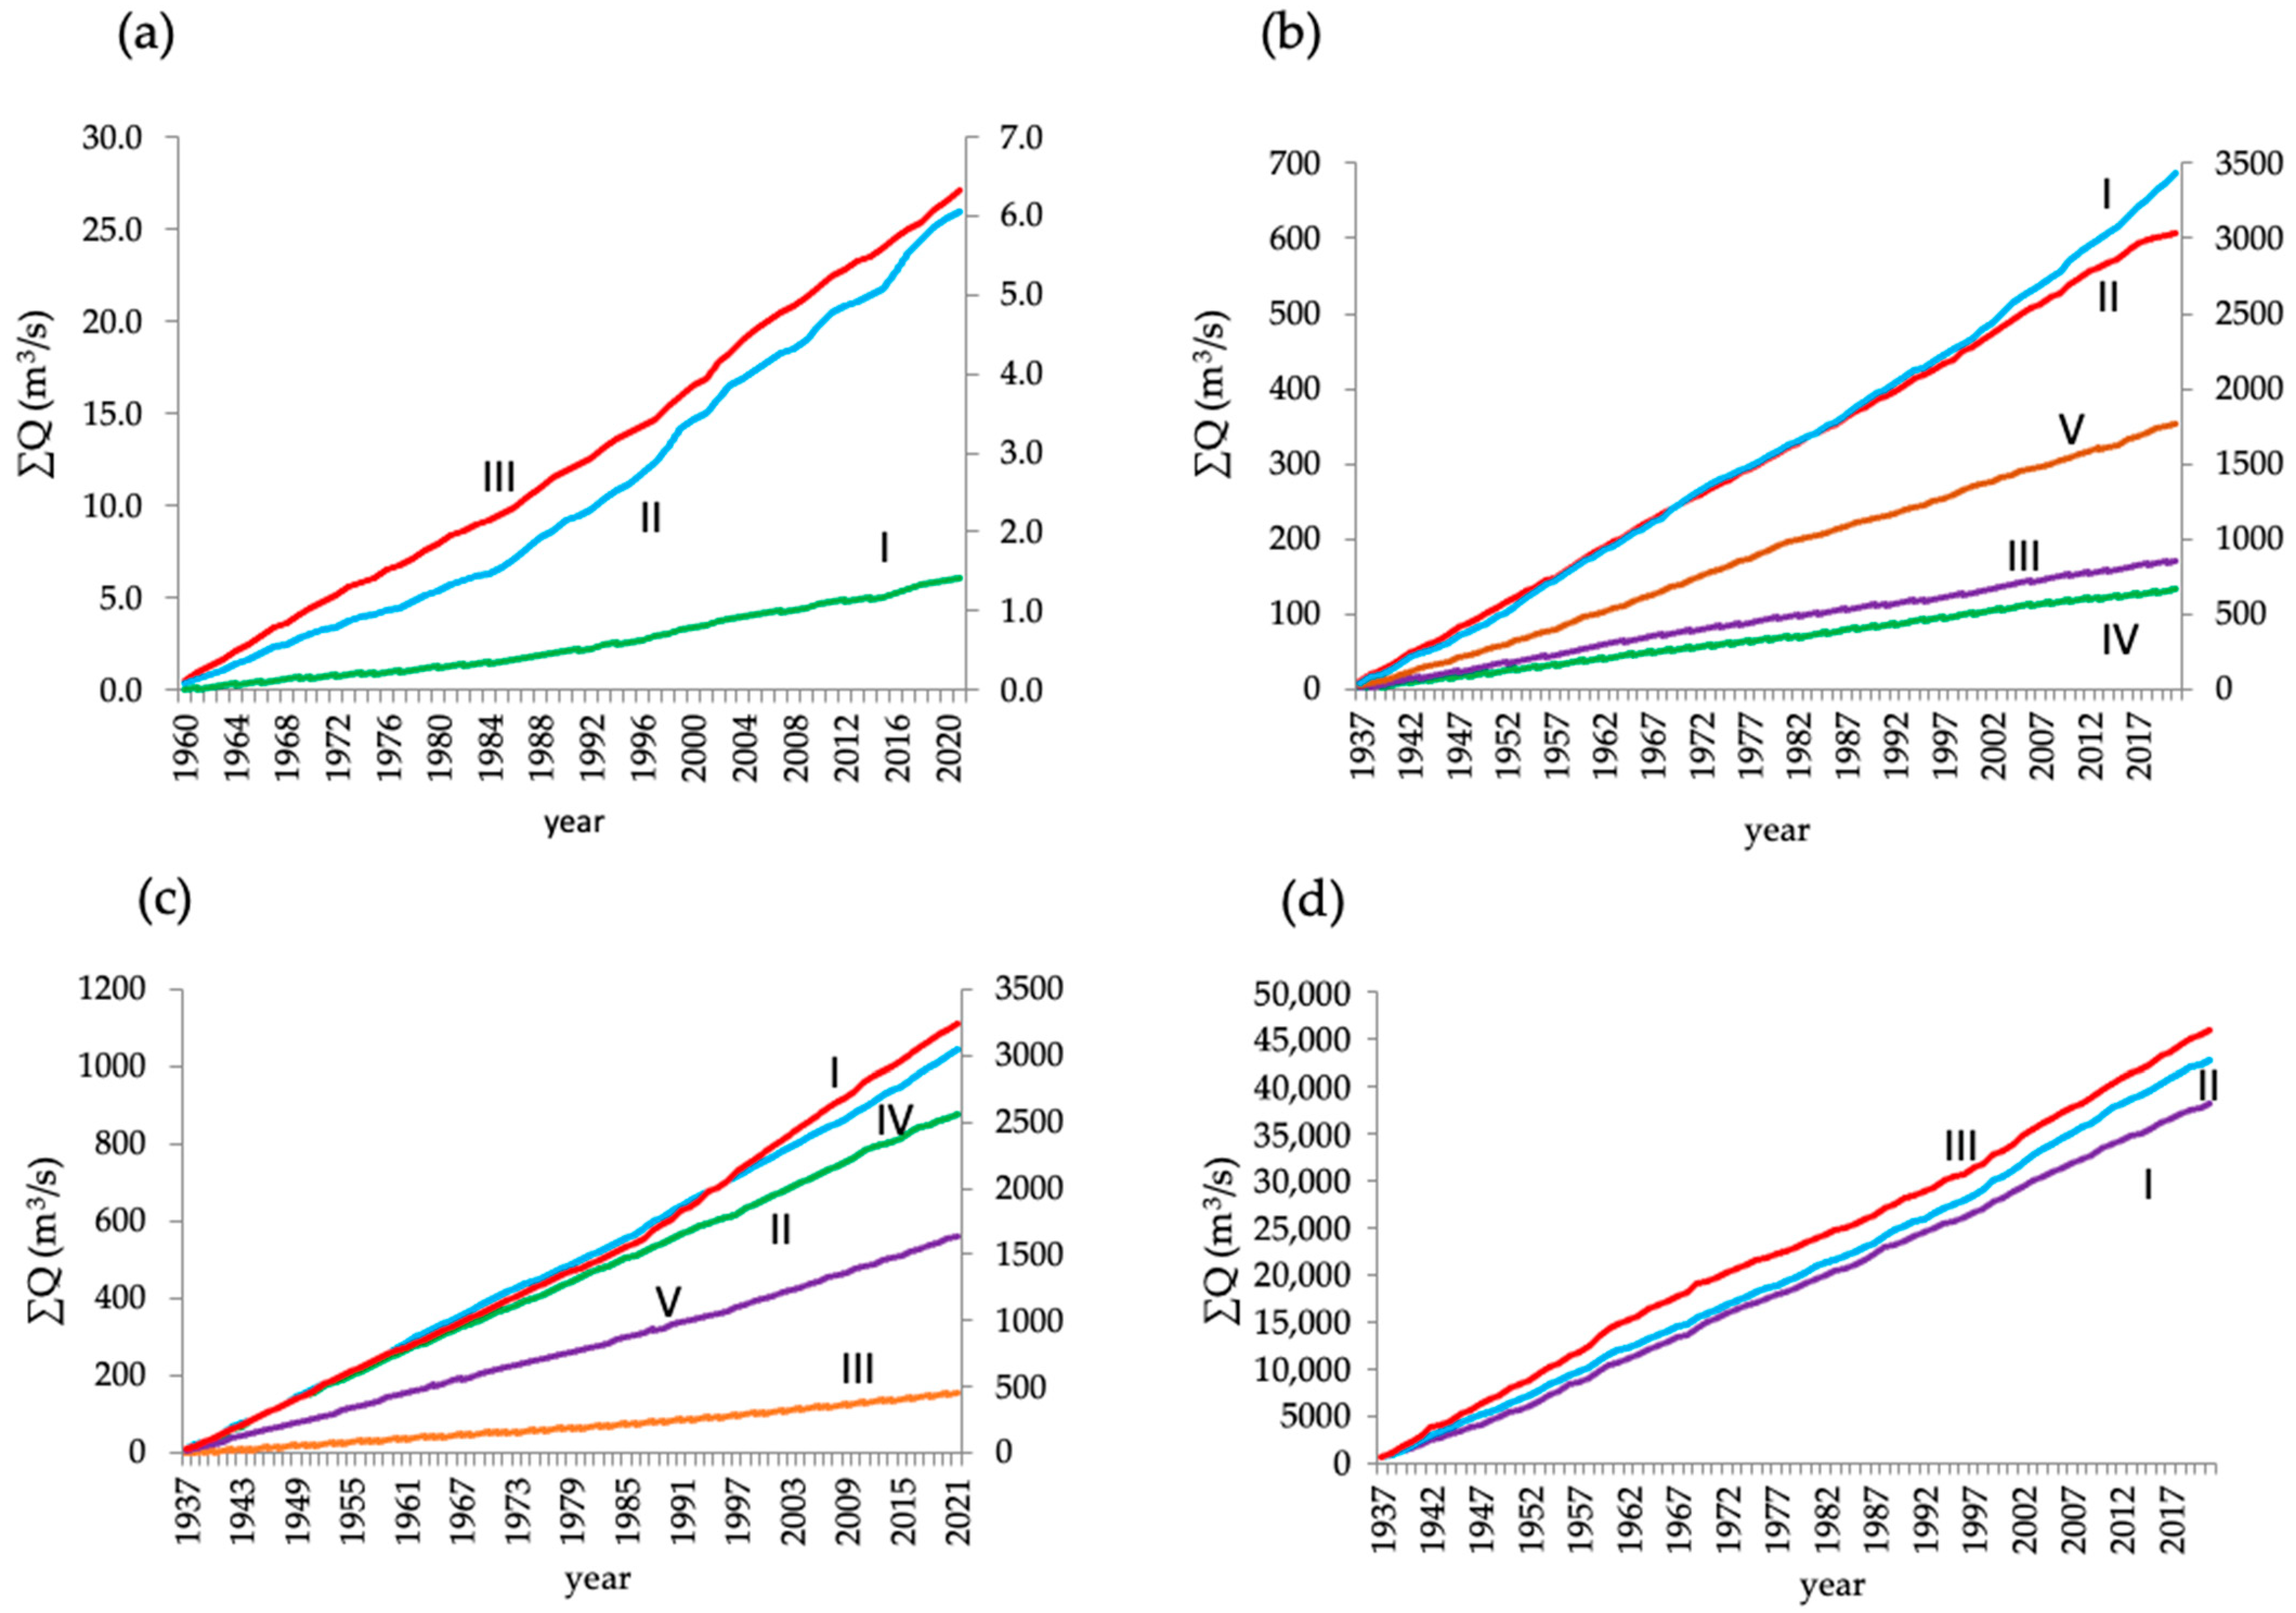
Building upon established hydrological literature [30], the rivers under study were categorized in Figure 6 based on the timing of their peak flow, which is influenced by the average weighted elevation and catchment area (see also Figure S3 in the Supplementary Materials).
Examination of Figure 6, which displays the cumulative integral curves of natural-conditional runoff, revealed a trend in regional watercourses since the early 1980s and late 1990s. This trend manifested as a change in the slope of the line averaging high-water and low-water fluctuations, indicating an increase in the runoff rate. To quantify these changes, the period since 1997, when alterations were observed in all calculated river sections, was selected as the baseline for calculating the annual runoff characteristics and intra-annual runoff phases for the past and present climatic periods.
This chosen design period aligns with previously reported changes in the regimes of the Ile River basin rivers: the Tekes River at the Qiafuqihai site (1998) and the Kax River at the Tuohai site (1996) located within the People’s Republic of China [31].
Statistical analysis of runoff was performed for distinct river groups categorized by their typical water regime phases. Long-term average values for the entire year, high-water periods, and low-water periods were calculated based on the selected multi-year periods and are summarized in Table S3 in the Supplementary Materials.
To facilitate a comparison of the calculated runoff characteristics within the Ile River basin, the annual and intra-annual runoff values were determined for river groups categorized by their water regime phases. These values were calculated for the periods before and after 1997, representing distinct runoff norms attributable to climate change.
An examination of Table S3 revealed that, on average, across all of the considered river groups, the modern annual runoff within the basin exhibited an upward trend. This finding aligns with the results presented in previous studies [32,33]. The most significant increase in runoff was observed in smaller rivers characterized by spring floods, with a 44% rise compared to the previous period. Notably, this increase was observed consistently across all seasons, from spring to winter.
Conversely, rivers with spring–summer floods excluding the Ile River demonstrated the smallest average annual discharge increase at only 7%. However, the Sharyn River, as the largest river in the basin, experienced a substantial increase of 26% in its long-term average annual discharge, rising from 36.7 m3/s to 46.2 m3/s. Similar to smaller rivers, the Sharyn exhibited a more pronounced increase in runoff values from spring to winter. For instance, its runoff increase was 19% for spring-summer, 33% for autumn, and 67% for winter. However, caution is warranted when interpreting the data for the Kaskelen River as the presence of intensive economic activity within its watershed introduces uncertainty into the estimates of conditionally natural runoff.
Rivers experiencing summer floods exhibited a relatively uniform increase in discharge across all seasons, with an overall average increase of 29%. Notably, the Shelek River, the largest within this group, demonstrated the most significant rise in summer runoff at 61%.
The Ile River, the basin’s main waterway, displayed variations in the long-term average annual discharge along its course. At the outlet from the territory of the People’s Republic of China, the annual flow across the considered time periods changed by 11%. This change was accompanied by increases in spring (13%) and autumn–winter (29%), with summer flows remaining virtually unchanged. The current average annual discharge at this location is 486 m3/s. Subsequently, tributaries fed primarily by runoff from mountainous areas within the study area contribute additional water, raising the river’s total content to 600 m3/s. The difference in the average long-term flow rate between the past and present climatic periods was approximately 25% for the middle and lower reaches of the river. Seasonally, the most pronounced increase in flow was observed in autumn–winter (30–40%) in the middle reaches, while spring in the lower reaches experienced a rise of about 20% in the average flow rate.

4. Conclusions

This study demonstrates that changes in temperature regime and precipitation patterns within the Ile River basin have resulted in observable alterations to the water regimes of rivers across various basin locations and elevations. While establishing definitive links between precipitation and surface runoff in arid regions can be challenging, it is evident that the water content and regimes of rivers are influenced by precipitation patterns and the total amounts. Notably, a significant portion of annual runoff occurs during the summer–autumn period, attributed to snowmelt in mid- and high-mountainous areas.
A detailed analysis of the long-term data and changes in meteorological indicators including the average air temperatures and annual precipitation for elevations above and below 1500 m during cold and warm periods allowed for the identification of trends of increase and decrease as well as the quantification of these characteristics. It is important to acknowledge that due to the significant variations in altitude among meteorological stations within the region, the chosen observation points represent both arid and sufficiently humid areas of the basin.
The observed increase in annual river runoff within the Ile River basin can be attributed to a rise in precipitation within the runoff formation zone and the involvement of high-mountain snow and glaciers in the melting process driven by warming temperatures. As indicated by the analysis of changes in meteorological indicators, the upward trends in average air temperature and precipitation amounts, particularly during the cold season, are expected to influence the redistribution of river runoff throughout the year.
This investigation into the hydrometeorological conditions influencing runoff formation in the Ile River basin revealed several key findings. Rising average annual air temperatures are leading to an expansion of the areas experiencing snowmelt and a prolongation of the warm period within the runoff formation zone. This has a consequential impact on the water balance within the basin.
Furthermore, an increase in the total annual precipitation, particularly during the cold season, within the runoff formation zone allows for an optimistic projection regarding future water resource growth in the region, assuming that these trends persist. Calculations of the intra-annual runoff characteristics for distinct climatic periods further support this outlook. These calculations reflect alterations in the annual water balance cycle. While most rivers in the region exhibited an overall increase in annual runoff, the most significant rise in water content was observed during autumn and winter.
The water regime of basin rivers is expected to undergo future changes as a consequence of ongoing trends in climatic indicators, as this regime is directly influenced by these conditions. Here, the intra-annual river runoff calculations for the current period hold significant value for water management assessments within the country’s economy.
Moving forward, the combined analysis of normative air temperature and precipitation indicators, alongside river water regime runoff characteristics, can facilitate long-term water balance assessments within the region, considering the evolving trends of these hydrometeorological elements. This approach will enable more rational utilization of water resources and support the development and implementation of competent water management strategies in this dynamically developing region of Kazakhstan.

Supplementary Materials

The following supporting information can be downloaded at https://www.mdpi.com/article/10.3390/w16131921/s1. Table S1. Meteorological stations; Table S2. Hydrological stations; Table S3. Runoff distribution for different phases of water regime and climatic periods; Figure S1. Catchment area of the Ile River in the territories of Kazakhstan and China; Figure S2. Categorization of the Ile River watershed.

Author Contributions

Conceptualization, R.G.A. and A.N.A.; Methodology, R.G.A. and A.N.A.; Software, A.N.A. and K.M.N.; Formal analysis, R.G.A. and A.N.A.; Investigation, R.G.A. and A.N.A.; Resources, A.N.A. and M.E.D.; Data curation, A.N.A. and M.E.D.; Writing—original draft preparation, R.G.A. and A.N.A.; Writing—review and editing, J.R.-I. and M.-E.R.-C.; Visualization, J.R.-I. and M.-E.R.-C.; Supervision, R.G.A., A.N.A. and J.R.-I.; Project administration, R.G.A.; Funding acquisition, J.R.-I. All authors have read and agreed to the published version of the manuscript.

Funding

This research was co-funded by the Erasmus + CBHE project «Land management, Environment and SoLId-WastE: Inside education and business in Central Asia» (LESLIE). Project number: ERASMUS-EDU-2023-CBHE no. 101129032.

Data Availability Statement

The data used in this study were obtained from the National Hydrometeorological Service of the Republican State Enterprise “Kazhydromet” with the author’s participation.

Acknowledgments

The authors acknowledge the modeling groups, the Program for Climate Model Diagnosis and Intercomparison (PCMDI), and the WCRP’s Working Group on Coupled Modelling (WGCM) for their roles in making available the WCRP CMIP3 multi-model dataset. Support of this dataset was provided by the Office of Science, U.S. Department of Energy.

Conflicts of Interest

The authors declare no conflicts of interest.

References

  1. The UN Climate Change Conference in Glasgow (COP26). Available online: https://www.un.org/en/climatechange/cop26 (accessed on 20 May 2024).
  2. Sairov, S.B.; Serikbay, N.T.; Rodrigo-Ilarri, J.; Abdrakhimov, R.G.; Rodrigo-Clavero, M.-E. Climate-Driven Changes in Annual Flow Patterns: A Comprehensive Analysis of the Buktyrma River (Kazakhstan). Water 2024, 16, 1114. [Google Scholar] [CrossRef]
  3. Huntington, T.G. Evidence for Intensification of the Global Water Cycle: Review and Synthesis. J. Hydrol. 2006, 319, 83–95. [Google Scholar] [CrossRef]
  4. Hua, L.; Zhao, T.; Zhong, L. Future Changes in Drought over Central Asia under CMIP6 Forcing Scenarios. J. Hydrol. Reg. Stud. 2022, 43, 101191. [Google Scholar] [CrossRef]
  5. Chen, F.; Huang, W.; Jin, L.; Chen, J.H.; Wang, J.S. Spatiotemporal Precipitation Variations in the Arid Central Asia in the Context of Global Warming. Sci. China Earth Sci. 2011, 54, 1812–1821. [Google Scholar] [CrossRef]
  6. World Climate Research Programme’s (WCRP’s) Coupled Model Intercomparison Project Phase 3 (CMIP3) Multi-Model Dataset. Available online: https://pcmdi.github.io/mips/cmip3 (accessed on 25 May 2024).
  7. Meehl, G.A.; Covey, C.; Delworth, T.; Latif, M.; McAvaney, B.; Mitchell, J.F.B.; Stouffer, R.J.; Taylor, K.E. The WCRP CMIP3 multi-model dataset: A new era in climate change research. Bull. Am. Meteorol. Soc. 2007, 88, 1383–1394. [Google Scholar] [CrossRef]
  8. UNFCCC. III–VI National Communication of the Republic of Kazakhstan to the UN Framework Convention on Climate Change; UNFCCC: Astana, Kazakhstan, 2013; 29p. [Google Scholar]
  9. Talipova, E.K.; Nyssanbayeva, A.S.; Shrestha, S. Regional climate change in the Ile River Basin. J. Geogr. Environ. Manag. 2019, 53, 25–34. [Google Scholar]
  10. Dostay, Z.D.; Alimkulov, S.K.; Saparova, A.A. (Eds.) River Runoff Resources of Kazakhstan. In Book 2: Renewable Resources of Surface Water in the South and Southeast of Kazakhstan (30–Volume Monograph); Lake Balkhash Basin and Drainless Areas of Central Kazakhstan: Almaty, Kazakhstan, 2012; 360p. [Google Scholar]
  11. State Water Cadastre of the Republic of Kazakhstan. Long-Term Data on the Regime and Resources of Surface Waters of the Land, 1981–1990; Lake Balkhash Basin and Drainless Areas of Central Kazakhstan: Almaty, Kazakhstan, 2002; 284p. [Google Scholar]
  12. Available online: https://www.kazhydromet.kz/ru/gidrologiya/basseyny-rek-oz-balkash-alakol-i-besstochnyh-rayonov-centralnogo-kazahstana-1936-2020 (accessed on 20 May 2024).
  13. Surface Water Resources of the USSR. Lake Balkhash Basin. Main Hydrological Characteristics. Central and Southern Kazakhstan; Gidrometeoizdat: Moscow, Russia, 1980; Volume 13, 288p. [Google Scholar]
  14. Surface Water Resources of the USSR. Lake Balkhash Basin. Main Hydrological Characteristics. Central and Southern Kazakhstan; Gidrometeoizdat: Moscow, Russia, 1977; Volume 13, 316p. [Google Scholar]
  15. State Water Cadastre of the Republic of Kazakhstan. Long-Term Data on the Regime and Resources of Surface Waters of the Land, 1991–1990; Lake Balkhash Basin and Drainless Areas of Central Kazakhstan: Almaty, Kazakhstan, 2004; 171p. [Google Scholar]
  16. The USGS Earth Explorer Data Portal. Available online: https://earthexplorer.usgs.gov/ (accessed on 20 May 2024).
  17. The HydroSHEDS Database. Available online: https://www.hydrosheds.org/page/hydrorivers (accessed on 1 September 2023).
  18. Linke, S.; Lehner, B.; Dallaire, C.O.; Ariwi, J.; Grill, G.; Anand, M.; Beames, P.; Burchard-Levine, V.; Maxwell, S.; Moidu, H.; et al. Global hydro-environmental subbasin and river reach characteristics at high spatial resolution. Sci. Data 2019, 6, 283. [Google Scholar] [CrossRef] [PubMed]
  19. SP 33-101-2003; Determination of Basic Design Hydrological Characteristics. Gosstroy of Russia: Moscow, Russia, 2004; 73p.
  20. Rozhdestvenski, A.V.; Chebotarev, A.I. Statisticheskie Metody v Gidrologii Statistical Methods in Hydrology; Gidrometeoizdat: Leningrad, Russia, 1974. [Google Scholar]
  21. Methodological Guidance on the Assessment of the Impact of Economic Activity on the Flow of Medium and Large Rivers and the Restoration of Its Characteristics. In Construction Climatology. State Norms in the Field of Architecture, Urban Planning, and Construction. Code of Practice of the Republic of Kazakhstan; L. Hydrometeoizdat: Saint Petersburg, Russia, 1986; 130s.SP RK 2.04-01-2017.
  22. Annual Bulletin of Monitoring the State and Climate Change in Kazakhstan. 2020. Available online: https://www.kazhydromet.kz/en/klimat/ezhegodnyy-byulleten-monitoringa-sostoyaniya-i-izmeneniya-klimata-kazahstana (accessed on 10 May 2024).
  23. WMO Publishing House. WMO Statement on the State of the Global Climate in 2017; WMO Publishing House: Geneva, Switzerland, 2018. [Google Scholar]
  24. Pi, Y.; Yu, Y.; Zhang, Y.; Xu, C.; Yu, R. Extreme Temperature Events during 1960–2017 in the Arid Region of Northwest China: Spatiotemporal Dynamics and Associated Large-Scale Atmospheric Circulation. Sustainability 2020, 12, 1198. [Google Scholar] [CrossRef]
  25. Alimkulov, S.; Dostay, Z.; Myrzakhmetov, A. The Role of Climate Change in the Water Regime of Rivers in South-East of Kazakhstan. Int. J. Adv. Res. Sci. Eng. Technol. 2017, 4, 4748–4760. [Google Scholar]
  26. Zhang, X.; Alexander, L.; Hegerl, G.C.; Jones, P.; Tank, A.K.; Peterson, T.C.; Trewin, B.; Zwiers, F.W. Indices for Monitoring Changes in Extremes Based on Daily Temperature and Precipitation Data. Wiley Interdiscip. Rev. Clim. Change 2011, 2, 851–887. [Google Scholar] [CrossRef]
  27. Talipova, E.; Shrestha, S.; Alimkulov, S.; Nyssanbayeva, A.; Tursunova, A.; Isakan, G. Influence of Climate Change and Anthropogenic Factors on the Ile River Basin Streamflow, Kazakhstan. Arab. J. Geosci. 2021, 14, 1756. [Google Scholar] [CrossRef]
  28. Salnikov, V.; Talanov, Y.; Polyakova, S.; Assylbekova, A.; Kauazov, A.; Bultekov, N.; Musralinova, G.; Kissebayev, D.; Beldeubayev, Y. An Assessment of the Present Trends in Temperature and Precipitation Extremes in Kazakhstan. Climate 2023, 11, 33. [Google Scholar] [CrossRef]
  29. Surface Water Resources of the USSR. Central and Southern Kazakhstan. Lake Balkhash Basin; Gidrometeoizdat: Leningrad, Russia, 1970; Volume 13, 646p. [Google Scholar]
  30. Shivareva, S.P.; Galayeva, A.V. Analysis of Runoff Changes in the Ile River Basin within Kazakhstan and China in Connection with Climatic Changes. Hydrometeorol. Ecol. 2014, 1, 55–67. [Google Scholar]
  31. Abdrahimov, R.G.; Amirgalieva, A.S.; Dauletijarov, K.B.; Zijarov, A.M. Current Trends in the Annual Flow of a River or Its Major Tributaries under Conditions of a Warming Climate; Vestnik Moskovskogo Universiteta: Moscow, Russia, 2021. [Google Scholar]
  32. Alimkulov, S.K.; Tursunova, A.A.; Davletgaliev, S.K.; Saparova, A.A. Resources of River Runoff of Kazakhstan. Hydrometeorol. Ecol. 2018, 8, 2242–2250. [Google Scholar] [CrossRef]
  33. Chigrinets, A.G.; Duskayev, K.K.; Mazur, L.P.; Chigrinets, L.Y.; Akhmetova, S.T.; Mussina, A.K. Evaluation and Dynamics of the Glacial Runoff of the Rivers of the Ile Alatau Northern Slope in the Context of Global Warming. Int. J. Eng. Res. Technol. 2020, 13, 419–426. [Google Scholar] [CrossRef]
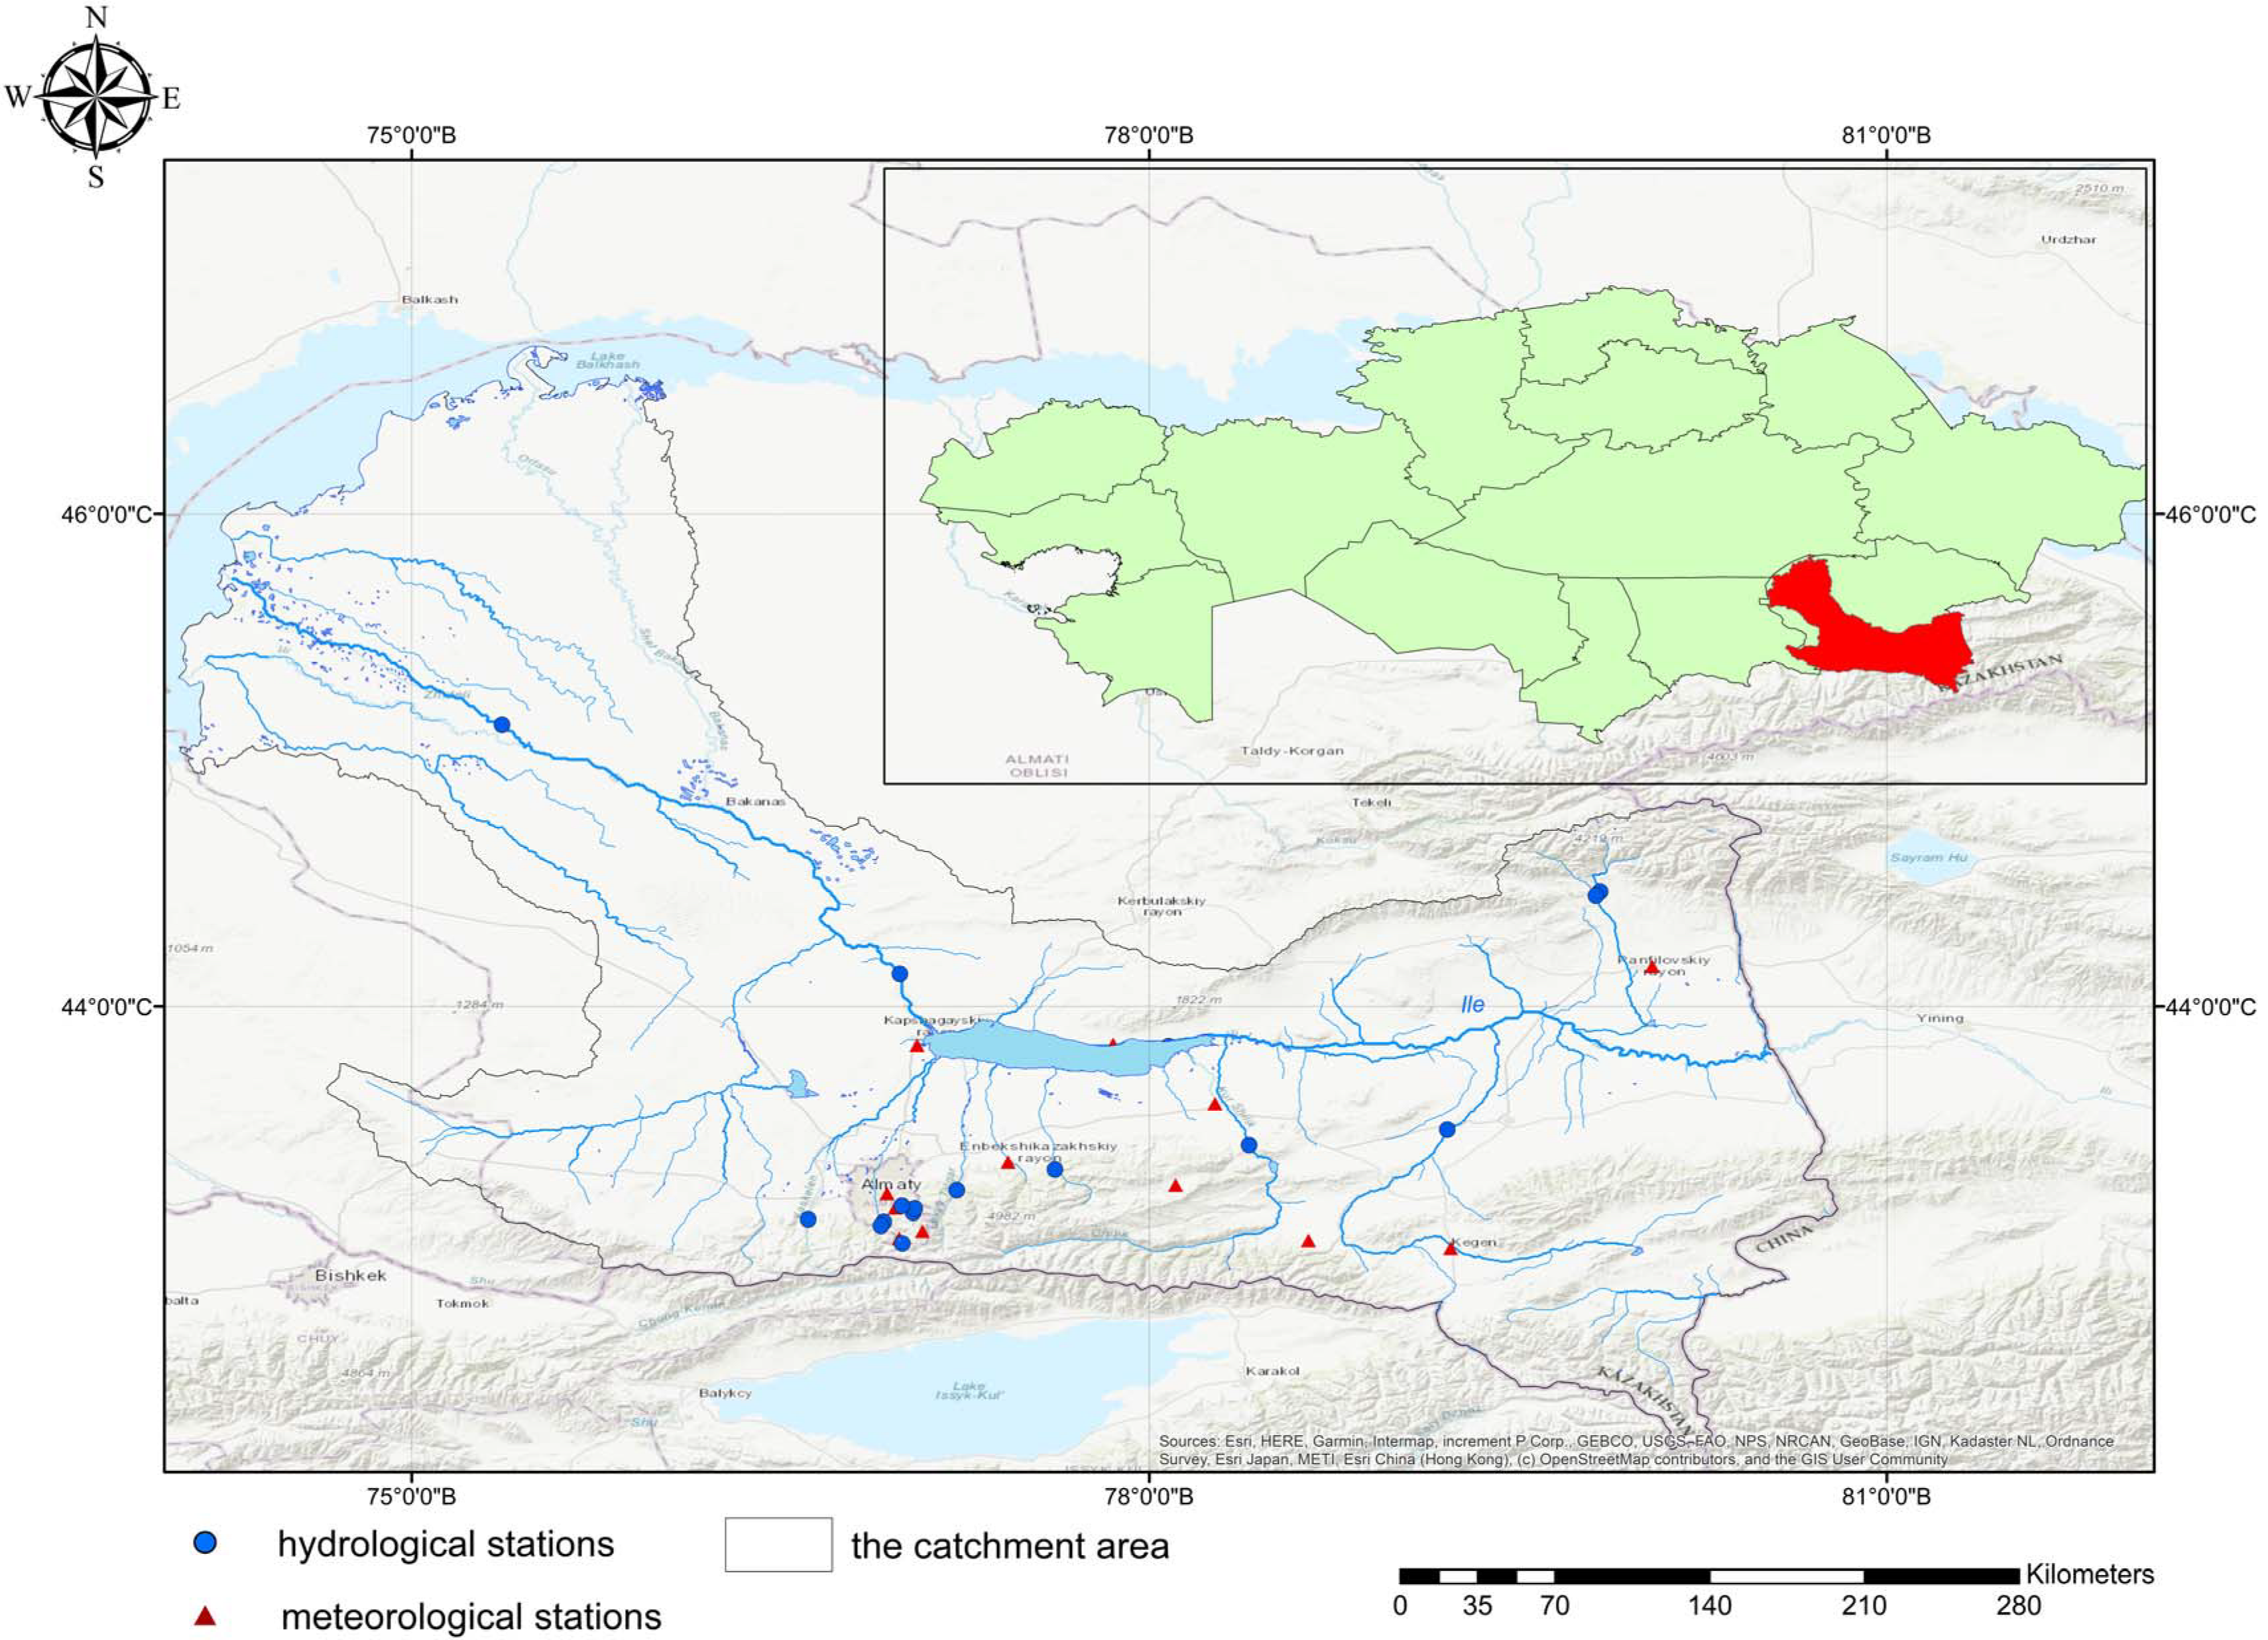
Figure 1. Location of hydrological (HS) and meteorological stations (MS) in the Ile River basin.
Water 16 01921 g001
Figure 2. Time series of anomalies of mean annual air temperatures at 4 meteorological stations. (a) MS Yesik; (b) MS Kegen; (c) Big Almaty Lake; (d) MS Shelek. Positive anomalies are plotted in red and negative anomalies in blue.
Water 16 01921 g002
Figure 3. Multi-year air temperature fluctuations and 10-year moving averages from data of 4 meteorological stations. (a) MS Yesik; (b) MS Kegen; (c) Big Almaty Lake; (d) MS Shelek.
Water 16 01921 g003
Figure 4. Cumulative curves of long-term average temperature values. (a) MS Mynzhylki, MS Big Almaty Lake, and MS Assy; (b) MS Kapshagai and MS Karashoky.
Water 16 01921 g004
Figure 5. Cumulative integral curves of the long-term values of the annual precipitation totals for a multi-year period. (a) MS Big Almaty Lake; (b) MS Shelek; (c) MS Kapshagai; (d) MS Karashoky.
Water 16 01921 g005
Figure 6. Cumulative integral curves of the average annual discharge of rivers in the Ile River basin. (a) Rivers with spring flood (I. Butak River—Butak village, the river mouth of the Shybynsai River; II. Batareika River—Prosveschenets resort house (river mouth); III. Terisbutak stream—river mouth (Almaty city)); (b) Rivers with spring–summer floods (I. Sharyn River—Sarytogai tract; II. Turgen River—Tauturgen village; III. Kishi Almaty River—Almaty city (river mouth of Butak River, dam); IV. Prokhodnaya River—river mouth; V. Kaskelen River—Kaskelen city); (c) Rivers with summer flood (I. Shelek River—Malybai village; II. Talgar River—Talgar city; III. Ulken Almaty River—2 km upstream of Big Almaty Lake; IV. Usek River—1.7 km upstream of the valley of the Kishi Usek River; V. Kishi Usek River—0.2 km upstream from its confluence with the Usek River); (d) Rivers with spring and summer floods (I. Ile River—164 km upstream of Kapchagai HPP; II. Ile River—37 km below Kapchagai HPP (Kapchagai tract); III. Ile River–Zhideli river channel—16 km below the source).
Water 16 01921 g006
Table 1. Long-term averages of mean annual warm and cold air temperatures.
Meteorological StationYearst, Long-Term Average (°C)Δt (°C)t (°C)
Warm Period
Δt (°C)t (°C)
Cold Period
Δt (°C)
According to MS data located at altitudes below 1500 m
Kamenskoye Plateau1961–19968.501.015.01.10–0.500.9
1997–20219.5016.10.40
Almaty1937–19969.101.517.21.10–2.302.1
1997–202110.618.3–0.20
Shelek1934–19969.501.618.11.30–12.39.6
1997–202111.119.4–2.70
Yesik1938–19968.501.115.91.30–1.80.7
1997–20219.6017.2–1.10
Zharkent1937–19969.301.518.20.90–3.102.1
1997–202110.819.1–1.00
Kapshagai1971–19969.600.718.40.50–2.801.2
1997–202110.318.9–1.60
Karashoky1974–199611.01.019.01.00–1.001.0
1997–202112.020.00.00
Average Δt (°C) 1.2 1.0 2.5
According to MS data located at altitudes above 1500 m
Mynzhylki1937–1996–2.01.13.201.06–9.21.2
1997–2021–0.84.30–8.0
Kegen1948–19962.71.19.801.10–7.31.2
1997–20213.810.9–6.1
Assy1952–19960.10.66.700.60–9.20.6
1997–20210.77.30–8.6
Zhalanash1960–19965.50.612.10.70–3.60.3
1997–20216.112.8–3.3
Big Almaty Lake1932–19961.20.96.700.70–6.41.1
1997–20212.17.40–5.3
Average Δt, °C 0.9 0.8 0.9
Table 2. Long-term averages of annual precipitation (P) and distribution within a year for climatic periods.
MSYearsP Long-Term Average (mm)Difference (mm/%)P Warm PeriodP Cold PeriodChange in % Before/After 1997 Period
mmChange of P Mean (%)mmChange of P Mean (%)P Warm PeriodP Cold Period
According to MS data located at altitudes below 1500 m
Kamenskoye plateau1961–199686649/65916827532312
1997–20219156086630734
Almaty1937–199664257/94146422836614
1997–20216994406325937
Shelek1934–199625020/81506010040316
1997–20212701545711643
Kapshagai1971–199626148/181716690341427
1997–20213091956311437
Karashoky1974–199622033/15150687032340
1997–2021253155619839
Difference (mm/%)
period before/after 1997
448/48941/11295/31065/62152/17935/38622
According to MS data located at altitudes above 1500 m
Mynzhylki1937–1996878–4/–0.57198215918–24
1997–20218747088116619
Kegen1948–199639419/5332846216413
1997–2021413344837017
Big Almaty Lake1932–199681843/5639781792256
1997–20218616727819022
Difference (mm/%)
period before/after 1997
697/71619/3563/57581/81133/14218/1928
Yesik1938–1996678–22/–34316424736–74
1997–2021656 3996125739
Zharkent1937–1996183–16/–9120666334–9–8
1997–2021167 109655835
Assy1952–1996432–103/–24373865813–27–5
1997–2021329 273835517
Zhalanash1960–1996522–4/–0.84137911021–25
1997–2021518 4037811522
Difference (mm/%)
period before/after 1997
454/418–36/–4334/29674/72120/12126/28–11–1
Table 3. Long-term average precipitation amounts (P) for different periods of the year.
MSP Warm Period (mm)Change (mm)Change (%)P Cold Period (mm)Change (mm)Change (%)
According to MS data located at altitudes below 1500 m
Kamenskoye Plateau1961–1996591173.01961–19962753212
1997–20216081997–2021307
Almaty1937–1996414266.01937–19962283114
1997–20214401997–2021259
Shelek1934–19961504.03.01934–19961001616
1997–20211541997–2021116
Yesik1938–1996431–32–7.01938–1996247104.0
1997–20213991997–2021257
Zharkent1937–1996120–11–9.01937–199663–5.0–8.0
1997–20211091997–202158
Kapshagai1971–199617124141971–1996902427
1997–20211951997–2021114
Karashoky1974–19961505.03.01974–1996702840
1997–20211551997–202198
According to MS data located at altitudes above 1500 m
Mynzhylki1937–1996719–11–2.01937–19961597.04.0
1997–20217081997–2021166
Kegen1948–199633212401948–1996628.013
1997–20213441997–202170
Assy1952–1996373–100–271952–199658–3.0–5.0
1997–20212731997–202155
Zhalanash1960–1996413–10–2.01960–19961105.05.0
1997–20214031997–2021115
Big Almaty Lake1932–1996639335.01932–1996179116.0
1997–20216721997–2021190
Disclaimer/Publisher’s Note: The statements, opinions and data contained in all publications are solely those of the individual author(s) and contributor(s) and not of MDPI and/or the editor(s). MDPI and/or the editor(s) disclaim responsibility for any injury to people or property resulting from any ideas, methods, instructions or products referred to in the content.