Abstract
Complex bedding properties and in situ stress conditions of shale formation lead to complex hydraulic fracturing morphologies. However, due to the limitations of traditional numerical methods, the simulation of hydraulic fracturing in shale formation still needs further development. Based on this, the liquid–solid interaction modes and the SPH governing equations considering liquid–solid interaction force have been introduced. The smoothing kernel function in the traditional SPH method is improved by introducing the fracture mark ξ, which can realize the simulation of rock hydraulic fracturing processes. The stress boundary of the SPH method is applied by stress mapping of “stress particles”, and the feasibility and correctness of the method are verified by two numerical examples. Then, the simulation of hydraulic fracturing processes of bedding shale formations are carried out. With the increase of horizontal stress ratio, the total number of damaged particles decreases, but the initiation and extension pressure increase gradually. The initiation stress of small bedding dip angles (θ < 45°) is larger than that of big bedding dip angles (θ > 45°). The hydraulic fracture propagation range at low horizontal stress ratio is wider and the fracture is along the direction of maximum principal stress, while the hydraulic fracture propagation range at high horizontal stress ratio is limited to the perforation. The hydraulic fracture will propagate through the bedding with small dip angles. However, when the bedding dip angle is larger, the hydraulic fracture will propagate along the bedding direction.
1. Introduction
Hydraulic fracturing is a key technology to increase shale gas production. Shale formation is a kind of ultra-low permeability reservoir, which makes it difficult to meet the requirements of commercial exploitation of natural gas [1,2,3,4]. Therefore, the reservoir needs to be reformed by hydraulic fracturing technology, which can form complex fracture networks in the shale formation [5,6]. Fracture networks are the key indexes during the hydraulic fracturing processes, which can increase formation connectivity, provide a flow path for subsurface fluids, improve overall formation connectivity, increase formation permeability, and allow gas stored in the formation to flow through the fracture network to the wellbore, thus realizing commercial shale gas developments. However, unlike traditional reservoirs, these unconventional reservoirs usually have typical bedding properties due to special diagenesis, as shown in Figure 1 [7]. Therefore, understanding the mechanisms of bedding shale reservoirs under hydraulic fracturing will undoubtedly provide important guidance for shale gas exploitation and production.
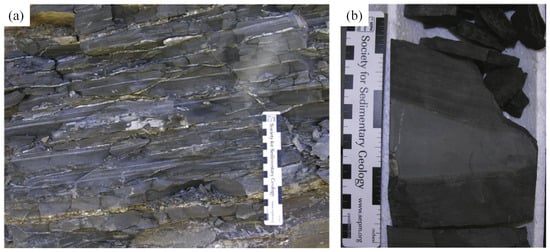
Figure 1.
Typical bedding shale morphology. (a) Barnett shale outcrop with calcite quartz cementation (white stripes); (b) Shale samples with bedding.
Previous studies have made great progress in the formation of hydraulic fracture networks in bedding shale reservoir, mainly concentrating on experimental studies, theoretical studies, and numerical simulations. Experimental studies are the most direct means to obtain the bedding shale formation mechanisms under water-stress coupling, for example, Warpinski et al. [8] conducted field investigations on hydraulic fracturing and found that the fracture modes can be divided into three modes: through (crossover), turn, and obstruction. Janszen et al. [9] applied multi-stage fracturing technology developed in the United States to Dutch Posedonia shale, and carried out pilot tests and optimized hydraulic fracturing parameters. Wang et al. [10] completed 12 stages of hydraulic fracturing in a deep shale gas reservoir in the Dingshan exploration area and discussed the hydraulic fracturing technology applied in deep shale. Sun et al. [11] studied the influence of bedding strength, bedding direction and in situ stress state on hydraulic fracture morphology through laboratory tests. However, laboratory tests have high standards for specimen preparation, which require rock samples to be as complete as possible. Therefore, the representativeness of rock samples obtained remains to be discussed. Theoretical research can quantitatively express the mechanical properties and fracture characteristics of bedding shale under hydraulic fracturing by summarizing and refining mechanical laws in experimental studies. For example, Liu et al. [12] established a full 3D fluid–solid coupling model considering the effect of bedding properties, and studied the vertical extension mechanisms of hydraulic fractures under the opening and shear slip of weak bedding planes. Wang et al. [13] established a 3D elastic-plastic soil model of porous media based on the Mohr–Coulomb plasticity theory and investigated the laws of hydraulic fracturing in shale reservoirs. However, the theoretical model needs to simplify the actual working conditions, and can only analyze extremely abstracted model geometries and boundary conditions. Therefore, it is difficult to directly apply theoretical models into engineering practices.
Numerical simulation overcomes the problems of scale, repeatability, and cost of experimental research; therefore, it is regarded as the “third method” of scientific research. Finite Element Method (FEM) is one of the earliest numerical methods to investigate the formation mechanisms of hydraulic fracturing networks in shale formation. However, FEM needs to locally refine the grids around the fracture tips under hydraulic fracturing processes, and the meshes need to be re-divided at each timestep of fracture evolutions, which requires a large amount of calculation resources. For those numerical models with complex fracture networks, the finite element mesh is easily distorted, resulting in reduced calculation accuracy or even calculation failure [14,15]. In order to overcome these problems, the extended finite element method (XFEM) [16,17] and the cohesive element method [18,19] have subsequently been developed. However, XFEM has some limitations in dealing with fracture crossing, which needs further optimization [20]. The cohesive element method [21] prefabricated zero-thickness element two element surfaces as potential fracture evolution paths, which can well simulate the fracture-crossing behaviors. However, fracture propagation paths are set in advance; therefore, the fracture propagation is not as flexible as XFEM. Discrete Element Method (DEM) is a kind of mesh-less numerical method [22,23], which separates the calculation domain into particles with different particle sizes, and can get rid of the constraints of traditional finite element meshes so as to freely simulate the formations of shale hydraulic fracturing networks. However, DEM has many microscopic parameters with no actual physical meanings, and complex parameter calibrations are required before numerical simulation, which is difficult to apply to engineering practice. Recently, scholars have proposed a series of new numerical methods to simulate the hydraulic fracturing processes, such as numerical manifold method (NMM) [24,25], Discontinuous Deformation Analysis method (DDA) [26,27], PeriDynamics (PD) [28,29], Phase field method (PF) [30,31], and so on. These methods all have great potential in dealing with the formations of hydraulic fracturing networks in shale formation, but also have their own disadvantages. For example: The fracture tips of NMM and DDA still need to fall on the nodes of grids or elements. The Poisson’s ratio of the bond-based PD method is constant, which is not consistent with the actual situation. The determinations of PF model parameters still need to be further discussed. Smooth particle hydrodynamics (SPH) is a pure Lagrangian meshless method, which has its unique advantages in dealing with large deformation and discontinuous problems [32]. SPH overcomes the problems of treatment problems of discontinuous properties existing in FEM. Meanwhile, compared with DEM, the governing equations are all derived from partial differential equations with clear physical meanings. Therefore, there is no need to carry out complex parameter calibrations before numerical simulation. However, there are few applications of SPH method for simulation of shale hydraulic fracturing processes, and there are only some applications in rock fracture mechanics, such as the GPD method proposed by Zhou’s groups [33,34,35,36,37,38,39,40].
Based on the shortcomings of previous studies, the traditional SPH method has been improved to realize the simulation of hydraulic fracturing processes of shale formations. Two numerical examples are carried out showing that the improved SPH method can be well applied to the simulation of hydraulic fracturing, and the correctness is verified by comparing with previous experimental results. Finally, the hydraulic fracturing processes of bedding shale formation under different in situ stress conditions are simulated, and two typical forms of interaction modes between hydraulic fractures and bedding properties are discussed. The research results can provide some references for the optimization of hydraulic fracturing technology in shale gas production, and also provide some references for the applications of the SPH method in shale hydraulic fracturing modelling.
2. Numerical Treatments of Hydraulic Fracturing in SPH
2.1. Liquid—Solid Particle Interaction Modes
There exists liquid–solid contact surface between liquid particles (orange particles in Figure 2) and solid particles (blue particles in Figure 2), where liquid particle i exerts force (water pressure) on solid particle j. The water pressure is oriented along the liquid–solid particle line toward solid particle i and has a magnitude of σp. The normal vector between liquid particle i and solid particle j is defined as follows: For any contact pair between liquid particle and solid particle, its normal unit vector can be expressed as [33]:
where nij is the normal unit vector between liquid and solid particles, xij = xj − xi is the difference between the horizontal coordinate of liquid particles and solid particles, yij = yj − yi is the difference between the ordinate coordinate of liquid particles and solid particles, and is the distance between liquid particles and solid particles. Then, the following variables can be defined [33]:
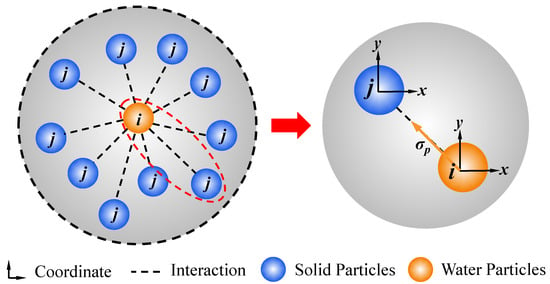
Figure 2.
Interaction modes between liquid particles and solid particles.
Assuming that each liquid particle has the properties of water pressure pw, the force σpij liquid particles on solid particles can be expressed as [33]:
Therefore, according to the liquid–solid interaction relationships, the traditional SPH governing equations can be re-written into the liquid–solid coupling governing equations [33]:
where j ∈ S are all the solid particles in the liquid–solid contact domain and j ∈ W are all the liquid particles in the liquid–solid contact domain.
2.2. Fracture Treatments under Liquid–Solid Interactions
2.2.1. Failure Criterion
The Mohr–Coulomb criterion with tensile failure is used in this section, which can be expressed as [41]:
where σf and τf are the tensile and shear stress on the failure surface, respectively, σt is the tensile strength of rock masses, c is the cohesion of rock masses, and φ is the internal friction angle of rock masses.
2.2.2. Fracture Treatments of Solid Particles
As can be seen from the liquid–solid couple governing Equation (5), its derivative form of the kernel function ∂Wij,β/∂xiβ controls the key parameter transfers between different particles such as density, velocity, and energy. In other words, the derivative kernel function ∂Wij,β/∂xiβ acts as the “bridge” during parameter transfers. Therefore, controlling the connection and connection type of the “bridge” can realize the “activation” and “failure” of particles, as well as the “conversion” between solid particles and liquid particles. Based on these principals, the fracture mark ξ is introduced in this section. Meanwhile, the improved kernel function considering the particle damage D is defined, whose relationship with the traditional SPH kernel function W can be expressed as [33]:
When the particle is damaged (the stress of the particle satisfies the failure criterion of Equation (6) or Equation (7)), the fracture mark ξ is set to be 0. When the particle is not damaged (the stress of the particle does not satisfy the failure criterion of Equation (6) or Equation (7)), the fracture mark ξ is set to be 1. The fracture processes of particles can be shown in Figure 3. Therefore, by improving the liquid–solid coupling governing Equation (5), we can obtain the new governing equations considering the particle damage [33]:
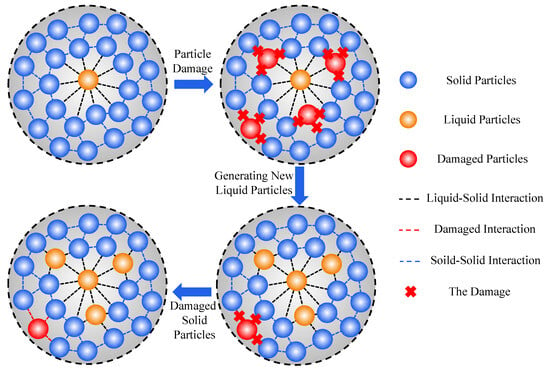
Figure 3.
Particle fracture processes under liquid–solid interactions.
2.3. Application of Stress Boundaries in SPH
The application of stress boundary adopts the method of stress mapping, and more than five layers of “stress particles” are laid outside the solid particles. The “stress particles” should have the following characteristics:
(1) Like solid particles, “stress particles” participate in the internal force calculation of SPH. That is, the density, velocity, energy, and position of particles are updated by Equation (9);
(2) During each calculation step, stress is re-assigned to the “stress particle”, that is, although the “stress particles” participate in the parameter updates of the solid particles, their stress variations still follow the preset of stress boundary requirements;
(3) A layer of “type I virtual particles” with velocity v_inf equal to 0 are set outside the “stress particles”.
Therefore, the distributions of stress particles can be shown in Figure 4.
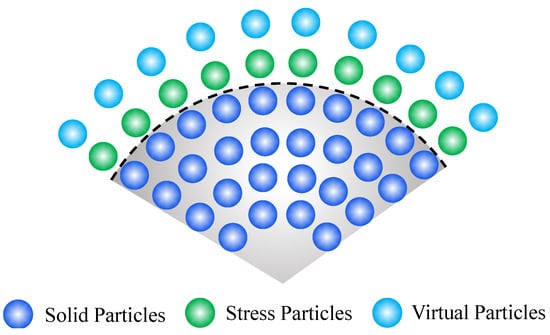
Figure 4.
“Stress particles” distributions.
2.4. Solutions of SPH Method
Similar to traditional numerical software, the architecture of the SPH program mainly includes three modules: (1) input module; (2) computing module, and (3) post-processing module. The input module is shown in Figure 5. The SPH model is composed of fissure generations and regular particle generations. The fissure generations can be carried out by CAD, CATIA, and PROE. The parameter initialization comprises the determination of particle coordinates and particle properties, and the stress particle generation comprises stress particle coordinates and stress particle properties, as illustrated in Section 2.3.
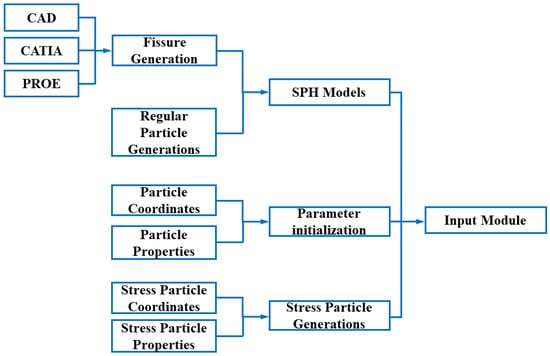
Figure 5.
SPH input module.
The calculation module comprises 10 parts: (1) Time integral; (2) Particle pairing; (3) Density Pairing; (4) Damage Update Calculation; (5) Artificial Viscosity Calculation; (6) Internal Force Calculation; (7) External Force Calculation; (8) Artificial Heat Calculation; (9) Velocity Correction Calculation; (10) Principal Stress Calculation and Damage Determination. The relationships between the 10 parts can be illustrated in Figure 6.
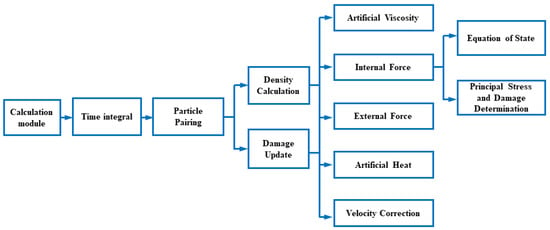
Figure 6.
SPH calculation module.
The post-processing module can be illustrated as follows:
3. Validation of Improved SPH Method
In order to verify the correctness of SPH, two typical numerical examples are selected: (1) Numerical simulation of hydraulic fracturing processes with one vertical fissure without lateral pressure and (2) Numerical simulation of directional hydraulic fracturing with confining pressure. The rationality is verified by comparing the numerical results with previous experimental results.
3.1. One Vertical Fissure without Lateral Pressure
Numerical example 1 comes from reference [42], as shown in Figure 7. The specimen size is 70.7 mm × 70.7 mm, and a 15 mm length vertical fissure is prefabricated in the center of the sample. The whole model is divided into 200 × 200 = 40,000 particles. The loading rate of internal water pressure is 50 Pa/calculation step. The model parameters are set as follows: Particle density is ρ = 2600 kg/m3, Elastic modulus E = 17 GPa, Poisson’s ratio μ = 0.14, Cohesion is set to be 5.95 Mpa, internal friction angle is 40°, and the tensile strength is 2 MPa.
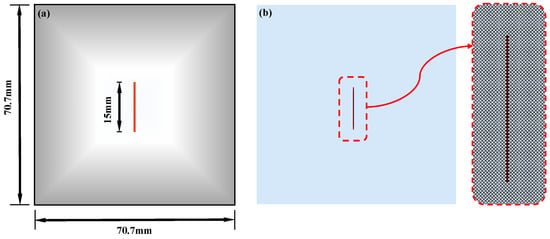
Figure 7.
Model size and particle divisions of example 1. (a) Model size; (b) Particle divisions.
Figure 8 shows the progressive failure processes of the model under the action of internal water pressure. It can be seen that with the increase of internal water pressure, the hydraulic fracture propagates along the prefabricated fissure surface and finally runs through the model. The fracture propagation paths in experimental results are slightly curved due to the fact that concrete is heterogeneous. The comparisons between the experimental results and the numerical results are shown in Figure 9. Previous experimental results also showed these characteristics [42], which verifies the correctness of the improved SPH method.
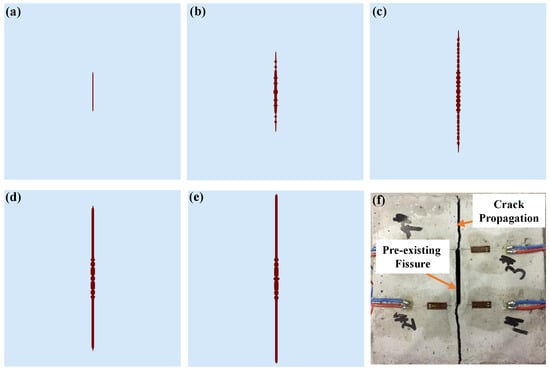
Figure 8.
The progressive fracture propagation processes of example 1 and its comparisons with previous experimental results. (a) Step 0; (b) Step 8000; (c) Step 9000; (d) Step 10,000; (e) Step 11,000; (f) Previous experimental results [42].
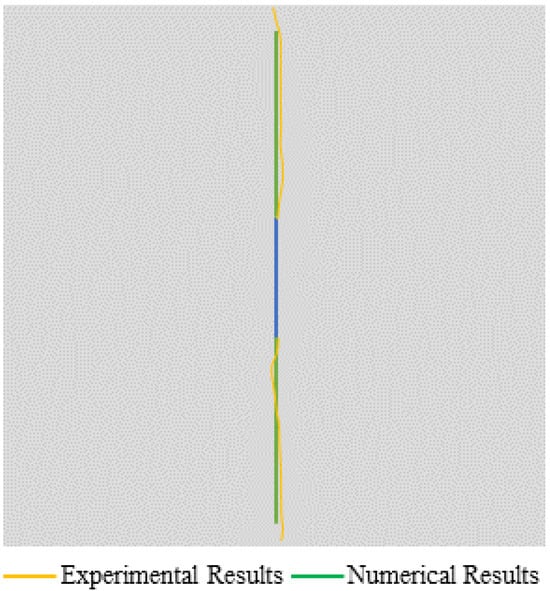
Figure 9.
Comparisons between experimental results and numerical results in the example of one vertical fissure without lateral pressure.
3.2. Directional Hydraulic Fracturing with Confining Pressure
Numerical example 2 comes from reference [43], as shown in Figure 10. The model size is 300 mm × 300 mm. A circular hole with a diameter of 25 mm is set in the center of the model; meanwhile, directional prefabricated fissures with a length of 10 mm are set on the two sides of the circular hole, whose dip angles are 75°. The horizontal stress is σH = 6 MPa, and the vertical stress is σh = 5 MPa. The loading rate of internal water pressure is 50 Pa/calculation step. The whole model is divided into 300 × 300 = 90,000 particles. The model parameters are set as follows: Particle density is ρ = 2600 kg/m3, Elastic modulus E = 17 GPa, Poisson’s ratio μ = 0.14, Cohesion is set to be 5.95 Mpa, internal friction angle is 40°, and the tensile strength is 3.2 MPa.
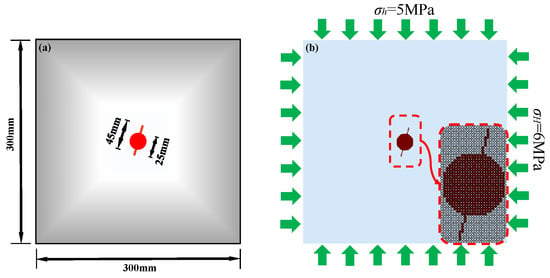
Figure 10.
Model size and particle divisions of example 2. (a) Model size; (b) Particle divisions.
Figure 11 shows the progressive fracture propagation processes of the model under the combined effect of confining pressure and internal water pressure. It can be seen that the fracture initiates from the directional prefabricated fissure tips and propagates along the direction of σh = 5 MPa. The comparisons between the experimental results and the numerical results are shown in Figure 12. Previous experimental results also showed these characteristics [43], which verifies the correctness of the improved SPH method.
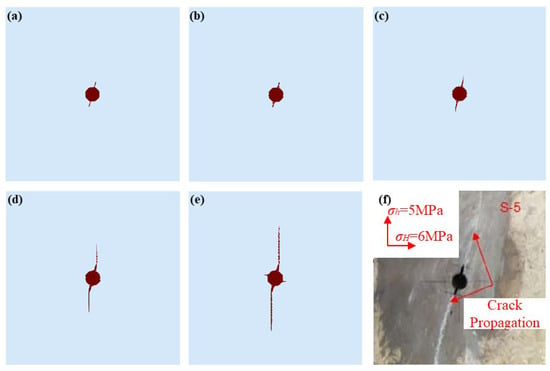
Figure 11.
The progressive fracture propagation processes of example 2 and its comparisons with previous experimental results. (a) Step 0; (b) Step 22,000; (c) Step 24,000; (d) Step 27,000; (e) Step 31,000; (f) Previous experimental results [43].
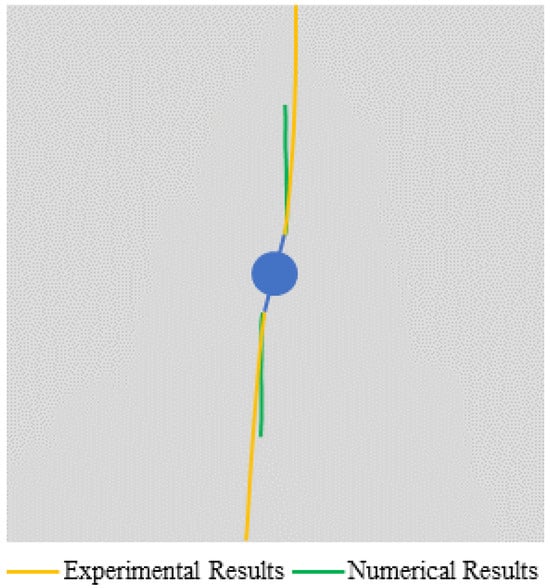
Figure 12.
Comparisons between experimental results and numerical results in the example of directional hydraulic fracturing with confining pressure.
4. Numerical Simulation of Bedding Shale Hydraulic Fracturing
4.1. Numerical Model and Calculation Parameters
In order to explore the formation rules of a shale hydraulic fracture network under different bedding dip angles and confining pressures, the SPH models containing bedding and hydraulic perforation are established, as shown in Figure 13. The number of layers is defined according to the scale of actual conditions. The model size is 1 m × 1 m. The bedding width is 0.02 m and the bedding distance is 0.08 m. The bedding dip angle θ is defined as the angle between the bedding direction and the horizontal direction. The vertical stress is defined as σh, and the horizontal stress is defined as σH. The whole model is divided into 200 × 200 = 40,000 particles. The model parameters are set as follows: Particle density is ρ = 2600 kg/m3, Elastic modulus E = 17 GPa, Poisson’s ratio μ = 0.14, Cohesion is set to be 5.95 Mpa, internal friction angle is 40°, and the tensile strength is 5.2 MPa.
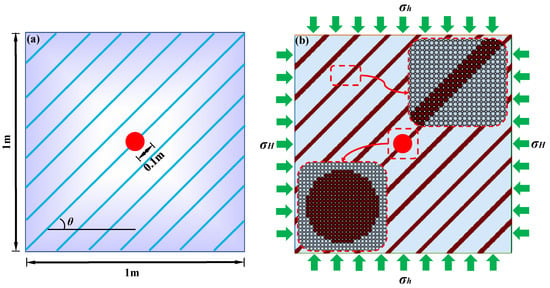
Figure 13.
Calculation model size and particle divisions of example 2. (a) Calculation model size; (b) Particle divisions.
The calculation scheme is set as follows: The vertical stress σh = 10 MPa is kept unchanged, and the horizontal stress σH is set to be 2 MPa, 4 MPa, 6 MPa, 8 Mpa, and 10 MPa, respectively. The ratio of horizontal stress σH to vertical stress σh is called the horizontal stress ratio. Meanwhile, the bedding dip angle θ is set to be 15°, 30°, 45°, 60°, 75°, respectively. The detailed information is shown in Table 1. The load application scheme is as follows: (1) Step 0~2000: in situ stress balance period; (2) Step 2000~7000: internal water pressure loading period. The loading rate is set to be 0.01 MPa/calculation step; (3) Step 7000~10,000: keeping internal water pressure pw = 50 MPa unchanged.

Table 1.
Calculation schemes.
4.2. Effects of Bedding Dip Angles on Particle Failure Counts under Hydraulic Fracturing
The variations of particle failure numbers with calculation steps under hydraulic fracturing are shown in Figure 14. It can be seen that, with the increase of water pressure in perforation, the number of failure particles increases accordingly. Generally, with the increase of horizontal stress σH (the increase of horizontal stress ratio), the total counts of failure particles gradually decrease, which indicates that high in situ stress makes the fracturing pressure of bedding shale formation greater. Meanwhile, the increase of confining pressure also make the difference between bedding angle θ = 15°~75° decrease, indicating that high in situ stress level leads to isotropic hydraulic fracture.
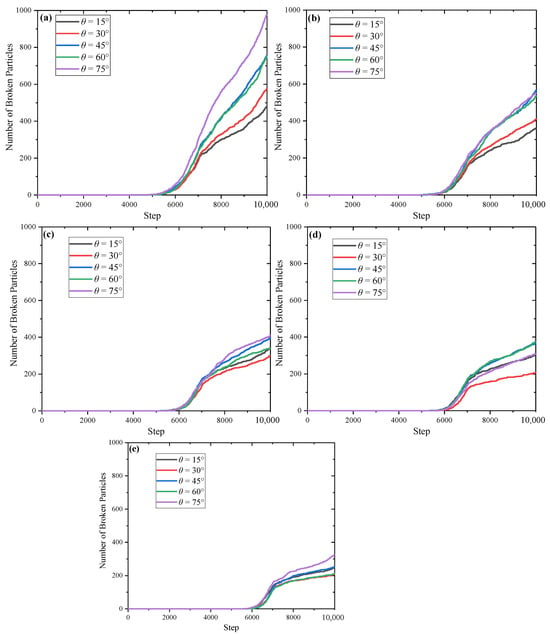
Figure 14.
Variations of particle failure counts with calculation steps. (a) σh = 10 MPa, σH = 2 MPa; (b) σh = 10 MPa, σH = 4 MPa; (c) σh = 10 MPa, σH = 6 MPa; (d) σh = 10 MPa, σH = 8 MPa; (e) σh = 10 MPa, σH = 10 MPa.
In order to quantitatively explore characteristic pressure changes of hydraulic fracturing under different conditions, three typical forms of stress, i.e., (1) initiation stress, (2) extension stress, and (3) buckling stress, are introduced in this section [44]. According to the analysis of numerical simulation results, the initiation stress of hydraulic fracturing is defined as the internal water pressure corresponding to the particle failure number of 50. The extension stress is defined as the internal water pressure corresponding to the particle failure number of 150. The extension stress is defined as the internal water pressure corresponding to the particle failure number of 500.
Figure 15a shows the variations of initiation stress with horizontal stress ratio under different calculation schemes. It can be seen that the initiation stress of the bedding shale model increases with the increase of horizontal stress ratio, varying from 19 MPa to 26 MPa. The expression of the fitting curve is y = a + bx + cx2, where a = 18.8432 ± 1.21916, b = 11.96143 ± 4.64542, and c = −4.89286 ± 3.79804. The R2 is 0.95965. Under the same horizontal stress ratio, the initiation stress of small bedding dip angles (θ < 45°) is larger than that of big bedding dip angles (θ > 45°). Figure 15b shows the variations of extension stress with horizontal stress ratio under different calculation schemes. The expression of the fitting curve is y = a + bx, where a = 25.8134 ± 0.22906 and b = 6.661 ± 0.34532. The R2 is 0.992. It can be seen that extension stress basically increases linearly with the horizontal stress ratio, varying from 25 MPa to 35 MPa. When the horizontal stress ratio is 0.2 and the bedding dip angle θ > 30° or the horizontal stress ratio is 0.4 and the bedding dip angle θ > 45°, the buckling stress will be greater than 40 MPa.
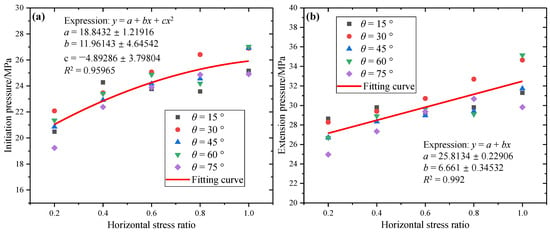
Figure 15.
Initiation and extension stress under different calculation schemes. (a) Initiation stress; (b) Extension stress.
4.3. Effects of Bedding Dip Angles on Formations of Hydraulic Fracturing Networks
Figure 16, Figure 17, Figure 18, Figure 19 and Figure 20 show the morphology of hydraulic fracturing networks under different horizontal stress ratios and different bedding dip angles. It can be seen that the horizontal stress ratio has a great impact on hydraulic fracturing network morphologies. For the circumstance of low horizontal stress ratios, 2~4 main fractures propagate to a certain extent, whose propagation directions are along the direction of maximum principal stress (σh = 10 MPa). However, when the horizontal stress ratio is higher, there are multiple propagation directions and the extension length is relatively short. Meanwhile, when the horizontal stress ratio is relatively lower, the hydraulic fracturing length is longer and the formation range of hydraulic fracturing networks is wider. While in the case of high horizontal stress ratio, the hydraulic fractures are confined around the local perforation area and the fracture formation range is smaller.

Figure 16.
Hydraulic fracture morphology when horizontal stress ratio is 0.2. (a) θ = 15°; (b) θ = 30°; (c) θ = 45°; (d) θ = 60°; (e) θ = 75°.

Figure 17.
Hydraulic fracture morphology when horizontal stress ratio is 0.4. (a) θ = 15°; (b) θ = 30°; (c) θ = 45°; (d) θ = 60°; (e) θ = 75°.

Figure 18.
Hydraulic fracture morphology when horizontal stress ratio is 0.6. (a) θ = 15°; (b) θ = 30°; (c) θ = 45°; (d) θ = 60°; (e) θ = 75°.

Figure 19.
Hydraulic fracture morphology when horizontal stress ratio is 0.8. (a) θ = 15°; (b) θ = 30°; (c) θ = 45°; (d) θ = 60°; (e) θ = 75°.

Figure 20.
Hydraulic fracture morphology when horizontal stress ratio is 1. (a) θ = 15°; (b) θ = 30°; (c) θ = 45°; (d) θ = 60°; (e) θ = 75°.
The bedding dip angle is also another important factor affecting hydraulic fracture morphologies. For the case with small bedding dip angles (θ = 15°), the hydraulic fracture propagates through the bedding. While for the case with larger bedding dip angles (θ = 75°), the hydraulic fracture propagates along the bedding. For the case with bedding dip angle θ ranging from 30° to 60°, the hydraulic fracture morphology is affected by the horizontal stress ratio: When the horizontal stress ratio is smaller, the hydraulic fracture mainly propagates along the bedding. However, when the horizontal stress ratio is larger, the hydraulic fracture will propagate through the bedding.
5. Conclusions
- (1)
- The interaction modes between liquid particles and solid particles have been introduced and the traditional kernel function in the SPH method has been improved by introducing the fracture mark ξ, which can realize the hydraulic fracturing simulations of particles.
- (2)
- The application of the stress boundary of SPH is realized by stress mapping. The feasibility of the improved numerical method is validated by two numerical examples, and the correctness of the method is verified by comparisons with previous experimental results.
- (3)
- The hydraulic fracturing mesh-less numerical model containing bedding properties has been established, and the numerical simulations are carried out on the progressive fracture propagations under different horizontal stress ratios. With the increase of horizontal stress ratio, the total number of damaged particles decreases, but the initiation and extension pressure increase gradually. The initiation stress of small bedding dip angles (θ < 45°) is larger than that of big bedding dip angles (θ > 45°).
- (4)
- The morphology of hydraulic fracturing networks is greatly affected by bedding dip angles and the horizontal stress ratio. The range of hydraulic fracture propagation at low horizontal stress ratio is wider and the fracture propagation is along the direction of maximum principal stress, while the range of hydraulic fracture propagation at a high horizontal stress ratio is limited to perforation. The hydraulic fracture will propagate through the bedding with small dip angles. However, when the bedding dip angle is larger, the hydraulic fracture will propagate along the bedding direction.
Author Contributions
Z.X. and X.W. completed the numerical analysis and wrote the paper; S.Y. provided the writing ideas and supervised the paper. All authors have read and agreed to the published version of the manuscript.
Funding
This work was supported by the Natural Science Foundation of Jiangsu Province, China (Nos. BK20230617), the Natural Science Foundation of the Jiangsu Higher Education Institutions of China (No. 23KJB570002).
Data Availability Statement
All data generated or analyzed during this study are included in this published article. The SPH codes are currently not public.
Acknowledgments
The authors greatly wish to express their thanks to Bi Jing for his technical support in the SPH programming.
Conflicts of Interest
The authors declare no conflicts of interest.
References
- Li, Q.; Liu, J.; Wang, S. Numerical insights into factors affecting collapse behavior of horizontal wellbore in clayey silt hydrate-bearing sediments and the accompanying control strategy. Ocean Eng. 2024, 297, 117029. [Google Scholar] [CrossRef]
- Li, Q.; Li, Y.; Cheng, Y. Numerical simulation of fracture reorientation during hydraulic fracturing in perforated horizontal well in shale reservoirs. Energy Sources Part A Recovery Util. Environ. Eff. 2018, 40, 1807–1813. [Google Scholar] [CrossRef]
- Li, Q.; Zhang, C.; Yang, Y. Preliminary experimental investigation on long-term fracture conductivity for evaluating the feasibility and efficiency of fracturing operation in offshore hydrate-bearing sediments. Ocean Eng. 2023, 281, 114949. [Google Scholar] [CrossRef]
- Li, Q.; Zhao, D.; Yin, J. Sediment Instability Caused by Gas Production from Hydrate-bearing Sediment in Northern South China Sea by Horizontal Wellbore: Evolution and Mechanism. Nat. Resour. Res. 2023, 32, 1595–1620. [Google Scholar] [CrossRef]
- Tan, P.; Jin, Y.; Wang, Y. Hydraulic fracture vertical propagation behavior in transversely isotropic layered shale formation with transition zone using XFEM-based CZM method. Eng. Fract. Mech. 2021, 248, 107707. [Google Scholar] [CrossRef]
- Zheng, H.; Pu, C.; Xu, E. Numerical investigation on the effect of well interference on hydraulic fracture propagation in shale formation. Eng. Fract. Mech. 2020, 228, 106932. [Google Scholar] [CrossRef]
- Gasparrini, M.; Sassi, W.; Gale, J.F.W. Natural sealed fractures in mudrocks: A case study tied to burial history from the Barnett Shale, Fort Worth Basin, Texas, USA. Mar. Pet. Geol. 2014, 55, 122–141. [Google Scholar] [CrossRef]
- Warpinski, N.R.; Teufel, L.W. Determination of the effective-stress law for permeability and deformation in low-permeability rocks. SPE Form. Eval. 1992, 7, 123–131. [Google Scholar] [CrossRef]
- Janszen, M.; Bakker, T.; Zitha, P. Hydraulic Fracturing in the Dutch Posedonia Shale. In Proceedings of the SPE European Formation Damage Conference and Exhibition. Society of Petroleum Engineers, Budapest, Hungary, 3–5 June 2015. [Google Scholar]
- Wang, H.; Jiang, Y.; Bian, X. Optimization and field test of deep shale fracturing process. Pet. Drill. Technol. 2016, 44, 76–81. [Google Scholar]
- Sun, K.; Zhang, S.; Xin, L. Effect of shale gas reservoir bedding direction on hydraulic fracturing crack propagation. Nat. Gas Ind. 2016, 36, 45–51. [Google Scholar]
- Liu, Z.; Feng, Q.; Wang, Y. Fracture height prediction model and operation optimization method considering bedding influence in Weiyuan shale gas reservoir. Logging Technol. 2022, 46, 114–121. [Google Scholar]
- Wang, C.; Zhang, H.; Zhao, J. Study on hydraulic fracturing fracture propagation in elastic-plastic reservoir. Pet. Mach. 2022, 50, 80–88. [Google Scholar]
- Cai, X. Complex fracture propagation model for supercritical CO2 fracturing in unconventional reservoirs. Fault-Block Field 2022, 29, 107–110+123. [Google Scholar]
- Branco, R.; Antunes, F.V.; Costa, J.D. A review on 3D-FE adaptive remeshing techniques for crack growth modelling. Eng. Fract. Mech. 2015, 141, 170–195. [Google Scholar] [CrossRef]
- Xu, X.P.; Needleman, A. Numerical simulations of fast crack growth in brittle solids. J. Mech. Phys. Solids 1994, 42, 1397–1434. [Google Scholar] [CrossRef]
- Zhang, P.; Zhang, L.; Baxevanakis, K.P. Modelling short crack propagation in a single crystal nickel-based superalloy using crystal plasticity and XFEM. Int. J. Fatigue 2020, 136, 105594. [Google Scholar] [CrossRef]
- Zhao, E.; Li, B. Evaluation Method for Cohesive Crack Propagation in Fragile Locations of RCC Dam Using XFEM. Water 2020, 13, 58. [Google Scholar] [CrossRef]
- Teimouri, F.; Heidari-Rarani, M.; Aboutalebi, F. Experimental characterization and cyclic cohesive zone modeling of mode I delamination growth in glass/epoxy composite laminates under high cycle fatigue. Eng. Fract. Mech. 2024, 9, 109853. [Google Scholar] [CrossRef]
- Alberto, A.; Valente, S. Asymptotic fields at the tip of a cohesive frictional crack growing at the bi-material interface between a dam and the foundation rock. Eng. Fract. Mech. 2013, 108, 152–161. [Google Scholar] [CrossRef]
- Zhang, L.; Du, H.; Yu, W. String-based cohesive zone model: Implicit integration scheme and calibration method. Int. J. Fract. 2020, 222, 53–74. [Google Scholar] [CrossRef]
- Li, Z.; Rao, Q.H. Quantitative determination of PFC3D microscopic parameters. J. Cent. South Univ. 2021, 28, 911–925. [Google Scholar] [CrossRef]
- He, Y. Dynamic Response of Rock-like Materials Based on SHPB Pulse Waveform Characteristics. Materials 2021, 15, 210. [Google Scholar] [CrossRef]
- Yang, Y.; Xia, Y.; Zheng, H. Investigation of rock slope stability using a 3D nonlinear strength-reduction numerical manifold method. Eng. Geol. 2021, 292, 106285. [Google Scholar] [CrossRef]
- Xl, A.; Cheng, H.A.; Ql, B. Grout penetration process simulation and grouting parameters analysis in fractured rock mass using numerical manifold method—ScienceDirect. Eng. Anal. Bound. Elem. 2021, 123, 93–106. [Google Scholar]
- Jiang, W. Numerical Analysis of The Damping Vibration Effect of Pre-splitting Crack Based on DDA. Int. J. Adv. Comput. Technol. 2011, 3, 188–196. [Google Scholar]
- Wang, C.; Wang, S.; Chen, G. Implementation of a J-integral Based Maximum Circumferential Tensile Stress Theory in DDA for Simulating Crack Propagation. Eng. Fract. Mech. 2021, 246, 107621. [Google Scholar] [CrossRef]
- Zhou, X.; Du, E.; Wang, Y. Thermo-hydro-chemo-mechanical coupling peridynamic model of fractured rock mass and its application in geothermal extraction. Comput. Geotech. 2022, 148, 104837. [Google Scholar] [CrossRef]
- Tian, D.; Zhou, X. A viscoelastic model of geometry-constraint-based non-ordinary state-based peridynamics with progressive damage. Comput. Geotech. 2022, 69, 1413–1441. [Google Scholar] [CrossRef]
- Spetz, A.; Denzer, R.; Tudisco, E. Phase-field fracture modelling of crack nucleation and propagation in porous rock. Int. J. Fract. 2020, 224, 31–46. [Google Scholar] [CrossRef]
- Zhou, S.; Zhuang, X.; Zhou, J. Phase Field Characterization of Rock Fractures in Brazilian Splitting Test Specimens Containing Voids and Inclusions. Int. J. Geomech. 2021, 21, 04021006. [Google Scholar] [CrossRef]
- Gnanasekaran, B.; Liu, G.R.; Fu, Y. A Smoothed Particle Hydrodynamics (SPH) procedure for simulating cold spray process—A study using particles. Surf. Coat. Technol. 2019, 377, 124812. [Google Scholar] [CrossRef]
- Bi, J.; Zhou, X.P. A Novel Numerical Algorithm for Simulation of Initiation, Propagation and Coalescence of Flaws Subject to Internal Fluid Pressure and Vertical Stress in the Framework of General Particle Dynamics. Rock Mech. Rock Eng. 2017, 50, 1833–1849. [Google Scholar] [CrossRef]
- Bi, J.; Zhou, X.P.; Qian, Q.H. The 3D Numerical Simulation for the Propagation Process of Multiple Pre-existing Flaws in Rock-Like Materials Subjected to Biaxial Compressive Loads. Rock Mech. Rock Eng. 2016, 49, 1611–1627. [Google Scholar] [CrossRef]
- Zhou, X.P.; Bi, J.; Qian, Q.H. Numerical Simulation of Crack Growth and Coalescence in Rock-Like Materials Containing Multiple Pre-existing Flaws. Rock Mech. Rock Eng. 2015, 48, 1097–1114. [Google Scholar] [CrossRef]
- Zhou, X.P.; Bi, J. 3D Numerical Study on the Growth and Coalescence of Pre-existing Flaws in Rocklike Materials Subjected to Uniaxial Compression. Int. J. Geomech. 2016, 16, 04015096. [Google Scholar] [CrossRef]
- Zhou, X.P.; Zhao, Y.; Qian, Q.H. A novel meshless numerical method for modeling progressive failure processes of slopes. Eng. Geol. 2015, 192, 139–153. [Google Scholar] [CrossRef]
- Zhao, Y.; Zhou, X.P.; Qian, Q.H. Progressive failure processes of reinforced slopes based on general particle dynamic method. J. Cent. South Univ. (Sci. Technol.) 2015, 22, 4049–4055. [Google Scholar] [CrossRef]
- Zhou, X.P.; Zhao, Y.; Qian, Q.H. Numerical simulation of rock failure process in uniaxial compression using smoothed particle hydrodynamics. Chin. J. Rock Mech. Eng. 2015, 34, 2647–2658. [Google Scholar]
- Zhou, X.P.; Yang, H.Q. Multiscale numerical modeling of propagation and coalescence of multiple cracks in rock masses. Int. J. Rock Mech. Min. Sci. 2012, 55, 15–27. [Google Scholar] [CrossRef]
- Yang, S.; Ren, X.; Zhang, J. Hydraulic fracturing of gravity dam based on numerical manifold method. Rock Soil Mech. 2018, 39, 3055–3060+3070. [Google Scholar]
- Liu, D. Experimental Study on Fracture and Hydraulic Fracturing Characteristics of Cement Mortar under Chemical Erosion. Ph.D. Thesis, Hohai University, Nanjing, China, 2019. [Google Scholar]
- Yang, S. Study on Initiation and Propagation of Prefabricated Fractures in Sandstone by Directional Fracturing. Ph.D. Thesis, Taiyuan University of Technology, Taiyuan, China, 2017. [Google Scholar]
- Cl, A.; Jgwa, B. Peridynamic simulation on hydraulic fracture propagation in shale formation. Eng. Fract. Mech. 2021, 258, 108095. [Google Scholar]
Disclaimer/Publisher’s Note: The statements, opinions and data contained in all publications are solely those of the individual author(s) and contributor(s) and not of MDPI and/or the editor(s). MDPI and/or the editor(s) disclaim responsibility for any injury to people or property resulting from any ideas, methods, instructions or products referred to in the content. |
© 2024 by the authors. Licensee MDPI, Basel, Switzerland. This article is an open access article distributed under the terms and conditions of the Creative Commons Attribution (CC BY) license (https://creativecommons.org/licenses/by/4.0/).