Article

Analysis of the Hydrogeochemical Characteristics and Origins of Groundwater in the Changbai Mountain Region via Inverse Hydrogeochemical Modeling and Unsupervised Machine Learning

1
Institute of Disaster Prevention, Sanhe 065201, China
2
Soil and Agricultural Ecological Environment Supervision Technology Center, Ministry of Ecology and Environment, Beijing 100012, China
3
Chinese Academy of Natural Resources Economics, Beijing 100035, China
*
Authors to whom correspondence should be addressed.
Water 2024, 16(13), 1853; https://doi.org/10.3390/w16131853
Submission received: 28 May 2024 / Revised: 17 June 2024 / Accepted: 25 June 2024 / Published: 28 June 2024
(This article belongs to the Special Issue New Application of Isotopes in Hydrology and Hydrogeology)

Abstract

:
This study employed hydrochemical data, traditional hydrogeochemical methods, inverse hydrogeochemical modeling, and unsupervised machine learning techniques to explore the hydrogeochemical traits and origins of groundwater in the Changbai Mountain region. (1) Findings reveal that predominant hydrochemical types include HCO3Ca·Mg, HCO3Ca·Na·Mg, HCO3Mg·Na, and HCO3Na·Mg. The average metasilicic acid content was found to be at 49.13 mg/L. (2) Rock weathering mechanisms, particularly silicate mineral weathering, primarily shape groundwater chemistry, followed by carbonate dissolution. (3) Water-rock interactions involve volcanic mineral dissolution and cation exchange adsorption. Inverse hydrogeochemical modeling, alongside analysis of the widespread volcanic lithology, underscores the complexity of groundwater reactions, influenced not only by water-rock interactions but also by evaporation and precipitation. (4) Unsupervised machine learning, integrating SOM, PCA, and K-means techniques, elucidates hydrochemical types. SOM component maps reveal a close combination of various hydrochemical components. Principal component analysis (PCA) identifies the first principal component (PC1), explaining 48.15% of the variance. The second (PC2) and third (PC3) principal components, explain 13.2% and 10.8% of the variance, respectively. K clustering categorized samples into three main clusters: one less influenced by basaltic geological processes, another showing strong igneous rock weathering characteristics, and the third affected by other geological processes or anthropogenic factors.

1. Introduction

Human existence and all economic activities hinge on the uninterrupted provision of freshwater, a vital yet increasingly imperiled resource. Groundwater, comprising 99% of global freshwater, sustains the daily needs, agricultural endeavors, and industrial operations of most of the world’s populace [1]. Groundwater, subject to water quality evaluations and pertinent regulations, can be delineated into specific usage types, including potable natural drinking water and irrigation water for agriculture.
The depletion of natural drinking water, an invaluable asset, has accelerated due to human interventions, leading to diminished water quality and ecological harm. The chosen study locale, the Changbai Mountain region, stands out for its abundant forest cover, minimal industrial and agricultural footprint, sparse population, and pristine water quality, making it a hub for major mineral water producers.
Typically, natural springs emerge at intersections of groundwater table levels, geological formations, hydrological conditions, and aquifer discharge points [2,3]. The elemental composition of mineral water is shaped by interactions between water and rock along its path [4]. Various investigations, such as those by Gopal Krishan et al. [5], have employed traditional hydrogeochemical analyses, ion ratio diagrams, and water quality indices (WQIs) to probe into drinking water quality and the underlying hydrogeochemical processes. Wang et al. [6] delved into the hydrogeochemical attributes and quality of groundwater in the upper Yellow River region of Northwest China, revealing that water chemistry is modulated by cation exchange, evaporation, and rock-water interactions. Nimcan Abdi Mohamed et al. [7] utilized GIS, the groundwater quality index (GWQI), and multivariate statistical methods (MSMs) to delineate and evaluate groundwater quality in the area, identifying diverse ion concentrations, spatial distribution patterns, groundwater suitability, and hydrochemical processes influencing its chemical characteristics.
Self-organizing maps (SOMs) serve as potent nonlinear projection tools, facilitating the visualization of intricate high-dimensional data in low-dimensional spaces and the identification of groundwater hydrochemistry control factors [8,9]. In this study, unsupervised machine learning models, including SOM, PCA, and K-means, were utilized to authenticate and scrutinize the origins and formation mechanisms of groundwater.
Consequently, the primary objective of this investigation was to elucidate the hydrogeochemical formation processes within the study area and conduct a comprehensive analysis of the relationships among diverse hydrochemical components in the groundwater. Subsequently, novel methodologies, such as machine learning, were employed to invert and predict various indicators of the sampled groundwater in the study locale. This effort is intended to validate the accuracy of our assessments and analyses based on current measurements, as well as to lay the groundwork for groundwater research that seeks to integrate new approaches with older technologies for smarter development and utilization of high-quality groundwater resources in the future.

2. Study Area

2.1. Natural Conditions and Regional Geological Settings

The study site is situated in the southeastern part of Jilin Province, China, covering the entire Chinese portion of the Changbai Mountain region. Spanning 9096 km2, the study area extends across two county-level administrative regions from east to west: Antu County and Fusong County. Figure 1 illustrates the distribution and sampling points within the study zone. The area features a temperate continental monsoon climate with short frost-free periods and prolonged freezing periods. The annual mean temperature stands at 3.7 °C, with peak temperatures occurring in July and August, averaging 26.0 °C, and with the highest recorded temperature reaching 34.7 °C [10]. January marks the coldest month, with an average temperature of −28.0 °C and a minimum of −40.5 °C. The maximum freezing depth reaches 1.50 m. Annually, the region receives an average of 2352.5 h of sunshine. The mean annual precipitation amounts to 808.9 mm, ranging from a maximum of 1071.3 mm to a minimum of 574.5 mm. Approximately 60% of the yearly rainfall occurs between June and August [11]. The average annual evaporation rate is 1291.7 mm, accompanied by an average annual wind speed of 1.7 m/s. Specific details are illustrated in Figure 2.
The study area encircles Changbai Mountain Tianchi (Heaven Lake) from the north to the west. The terrain exhibits higher elevations in the southeast and lower elevations in the northwest. Geomorphological units comprise the eastern Tianchi volcanic cone and volcanic lava plateau [12], along with the northwestern middle and lower mountains. The southeastern TianchiWangtian’e Peak ridge extends in a north-northeast direction, featuring rugged and grandiose terrain. The primary peak, Baekdu Peak, rises to an elevation of 2691 m. Southward, Wangtian’e Peak reaches 2051 m, with terrain gradually sloping westward and northward, typically ranging from 600 to 1200 m in elevation. Volcanic landforms, including the Tianchi volcanic cone and extensive basalt lava plateaus, formed due to Cenozoic volcanic activity, shaping a stepped terrain descending from southeast to northwest. In the southwestern corner of the study area, explosive interactions between magma and water have given rise to maar lakes, such as Sihailongwan.
Located at the northeastern margin of the North China Plate, the study area intersects the northeast-trending circum-Pacific volcanic orogenic belt and the China Eastern continental rift system. Intense volcanic activity and complex geological structures characterize the region. Extensive crustal movements within the Changbai Mountain volcanic system have led to the formation of basalt plateaus. The area exhibits well-developed strata, including Archean, Proterozoic, Paleozoic, Mesozoic, and Cenozoic layers.

2.2. Hydrogeological Conditions

Sedimentation, magmatic activity, metamorphism, folding, and faulting govern the formation and distribution of groundwater in the study area. The region offers extensive river valleys, with sand, gravel, and conglomerate alluvial and sedimentary deposits lining the riverbeds, forming the primary clastic rock pore-fracture water-bearing formations. The area has undergone five eruptive cycles of intense volcanic activity, resulting in volcanic breccia and basalt as the main aquifer formations during multiphase eruptions. These formations exhibit varying water-bearing capacities contingent upon the eruptive phases and structural and cavity development [13].
Furthermore, sedimentary limestone formations from the Ordovician, Cambrian, and Sinian periods contribute to the primary carbonate rock fracture-cavity water-bearing formations. Groundwater within and surrounding the study site is categorized based on aquifer media and void type development, including clastic rock pore-fracture water, carbonate rock fracture-cavity water, basalt pore-fracture water, and general bedrock fracture water [14].
Groundwater recharge, runoff, and discharge in the region are influenced by meteorological, hydrological, geological, geomorphological, and anthropogenic factors. The main groundwater recharge source is atmospheric precipitation infiltration, predominantly discharged as springs. The regional climate exhibits distinct seasonal variations, reflecting in groundwater dynamics with evident seasonal recharge, runoff, and discharge patterns. Winter sees a halt in vertical recharge from atmospheric precipitation, with surface runoff sustained by groundwater discharge, equivalent to groundwater discharge volume. Spring brings rising river water levels from melting snow and ice, leading to vertical infiltration recharge and groundwater level elevation. Substantial summer rainfall contributes to groundwater level rise, while reduced autumn precipitation results in declining groundwater levels.
The recharge, runoff, and discharge characteristics of different groundwater types within the study area are distinctive, as depicted in Figure 1, showcasing specific hydrogeological zoning for various points.

3. Materials and Methods

3.1. Sample Collection and Analysis

The hydrochemical data utilized in this study were gathered through the analysis of spring water samples collected both in the field and from existing literature. In July 2020, a total of 66 sets of spring water samples were collected from the study area. These sampling points were situated within the Changbai Mountain region, primarily along the paths of groundwater flow. Before sample collection, the sampling bottles underwent prewashing with distilled water and rinsing three times with spring water from the designated sampling point. On-site pH measurements were conducted, following which the water samples were sealed, labeled, stored at 4 °C, and dispatched to the Testing Science Laboratory Center at Jilin University for water quality assessment [15]. The storage of water samples were in accordance with the requirements of the National Standard Groundwater Quality Standard of the People’s Republic of China GB/T14848-2017. The water samples for metal cation analysis were collected in 500 mL glass bottles through a 0.22 μm membrane filter, and the water samples were acidified with HNO3 to pH < 2. Water samples for anion analysis were collected in 500 mL high density polyethylene (HDPE) bottles through a 0.22 μm membrane filter. The analysis was carried out in accordance with the “Standards for Drinking Natural Mineral Water” (GB 8537-2018 National Food Safety Standard) and the “Limits of Contaminants in Food” (GB 2762-2017 National Food Safety Standard). For the acquisition of water samples and data, we need to thank Fusong County Mineral Water Management Bureau and Antu County Mineral Water Management Bureau for their strong support.
The concentrations of lithium, strontium, zinc, sodium, potassium, calcium, magnesium, metasilicic acid, fluoride (as F), bicarbonate, chloride, sulfate, iron, and hydroxide were determined using a Shimadzu AA-6000CF atomic absorption spectrophotometer and a Dionex ICS-2100 ion chromatograph. Nitrates (as NO3), nitrites (as NO2), and ammonia nitrogen (as NH4+) were measured using a spectrophotometer, while pH and total hardness (as CaCO3) were determined by titration. On-site measurements included temperature, odor, and appearance.

3.2. Data Processing and Analysis

3.2.1. Traditional Hydrogeochemical Techniques

To analyze the hydrochemical characteristics, Piper diagrams, Pearson’s correlation matrices, and Gibbs diagrams were created using Origin2021 and Python. These visualizations were employed to qualitatively depict the relationships among different components in the water samples and their environmental behaviors. These tools aided in identifying water-rock interactions and other processes influencing water chemistry. Furthermore, the PHREEQC chemical equilibrium model software was utilized to simulate the collected water samples. This facilitated the understanding and prediction of phenomena such as mineral phase equilibrium and solubility control in hydrochemical reactions. The genesis types of the water samples were evaluated to ascertain ion exchange processes along groundwater flow paths.

3.2.2. Unsupervised Machine Learning

In this study, unsupervised machine learning techniques were implemented using Python for data processing, incorporating self-organizing maps (SOMs), principal component analysis (PCA), and K-means clustering for data validation and analysis. SOM is an advanced artificial neural network (ANN) utilized for unsupervised data mining. SOM effectively delineates distribution patterns and relationships among samples within a vast and intricate groundwater hydrochemical dataset. Critical considerations in SOM analysis include SOM topology, appropriate clustering methods, and the training process [9].
PCA served to identify and quantify the most influential factors affecting groundwater chemical composition, extracting the primary influencing factors and sources of variation. The K clustering method allocated groundwater data based on the optimal number of clusters indicated by these indices.
To accurately reflect the hydrochemical properties of groundwater in the Changbai Mountain region, 19 variables (pH, Na+, K+, Ca2+, Mg2+, Fe, HCO3, SO42−, Cl, NO3, F, H2SiO3, Al3+, Ba2+, Li+, Mn2+, Sr2+, TDS, and hardness) were used as the input dataset. After data processing, SOM technology was applied for the initial classification, followed by PCA and K-means clustering. After 10,000 iterations, including PCA and K-means clustering, the SOM model stabilized, validating the original hydrochemical data and analyzing the hydrochemical formation mechanisms.

4. Results and Discussion

4.1. Hydrochemical Characteristics

The hydrochemical data pertaining to metasilicic acid mineral water collected in July 2018 are succinctly summarized. The findings, as delineated in Table 1 and Figure 2, revealed pH values spanning from 7.3 to 8.3 across various sampling points within the study area. Concurrently, total dissolved solids (TDS) exhibited a range from 76 to 278 mg/L, indicating a mildly alkaline and low-mineralized water profile. Hardness levels, ranging from 16.3 to 122.2 mg/L, complement these observations. Metasilicic acid content varied from 28.8 to 62.4 mg/L, while strontium content fluctuated between 0.01 to 0.09 mg/L. According to the National Standard for Natural Mineral Water (GB8537-2018), a minimum metasilicic acid content of 25 mg/L and a strontium content of not less than 0.2 mg/L were stipulated. Consequently, all sampled spring points met the criteria for classification as metasilicic acid mineral water.
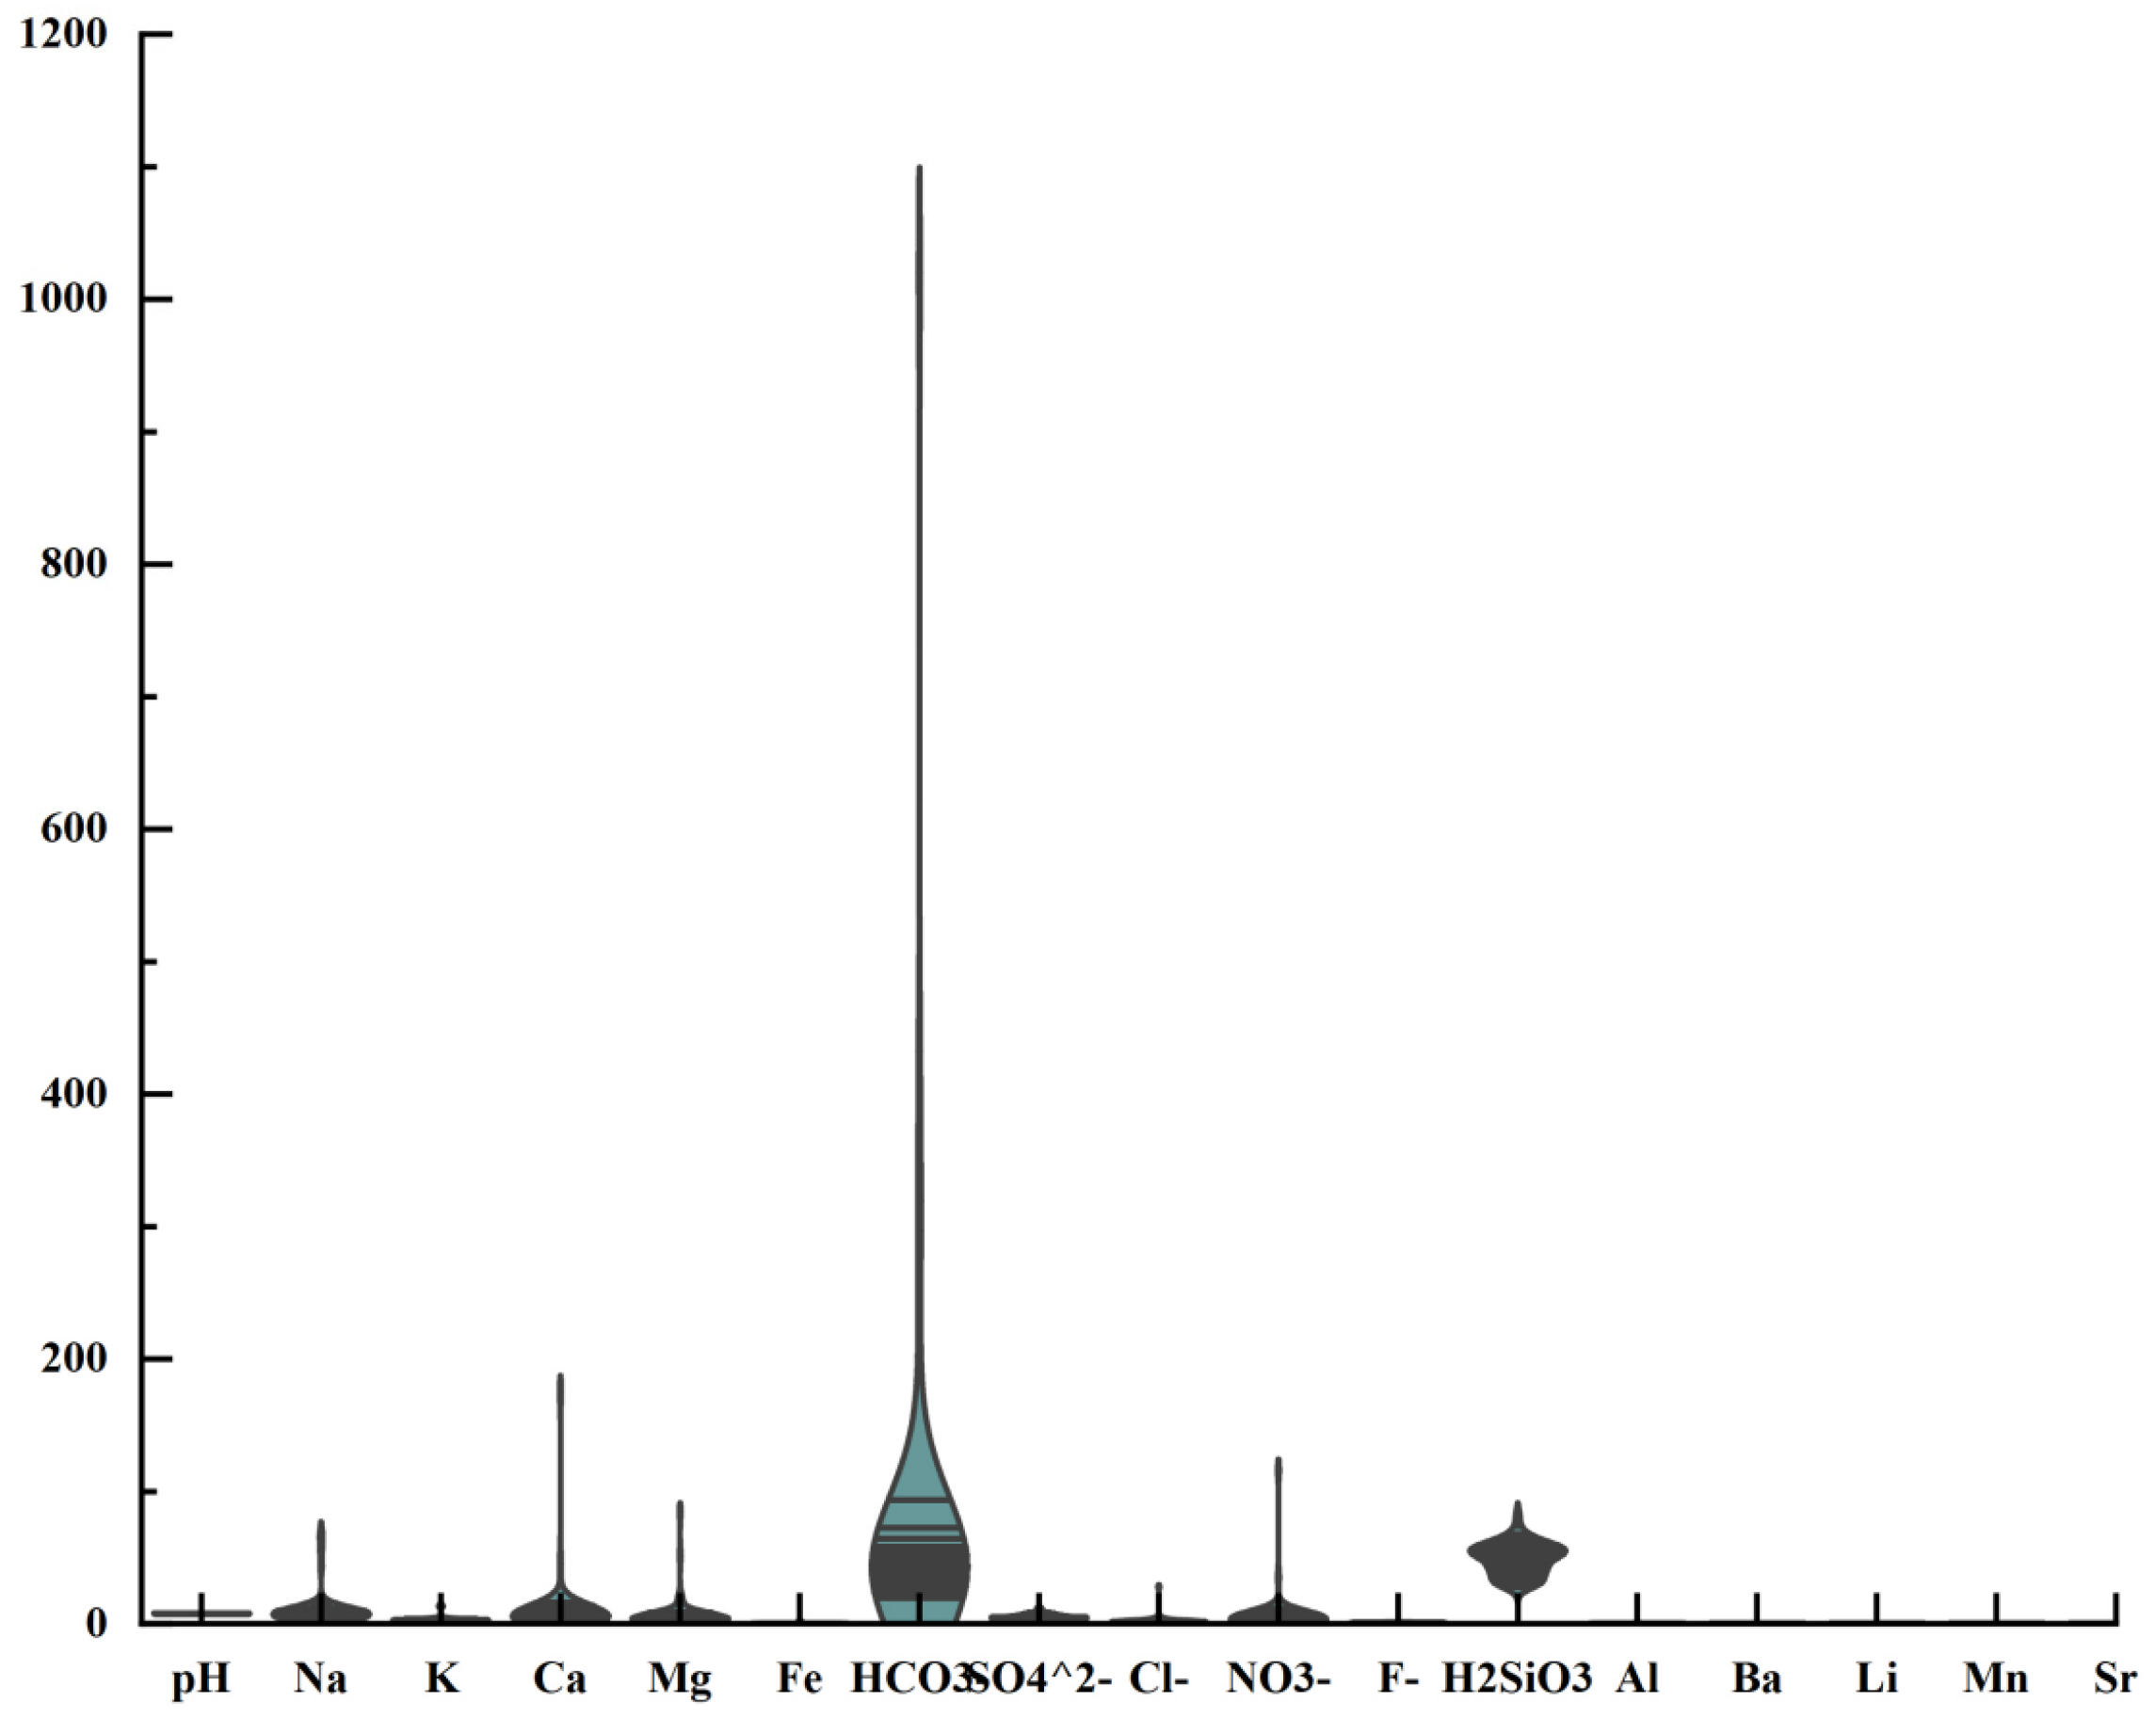
The results from Figure 2 and Figure 3 and Table 1 delineate the hierarchical arrangement of hydrochemical components, prominently featuring HCO3 as the prevailing ion, followed by H2SiO3, Na+, Ca2+, Mg2+, SO42−, K+, Cl, NO3, F, Al3+, Sr2+, Fe, Ba2+, Li+, and Mn2+. Predominantly, cations are ordered as Na+ > Ca2+ > Mg2+ > K+, while anions follow the hierarchy of HCO3 > NO3 > SO42− > Cl. The average concentrations of cations K+, Na+, Ca2+, and Mg2+ within the samples were 3.01, 10.30, 9.29, and 6.32 mg/L, respectively. The combined percentages of Na+ + K+, Ca2+, and Mg2+ were 11.5%, 8%, and 5.5%, respectively. Overall, the water samples exhibited mild alkalinity, showcasing slight variations in major component concentrations while maintaining stable ratios of ion contents.
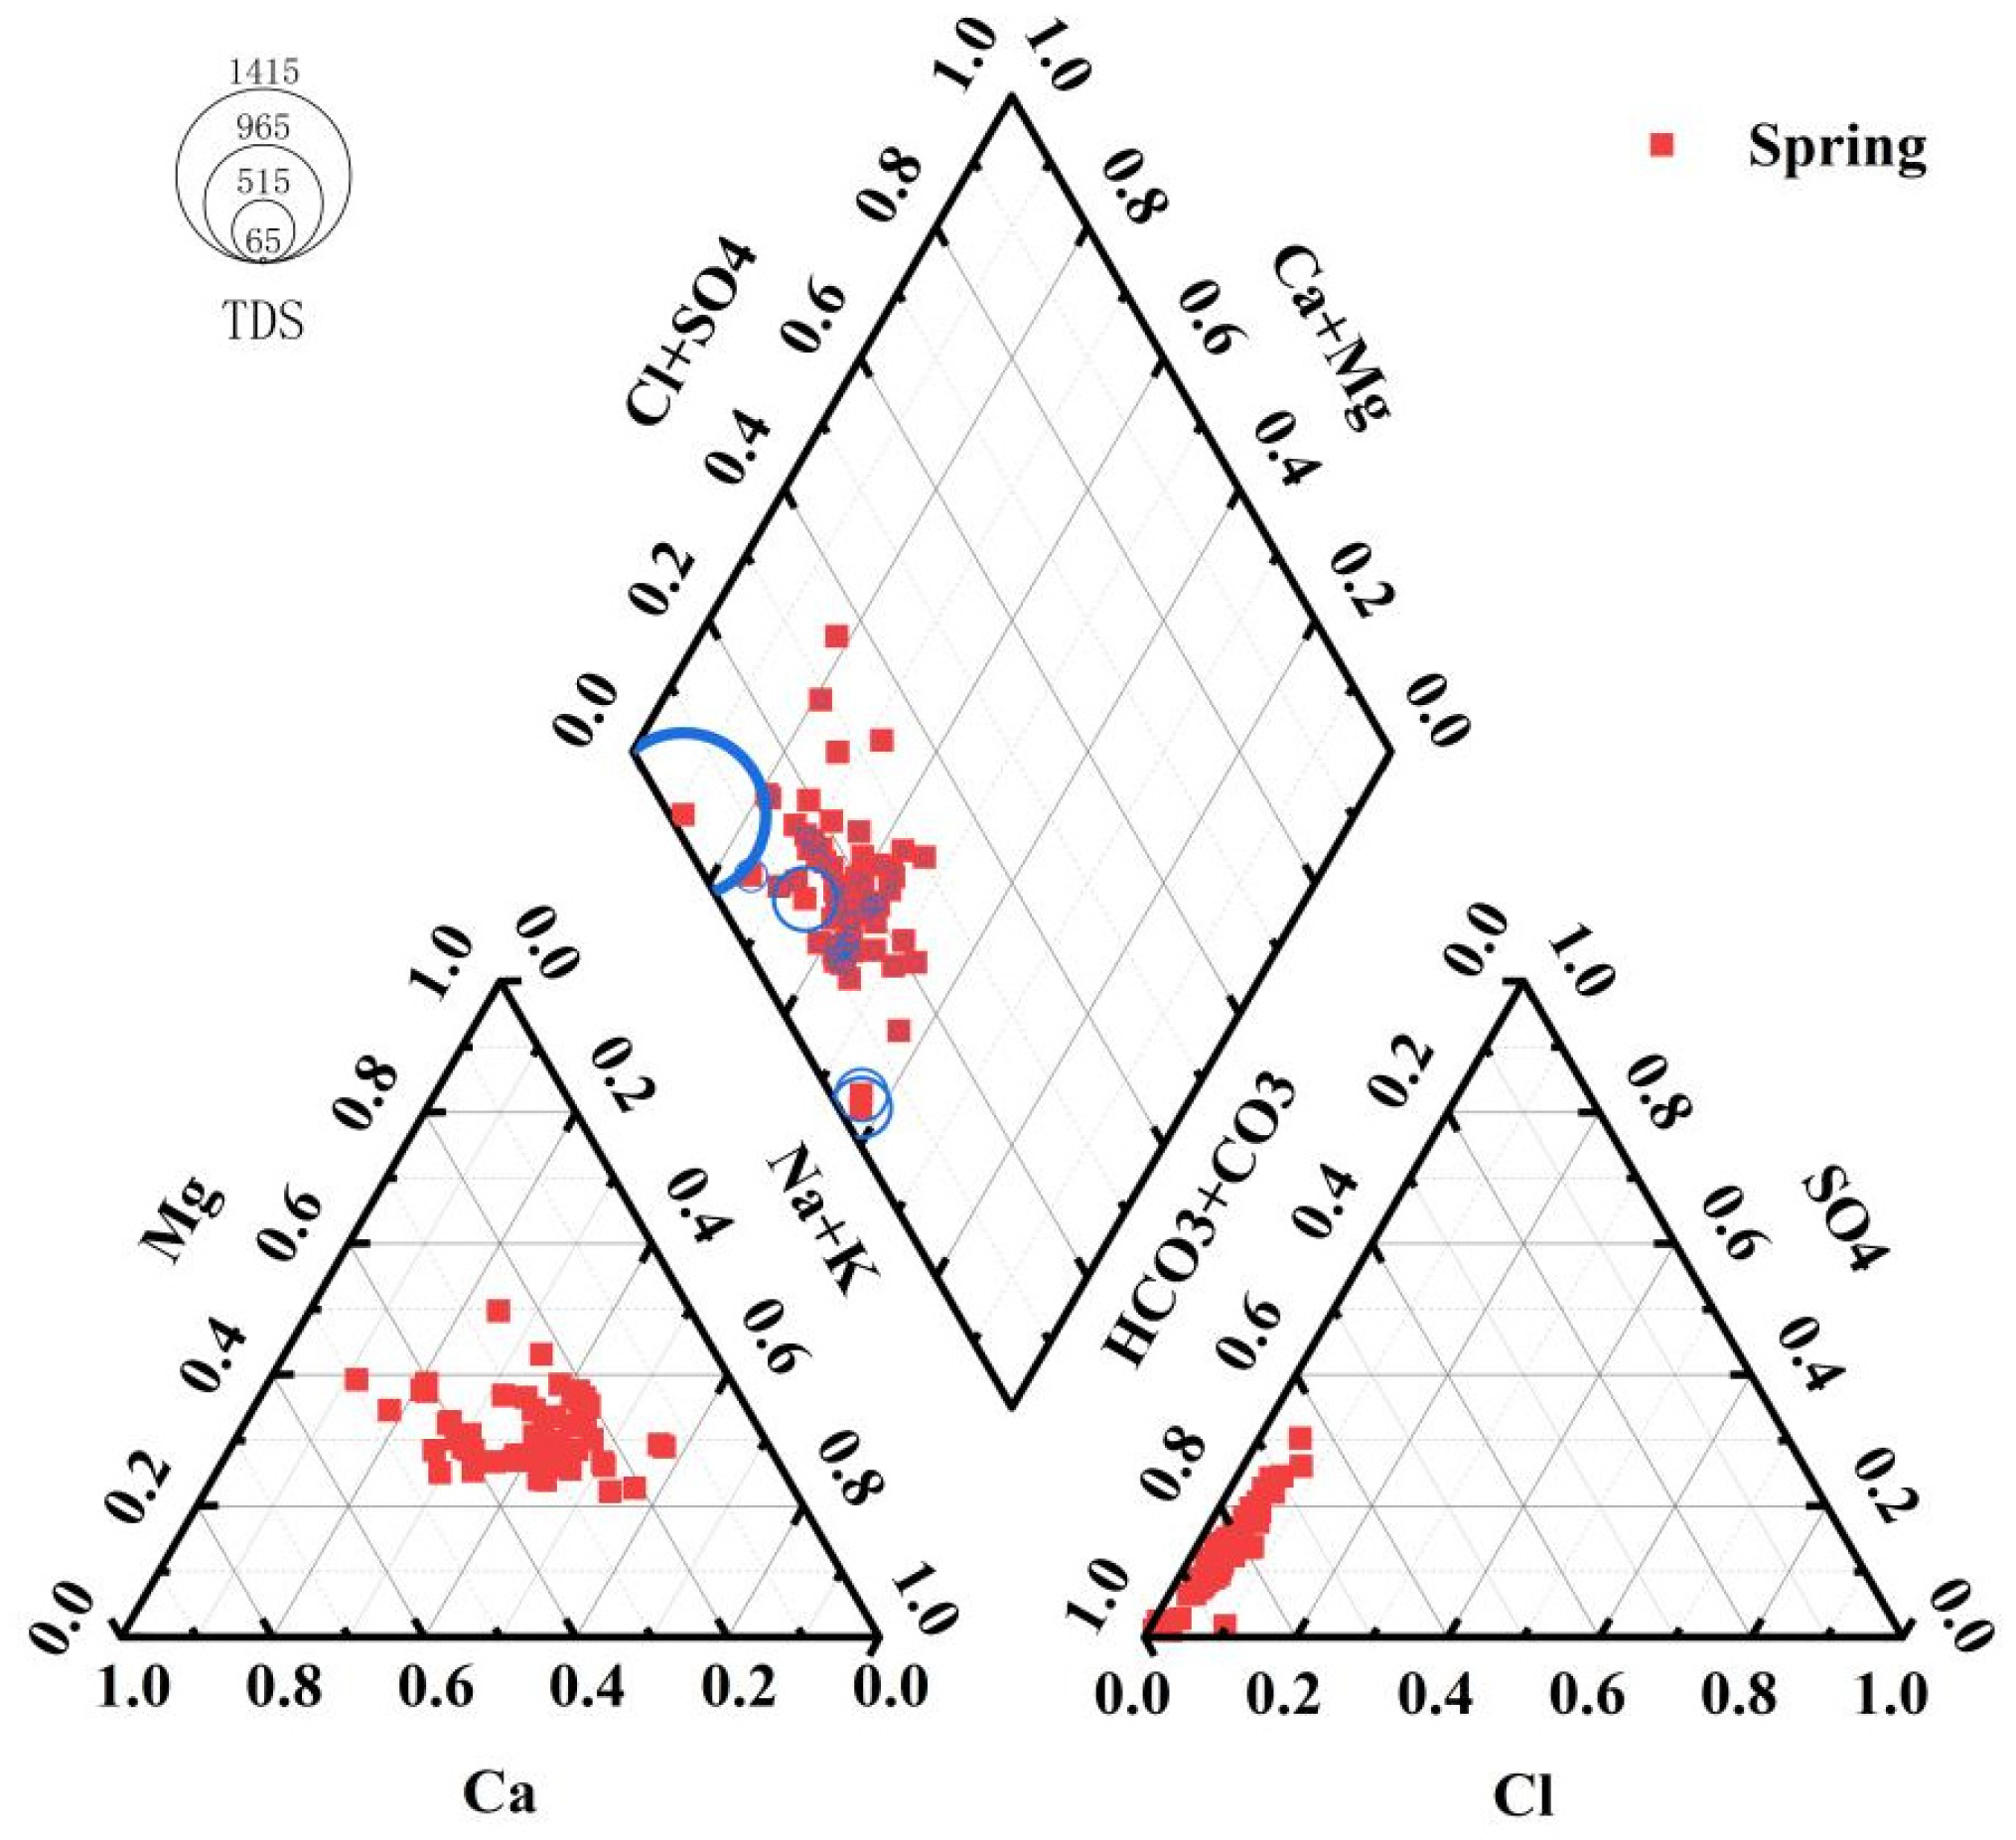
Based on the Piper trilinear diagram (see Figure 4), the hydrochemical composition of the water samples was relatively stable. Among the 66 water samples, alkali metal ions (Na+ and K+) generally exceeded alkaline earth metal ions (Ca2+ and Mg2+), i.e., Ca2+ + Mg2+< Na+ + K+Ca2+ + Mg2+ < Na+ + K+. Additionally, weak acids (HCO3) were more prevalent than strong acids (SO42− and Cl), i.e., HCO3 > SO42− + ClHCO3 > SO42− + Cl.
Most samples were dominated by the cations Ca2+ and Mg2+, while the majority of anions were dominated by HCO3. The primary hydrochemical types were HCO3Na·Mg, HCO3Mg·Na, HCO3Na·Mg·Ca, and HCO3Mg·Na·Ca [16,17,18,19,20].
These classifications indicate that the groundwater chemistry in the study area is influenced by both bicarbonate and a mixture of sodium, magnesium, and calcium ions. The stability of these hydrochemical components suggests consistent water–rock interactions and minimal variations in the contributing geological and hydrological processes [21].

4.2. Hydrochemical Genesis Analysis

4.2.1. Analysis of Groundwater Formation Processes

Gibbs [22] identified three primary mechanisms governing the formation of major chemical components in natural water bodies: evaporation-dominated, precipitation-dominated, and rock-weathering-dominated processes. Through extensive statistical analysis of water quality data, he developed two key diagrams to assess the sources of these main components. The first diagram illustrates the relationship between Na/(Na+Ca) and TDS (total dissolved solids), while the second diagram depicts the relationship between Cl/(Cl + HCO3) and TDS. These diagrams have been widely utilized to investigate the mechanisms of groundwater hydrochemical formation.
In this study, Gibbs diagrams were employed to ascertain the factors influencing the hydrochemical evolution of groundwater in the study area (Figure 5).
Figure 5 shows that most samples were centrally located and relatively concentrated. The ratios of Na+/(Na+ + Ca2+) and Cl/(Cl + HCO3) were predominantly between 0.2 and 0.8 and between 0 and 0.1, respectively, mostly falling in the middle of the graph. This indicates that the majority of water samples were influenced by rock weathering, with ions primarily derived from the weathering of rocks. Some groundwater samples showed slight shifts toward atmospheric precipitation factors (Figure 4), suggesting that ions during this period were also influenced by atmospheric precipitation.
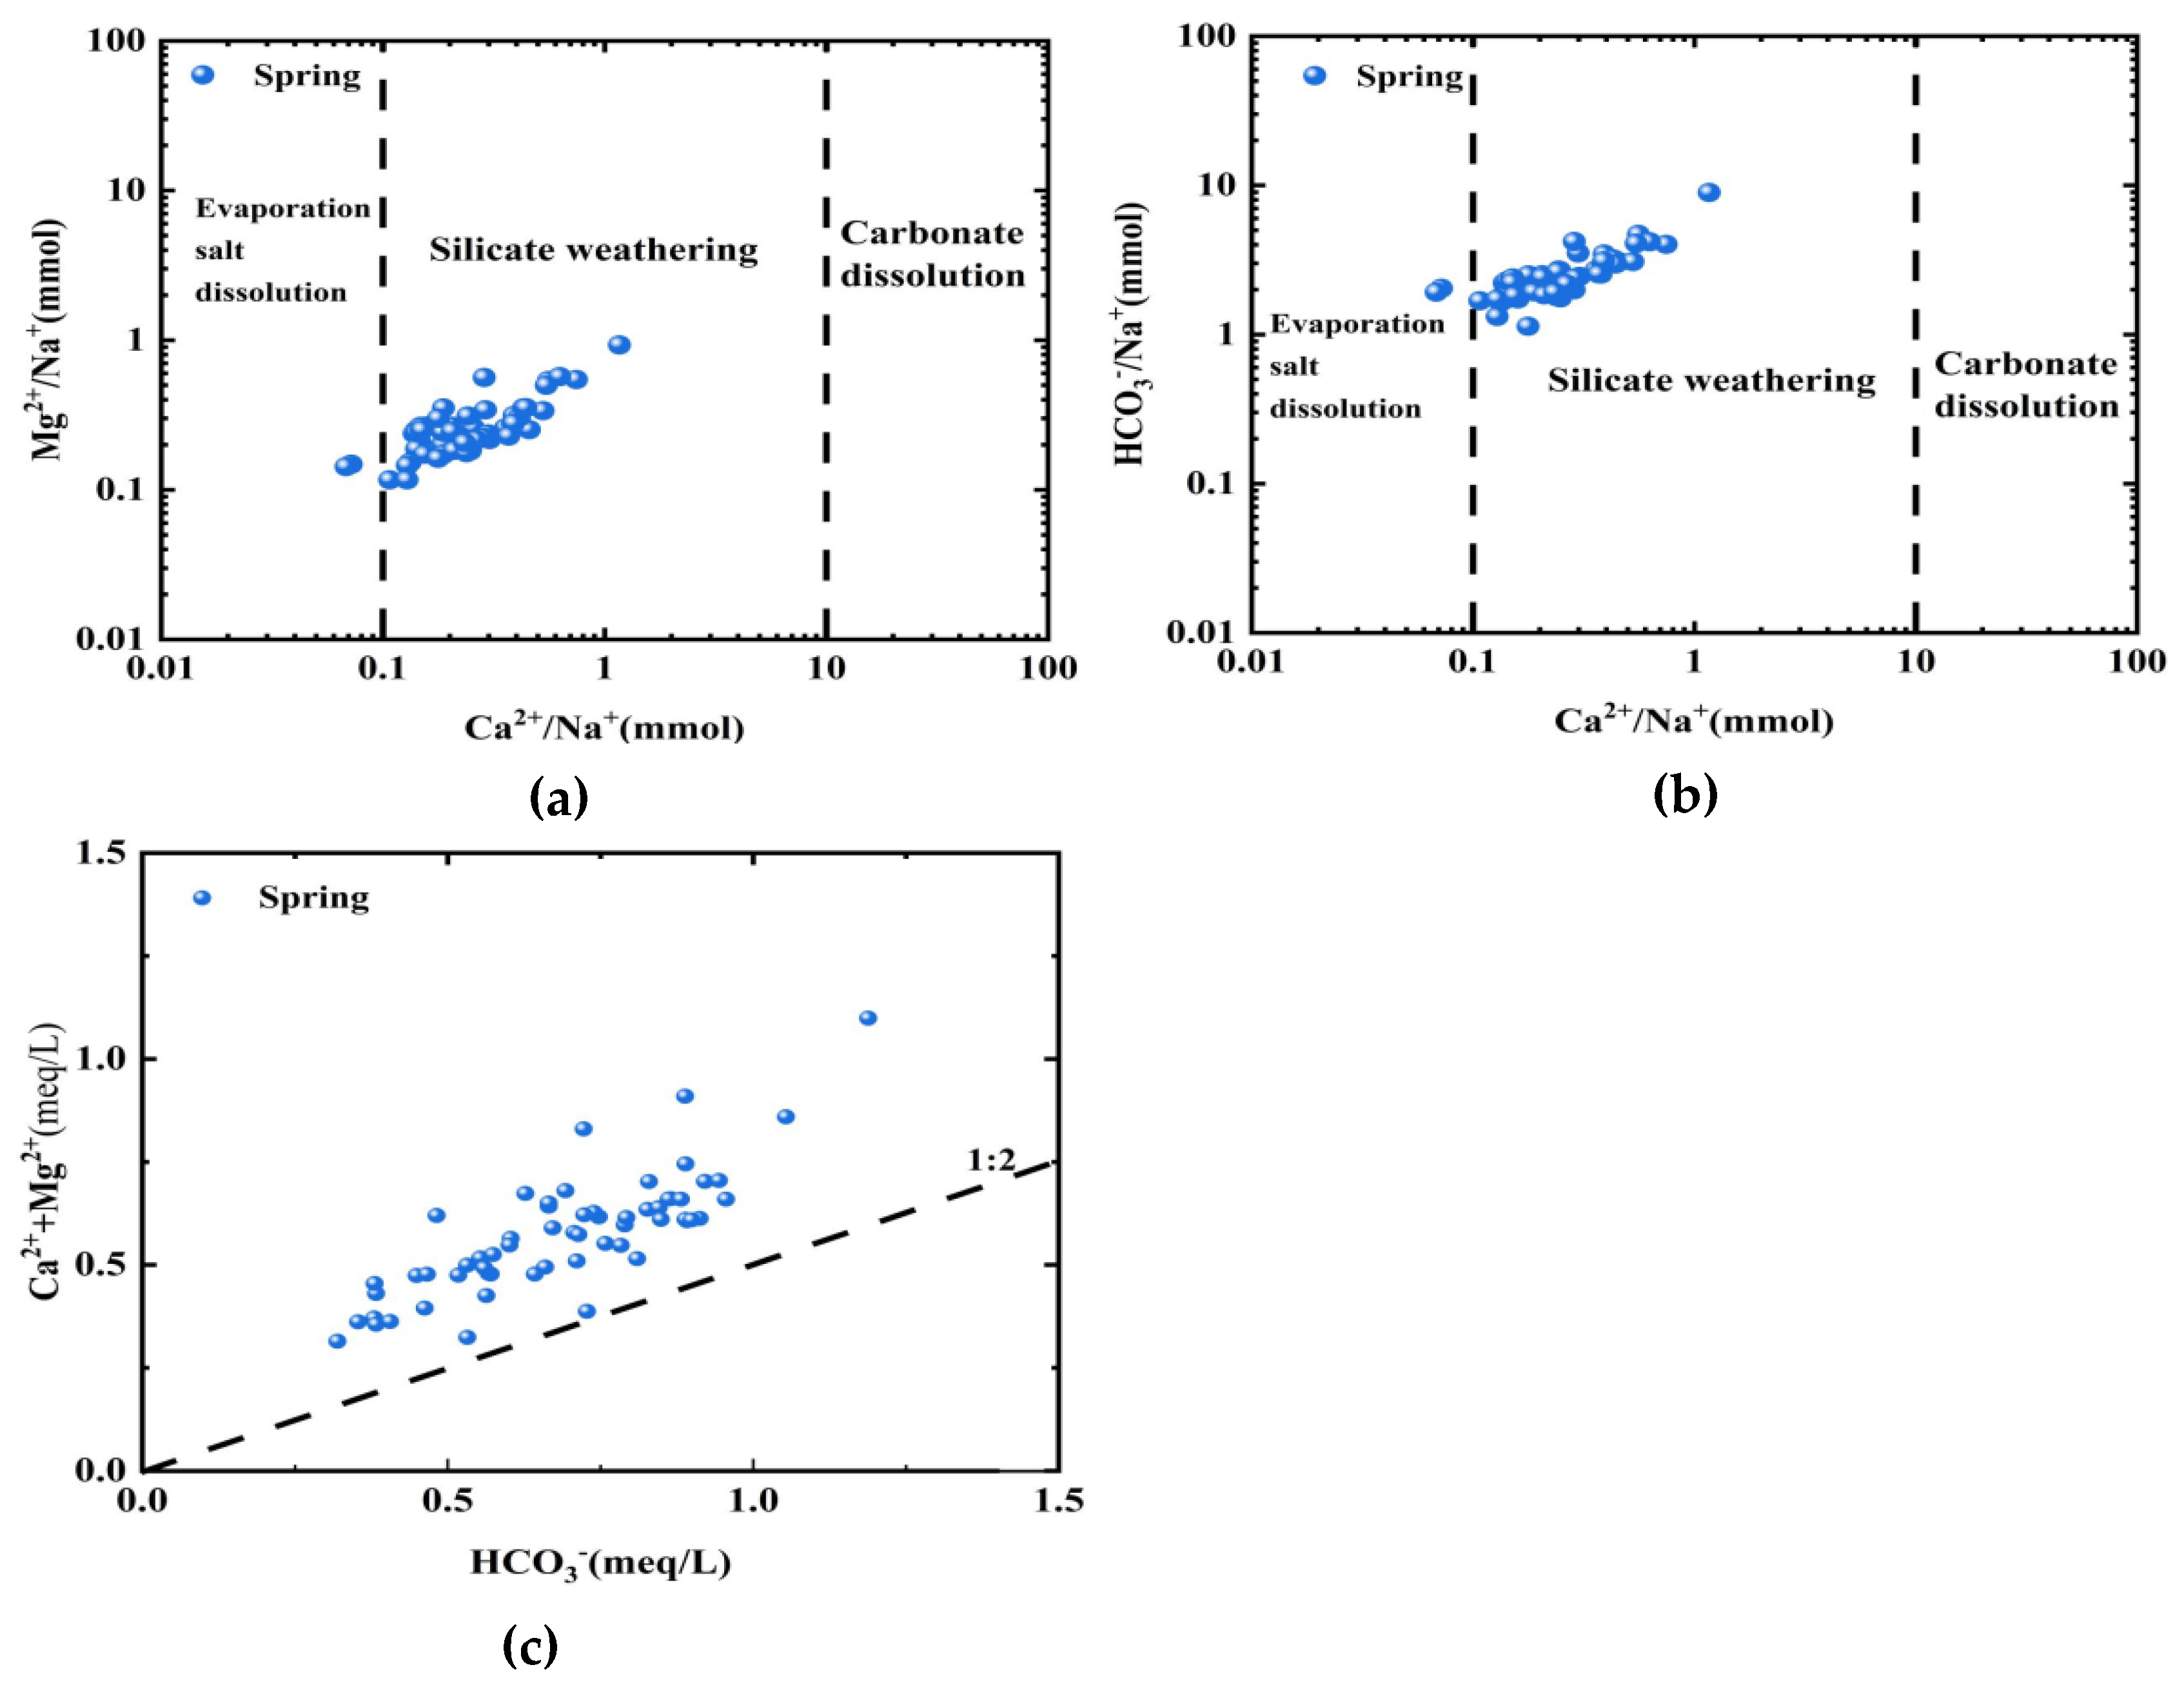
Considering the geological background, the study area is predominantly covered by potassium trachybasalt. The minerals present include feldspar, pyroxene, olivine, amphibole, and biotite. The hydrochemical characteristics of the spring water reflect the geochemical composition of the volcanic rocks. The Ca2+/Na+-HCO3/Na+ diagram and the Ca2+/Na+-Mg2+/Na+ diagram (Figure 6) suggest that the spring water is primarily influenced by silicate weathering, followed by carbonate dissolution. In most cases, the total molar equivalents of Ca2+ and Mg2+ did not exceed twice that of HCO3 (Figure 4), indicating that, in addition to silicate dissolution, Ca2+ and Mg2+ are the main sources.
The primary ions in the spring water (Ca2+, Mg2+, Na+, and K+) and SiO2 mainly originate from the leaching of silicate minerals. The main reactions are as follows:
NaAlSi3O8 + H+ + 9/2 H2O = Al2Si2O5(OH)4 + Na++ 2H4SiO4
CaAl2Si2O8 + 8H+= 2Al3+ + Ca2+ + 2H4SiO4
(Fe,Mg)SiO3 + 2H+ + H2O =(Fe,Mg)2+ + H4SiO4
(Fe,Mg)2SiO4 + 4H+ + O2 = 2(Fe,Mg)2+ + 4HCO3 + H4SiO4
2NaCa2Fe5Si4AlO222 + 30CO2 + 39H2O = Al2Si2O5(OH)4 + 2Na+ + 4Ca2+ + 10Fe2+ + 12H4SiO4 + 30HCO3
Thus, the presence of Mg2+ in the groundwater primarily stems from the dissolution of pyroxene and olivine minerals, while Na+ and Ca2+ mainly derive from the dissolution of plagioclase and amphibole. HCO3 primarily originates from the dissolution of silicate and aluminosilicate minerals. The elevated concentration of Mg2+ in certain spring waters indicates a high content of pyroxene and olivine minerals in the basalt of the region. Similarly, the increased Ca2+ concentration in some spring waters suggests high contents of plagioclase and amphibole, aligning with the lithology of volcanic rocks [23,24,25,26,27].
Scholler proposed the chloride-alkali index (CAI1 and CAI2) to reveal the ion exchange processes between groundwater and minerals through Equations (6) and (7):
CAI1 = [Cl − Na+ + K +]/Cl
CAI2 = [Cl − Na+ + K+]/(SO42− + HCO3 + CO32− + NO3)
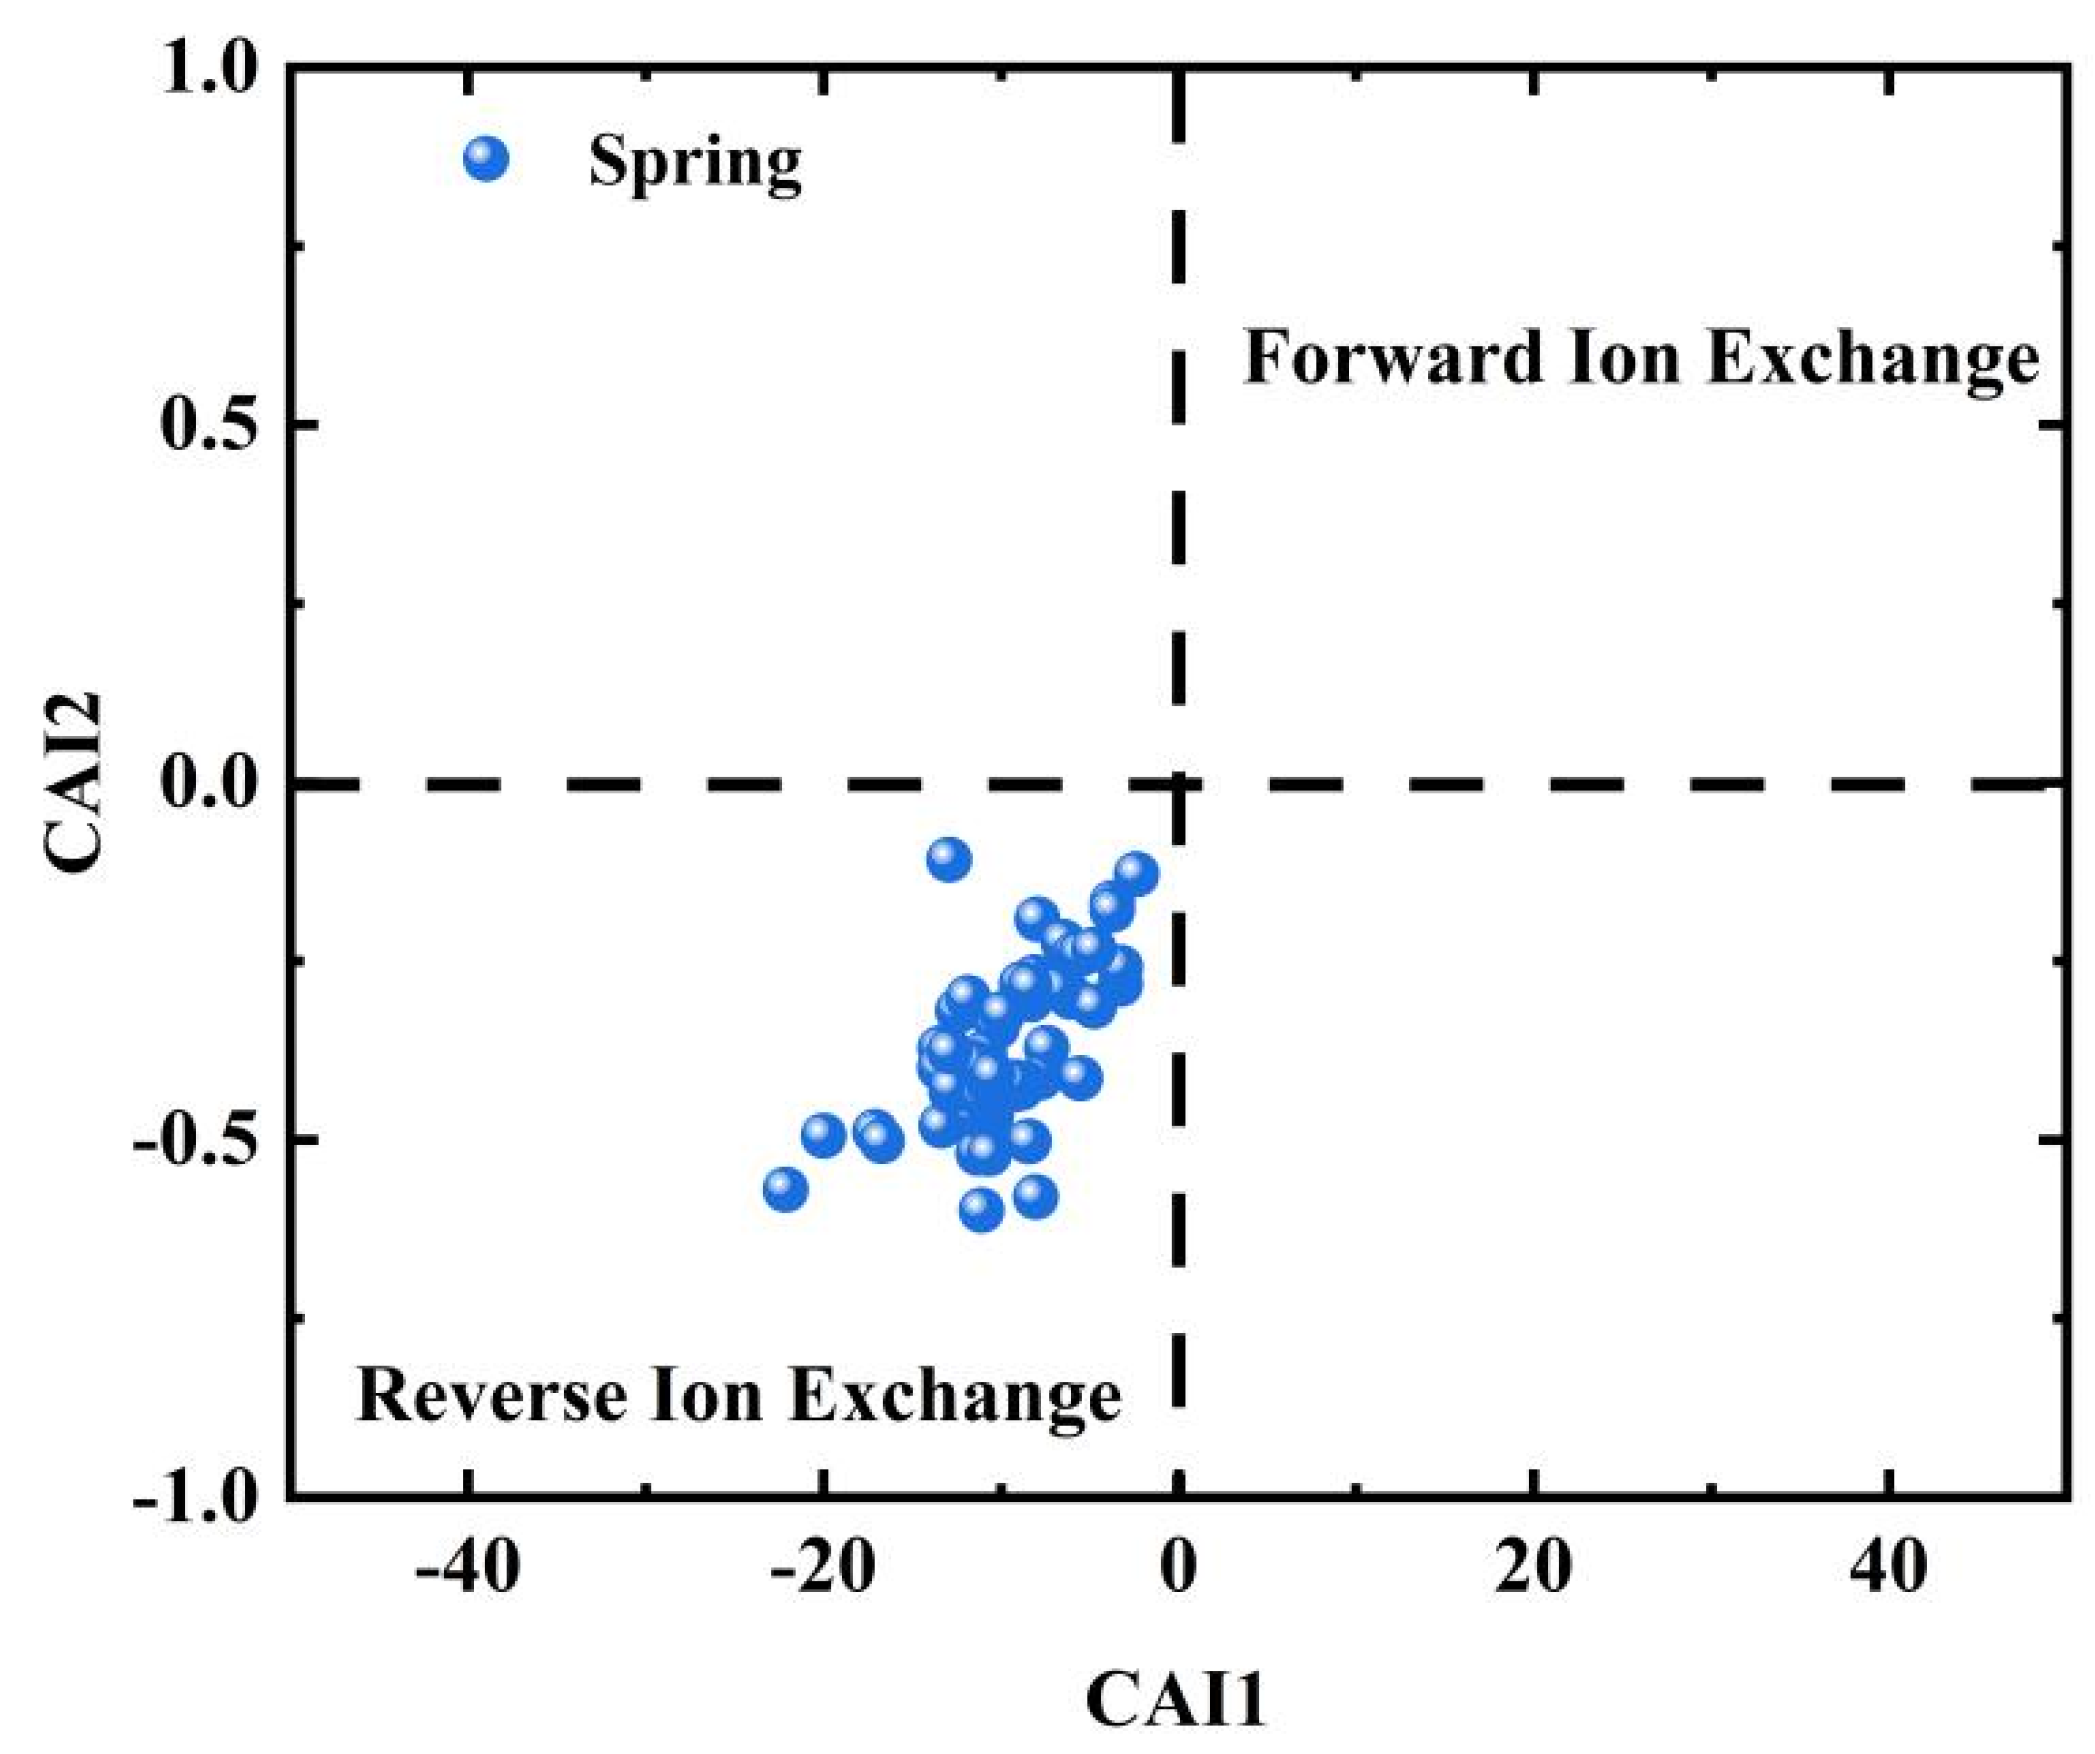
According to these indices, if the values of CAI1 and CAI2 are positive, ion exchange between Na+ and K+ occurs in the groundwater, with certain cations being adsorbed by the aquifer minerals, leading to changes in the chemical composition of the groundwater. This could result in reverse ion exchange processes involving ions such as Ca2+ and Mg2+. Conversely, negative CAI1 and CAI2 values indicate significant reverse ion exchange processes during groundwater mineralization, although the influence of forward ion exchange processes also exists [28,29].
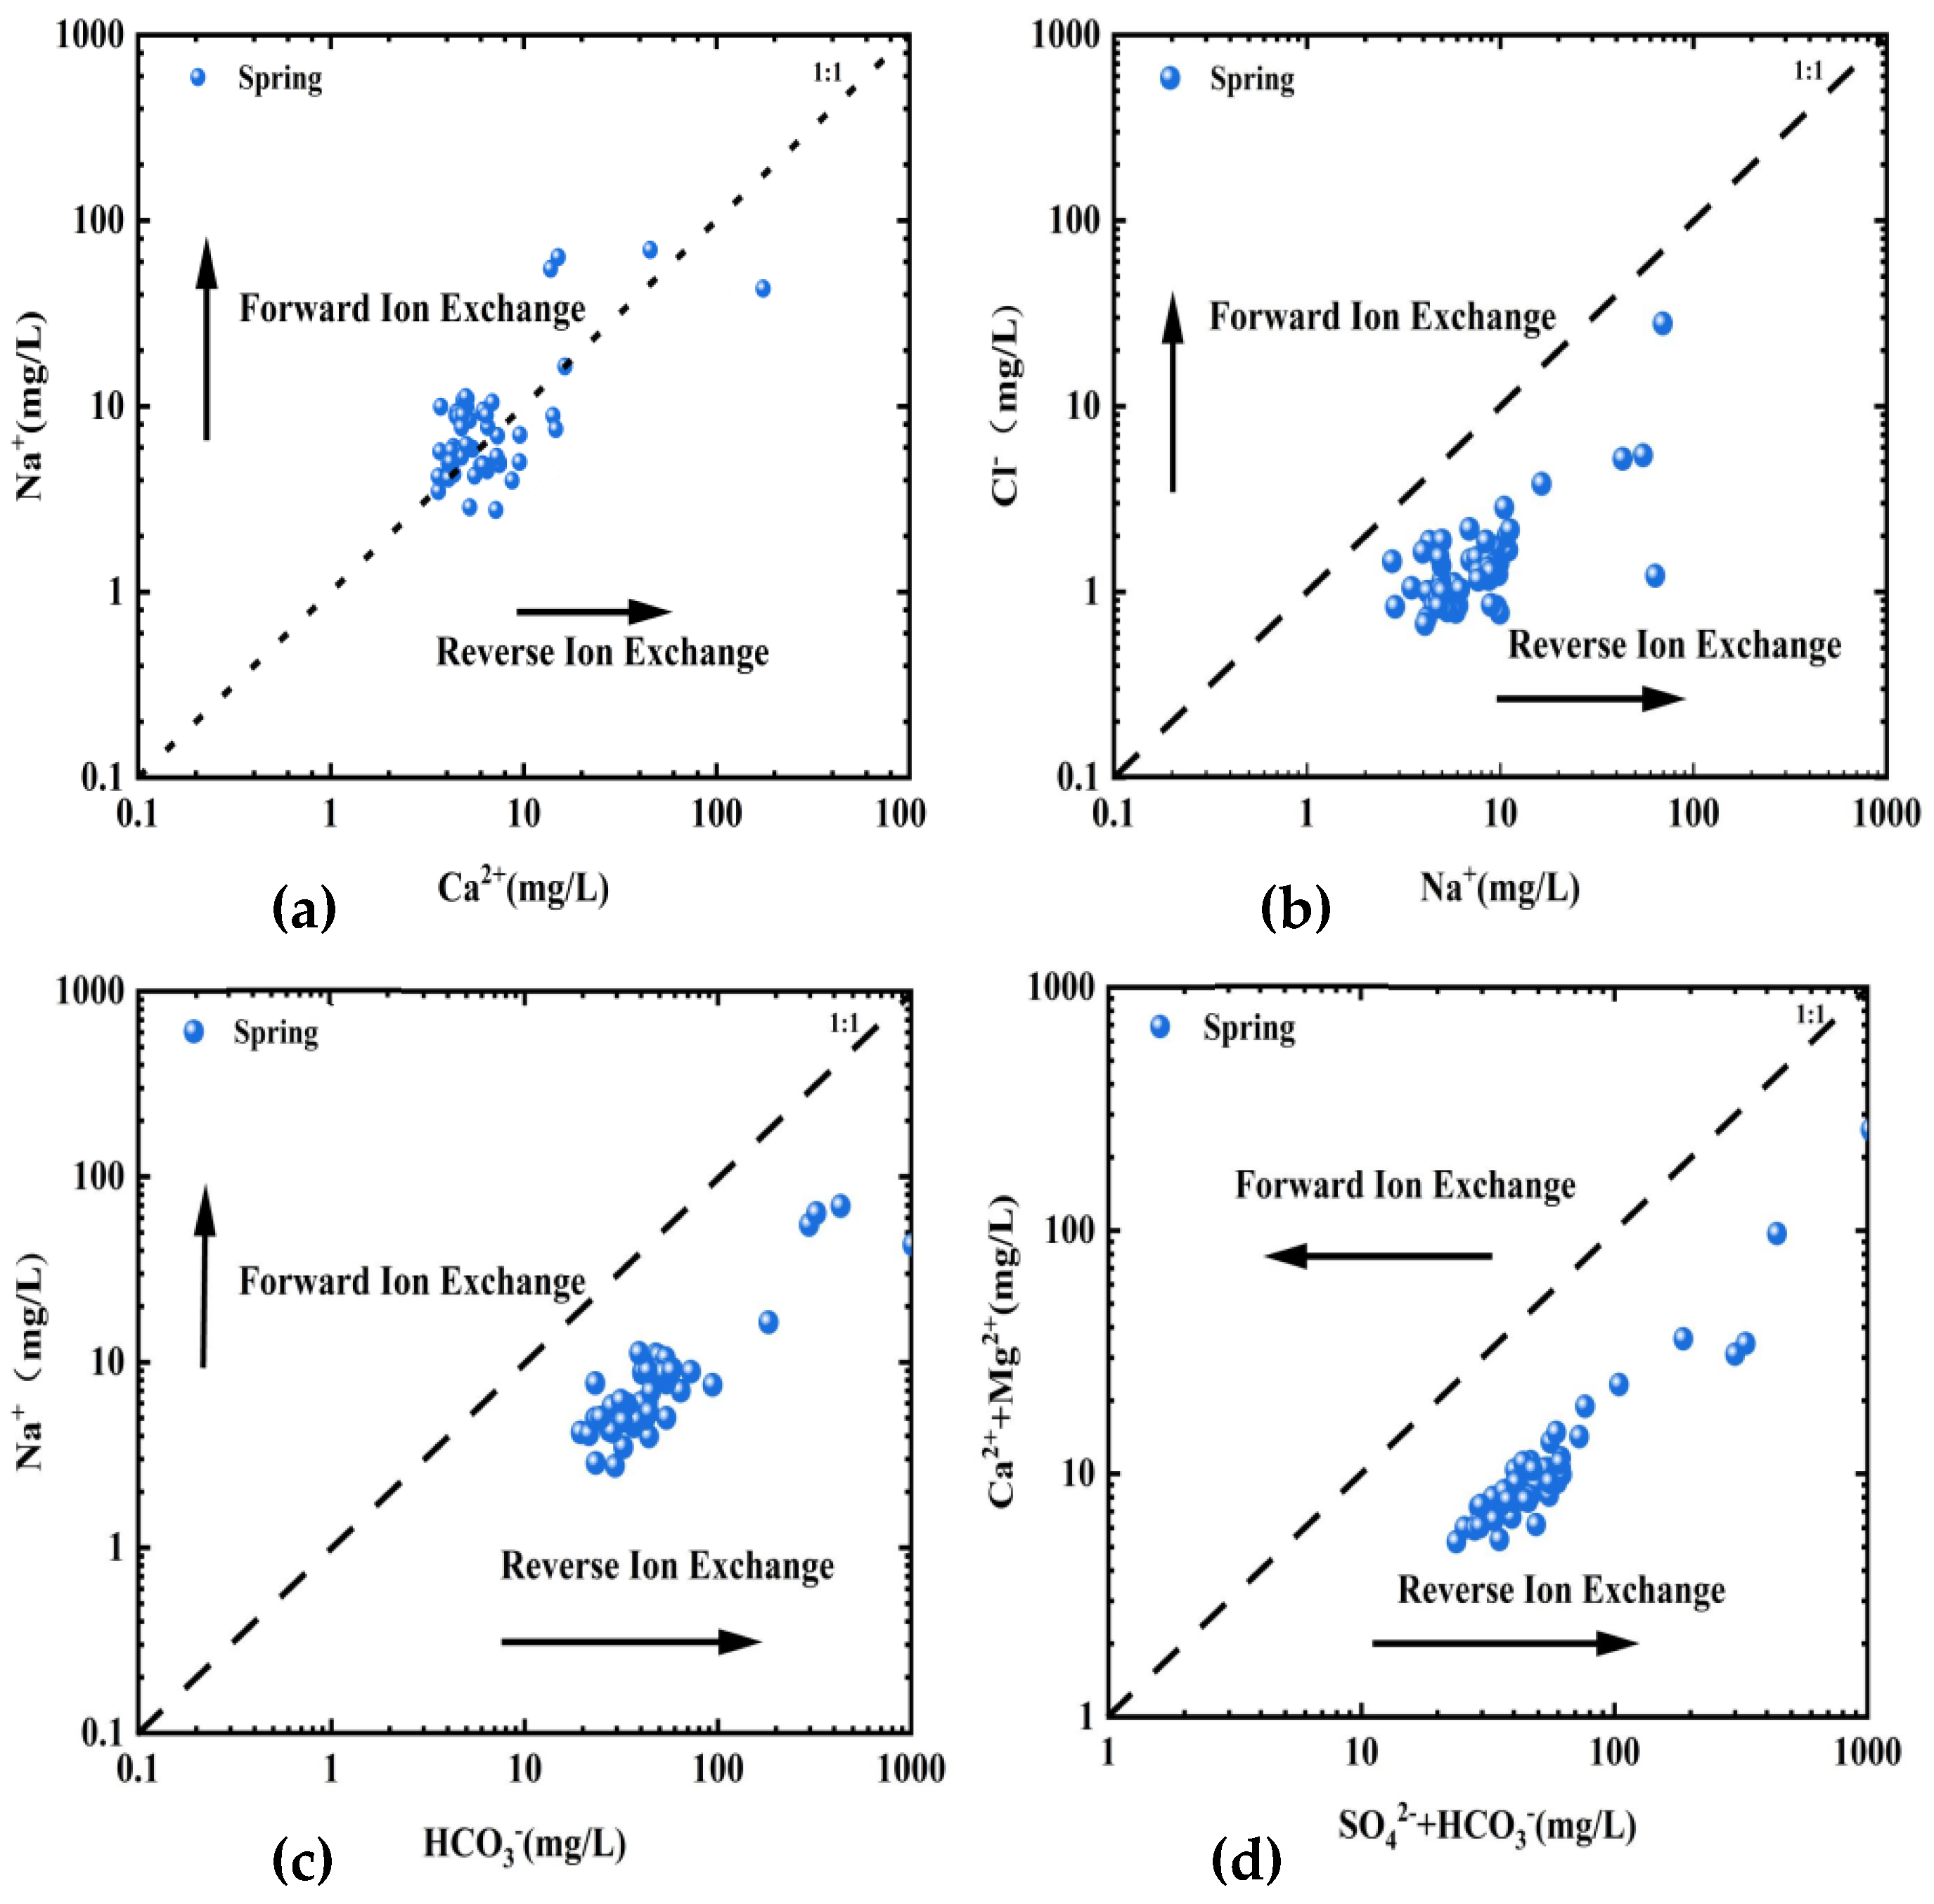
In this study, all 66 samples exhibited negative values for CAI-1 and CAI-2 (Figure 7), signifying the occurrence of reverse cation exchange in the groundwater of the study area. This implies that along the flow path, the concentrations of Na+ and K+ increase, while the concentrations of Ca2+ and Mg2+ decrease. The relatively large absolute values of CAI-1 and CAI-2 suggest that reverse ion exchange is more pronounced.
This indicates that in the groundwater, Ca2+ and Mg2+ increase as they are released from the minerals in the aquifer to compensate for the absorbed Na+ and K+. Conversely, in the aquifer rocks, the minerals primarily absorb Na+ and K+. This represents a fundamental process of reverse ion exchange in groundwater mineralization.
Water-rock interactions are among the most important processes affecting groundwater quality. This is illustrated by ion ratios such as Na+/Cl, Ca2+/Mg2+, Na+/(Na+ + Ca2+), Cl/total anions, and Mg2+/(Ca2+ + Mg2+), as well as Gibbs’s bivariate discrimination diagrams [22].
Insights into the effects of silicate mineral weathering and ion exchange processes can be gained through the Na+/Cl ratio. A Na+/Cl ratio exceeding 1 signifies an increase in sodium ion concentration due to calcium ion replacement during silicate mineral weathering. Sodium and calcium ions in groundwater can be attributed to the dissolution of silicate minerals such as anorthite (CaAl2Si2O8) and albite (NaAlSi3O8), as well as ion exchange during their dissolution processes:
2NaAlSiO3O + Ca2+ ↔ CaAlSiO3O + 2Na+
In the study area samples, all Cl/Na+ ratios were below 1 (refer to Figure 8). This suggests that the samples were primarily influenced by silicate mineral weathering, accompanied by sodium ion replacement during ion exchange, resulting from anorthite dissolution. A Cl/Na+ ratio below 1 is mainly associated with the prevalence of HCO3 ions, indicating mineral dissolution. When the ratios of Cl/total anions, Mg2+/(Ca2+ + Mg2+), and Na+/(Na+ + Ca2+) are below 1, silicate mineral dissolution is likely the primary process during water-rock interactions in the aquifer. All 66 study samples exhibited ratios below 1. In conjunction with the Gibbs diagram, this indicates a prevailing process of silicate mineral weathering in the region.
The aforementioned analysis consistently suggests that silicate mineral weathering has been the principal geological process controlling groundwater hydrochemistry in this area. Gibbs’s [22] water-rock interaction discrimination diagram corroborates the findings of the selected ratios. While the weathering of carbonate minerals may be less significant, it still influences groundwater mineralization in this region [30,31,32,33,34].

4.2.2. Correlation Analysis of Ion Sources

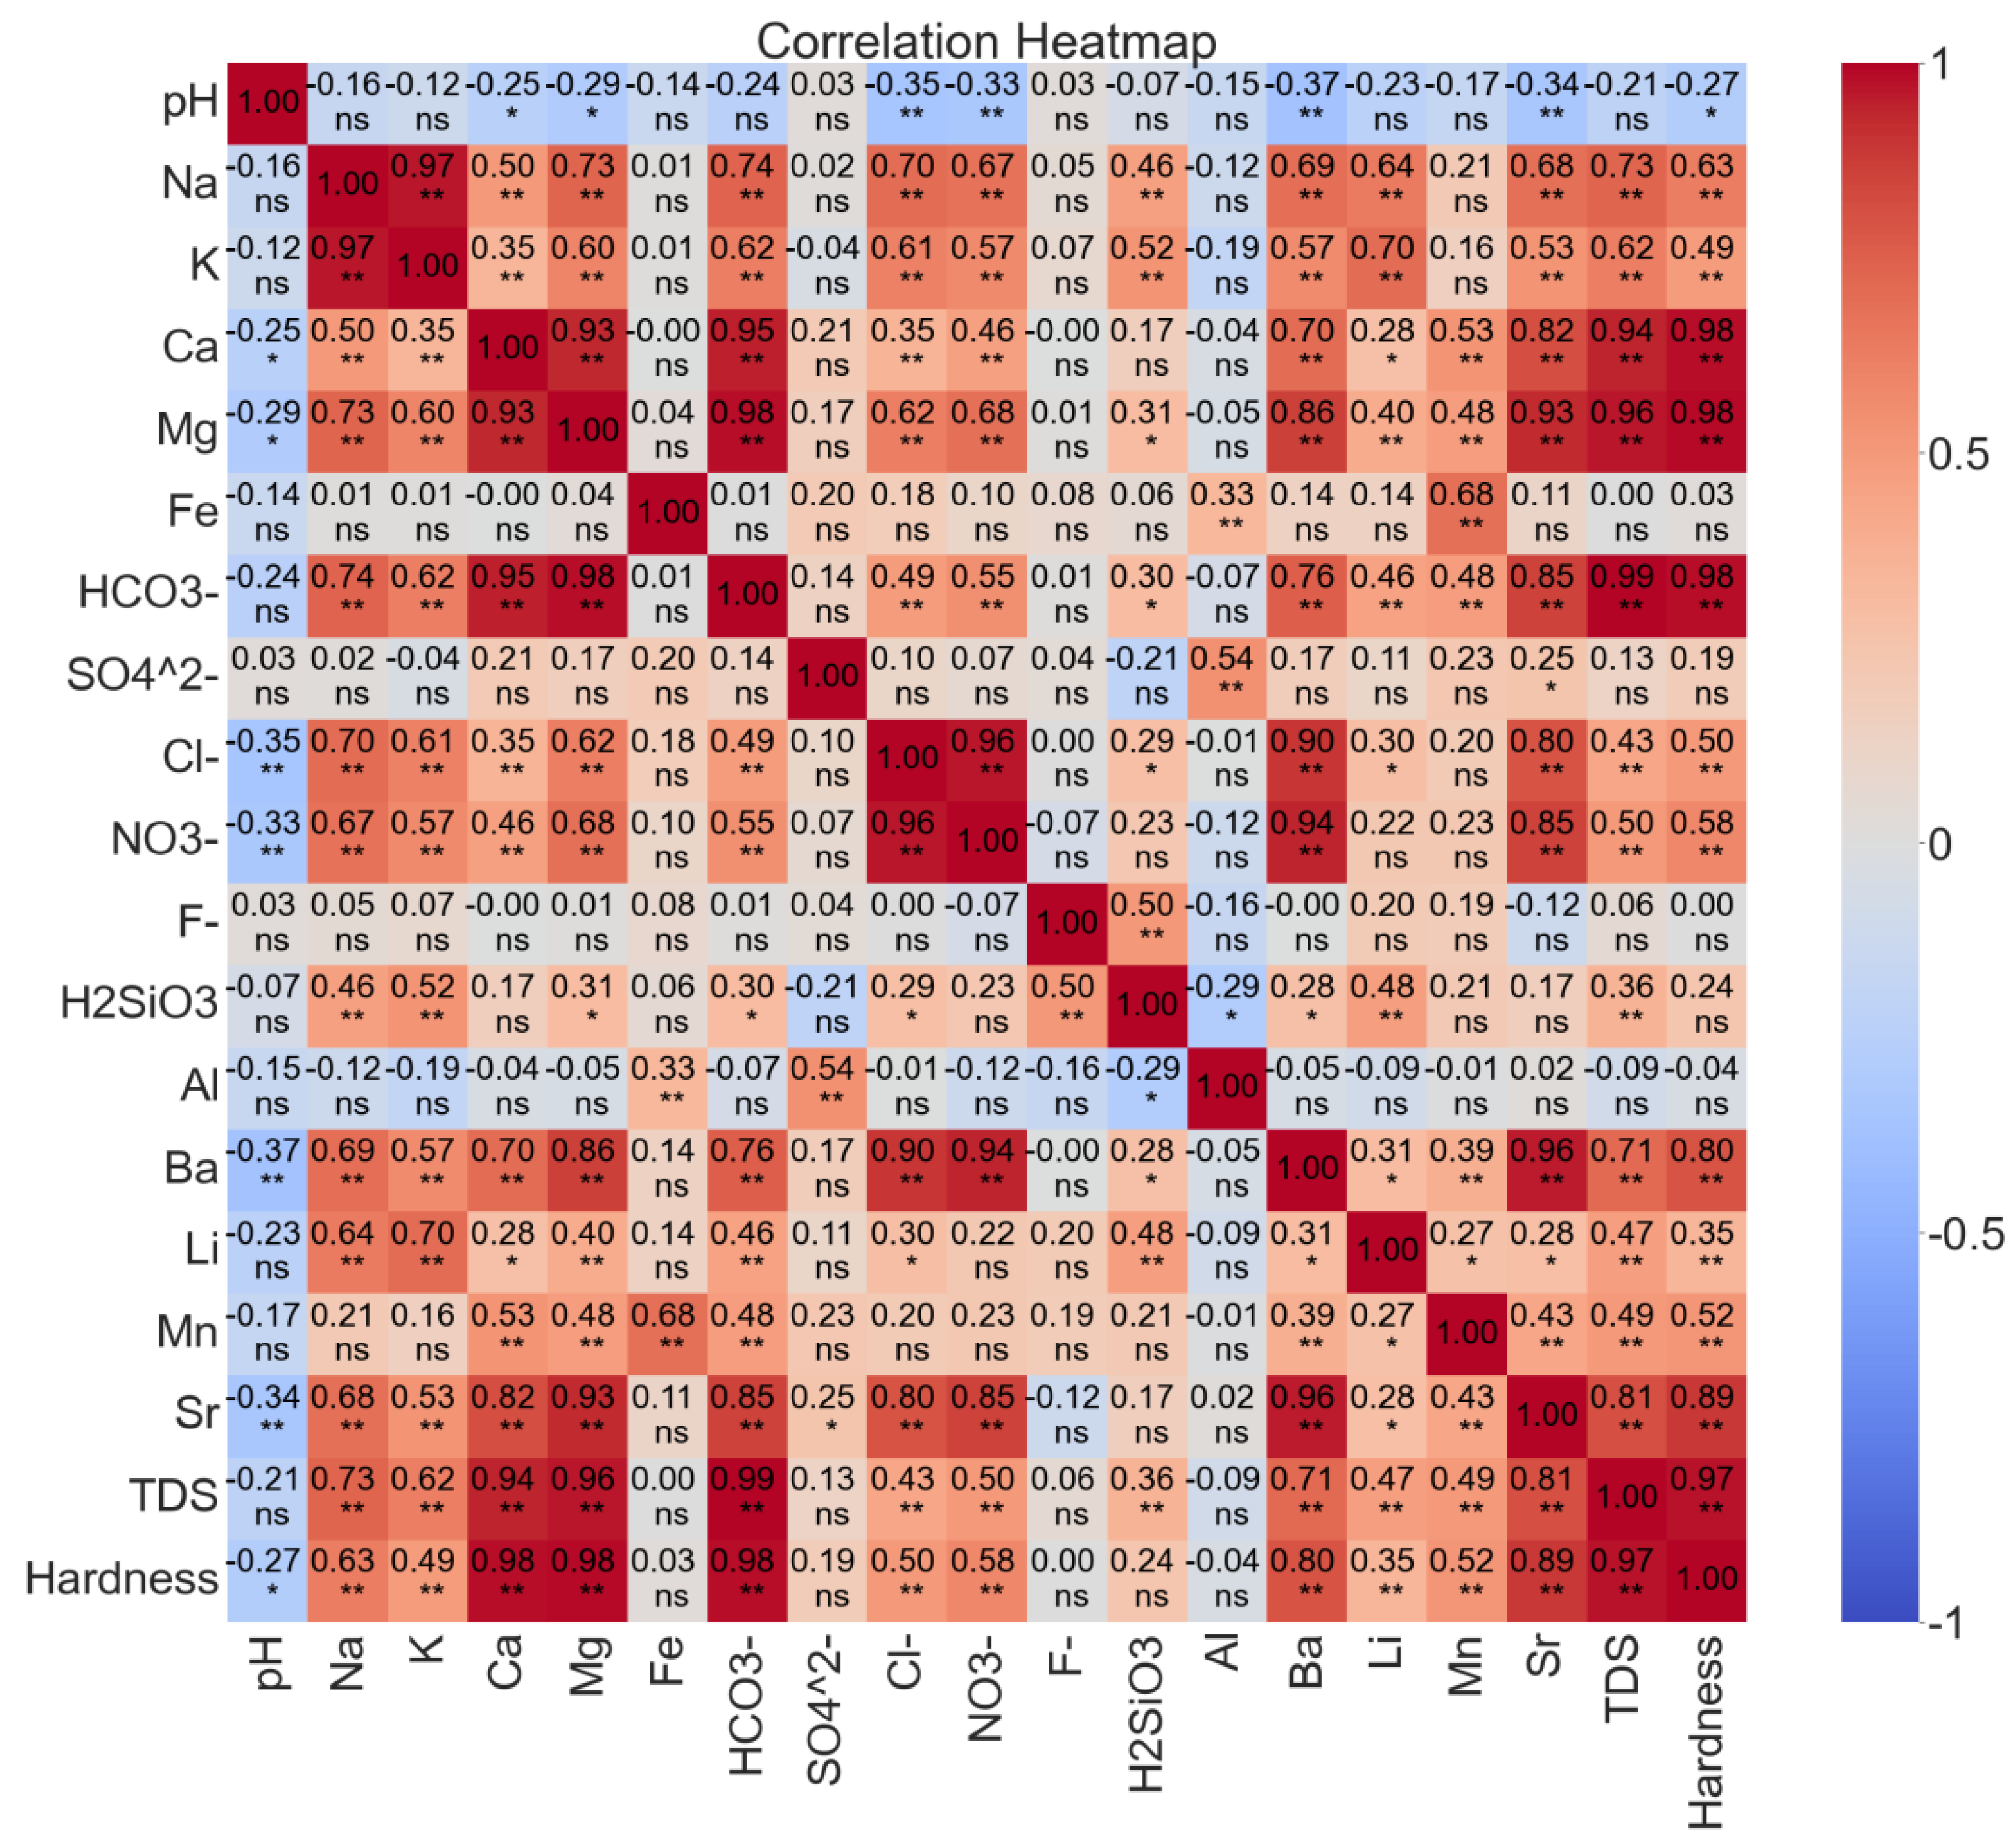
The concentrations and results of Pearson’s correlation analysis of the chemical components in the samples are depicted in Figure 9 and Table 1. The pH and major ions exhibited relatively stable variation, supporting the earlier observation of consistent presence of various major ions in groundwater. Regarding TDS, the primary components in the water samples display significant correlations with TDS, indicating continuous dissolution of these ions into the groundwater, thereby elevating TDS levels.
The correlation coefficients (r) between different hydrochemical components and their concentrations in the study area can illustrate the relationships among these components. Data analysis revealed slight pH variations, ranging from 7.3 to 8.3, indicating a relatively steady acid-base equilibrium. Major ion concentrations in the water, including Na+, K+, Ca2+, and Mg2+, varied from 2.76 to 69.4 mg/L, 0.70 to 14.2 mg/L, 3.62 to 175 mg/L, and 1.63 to 84.4 mg/L, respectively. Na+ and K+, as well as Ca2+ and Mg2+, exhibited strong correlations with each other (above 0.93), aligning with the earlier analyzed ion exchange processes. Cl and HCO3 also displayed high correlations with various cations, indicating closely associated sources and stability of major components in the water samples. This suggests that the formation and presence of major hydrochemical components are closely linked to the geological background of the study area. However, the weak correlation of SO42− indicates a more intricate source, potentially influenced by increased precipitation and frequency of groundwater and surface water exchange. This phenomenon is particularly noticeable at Xianren Spring, where the tourist season leads to a significant rise in population and human impact. TDS exhibited positive correlations with Ca2+ (0.94), Mg2+ (0.96), Na+ (0.73), K+ (0.62), and HCO3 (0.99), indicating the intimate relationship between dissolved mineral concentrations and TDS. Hardness was primarily governed by the concentrations of Ca2+ (0.98) and Mg2+ (0.98). While Ca2+ and Mg2+ are crucial components of TDS, HCO3 predominantly influenced TDS values in this study.
In summary, the impacts of human activities, increased precipitation, and increased frequency of groundwater and surface water exchange during the sampling period indirectly affirm that the sources of these ions are related or similar, such as mineral dissolution and silicate weathering dissolution.

4.2.3. Inverse Hydrogeochemical Modeling Analysis

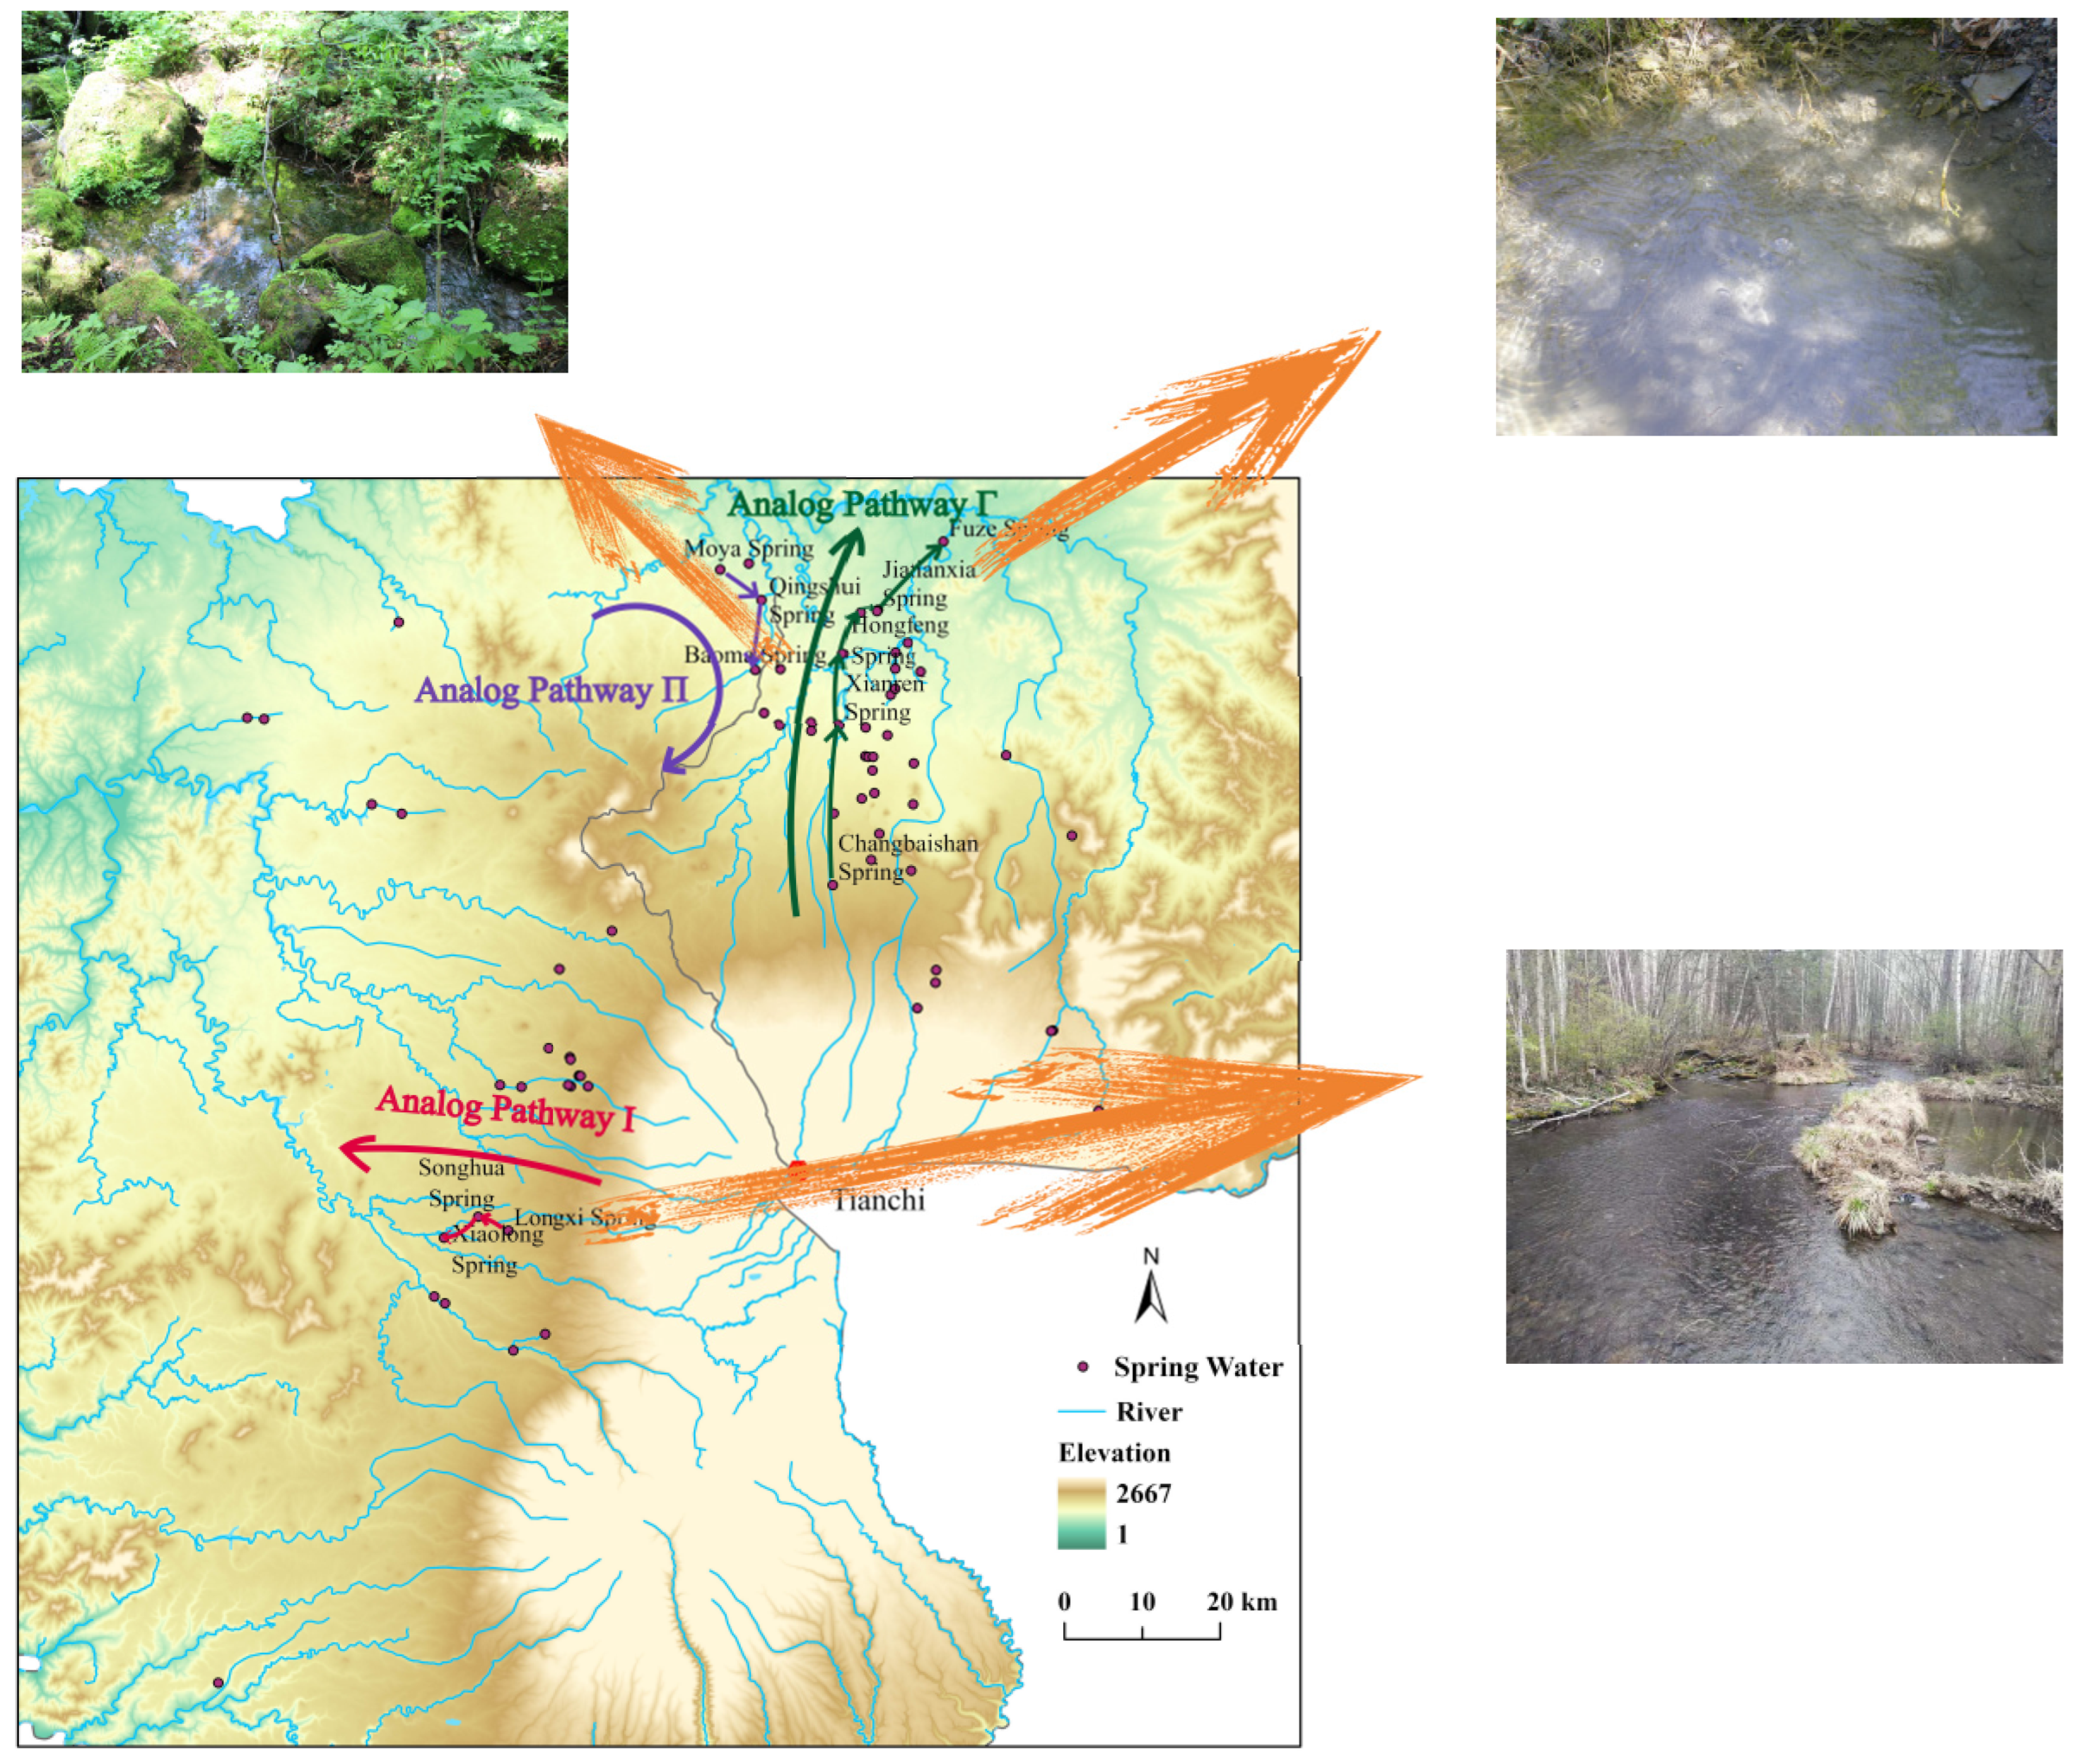
Through the analysis of the hydrochemical parameters of the spring water in the study area, we have preliminarily determined the overall characteristics of the hydrochemical parameters of the water sources. To better study the formation processes of the hydrochemical components, we utilized PHREEQC simulation software. Three typical paths were selected along the groundwater flow direction for inverse hydrogeochemical modeling (as shown in Figure 10).
The selection of simulation paths must adhere to the principle that both the starting and ending points lie on the same water flow path to ensure meaningful results. A total of 16 analysis indicators were considered, including Ca2+, Mg2+, Na+, Cl, SO42−, K+, TDS, and metasilicic acid.
Examining the results for each path (as depicted in Figure 10), it is apparent that the pH values of all spring water samples along the routes ranges from neutral to slightly alkaline, with some points displaying characteristics of alkaline water, typical for regions with carbonate rocks.And we analyze it in combination with the simulation data in Table 2. The pH variance from 7.6 to 8.4 reflects varied degrees of carbonate rock dissolution, releasing Ca2+ and Mg2+ into the water while absorbing CO2 to form HCO3, thereby explaining the prevalence of HCO3 as the primary anion. For instance, Xiao Long Spring exhibits lower Na+ and K+ concentrations but higher Ca2+ and Mg2+ concentrations. The Longxi Spring sample indicates alkaline water quality with a pH of 8.1. The cation and anion concentrations in these springs significantly surpassed those in other samples along their respective paths, particularly for Na+ and Mg2+. The metasilicic acid concentration also notably rose, reaching 47.00 mg/L. In Qingshui Spring, the metasilicic acid concentration reached 82.40 mg/L, and in Fuze Spring, it reached 73.60 mg/L. This suggests that while carbonate rock dissolution predominantly influences water chemistry, silicate minerals also play a pivotal role in waterrock interactions.
The presence of fluoride further signifies groundwaterrock interactions, such as fluoride dissolution from natural rocks. The F concentration in the paths ranges from 0.12 to 0.84 mg/L. Although metal ion concentrations (e.g., Fe, Mn, and Sr) were relatively low, their presence indicates specific mineral dissolution or precipitation processes. Fe and Mn sources are linked to changes in redox conditions, while Sr concentration alterations are directly associated with carbonate minerals’ dissolution or precipitation. The presence of Al implies the dissolution or formation of clay minerals [35,36,37,38,39,40,41,42].
The mineral saturation index (SI) indicates the saturation levels of various minerals in spring waters. Calcite typically shows negative SI values, implying undersaturation in these waters, thus maintaining high concentrations of Ca2+ and HCO3. Quartz SI values are mostly close to or slightly positive, suggesting near saturation or slight oversaturation, potentially maintaining high SiO2 concentrations. Gypsum SI values tend to be negative, indicating undersaturation, implying that SO42− primarily comes from other sulfate minerals’ dissolution or human activities. A positive SI value for quartz in Qingshui Spring suggests possible saturation or oversaturation, explaining the high concentration of metasilicic acid. Positive SI values, like albite in Xianren Spring, indicate possible saturation or oversaturation of certain silicate minerals, reflecting dynamic dissolution and precipitation during water-rock interactions.
Analyzing waterrock interactions along the routes indicates that carbonate rock dissolution is a prevalent process, significantly affecting Ca2+, Mg2+, and HCO3 concentrations. The relatively high SiO2 concentrations suggest that silicate mineral weathering, like quartz, is also important and related to rock type and weathering degree, supporting the high metasilicic acid content. SO42− sources are complex; for instance, the negative gypsum saturation index in Xiaolong Spring, despite high SO42− concentrations, suggests contributions from sulfate mineral dissolution and human activities. Gypsum undersaturation indicates other sources of SO42−, such as surface runoff.
Spatially, alterations in the main ion concentrations along the spring water routes depict the chemical transformation of groundwater during its flow. This transformation correlates with the diverse rock types and degrees of water-rock interaction encountered along the path. For instance, fluctuations in Ca2+ and Mg2+ concentrations signify inputs from carbonate rock dissolution, while variations in Na+ and K+ concentrations may stem from silicate mineral weathering. The disparities in mineral saturation indices (SIs) among different spring water samples, especially for minerals like calcite, quartz, and gypsum, underscore the complexity of groundwater-rock interactions. The undersaturation of calcite points to a source of elevated Ca2+ and HCO3 concentrations in the water, whereas the near-saturation or slight oversaturation of quartz suggests that metasilicic acid remains abundant due to silicate mineral dissolution.
Considering the geological context of the study area, volcanic rocks are widespread, profoundly influencing groundwater chemistry due to their distinctive chemical and physical attributes. These rocks typically harbor silicate minerals like quartz, consistent with our findings indicating their general saturation or near-saturation. Moreover, volcanic regions often exhibit increased geothermal activity, accelerating the dissolution of minerals such as calcite and dolomite. The breakdown of volcanic rocks releases ample calcium and magnesium ions, explaining why calcite and dolomite tend to be undersaturated in most springs. As groundwater traverses these rock formations, the elevated temperature and pressure foster mineral dissolution. In our study area, groundwater flow likely encounters sulfate minerals like gypsum, whose pronounced dissolution potential (as indicated by our data) arises from the oxidation of sulfur compounds emitted by volcanic activity. And combined with the process of atmospheric precipitation and surface water infiltration into the basalt aquifer, chemical reactions with mineral components in the surrounding rock (including calcite, dolomite, CO2(g), gypsum, fluorite, sodium feldspar, illite, kaolinite, strontium rhodochrosite, and rock salts), as well as cation-exchange, and under the joint action of evaporation and concentration factors, the unique water chemistry components of the area are formed. The dissolution of fluorite and strontium rhodochrosite increases the concentration of F and Sr2+, and the metasilicic acid, which is typical of the mineral water in this area, is mainly derived from the dissolution of feldspar and illite in basalt.
Adhering to the principles of inverse hydrogeochemical modeling and selecting paths with both starting and ending points on the same water flow path enable precise analysis of groundwater chemical evolution. This approach ensures the validity of results, reflecting the genuine hydrogeochemical processes occurring along groundwater flow paths [41,42,43,44,45,46,47].

4.3. Validation Analysis Using Unsupervised Machine Learning

In this investigation, we initially applied conventional hydrogeochemical methods to examine the characteristics and origins of hydrochemical types within the study area. To deepen our analysis and enhance accuracy, we integrated the outcomes of unsupervised machine learning techniques, including self-organizing maps (SOMs), principal component analysis (PCA), and K-means clustering, to systematically process the raw hydrochemical data comprehensively. This approach was further enriched by considering the detailed geological context of the study area.
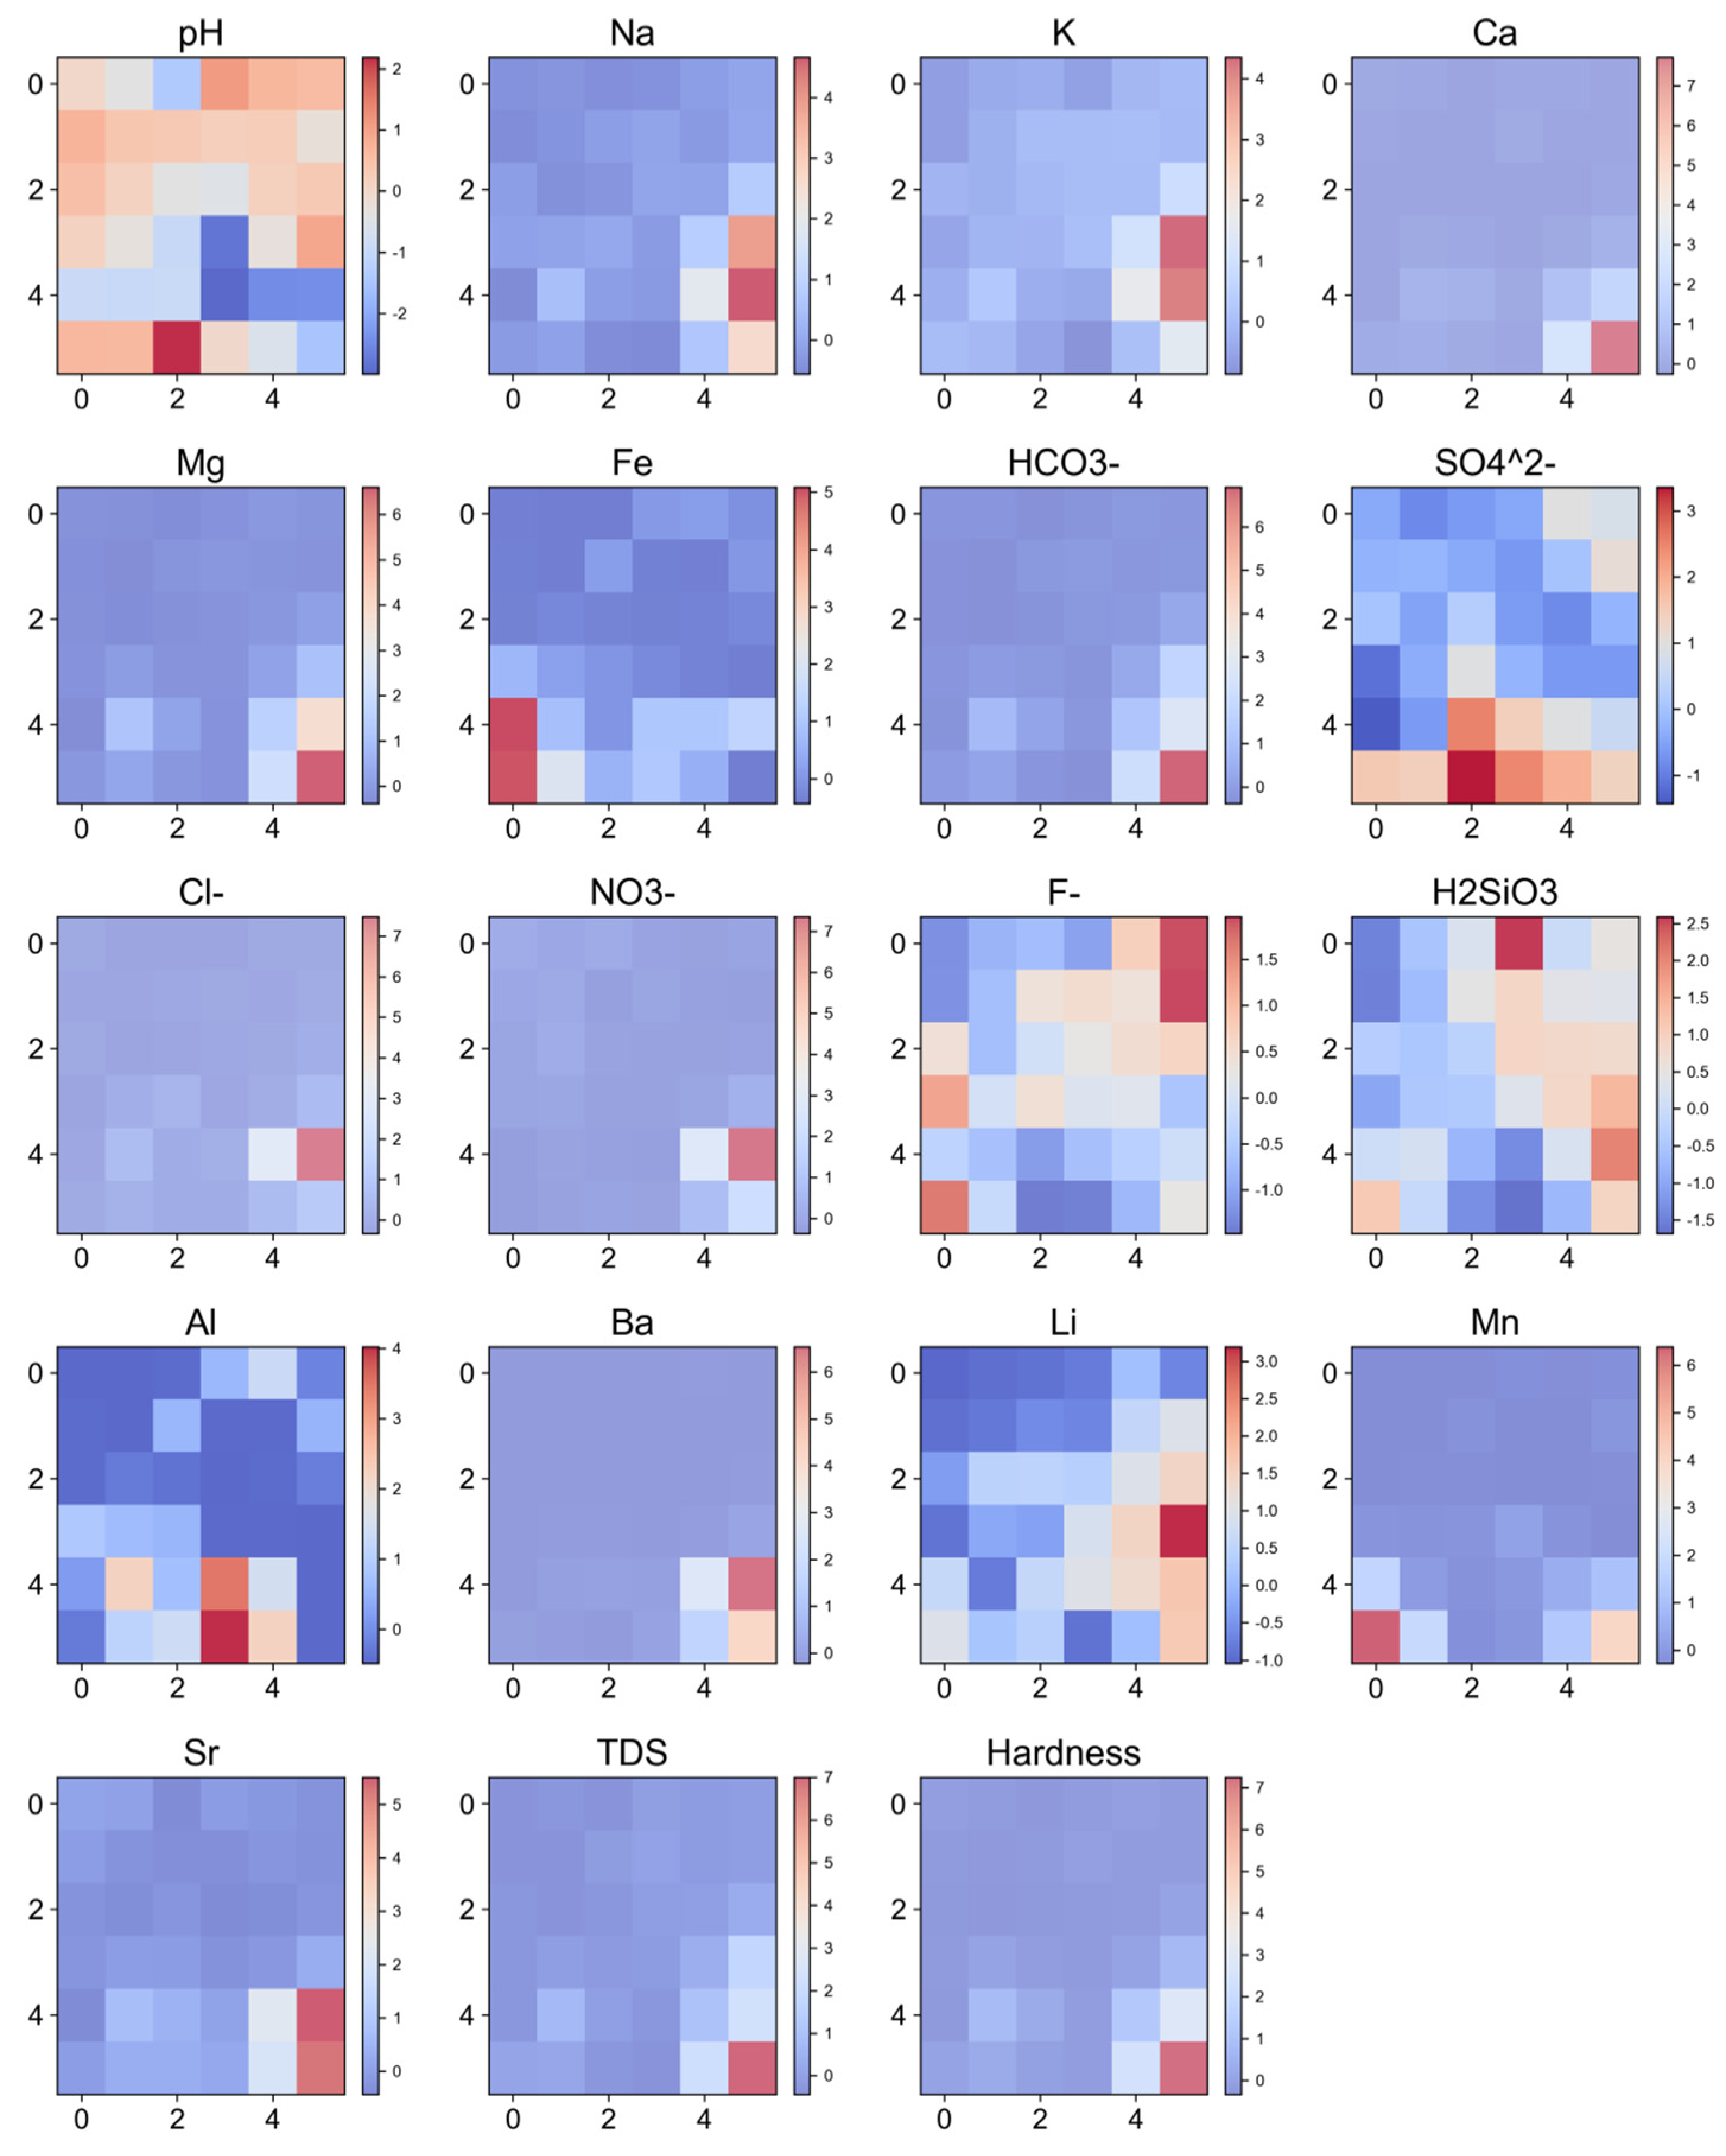
Firstly, a detailed scrutiny of the SOM node distribution unveiled that the clustering of water samples can offer insights into the spatial distribution of various water sources or hydrochemical processes. The SOM component plane (Figure 11) illustrated the distribution of diverse water quality parameters, such as pH, ion concentration, total dissolved solids (TDS), and hardness after standardization. Examination of these component planes unveiled stable clustering patterns of hydrochemical parameters, closely linked to regional lithology and waterrock interactions. These patterns align with the geological backdrop and seasonal hydrological cycles [25].
The clustering of Na+ and Ca2+ ions pointed towards interactions between ions and regional rock types. In particular, in areas dominated by basalt and carbonate rock dissolution processes, Na+ concentrations tend to be higher in basalt regions (location 6,5), reflecting the slower dissolution rate of silicate minerals. Elevated Ca2+ and Mg2+ concentrations in carbonate rock areas, especially at locations 6,4, and 6,5, underscore the dissolution of carbonate minerals like calcite and dolomite. This underscores the mixing and diffusion of dissolved substances from various rock types. Additionally, TDS levels exhibited a positive correlation with calcium and magnesium concentrations in carbonate rock areas, with locations 6,6, 6,5, 5,6, and 5,5 indicating their primary influence on TDS. The distribution of SO42− reflects a complex interplay of sulfur sources, including natural sulfide oxidation and anthropogenic activities. Patterns in Fe and Mn distribution are linked to the natural abundance of these elements in the underlying rocks and soils, particularly at specific locations. High fluoride concentrations in natural geothermal regions, potentially stemming from mineral dissolution during geothermal activities (location 4,6), were observed. Elevated bicarbonate (HCO3) levels at certain locations suggest accelerated dissolution of carbonate rocks, enhancing water’s buffering capacity. Lastly, the consistent distribution of pH values highlights the acidbase equilibrium of water under normal conditions [48,49,50,51,52,53,54,55,56].For the detailed data after processing, please see Table 3.
Self–organizing map (SOM) plots are valuable for identifying and visualizing changes in hydrochemical parameters over two distinct time periods. After data processing and SOM application, an in-depth analysis of the groundwater hydrochemical data in the study area was conducted using principal component analysis (PCA) and K-means clustering methods (Table 4).
The PCA revealed the main sources of variation in the groundwater hydrochemical data. The first principal component (PC1) represented 48.15% of the variance and showed a positive correlation with hardness, total dissolved solids (TDS), and major cations and anions (such as Ca2+, Mg2+, SO42−, and HCO3). This suggests that the concentrations of these chemical constituents in groundwater are likely primarily influenced by the weathering processes of bedrock. The second principal component (PC2), linked to Al and SO42−, is primarily associated with complex mineral sources, which are correlated with the hydrogeological background and natural factors such as precipitation and frequent exchanges between groundwater and surface water. The third principal component (PC3) indicated agricultural pollutants (e.g., NO3), which are largely associated with anthropogenic activities and may also reflect trace elements from the geological background (such as Li and Sr) (Table 4).
The K-means clustering analysis divided the samples into three distinct clusters, comprising 29, 2, and 35 samples. By integrating the results of PCA, K-means, and SOM analyses with the regional geological background, the following conclusions can be drawn: Cluster 0 likely represents groundwater samples less influenced by basaltic geological processes, showing relatively minor chemical variations. Cluster 1 exhibits characteristics of intense igneous rock weathering, likely due to extensive interactions between groundwater and basaltic rocks rich in carbonates and sulfates. Cluster 2 samples seem to be affected by other geological processes or anthropogenic factors, such as agricultural pollution, or are associated with a specific geological background (Table 5) [56,57,58,59,60].
The findings suggest that bedrock weathering remains the main driver of variation in groundwater hydrochemical composition. This observation is supported by the effects of natural factors like atmospheric precipitation, which also contribute to alterations in water chemistry. Moreover, the impact of agricultural pollutants becomes more pronounced in such extreme environmental conditions. Through the comprehensive application of SOM, PCA, and K-means clustering methods, this study thoroughly examined groundwater hydrochemical data, affirming the significant influence of both geological processes and human activities on groundwater hydrochemical characteristics. Furthermore, this study validated the accuracy of traditional hydrogeochemical methods and PHREEQC simulations for hydrogeochemical analysis in the Changbai Mountain region [60,61,62,63]. The data visualization after som, pca and k processing is shown in Figure 12.

5. Conclusions

1. Hydrochemical Characteristics: Groundwater in the area tends to be predominantly neutral to slightly alkaline, with low mineralization and an average TDS value of 155.08 mg/L. Bicarbonate (HCO3) emerges as the dominant anion, while calcium (Ca2+) and magnesium (Mg2+) stand out as the principal cations. Identified hydrochemical types include HCO3-Ca·Mg, HCO3-Ca·Na·Mg, HCO3-Mg·Na, and HCO3-Na·Mg. With an average metasilicic acid content of 49.13 mg/L, the water qualifies as high metasilicic acid mineral water.
2. Formation Mechanisms: Analysis via the Gibbs diagram points towards rock weathering as the primary influencer of groundwater chemistry, with silicate mineral weathering emerging as the dominant geological process in the region. Secondary impacts include carbonate dissolution. The primary waterrock interactions involve volcanic mineral dissolution and cation exchange adsorption. Correlation analysis of groundwater hydrochemical indices highlights a significant positive correlation among Ca2+, Mg2+, HCO3, and TDS, signifying these components as key constituents of regional mineral water. The correlation coefficient between HCO3 and TDS reaches as high as 0.99, emphasizing the substantial influence of HCO3 concentration on TDS, followed by Mg and Ca contents. Notably, there exists a strong correlation between HCO3 and Ca2+ and Mg2+.
3. Inverse Geochemical Modeling: Employing inverse hydrogeochemical modeling alongside the geological backdrop characterized by widespread volcanic lithology, this study examined reactions involving minerals like calcite, dolomite, gypsum, and fluorite. This analysis, complemented by previous ion exchange studies, unveils the complexity of actual groundwater reactions, influenced by both water–rock interactions and external factors such as evaporation and precipitation. The principal components in the water samples stem from silicates, carbonates, sulfates, and certain clay materials.
4. Unsupervised Machine Learning Analysis: The study area’s hydrochemical characteristics and origins were analyzed through the integration of SOM, PCA, and K-means clustering techniques. The SOM component maps depict the strong associations among TDS and Ca2+, Mg2+, Na+, K+, and HCO3. PCA indicated that the first principal component (PC1), explaining 48.15% of the variance, closely correlates with the geological background. PC2 and PC3, explaining 13.2% and 10.8% of the variance, respectively, relate to the hydrogeological background, natural influences (such as precipitation and groundwatersurface water exchanges), and anthropogenic factors. K-means clustering segregated the samples into three primary clusters, comprising 29, 2, and 35 samples. Cluster 0 represented groundwater samples less affected by basaltic geological processes, while Cluster 1 exhibited characteristics of intense igneous rock weathering. Cluster 2 samples were influenced by other geological processes or anthropogenic factors.
This study underscores the significant impact of geological processes and human activities on groundwater hydrochemical characteristics. Furthermore, it validates the accuracy of traditional hydrogeochemical methods and PHREEQC simulations for hydrogeochemical analysis in the Changbai Mountain region.

Author Contributions

Y.L. drafted the manuscript, created figures and visualizations. Y.L. formulated and selected appropriate research methods. Y.Z. and C.Z. managed the project. Y.Z. and M.L. processed the data and conducted result analysis. Y.L. contributed to the initial draft writing and investigation. M.L. participated in data collection and investigation. X.W. revised the manuscript. All authors have read and agreed to the published version of the manuscript.

Funding

This research was funded by Fundamental Research Funds for Central Universities Postgraduate Science and Technology Innovation Fund Project (ZY20240310) and occurrence characteristics and evolution patterns of typical pollutants in groundwater in agricultural irrigation areas of North China law (2022YFC3703701).

Data Availability Statement

Data are contained within the article.

Conflicts of Interest

The authors declare no conflicts of interest.

References

  1. Ullah, A.; Ali, W.; Muhammad, S.; Ijaz, J.; Amir, F.; Iqbal, S. Comprehensive evaluation of hydro-chemical processes, suitability, health risks, and sources of groundwater contamination using compositional data analysis, nizampur basin, pakistan. Groundw. Sustain. Dev. 2023, 23, 101021. [Google Scholar] [CrossRef]
  2. Alsaleh, M.A. Natural springs in northwest saudi arabia. Arab. J. Geosci. 2017, 10, 335. [Google Scholar] [CrossRef]
  3. Alsharhan, A.S.; Rizk, Z.E.; Alsharhan, A.S.; Rizk, Z.E. Natural springs: Hydrogeology, hydrogeochemistry and therapeutic value. In Water Resources and Integrated Management of the United Arab Emirates; Springer International Publishing: Cham, Switzerland, 2020; pp. 231–255. [Google Scholar]
  4. Jones, J.D.; Mogali, S.; Comer, S.D. Polydrug abuse: A review of opioid and benzodiazepine combination use. Drug Alcohol Depend. 2012, 125, 8–18. [Google Scholar] [CrossRef] [PubMed]
  5. Krishan, G.; Kumar, M.; Rao, M.S.; Garg, R.; Yadav, B.K.; Kansal, M.; Singh, S.; Bradley, A.; Muste, M.; Sharma, L. Integrated approach for the investigation of groundwater quality through hydrochemistry and water quality index (wqi). Urban Clim. 2023, 47, 101383. [Google Scholar] [CrossRef]
  6. Wang, J.; Zhou, W.; Zhao, M.; Guo, X. Water quality assessment and pollution evaluation of surface water sources: The case of weishan and luoma lakes, xuzhou, jiangsu province, china. Environ. Technol. Innov. 2023, 32, 103397. [Google Scholar] [CrossRef]
  7. Mohamed, N.A.; Wachemo, A.C.; Karuppannan, S.; Duraisamy, K. Spatio-temporal variation of groundwater hydrochemistry and suitability for drinking and irrigation in arba minch town, ethiopia: An integrated approach using water quality index, multivariate statistics, and gis. Urban Clim. 2022, 46, 101338. [Google Scholar] [CrossRef]
  8. Riedl, M.O. Human-centered artificial intelligence and machine learning. Hum. Behav. Emerg. Technol. 2019, 1, 33–36. [Google Scholar] [CrossRef]
  9. Jannat, J.N.; Islam, A.R.M.T.; Mia, M.Y.; Pal, S.C.; Biswas, T.; Jion, M.M.M.F.; Islam, M.S.; Siddique, M.A.B.; Idris, A.M.; Khan, R. Using unsupervised machine learning models to drive groundwater chemistry and associated health risks in indo-bangla sundarban region. Chemosphere 2024, 351, 141217. [Google Scholar] [CrossRef]
  10. Ju, Y.; Jokisalo, J.; Kosonen, R.; Kauppi, V.; Janßen, P. Analyzing power and energy flexibilities by demand response in district heated buildings in finland and germany. Sci. Technol. Built Environ. 2021, 27, 1440–1460. [Google Scholar] [CrossRef]
  11. Zhang, W.-P.; Li, Z.-X.; Gao, S.-N.; Yang, H.; Xu, H.-S.; Yang, X.; Fan, H.-X.; Su, Y.; Weiner, J.; Fornara, D. Resistance vs. Surrender: Different responses of functional traits of soybean and peanut to intercropping with maize. Field Crops Res. 2023, 291, 108779. [Google Scholar] [CrossRef]
  12. Jin, Y.; Zhu, W.; Li, J.; Cui, D.; Zhang, Z.; Sun, G.; Zhu, Y.; Yang, H.; Zhang, X. Arsenic pollution concerning surface water and sediment of jie river: A pilot area where gold smelting enterprises are concentrated. Environ. Res. 2024, 249, 118384. [Google Scholar] [CrossRef] [PubMed]
  13. Nasher, G.; Al-Sayyaghi, A.; Al-Matary, A. Identification and evaluation of the hydrogeochemical processes of the lower part of wadi siham catchment area, tihama plain, yemen. Arab. J. Geosci. 2013, 6, 2131–2146. [Google Scholar] [CrossRef]
  14. Wang, L.; Li, G.; Dong, Y.; Han, D.; Zhang, J. Using hydrochemical and isotopic data to determine sources of recharge and groundwater evolution in an arid region: A case study in the upper–middle reaches of the shule river basin, northwestern china. Environ. Earth Sci. 2015, 73, 1901–1915. [Google Scholar] [CrossRef]
  15. Su, Y.; Yang, F.; Liang, X.; Xiao, C. Hydrogeochemistry and genesis of metasilicate spring water in the changbai mountain volcanic area, ne china. J. Radioanal. Nucl. Chem. 2023, 332, 2389–2400. [Google Scholar] [CrossRef]
  16. Yang, H.; Hou, B.; Ye, L.; Xu, S.; Xin, H.; Zhang, S. Groundwater chemical evolution characteristics and human health risk assessment in shicheng county, jiangxi province. Environ. Sci. Pollut. Res. 2024, 31, 37337–37355. [Google Scholar] [CrossRef] [PubMed]
  17. Ou, L.; Jiang, C.; Li, Y.; Zuo, Y.; Huang, K.; Liu, P.; Tang, J. Spatial characteristics and driving factors of groundwater hydrochemistry and heavy metals in peri-urban agricultural areas of in southwest china. Environ. Earth Sci. 2024, 83, 338. [Google Scholar] [CrossRef]
  18. Tabi, R.N.; Gibrilla, A.; Boakye, P.; Agyemang, F.O.; Foaah, A.A.; Oduro-Kwarteng, S. Appraisal of groundwater quality and hydrochemistry in three regions of ghana: Implications for drinking purposes. Groundw. Sustain. Dev. 2024, 26, 101193. [Google Scholar] [CrossRef]
  19. Bayou, W.T.; Mohammed, M.; Ayenew, T.; Mebrahtu, T.K.; Wohnlich, S. Hydrochemistry and isotope hydrology of groundwater and surface water in the sor and gebba watershed, southwestern ethiopia. Environ. Earth Sci. 2024, 83, 316. [Google Scholar] [CrossRef]
  20. Kouacou, B.A.; Anrnu, G.; Adiaffi, B.; Gibrilla, A. Hydrochemical characteristics and sources of groundwater pollution in soubré and gagnoa counties, côte d’ivoire. Groundw. Sustain. Dev. 2024, 26, 101199. [Google Scholar] [CrossRef]
  21. Nematollahi, M.; Ebrahimi, P.; Razmara, M.; Ghasemi, A. Hydrogeochemical investigations and groundwater quality assessment of torbat-zaveh plain, khorasan razavi, iran. Environ. Monit. Assess. 2016, 188, 2. [Google Scholar] [CrossRef]
  22. Gibbs, R.J. Mechanisms controlling world water chemistry. Science 1970, 170, 1088–1090. [Google Scholar] [CrossRef] [PubMed]
  23. Wang, L.; Xiao, Y.; Yang, H.; Zhang, Y.; Wang, S.; Qi, Z.; Han, J.; Hu, W.; Wang, J.; Hao, Q. Formation mechanism of high-altitude glacial mineral water in the kunlun mountains of tibetan plateau: Insights from isotopes and hydrochemistry. J. Hydrol. Reg. Stud. 2024, 53, 101789. [Google Scholar] [CrossRef]
  24. Zhang, S.; Liu, K.; Ma, Y.; Wang, L.; Sun, J. Identifying the hydrochemical characteristic, genetic mechanism and potential human health risks of fluoride and nitrate enriched groundwater in tongzhou district, beijing, north china. Acta Geol. Sin.-Engl. Ed. 2024, 98, 468–476. [Google Scholar] [CrossRef]
  25. Shang, Y.; Fu, C.; Zhang, W.; Li, X.; Li, X. Groundwater hydrochemistry, source identification and health assessment based on self-organizing map in an intensive mining area in shanxi, china. Environ. Res. 2024, 252, 118934. [Google Scholar] [CrossRef] [PubMed]
  26. Liu, H.; Wei, W.; Song, Y.; Xu, J.; Guan, Z.T.; Huang, J.M.; Zhao, G.H. Hydrochemical characteristics, controlling factors and water quality evaluation of shallow groundwater in tan-lu fault zone (anhui section). Huan Jing Ke Xue 2024, 45, 2665–2677. [Google Scholar] [PubMed]
  27. Hu, Y.X.; Zhou, R.J.; Song, W.; Yang, Q.H.; Wang, X.R. Analysis on hydrochemical evolution of shallow groundwater east of yongding river in fengtai district, beijing. Huan Jing Ke Xue 2024, 45, 2651–2664. [Google Scholar] [PubMed]
  28. Marghade, D.; Malpe, D.B.; Zade, A.B. Major ion chemistry of shallow groundwater of a fast growing city of central india. Environ. Monit. Assess. 2012, 184, 2405–2418. [Google Scholar] [CrossRef]
  29. Li, P.; Wu, J.; Qian, H. Assessment of groundwater quality for irrigation purposes and identification of hydrogeochemical evolution mechanisms in pengyang county, china. Environ. Earth Sci. 2013, 69, 2211–2225. [Google Scholar] [CrossRef]
  30. Jiménez, J.; Cavero, S.G.; Marazuela, M.Á.; Baquedano, C.; Laspidou, C.; Santamarta, J.C.; García-Gil, A. Effects of the 2021 la palma volcanic eruption on groundwater hydrochemistry: Geochemical modelling of endogenous CO2 release to surface reservoirs, water-rock interaction and influence of thermal and seawater. Sci. Total Environ. 2024, 929, 172594. [Google Scholar] [CrossRef]
  31. Chashoo, H.F.; Abubakr, A.; Malik, M.; Bhat, F.A.; Bhat, B.A.; Khan, I.A.; Tariq, S.; Hanief, F. Assessing the health of dachigam stream: A water quality analysis. Int. J. Environ. Clim. Change 2024, 14, 356–371. [Google Scholar] [CrossRef]
  32. Boualem, B.; Egbueri, J.C. Graphical, statistical and index-based techniques integrated for identifying the hydrochemical fingerprints and groundwater quality of in salah, algerian sahara. Environ. Geochem. Health 2024, 46, 158. [Google Scholar] [CrossRef]
  33. Wang, S.; Chen, J.; Zhang, S.; Bai, Y.; Zhang, X.; Chen, D.; Hu, J. Groundwater hydrochemical signatures, nitrate sources, and potential health risks in a typical karst catchment of north china using hydrochemistry and multiple stable isotopes. Environ. Geochem. Health 2024, 46, 173. [Google Scholar] [CrossRef] [PubMed]
  34. Rafique, V.; Grimmer, M.; Scheermann, F.; Roscher, M.; Hoth, N. Integrated hydrological and hydrochemical analysis of arsenic and iron behavior in waters of a decommissioned tin mine in ehrenfriedersdorf, germany. Hydrology 2024, 11, 51. [Google Scholar] [CrossRef]
  35. Fernández-Lozano, J.; Turu, V.; Carrasco, R.M.; Soteres, R.L.; Sánchez-Vizcaino, J.; Karampaglidis, T.; Ros, X.; Merlo, O.; Pedraza, J. The mid-latitude hydrolaccolith of the spanish central system (southern europe): A top-to-bottom integration of geomatic, geophysical and sedimentary datasets for characterising a singular periglacial landform. Land Degrad. Dev. 2024, 35, 1029–1049. [Google Scholar] [CrossRef]
  36. Hernandez-Terrones, L.; Street, J.; Null, K.; Paytan, A. Groundwater chemistry and sr isotope ratios shed light on connectivity and water-rock interactions in the coastal aquifer of the caribbean coast, mexico. Cont. Shelf Res. 2021, 212, 104293. [Google Scholar] [CrossRef]
  37. Li, Y.; Tang, S.; Zhang, S.; Xi, Z.; Wang, P. Biogeochemistry and water–rock interactions of coalbed methane co-produced water in the shizhuangnan block of the southern qinshui basin, china. Water 2019, 12, 130. [Google Scholar] [CrossRef]
  38. Jiang, Q.; Deng, H.; Li, J.; Luo, Z.; Assefa, E.; Fang, J.; Xiao, Y. The degradation effect and mechanism by water-rock interaction in the layered sandstone in the three gorges reservoir area. Arab. J. Geosci. 2019, 12, 722. [Google Scholar] [CrossRef]
  39. Ma, X.; Yang, G.; Li, X.; Yu, Y.; Dong, J. Geochemical modeling of changes in caprock permeability caused by CO2–brine–rock interactions under the diffusion mechanism. Oil Gas Sci. Technol.—Rev. d’IFP Energ. Nouv. 2019, 74, 83. [Google Scholar] [CrossRef]
  40. Pan, D.; Li, S.; Xu, Z.; Lin, P.; Huang, X. Experimental and numerical study of the water inrush mechanisms of underground tunnels due to the proximity of a water-filled karst cavern. Bull. Eng. Geol. Environ. 2019, 78, 6207–6219. [Google Scholar] [CrossRef]
  41. Feng, J.; Zhang, X.; Luo, P.; Li, X.; Du, H. Mineral filling pattern in complex fracture system of carbonate reservoirs: Implications from geochemical modeling of water-rock interaction. Geofluids 2019, 2019, 3420142. [Google Scholar] [CrossRef]
  42. Galland, G.R.; Hastings, P.A.; Leichter, J.J. Fluctuating thermal environments of shallow-water rocky reefs in the gulf of california, mexico. Sci. Rep. 2019, 9, 18022. [Google Scholar] [CrossRef] [PubMed]
  43. Beckingham, L.E.; Winningham, L. Critical knowledge gaps for understanding water–rock–working phase interactions for compressed energy storage in porous formations. ACS Sustain. Chem. Eng. 2019, 8, 2–11. [Google Scholar] [CrossRef]
  44. Yang, W.; Wang, M.; Zhou, Z.; Li, L.; Yuan, Y.; Gao, C. A true triaxial geomechanical model test apparatus for studying the precursory information of water inrush from impermeable rock mass failure. Tunn. Undergr. Space Technol. 2019, 93, 103078. [Google Scholar] [CrossRef]
  45. Liu, S.; Qi, S.; Luo, Z.; Mapoma, H.W.T.; Chen, Z.; Cheng, S. The origin of high hydrocarbon groundwater in shallow aquifer: Experimental evidences from water-rock interaction. Environ. Sci. Pollut. Res. 2019, 26, 32574–32588. [Google Scholar] [CrossRef] [PubMed]
  46. Eldrup, M.R.; Andersen, T.L. Extension of shallow water rock armour stability formulae to nonlinear waves. Coast. Eng. 2019, 153, 103536. [Google Scholar] [CrossRef]
  47. Castendyk, D.N.; Webster-Brown, J.G. Sensitivity analyses in pit lake prediction, martha mine, new zealand 1: Relationship between turnover and input water density. Chem. Geol. 2007, 244, 42–55. [Google Scholar] [CrossRef]
  48. Simatupang, C.A.; Santhaweesuk, K.; Strezov, V.; Pongkiatkul, P.; Boontanon, N.; Jindal, R.; Boontanon, S.K. Health risk assessment of soil contamination with heavy metals in a child care center co-located in vicinity to small scale industrial area: Case study of thailand. Case Stud. Chem. Environ. Eng. 2024, 9, 100727. [Google Scholar] [CrossRef]
  49. de Barcelos, A.A.; da Silva Gomes, P.; Ramalho, F.L.; Rocha, H.M.; Cabral, J.B.P.; Paulino, A.T. Environmental impacts due to the behavior of limnological variables in water reservoirs of hydroelectric power plants. Environ. Earth Sci. 2024, 83, 294. [Google Scholar] [CrossRef]
  50. Okeleji, O.A.; Ioannidou, V.G. Impact of design aspects on iron removal efficiencies from coal mine drainage in full-scale lagoons. Ecol. Eng. 2024, 203, 107255. [Google Scholar] [CrossRef]
  51. Sanad, H.; Mouhir, L.; Zouahri, A.; Moussadek, R.; El Azhari, H.; Yachou, H.; Ghanimi, A.; Oueld Lhaj, M.; Dakak, H. Assessment of groundwater quality using the pollution index of groundwater (pig), nitrate pollution index (npi), water quality index (wqi), multivariate statistical analysis (msa), and gis approaches: A case study of the mnasra region, gharb plain, morocco. Water 2024, 16, 1263. [Google Scholar] [CrossRef]
  52. Zhang, G.; Liu, J.; Qian, J.; Zhang, X.; Liu, Z. Review of research progress and stability studies of amine-based biphasic absorbents for CO2 capture. J. Ind. Eng. Chem. 2024, 134, 28–50. [Google Scholar] [CrossRef]
  53. Malik, S.S.; Loganathachetti, D.S.; Khan, M.A.; Sadaiappan, B.; Mundra, S. Bacterial resistome in different stages of wastewater treatment plant is highly impacted by the abundance of the pseudomonadota community. Bioresour. Technol. Rep. 2024, 26, 101814. [Google Scholar] [CrossRef]
  54. Bose, S.; Halder, S. Monitoring decadal ecological degradation in kolkata metropolitan area using comprehensive ecological evaluation index: A vision towards sustainable urban planning. Adv. Space Res. 2024, 73, 4634–4650. [Google Scholar] [CrossRef]
  55. Mohamed, E.S.; Jalhoum, M.E.; Hendawy, E.; El-Adly, A.M.; Nawar, S.; Rebouh, N.Y.; Saleh, A.; Shokr, M.S. Geospatial evaluation and bio-remediation of heavy metal-contaminated soils in arid zones. Front. Environ. Sci. 2024, 12, 1381409. [Google Scholar] [CrossRef]
  56. Talpur, H.A.; Talpur, S.A.; Mahar, A.; Rosatelli, G.; Baloch, M.Y.J.; Ahmed, A.; Khan, A.H.A. Investigating drinking water quality, microbial pollution, and potential health risks in selected schools of badin city, pakistan. HydroResearch 2024, 7, 248–256. [Google Scholar] [CrossRef]
  57. Feng, X. Air pollution prediction in context of supervised machine learning and time series model. In Proceedings of the Second International Conference on Statistics, Applied Mathematics, and Computing Science (CSAMCS 2022), Nanjing, China, 25–27 November 2022; pp. 904–912. [Google Scholar]
  58. Akbari, V.; Datta, A.; Bhowmik, D.; Marino, A.; Kumar, S.; Rupavatharam, S.; Prabhu, G.N.; Kleczkowski, A.; Sujeetha, J.A.R.; Maharaj, S. Multitemporal multispectral drone imagery for water hyacinth mapping in patancheru lake, hyderabad, india. In Proceedings of the Remote Sensing of the Ocean, Sea Ice, Coastal Waters, and Large Water Regions 2022, Berlin, Germany, 6 September 2022; pp. 63–71. [Google Scholar]
  59. Naangmenyele, Z.; Ncube, S.; Akpabey, F.J.; Dube, S.; Nindi, M.M. Levels and potential health risk of elements in two indigenous vegetables from golinga irrigation farms in the northern region of ghana. J. Food Compos. Anal. 2021, 96, 103750. [Google Scholar] [CrossRef]
  60. Ahmed, U.; Mumtaz, R.; Anwar, H.; Shah, A.A.; Irfan, R.; García-Nieto, J. Efficient water quality prediction using supervised machine learning. Water 2019, 11, 2210. [Google Scholar] [CrossRef]
  61. Lamb, K.D. Classification of iron oxide aerosols by a single particle soot photometer using supervised machine learning. Atmos. Meas. Tech. 2019, 12, 3885–3906. [Google Scholar] [CrossRef]
  62. Di, Z.; Chang, M.; Guo, P.; Li, Y.; Chang, Y. Using real-time data and unsupervised machine learning techniques to study large-scale spatio–temporal characteristics of wastewater discharges and their influence on surface water quality in the yangtze river basin. Water 2019, 11, 1268. [Google Scholar] [CrossRef]
  63. Vesselinov, V.V.; Alexandrov, B.S.; O’Malley, D. Nonnegative tensor factorization for contaminant source identification. J. Contam. Hydrol. 2019, 220, 66–97. [Google Scholar] [CrossRef]
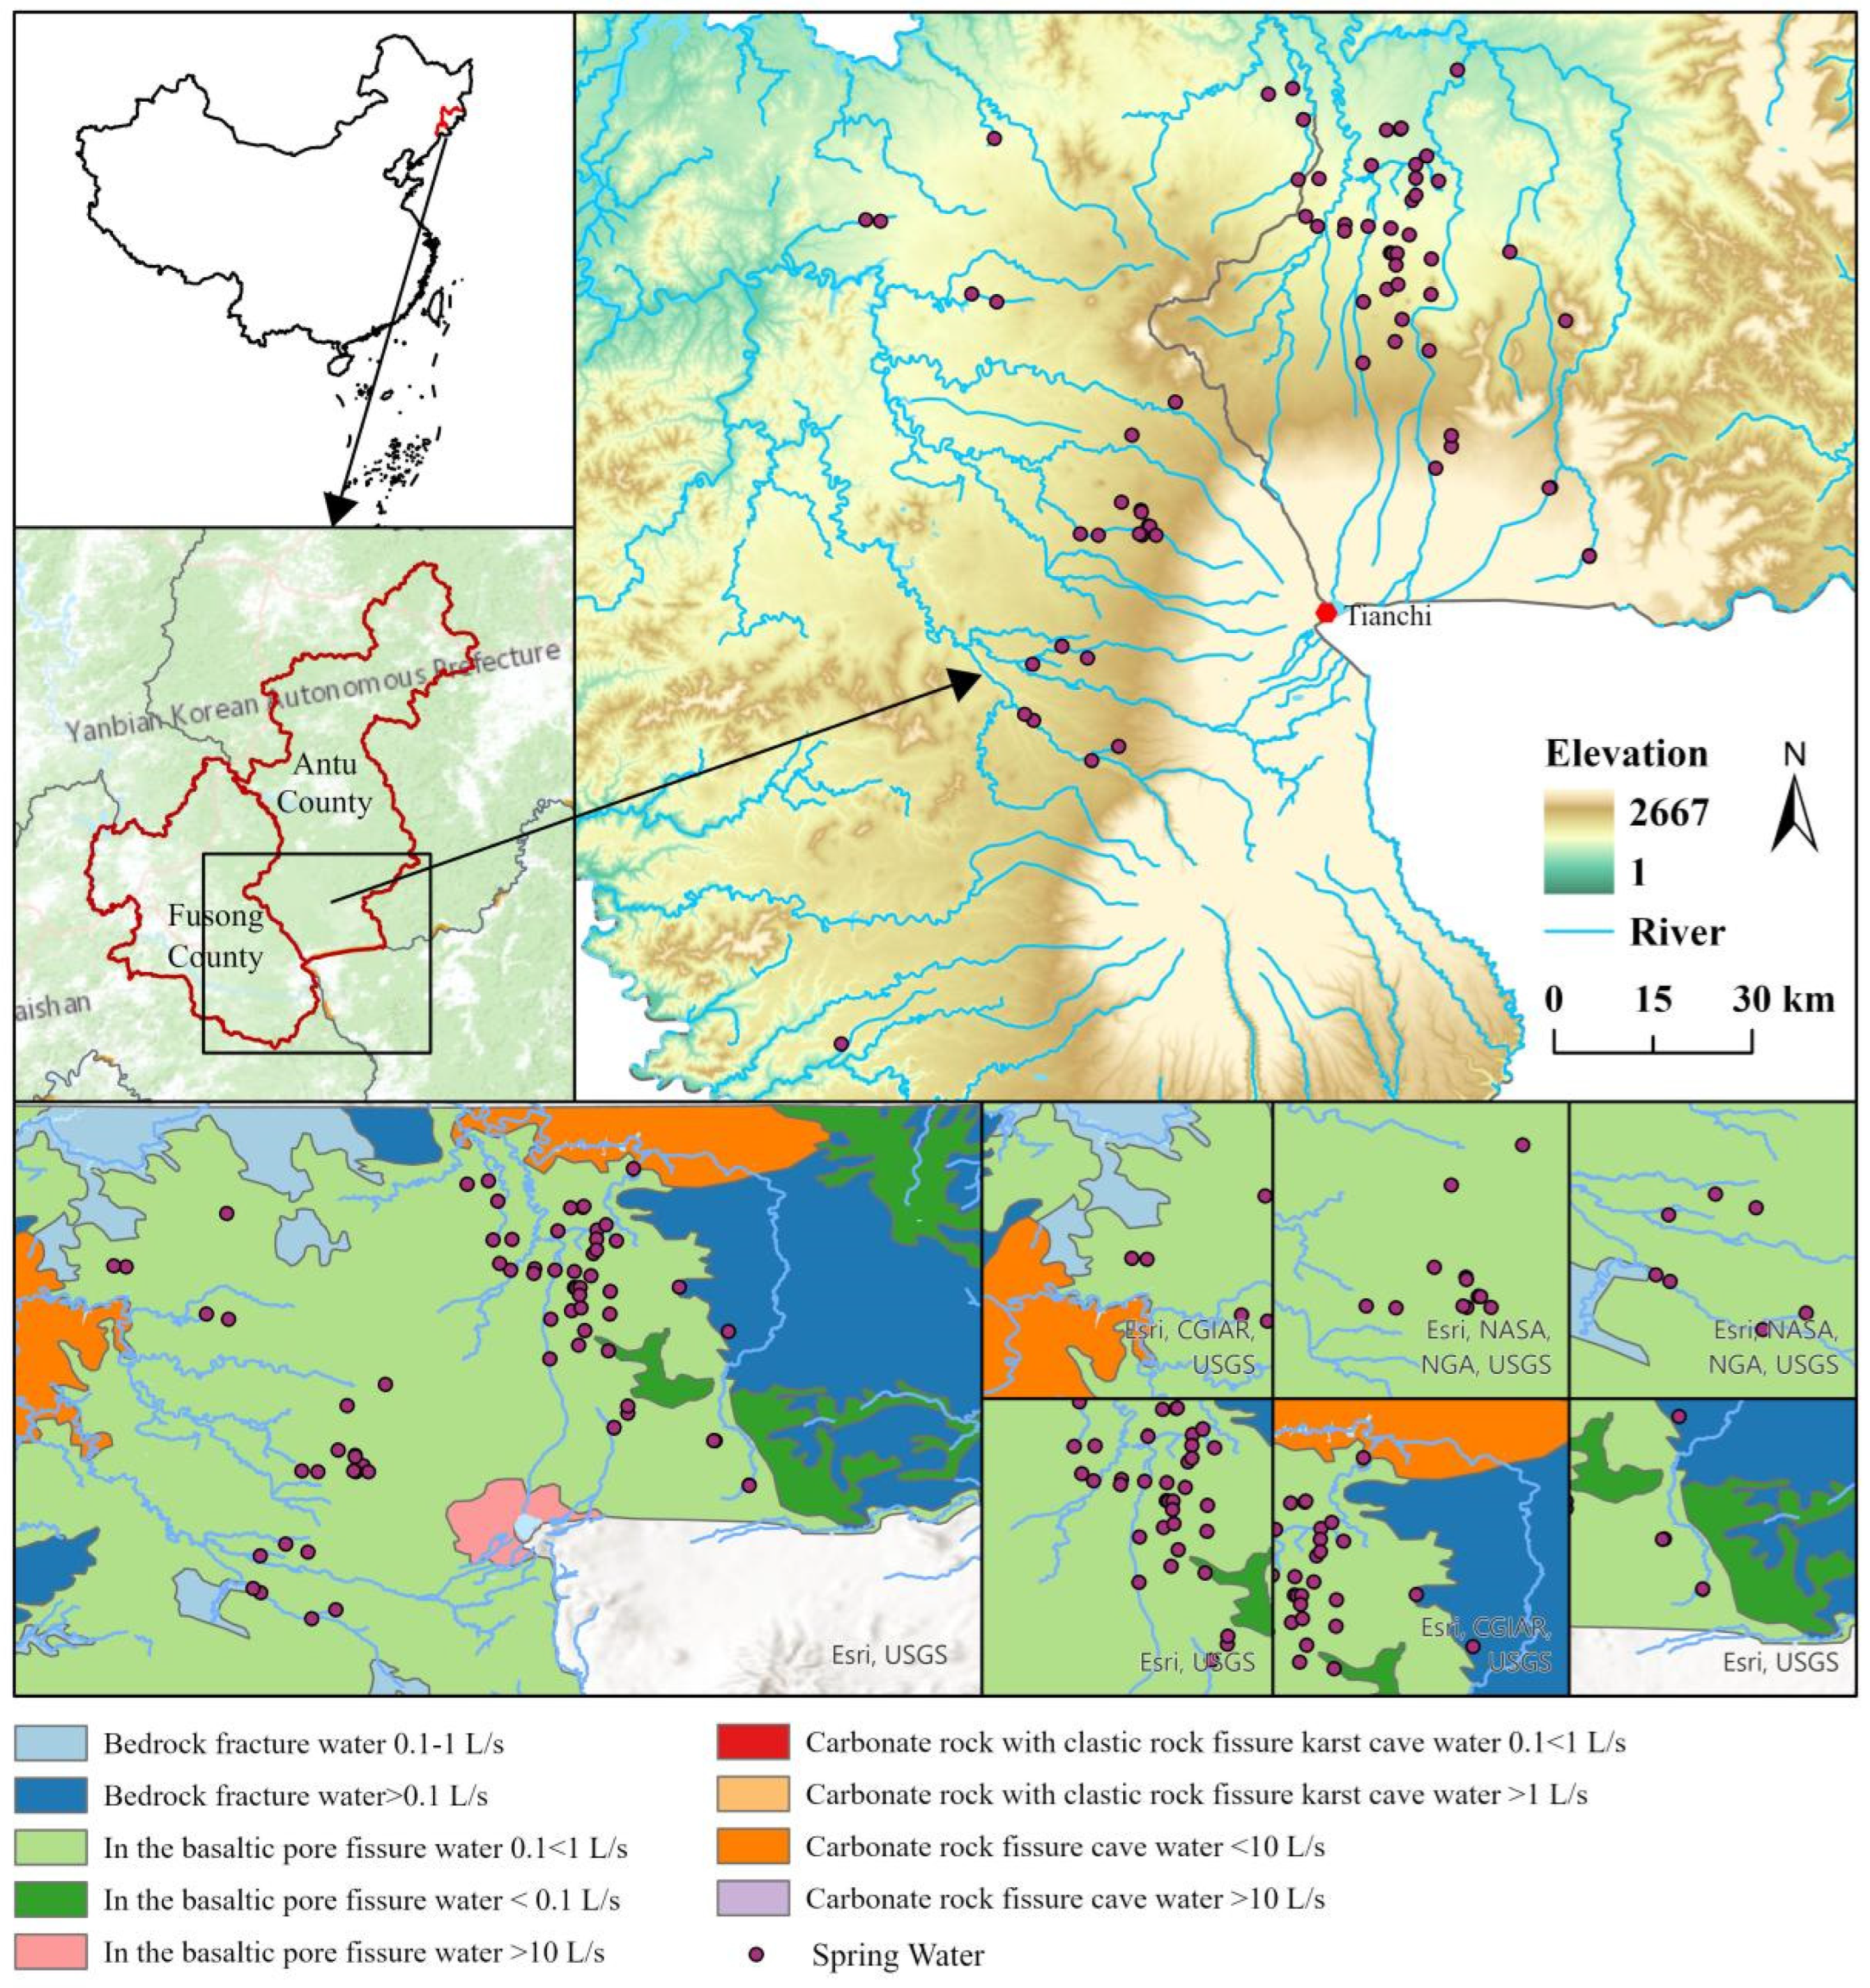
Figure 1. Location map of the study area.
Water 16 01853 g001
Figure 2. The ion content of the main ions.
Water 16 01853 g002
Figure 3. Violin plot of the different chemical components in the mineral water.
Water 16 01853 g003
Figure 4. Piper diagram of the water samples.
Water 16 01853 g004
Figure 5. Gibbs diagram of the water chemistry formation mechanism.
Water 16 01853 g005
Figure 6. (a) Ca2+/HCO3 plot for Na; (b) Ca2+/Mg2+ plot for Na; (c) HCO3/Ca2+ + Mg2+ plot.
Water 16 01853 g006
Figure 7. Chlor-alkali exchange index.
Water 16 01853 g007
Figure 8. Difference chart for the ion exchange process during groundwater mineralization, showing (a) Na+ (mg/L)/Ca2+ (mg/L), (b) Na+ (mg/L)/Cl, (c) Na+ (mg/L)/HCO3 (mg/L), and (d) Ca2+ + Mg2+ (mg/L)/SO42− + HCO3.
Water 16 01853 g008
Figure 9. Water chemistry Pearson’s correlation plot. (“*” indicates that the correlation is significant at the p < 0.05 level, i.e., there is a strong statistical basis for believing that there is a correlation between the two variables.”**” then indicates that the correlation between the variables is highly significant at the more stringent level of statistical significance p < 0.01).
Water 16 01853 g009
Figure 10. Simulation roadmap.
Water 16 01853 g010
Figure 11. Component planes for the 19 training parameters in the SOM analysis.
Water 16 01853 g011
Figure 12. PCA-K model training results and contributions of each water chemistry component.
Water 16 01853 g012
Table 1. Statistical hydrochemical characteristics of the water samples.
TimeStatistical IndexpHMain Components (mg/L)
Na+K+Ca2+Mg2+HCO3SO42−ClNO3FH2SiO3Al3+BaLi+Mn2+Sr+TDS
SpringMax8.369.414.217584.4102011.827.91161.5582.40.760.410.110.450.421420
Min7.32.760.703.621.6319.502.340.670.380.0127.80.040.0010.0050.00050.012268
Mean7.8810.303.019.296.3273.875.431.835.860.6149.130.100.010.030.020.04155.08
Table 2. The results of the hydrogeochemical simulation.
Pathway IPathway ΠPathway Γ
ItemsI1–I2I2–I3Π1–Π2Π2–Π3Γ1–Γ2Γ2–Γ3Γ3–Γ4Γ4–Γ5Γ5–Γ6
Evaporation Multiple11.671.032.141.051.91.31.51.2
Calcite0.71−0.72−0.170.23−2.212.16−0.70.21−0.61
Quartz10.32−10.350.08−0.89−1.151.25−0.760.74−2.2
Mineral dissolution and precipitationDolomite0.74−0.8−0.350.38−4.094−1.470.97−1.76
Gypsum0.38−0.42−0.04−0.2−1.341.39−0.76−0.02−0.41
Halite−9.8910.27−0.380.270.010.030.04−0.05−0.11
Table 3. Dataset of after the SOM.
Methodology
somStatistical IndexpHNaKCaMgFe
Max2.194.664.357.726.615.09
Min−2.99−0.56−0.86−0.25−0.39−0.44
Mean0.280.230.180.260.30.37
HCO3SO42−ClNO3FH2SiO3
Max6.923.367.477.351.962.59
Min−0.39−1.43−0.33−0.37−1.47−1.68
Mean0.290.290.250.20.080.04
AlBaLiMnSrTDS
Max4.036.543.19−0.28−0.43−0.43
Min−0.48−0.22−1.046.395.517
Mean0.380.280.220.320.330.27
Hardness
Max7.25
Min−0.33
Mean0.29
Table 4. Dataset of after the PCA.
Methodology
PCAStatistical IndexPC1PC2PC3
Max16.875.417.21
Min−1.52−4.27−2.5
Mean000
Contribution rate48.15%13.20%10.80%
Table 5. Dataset of after the K-means.
Methodology
KStatistical Index012
Quantity29235
Disclaimer/Publisher’s Note: The statements, opinions and data contained in all publications are solely those of the individual author(s) and contributor(s) and not of MDPI and/or the editor(s). MDPI and/or the editor(s) disclaim responsibility for any injury to people or property resulting from any ideas, methods, instructions or products referred to in the content.