Article

A CFD Study on Optimization of Mass Transfer and Light Distribution in a Photocatalytic Reactor with Immobilized Photocatalyst on Spheres

1
Faculty of Chemistry and Chemical Technology, University of Ljubljana, Večna Pot 113, 1000 Ljubljana, Slovenia
2
Faculty of Mechanical Engineering, University of Ljubljana, Aškerčeva Cesta 6, 1000 Ljubljana, Slovenia
*
Author to whom correspondence should be addressed.
Water 2024, 16(13), 1828; https://doi.org/10.3390/w16131828
Submission received: 27 May 2024 / Revised: 21 June 2024 / Accepted: 25 June 2024 / Published: 27 June 2024

Abstract

:
This study explores the influence of flow velocity, sphere size, and inter-sphere distance on hydrodynamics and mass transfer in a photocatalytic reactor. The effects of two different light configurations on light distribution and degradation were also evaluated. A 2D computational fluid dynamics (CFD) model was developed to simulate the continuous flow photocatalytic reactor with TiO2-coated spheres and validated with experimental measurements by observing the degradation of methyl orange. The experimental setup consists of a tube containing an equal number of TiO2-coated glass spheres. The case with radiation from one wall shows a non-uniform light distribution compared with the case with radiation from both walls. The CFD simulations focused on analyzing the velocity streamlines and turbulence characteristics (turbulent kinetic energy (TKE) and turbulence dissipation rate (TDR)). These parameters showed significant variations in each studied case. The case with larger spheres reached the highest velocity of 38 m/s of the pollutant solution. The highest TKE and TDR values of 0.47 m2/s2 and 12.2 m2/s2, respectively, were also observed in the same case, indicating enhanced mixing and mass transfer to the catalyst surfaces, ultimately leading to a more efficient degradation process. The results show that an optimized design of photocatalytic reactors can significantly improve mass transfer and, thus, degradation efficiency.

1. Introduction

The population surge and the continuous development of industry and agriculture have increased the concentration of organic contaminants in water sources [1,2]. These contaminants include pharmaceuticals, endocrine disruptors, textile dyes, pesticides, personal care products, and perfluoroalkyl and polyfluoroalkyl substances (PFAS), which are commonly found in wastewater [3,4,5]. Conventional wastewater treatment methods have failed to remove them completely. Therefore, researchers are endeavoring to develop new technologies to completely degrade them instead of removing them [5,6,7]. The photocatalysis-based advance oxidation process is one of the most effective approaches for treating organic pollutants in wastewater, as complete mineralization of organic pollutants can be achieved without additional chemicals [8,9]. The irradiated photocatalyst generates highly reactive hydroxyl radicals, which react with organic compounds and, in many cases, lead to CO2 and water [10,11].
Two main types of photocatalytic reactors are being investigated for photocatalytic degradation of pollutants: one with suspended photocatalyst particles (slurry reactor) [12,13] and another with an immobilized photocatalyst on a suitable substrate (immobilized reactor) [8,14]. The former is considered efficient because of the large surface area available for the reaction. However, the separation of the photocatalyst after treatment increases the complexity and cost of the process. In contrast, the recovery process is not required for immobilized photoreactors, but the low surface area is cited as a reason for their lower efficiency. Nevertheless, immobilized photoreactors offer practical solutions for large-scale applications [15]. The immobilization of the photocatalyst on glass spheres provides a large surface area for the pollutants to adsorb on the catalyst surface and increases the turbulence of the pollutant stream. This turbulence improves mixing and increases mass transfer [16]. The increased mass transfer brings the pollutants closer to the photocatalyst and facilitates adsorption. Subsequently, the efficiency of photocatalytic degradation of the pollutants also increases [17,18,19]. Despite the advantageous properties of photocatalysis and extensive research, this technique is not yet fully developed. Moreover, the experimental scaling up of photoreactors requires extensive technical effort and cost. The experimental findings cannot be generalized on an industrial scale, as many different parameters affect the reactor’s performance at the same time.
Computational fluid dynamics (CFD) is an effective approach for the development, optimization, and scaling-up of photocatalytic reactors [20,21,22,23]. CFD modeling uses local operating parameters such as pollutant concentration, UV light intensity, fluid velocity, reaction rate, etc. and can perform a comprehensive analysis of the reactor by simulating mass transfer, chemical reaction kinetics, UV light distribution, and hydrodynamics [23]. Moreover, the photoreactor can be scaled up, as the computational approach eliminates the cost of setting up experiments and manufacturing the photoreactors [24].
The CFD approach has been used to study the irradiation [20,22], hydrodynamics and mass transfer [25,26], and chemical kinetics [27,28] of a photocatalytic reactor. Qi et al. [29] reported that light distribution and hydrodynamics significantly affect the photocatalytic degradation process of organic pollutants. Boyjoo et al. [21] performed CFD analysis of a pilot-scale slurry photocatalytic reactor and found that increasing the number of lamps increased the reaction rate by up to 123%. Meng and Zhang [30] experimentally studied the exposed area of different sizes of beads to irradiation and compared it with a flat plate. The CFD simulation was performed for energy distribution and showed incident radiation. In another study, experimental and numerical methods were used to evaluate the influence of inlet position, flow dynamics, and phenol degradation in a flat-plate photocatalytic reactor. The findings revealed that the position of the inlet and flow velocity significantly influenced the degradation process [25]. The same group explored the effects of different baffle heights on mixing and turbulence using CFD simulations and found that baffles increased eddies in the flow and increased turbulent energy dissipation and mass transfer compared with a design without baffles [26]. Most of the work was focused on slurry reactors or reactors with immobilized photocatalyst on flat plates. Therefore, there is limited knowledge about the hydrodynamics of photocatalytic reactors containing catalyst-coated spheres.
This work focused on the CFD analysis of a photocatalytic reactor with immobilized photocatalyst titanium dioxide (TiO2) on glass spheres. The developed model was first validated with experimental results. The effect of laminar and turbulence regimes, sphere sizes, and inter-sphere distance on the hydrodynamics of a photocatalytic reactor was investigated. The effect of radiation boundary conditions (by irradiating one wall or both walls) on the light distribution was also analyzed. Moreover, the effect of these parameters was also evaluated on the molar concentration of the studied model pollutant, methyl orange. Simulations were performed using the ANSYS Fluent solver 2023 R1 to determine the distribution of hydrodynamic parameters such as turbulence kinetic energy (TKE) and turbulence dissipation rate (TDR) in the channel. This study provides a strong foundation for the numerical modeling of complex reactor setups containing a large number of spheres similar to those used in practical applications.

2. Materials and Methods

2.1. Experimental Setup

The experimental setup consists of a horizontal column filled with titanium dioxide (TiO2)-coated glass spheres. For the deposition, a suspension of commercially available TiO2 P25 was prepared in TiO2 sol, and the photocatalyst was deposited on ~3 mm spheres using the method described by Matoh et al. [8]. Figure 1 shows the TiO2-coated glass spheres. The coated glass spheres were packed in a 50 mL poly(methyl methacrylate) (PMMA) column. UV lamps were used as light sources with a wavelength of λ = 365 nm. The UV light was irradiated on the column from the top. An azo dye, methyl orange (MO), was selected as the model pollutant. The solution of MO was prepared with a molar concentration of 0.002 in deionized water. MO is used because of the ease of the measurement procedure. As it is dye and can be easily measured using a UV–Vis spectrophotometer, a special analytic technique such as LC-MS is not required. In the experiment, UV Black Light Blue (UV BLB) lamps and one Actinic Blue lamp (λ = 365 nm) with a total light intensity of 100 W/m2 were used as light sources.
The solution was pumped through the reactor at flow rates of 1, 2, 5, 10, and 15 mL/min. The concentration of the model pollutant, Methyl Orange (MO), was measured using an Agilent Carry 60 UV–Vis spectrophotometer at the inlet and considered as the initial concentration (C0) and at the outlet during all experiments to evaluate the degradation percentage under different parameters. Similarly, the concentration of MO was taken at the outlet of the results obtained from numerical simulations and compared with the experimentally obtained results.

2.2. Computational Domain

The study focuses on numerically simulating the flow through the described reactor. The numerical analysis is performed on ANSYS Fluent 2023 R1. A relatively simplified, two-dimensional (2D) PMMA channel with 23 TiO2-coated spheres was primarily considered. The 2D approach was used to reduce computational time and effort. The geometry of the reactor was drawn using ANSYS Design Modeler 2023 R1 and presented in Figure 2. The nominal dimensions of the primary domain are length x 1 = 500   mm and width y 1 = 18.5   mm . The horizontal distance of the 1st layer of spheres from the inlet and the horizontal distance of the last layer of spheres from the outlet are x 2 = x 4 = 50   mm , which ensure fully developed flow at the inlet and outlet of the channel, while the inter-spheres horizontal distance is x 3 = 50   mm . The vertical distance between a sphere and a wall and the inter-spheres vertical distance is y 2 = y 3 = 5   mm and the diameter of each sphere is 3   mm .
The computational domain described above was primarily used for the validation of the model with experimental data. Later on, three secondary geometries were investigated with the following variations:
(i)
A channel with 48 spheres and the horizontal distances x 2 ,   x 3 and x 4 are halved.
(ii)
A channel with larger spheres i.e., middle sphere in three vertical sphere layer is of 4   mm diameter and all others are of 5   mm .
(iii)
Plain channel with no spheres, and hence, no photocatalyst is present.

2.3. Meshing

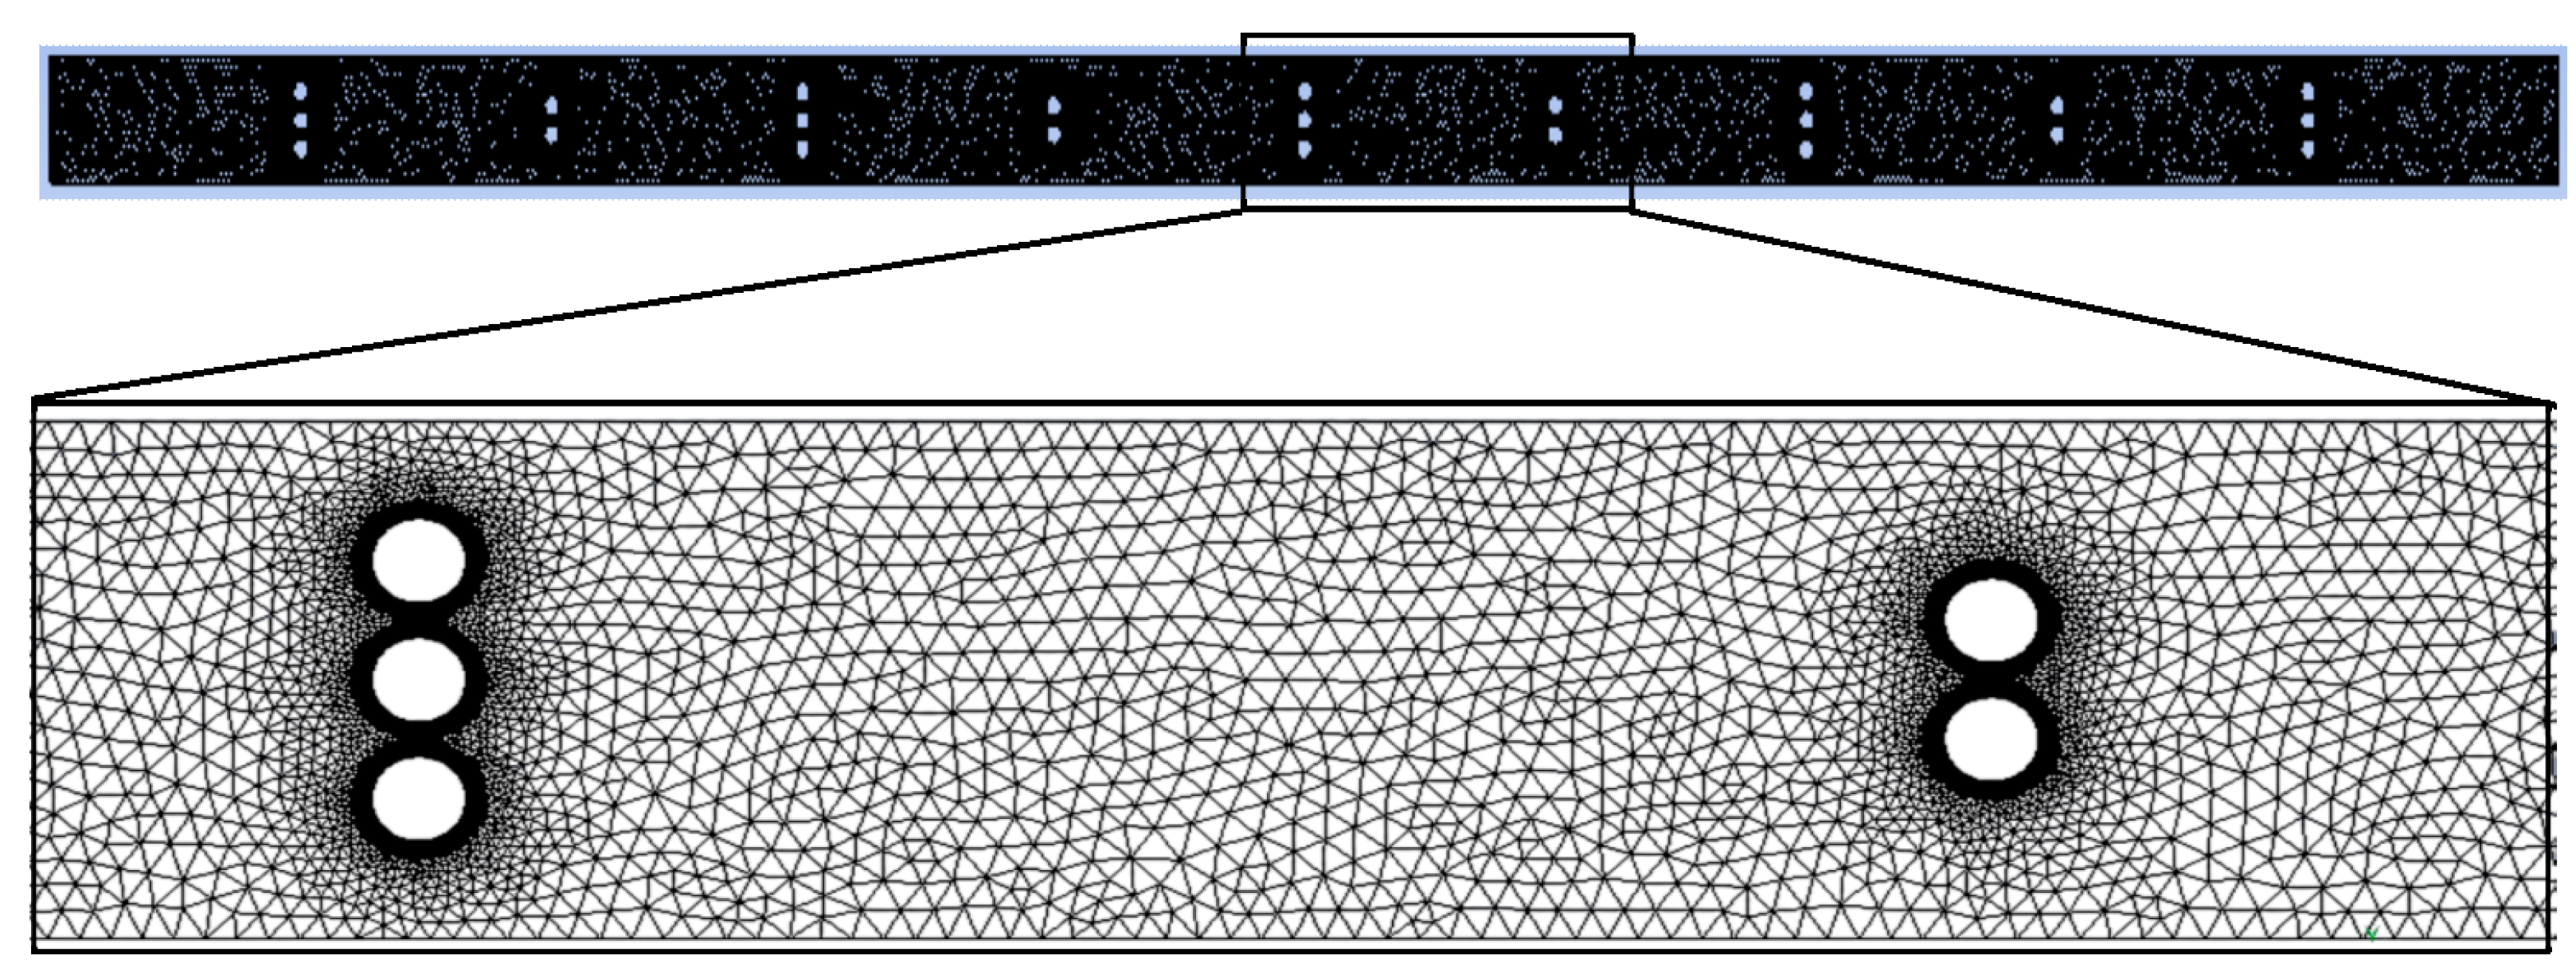
The computational domain was discretized with a triangular mesh into 172,000 cells using ANSYS meshing. The discretization of the computational domain is shown in Figure 3. The triangular mesh method allows better flexibility in capturing curved surfaces compared with the quadrilateral meshing method. The accuracy of the model depends on the quality of the mesh used to discretize the reactor geometry. Therefore, the mesh was refined around the spheres to accurately study the flow behavior around them. The mesh cells near the spheres were refined using the edge-sizing technique, which precisely controls the mesh size along the spheres. A mesh size of 0.05 mm was used at the edges around the spheres. An inflation layer was also used around the spheres. This created 12 layers of cells with a growth rate of 1.2. This adaptive mesh refinement technique provided an improvement in the accuracy of the flow while maintaining computational efficiency.

2.4. Governing Equations

The Newtonian, incompressible, turbulent flow of the non-reactive fluid through the discussed channel is governed by the following coupled set of Reynolds averaged Navier-Stokes (RANS), species transport equations, and energy equations.
ρ t + · ( ρ v ) = 0 ,
( ρ v ) t + · ( ρ v v ) = P · ( μ v ) ,
( ρ i ) t + · ( ρ v i ) = P · v · q s ,
ρ χ a t + · ( ρ χ a ) = J a + R a s .
where ρ ,   v ,   P and μ stand for density, velocity, pressure, and dynamic viscosity of the fluid, respectively. t denotes time, i = 0.5 ( v · v ) is the specific internal energy and q s represents heat flux which transfers heat by diffusion. According to Fourier’s law q s = k T , where k and T are the thermal conductivity and temperature of the fluid. J a and R a represent diffusion flux and net rate production of species a due to chemical reactions. χ a is the mass fraction of reactants and products.
The continuity (1), momentum (2), energy (3), and species transport (4) equations ensure mass, momentum, energy, and species conservation in the flow field. The detailed derivations of the fluid flow and transport equations can be found in the literature [24,31].

2.5. Boundary and Initial Conditions

The simulations are performed using the commercial CFD solver ANSYS Fluent [32], version 22. Fluent utilizes the Finite Volume Method (FVM) [24] for domain discretization and the RNG k- ε model for turbulent flow. Discrete Ordinate (DO) method for simulating radiative heat transfer in the system. The RNG k- ε turbulence model addresses the limitations of the standard k- ε model by incorporating additional terms in the transport equation for kinetic energy ( k ) and dissipation rate ( ε ) . The Fluent solver settings include: pressure-based solver, Pressure-Implicit with the Splitting of Operators (PISO) pressure–velocity coupling algorithm, first order time discretization, second order upwind scheme for the momentum equation, the PRESTO scheme for pressure, the scaled residuals of 10 6 for the molar concentration of species and 10 4 for the momentum, continuity, and energy equations.
No-slip velocity ( v = 0 ) boundary conditions were given at the walls of the channel and the spheres. Velocity-inlet and pressure-outlet boundary conditions were applied at the inlet and outlet of the channel, respectively. The fluid enters the channel at constant room temperature ( T = 300   K ) from the inlet, and at the outlet, a zero gradient boundary condition T n = 0 is specified. The walls of the channel are semitransparent, and irradiance of 100   W / m 2 was provided at each wall (top and bottom).

2.6. Mesh Convergence Study

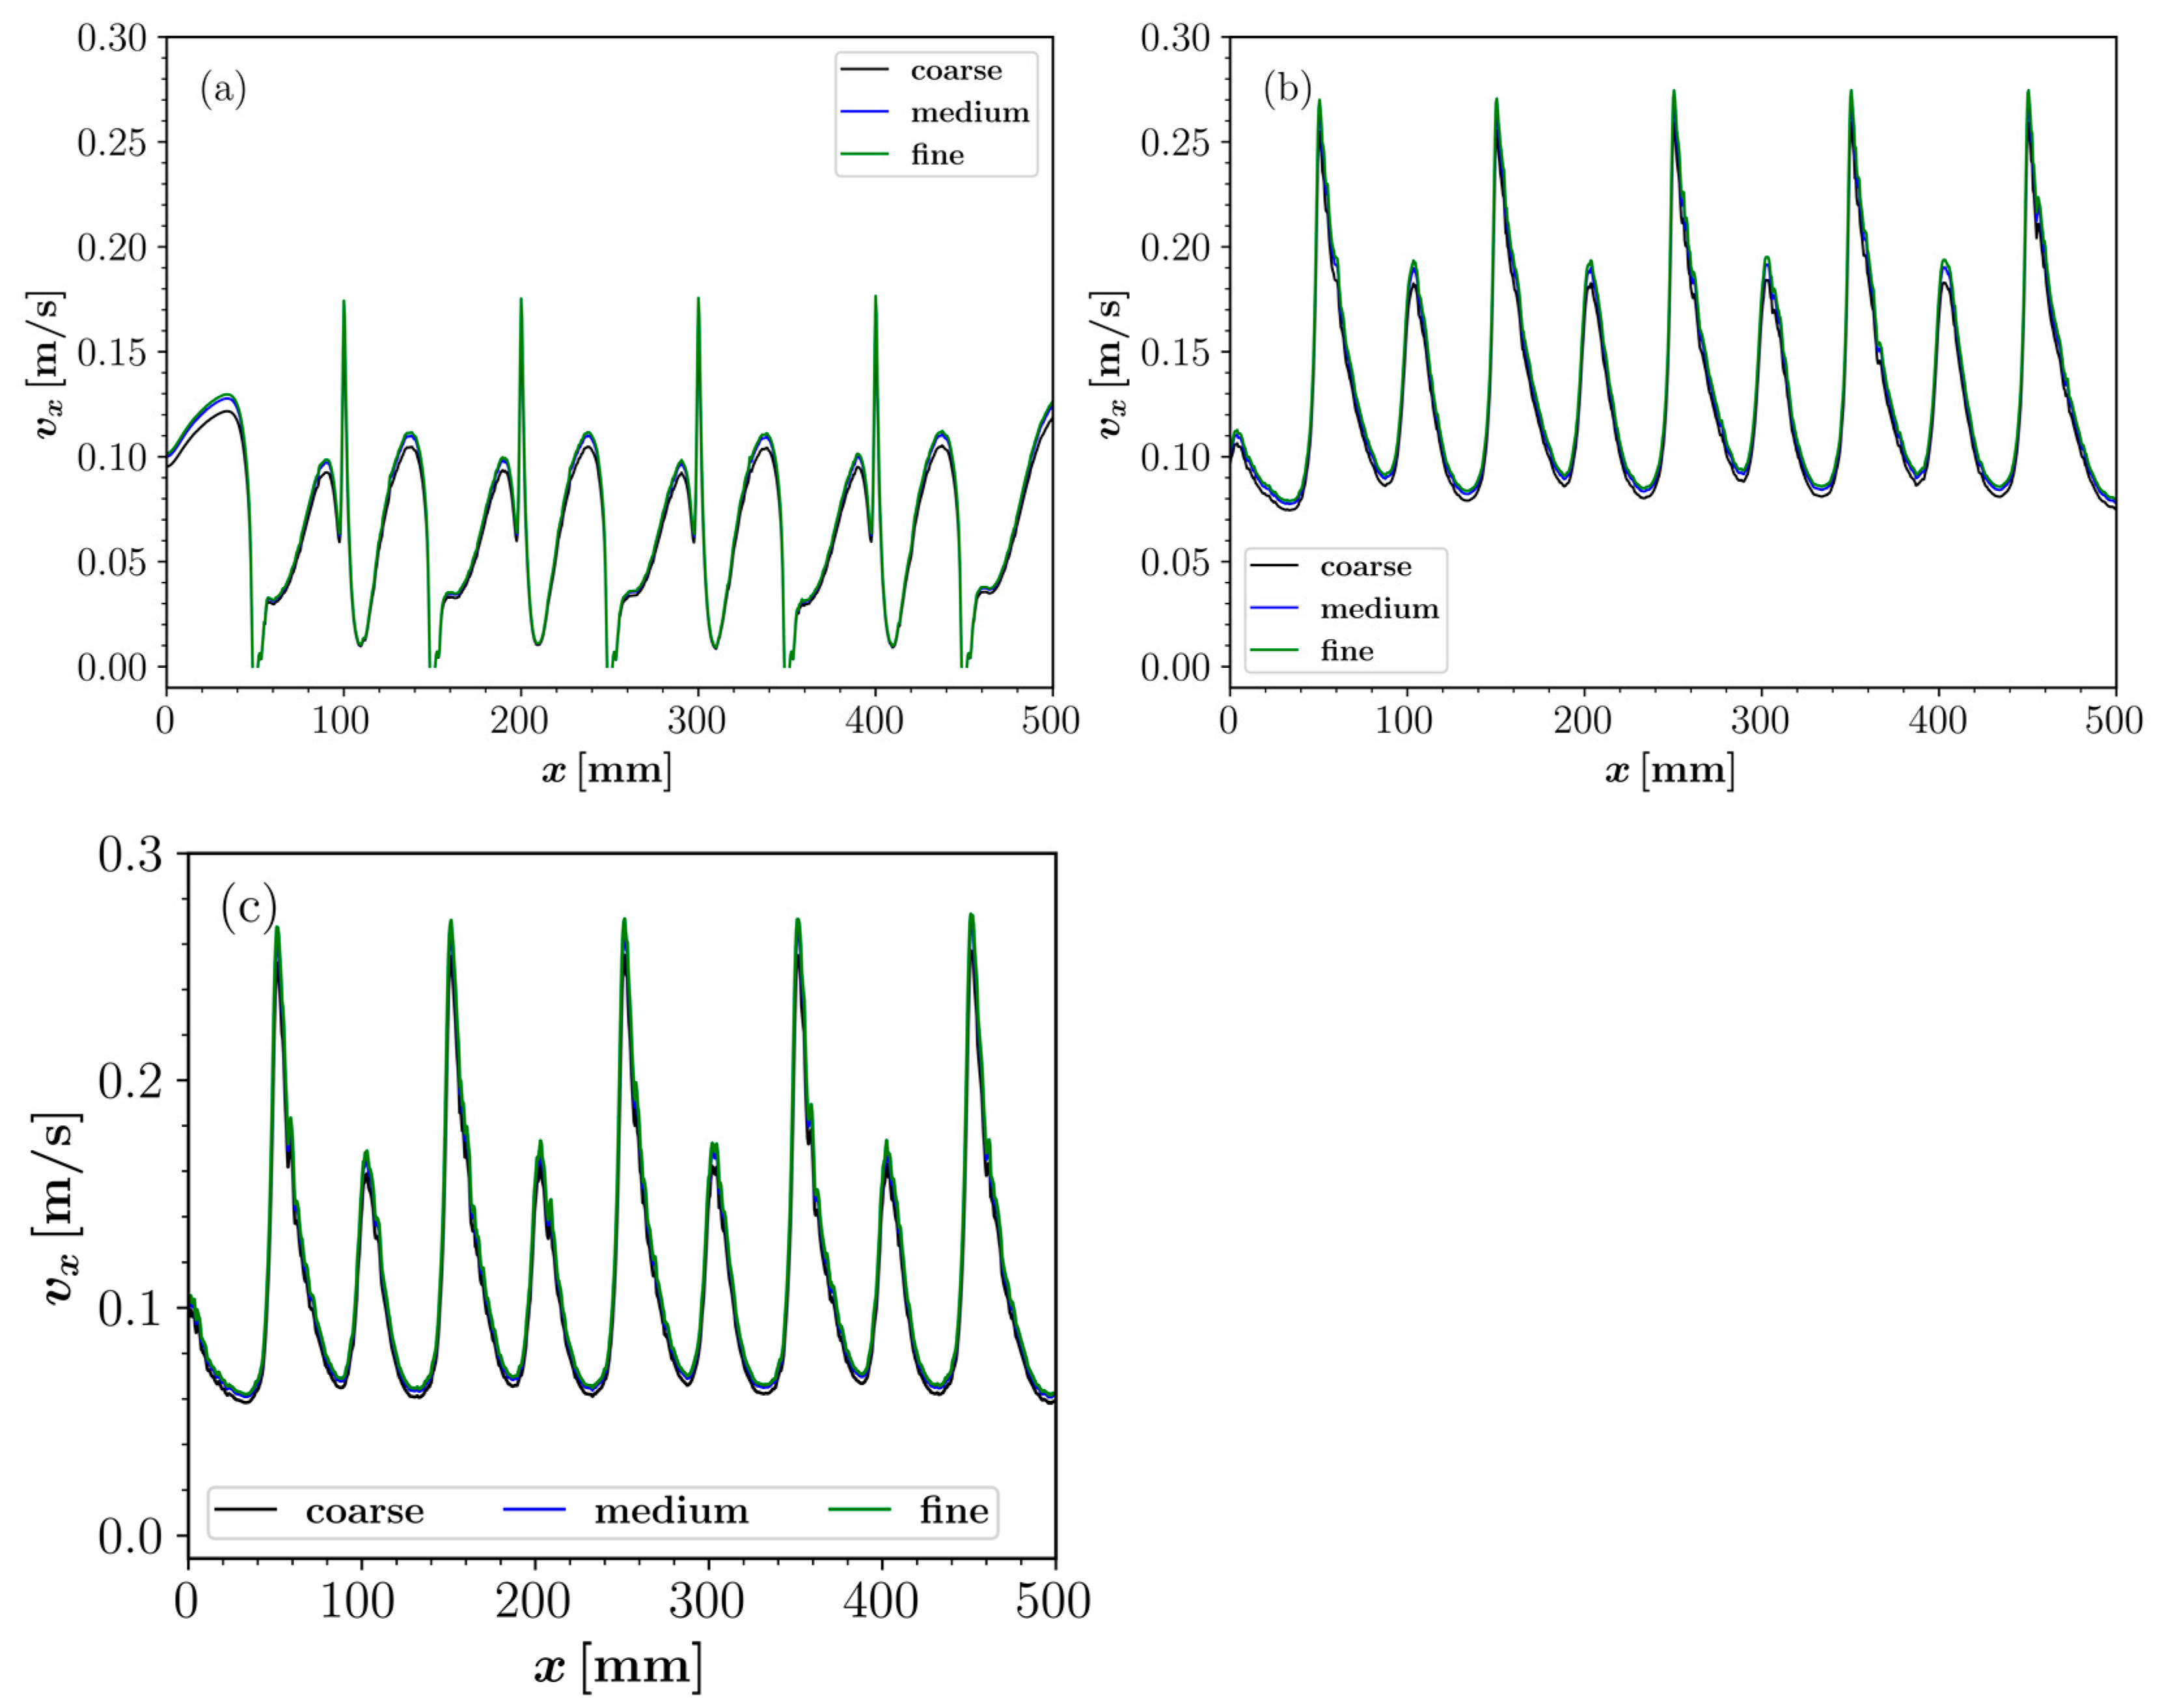
For the described geometry, the mesh independence test is done by testing coarse, medium, and fine mesh with 115,000, 172,000, and 229,000 cells, respectively. The time step size for the coarse mesh is 0.035   s while for the medium and fine mesh it is 0.1   s and 0.30 s, respectively, which sets the Courant number Co = ( | v | Δ t ) / h of the problem equal to 0.20 . For the simulations presented in this subsection the flow velocity and Reynolds number are kept at v = 0.1   m / s and Re = ρ | v | D μ = 1850 . The aim of this subsection is to find a mesh with better accuracy and less computational expense.
The mesh convergence is checked by plotting the velocity profiles along the length at the center, near the top and bottom walls. The velocity profiles are shown in Figure 4. A slight difference can be observed in the velocity profiles of the coarse mesh while the solutions for the medium and fine meshes overlap with each other, which means that the solutions for the medium and fine mesh are mesh-independent. The computational time for the medium mesh is 45 % less than the fine mesh. Therefore, the medium mesh will be used for further simulations in the present work as it exhibits comparable accuracy with considerably reduced computational effort.

3. Results

3.1. Validation with Experimental Data

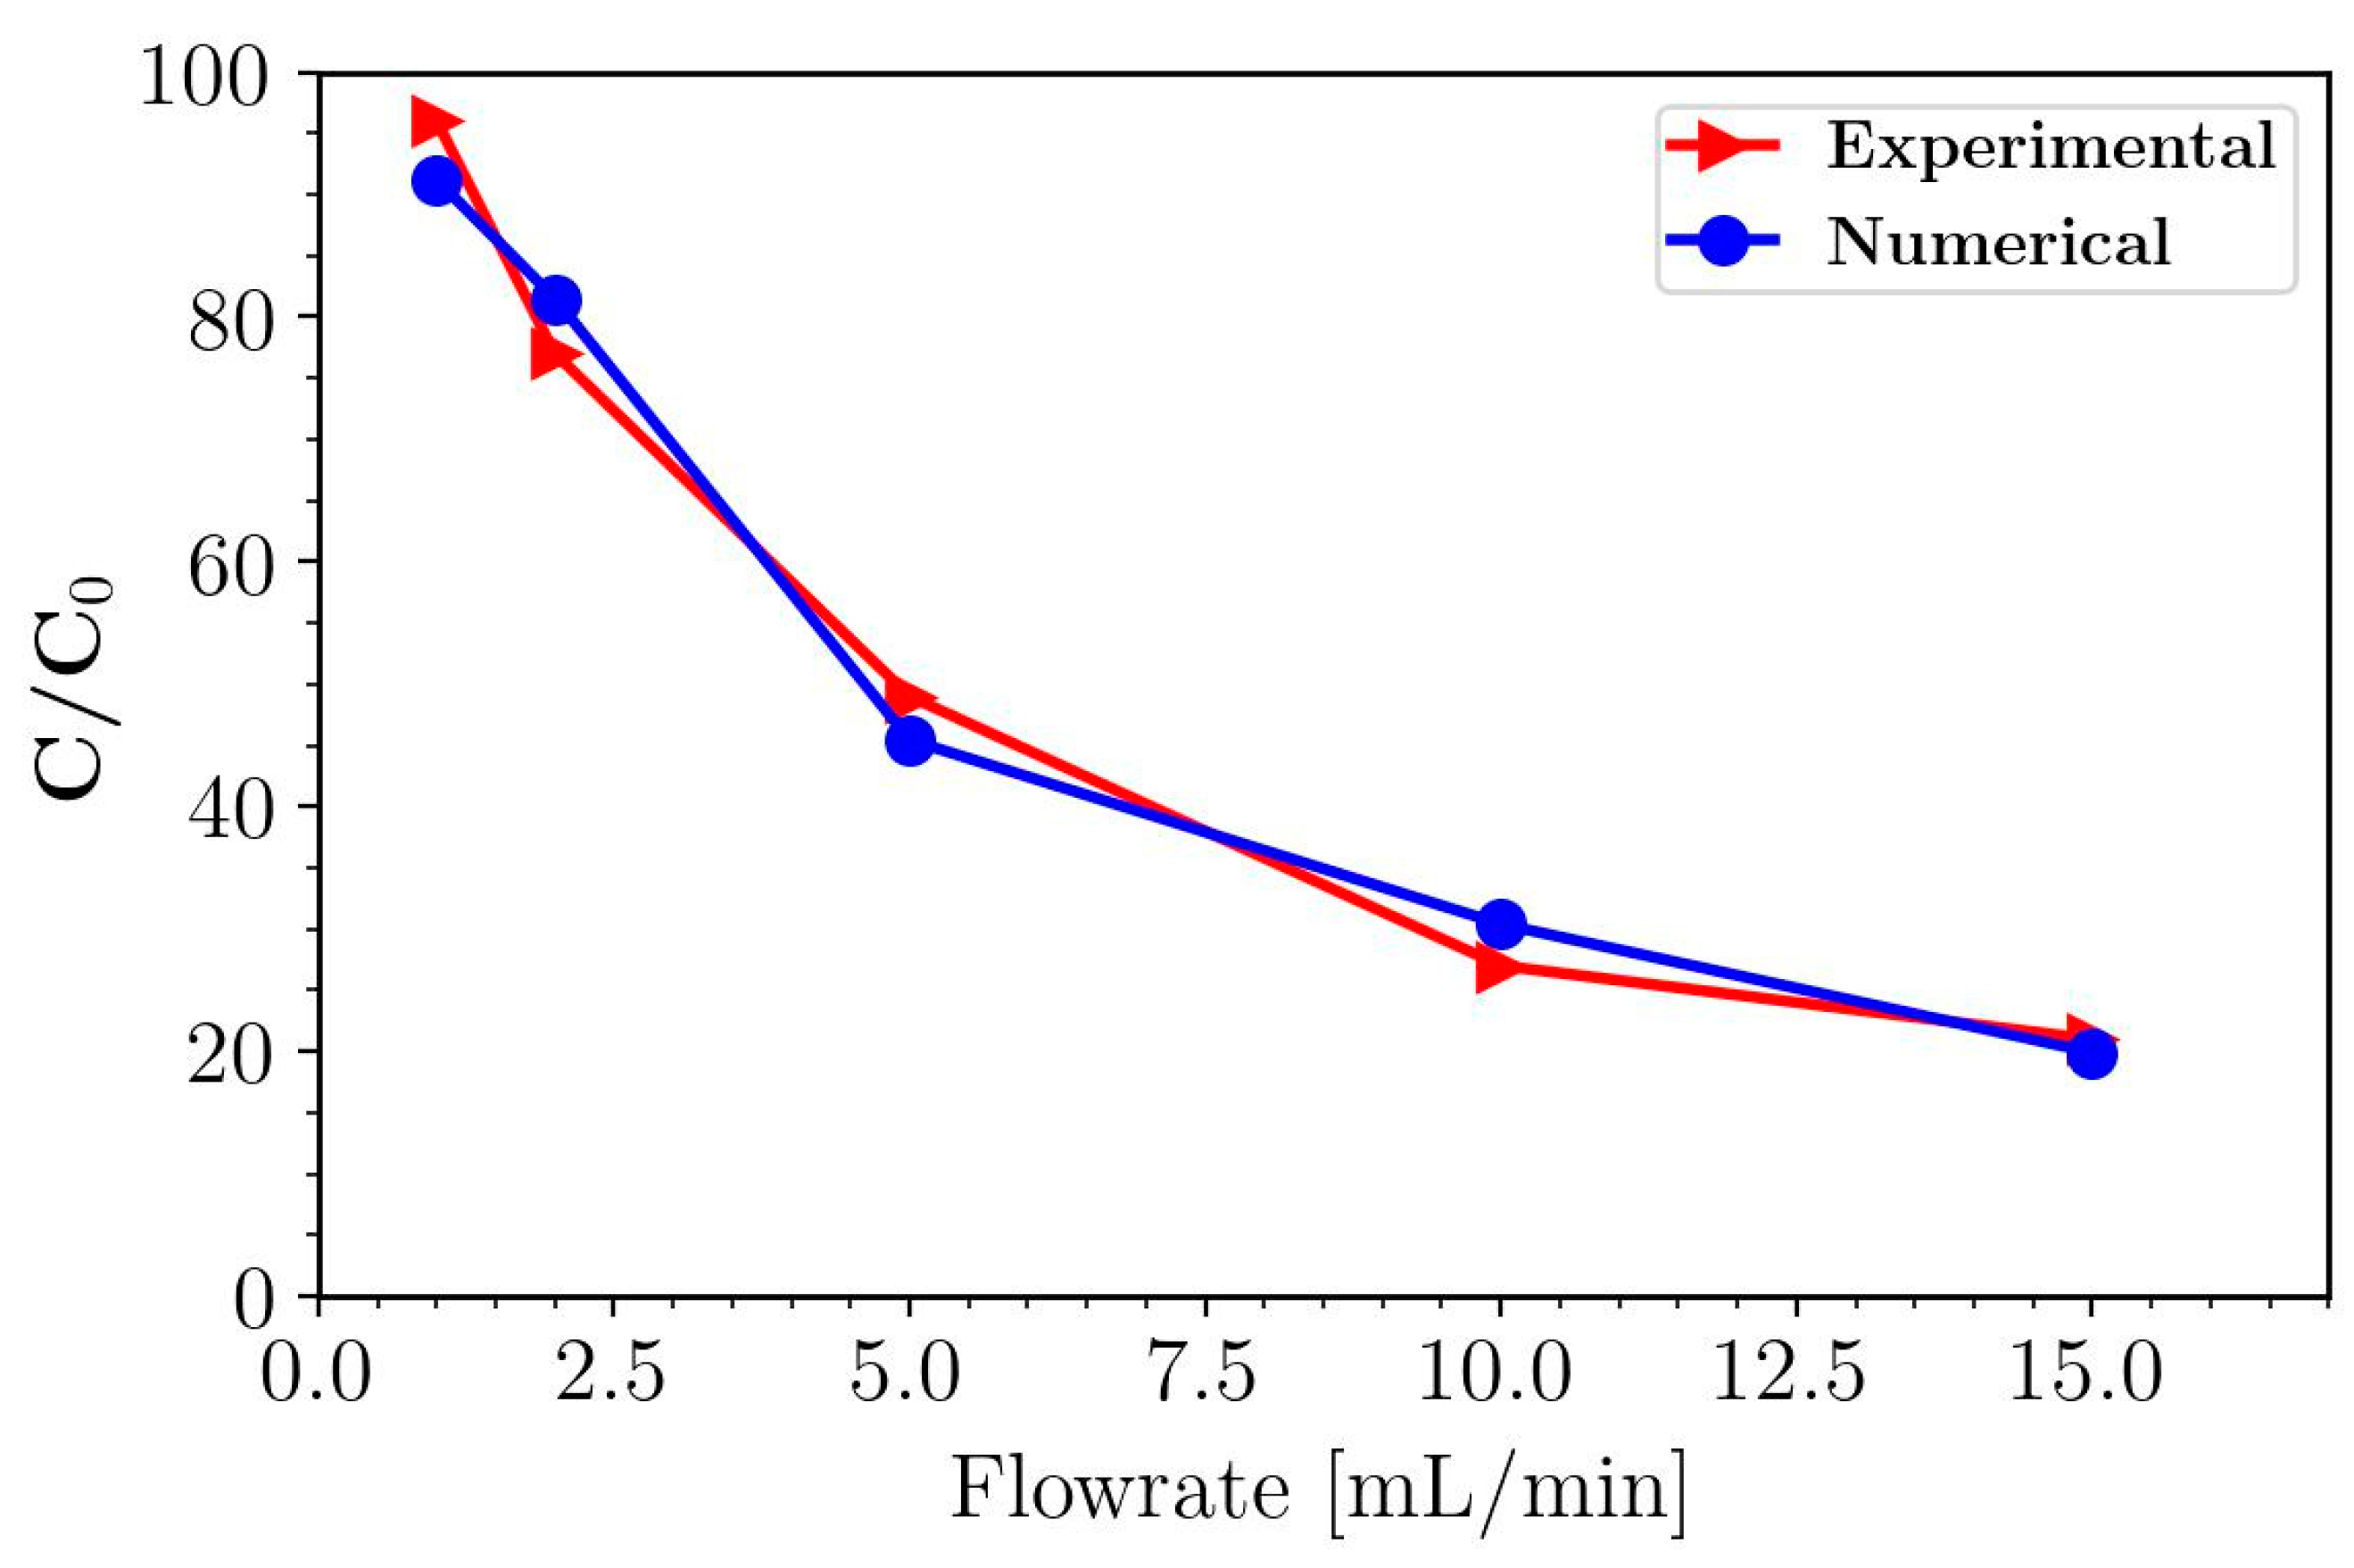
Experimental investigations were performed to validate the developed CFD model of the photocatalytic reactor. The degradation performances obtained from experimental measurements and numerical simulations at different inlet flowrates are compared in Figure 5. The numerical predictions are in good agreement with the experimental results, with less than 7% percentage error at all flowrates. The percentage error is calculated as ( ω exp ω num ω num ) × 100 , where ω exp and ω num represent the percentage removal of the pollutant for the experimental and numerical investigations, respectively. The difference between the experimental and numerical calculations is subjected to planar geometry and numerical error. The negligible discrepancy in the results indicates the suitability of the CFD model to accurately predict the behavior of the reactor and gives us confidence to use this model for further analysis.

3.2. Effect of Light Distribution

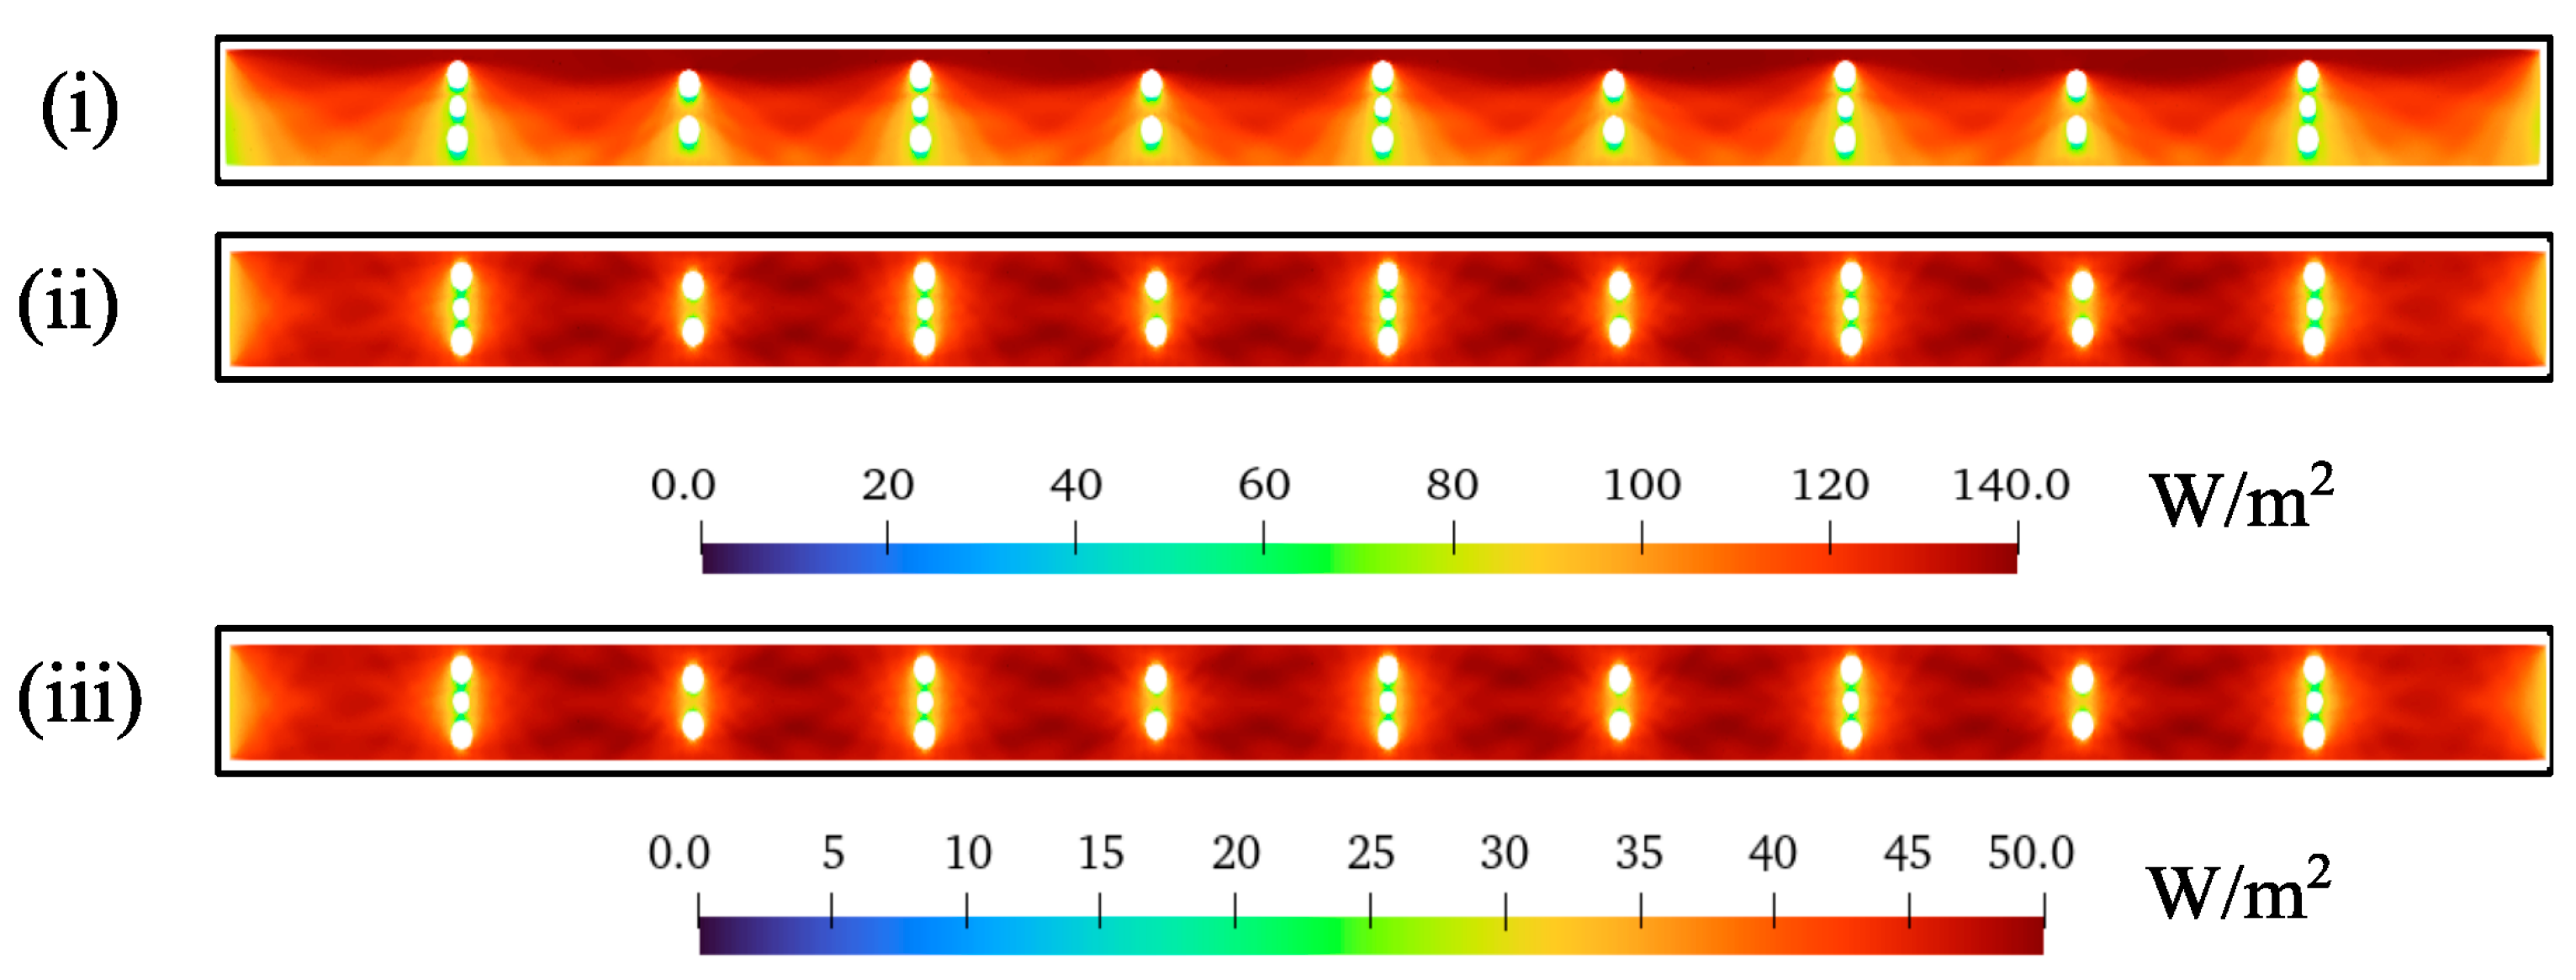
In order to investigate the effect of light irradiation configurations on the degradation process in the studied reactor setup, the simulations were performed for the three cases where (i) light ( 100   W / m 2 ) was directed only to the top wall of the channel, (ii) light ( 100   W / m 2 on each and total light intensity 200   W / m 2 ) was directed to both the top and the bottom wall, and (iii) light ( 50   W / m 2 on each and total light intensity 100   W / m 2 ) was directed to both the top and the bottom wall. The contours of the light distribution are shown in Figure 6.
Figure 6 shows that there is a clear difference in the light distribution when both the top and bottom walls were irradiated (ii) and (iii) compared with when only the top wall was irradiated (i). In case (i), the light is incident primarily on the top sphere of each vertical layer of spheres, while the spheres away from the top wall receive a lower light intensity. Therefore, the light distribution over the entire channel is uneven. This limited light penetration significantly affected the degradation process. In contrast, the light distribution was significantly improved by applying light boundary conditions to both walls. As in case ii, a more uniform light distribution was observed across the channel. The center sphere in each vertical layer of three spheres still received slightly less light, but most spheres received significantly higher and more uniform light exposure than when irradiated with only one wall. Figure 6 shows that maximum light intensity is reached 140   W / m 2 near the center of the channel due to the light reaching the center from both walls.
The effect of light distribution was evaluated by analyzing the molar concentration of MO throughout the channel. The contours of the molar concentration of MO are shown in Figure 7. Case i showed a smaller decrease in MO concentration. This can be attributed to the non-uniform exposure of the spheres to light, which hindered the photocatalytic process. On the other hand, cases ii and iii showed a significant decrease in molar concentration. This increase in degradation can be attributed to the improved light distribution, which effectively activated the sites of the photocatalyst for an efficient degradation process, even though the light intensity is the same in cases i and iii. The study was performed at v= 0.1 m/s with an initial concentration of methyl orange of 2 mmol/L. The residence time analysis showed that the reaction order was first order. The calculated reaction rate constant is 1.75 min−1. The mass transfer coefficient was calculated using the equation [ ln c * c *     c   =   k L A V t ] [30], and the value is 2.37 × 10⁻⁶ m/s. where V shows solution volume (m3), A is coated area (m2), c (mg/L) is a concentration in the bulk at the time of t (s), and c* is a concentration near the solid–liquid interface (mg/L). The results showed that uniform light irradiation significantly influenced the degradation process. Therefore, the reactor can achieve maximum photocatalytic performance with an optimized light configuration. Moreover, CFD is an efficient tool to gain valuable insights into the patterns of light distribution in complex reactor systems.

3.3. Effect on Flow Characteristics

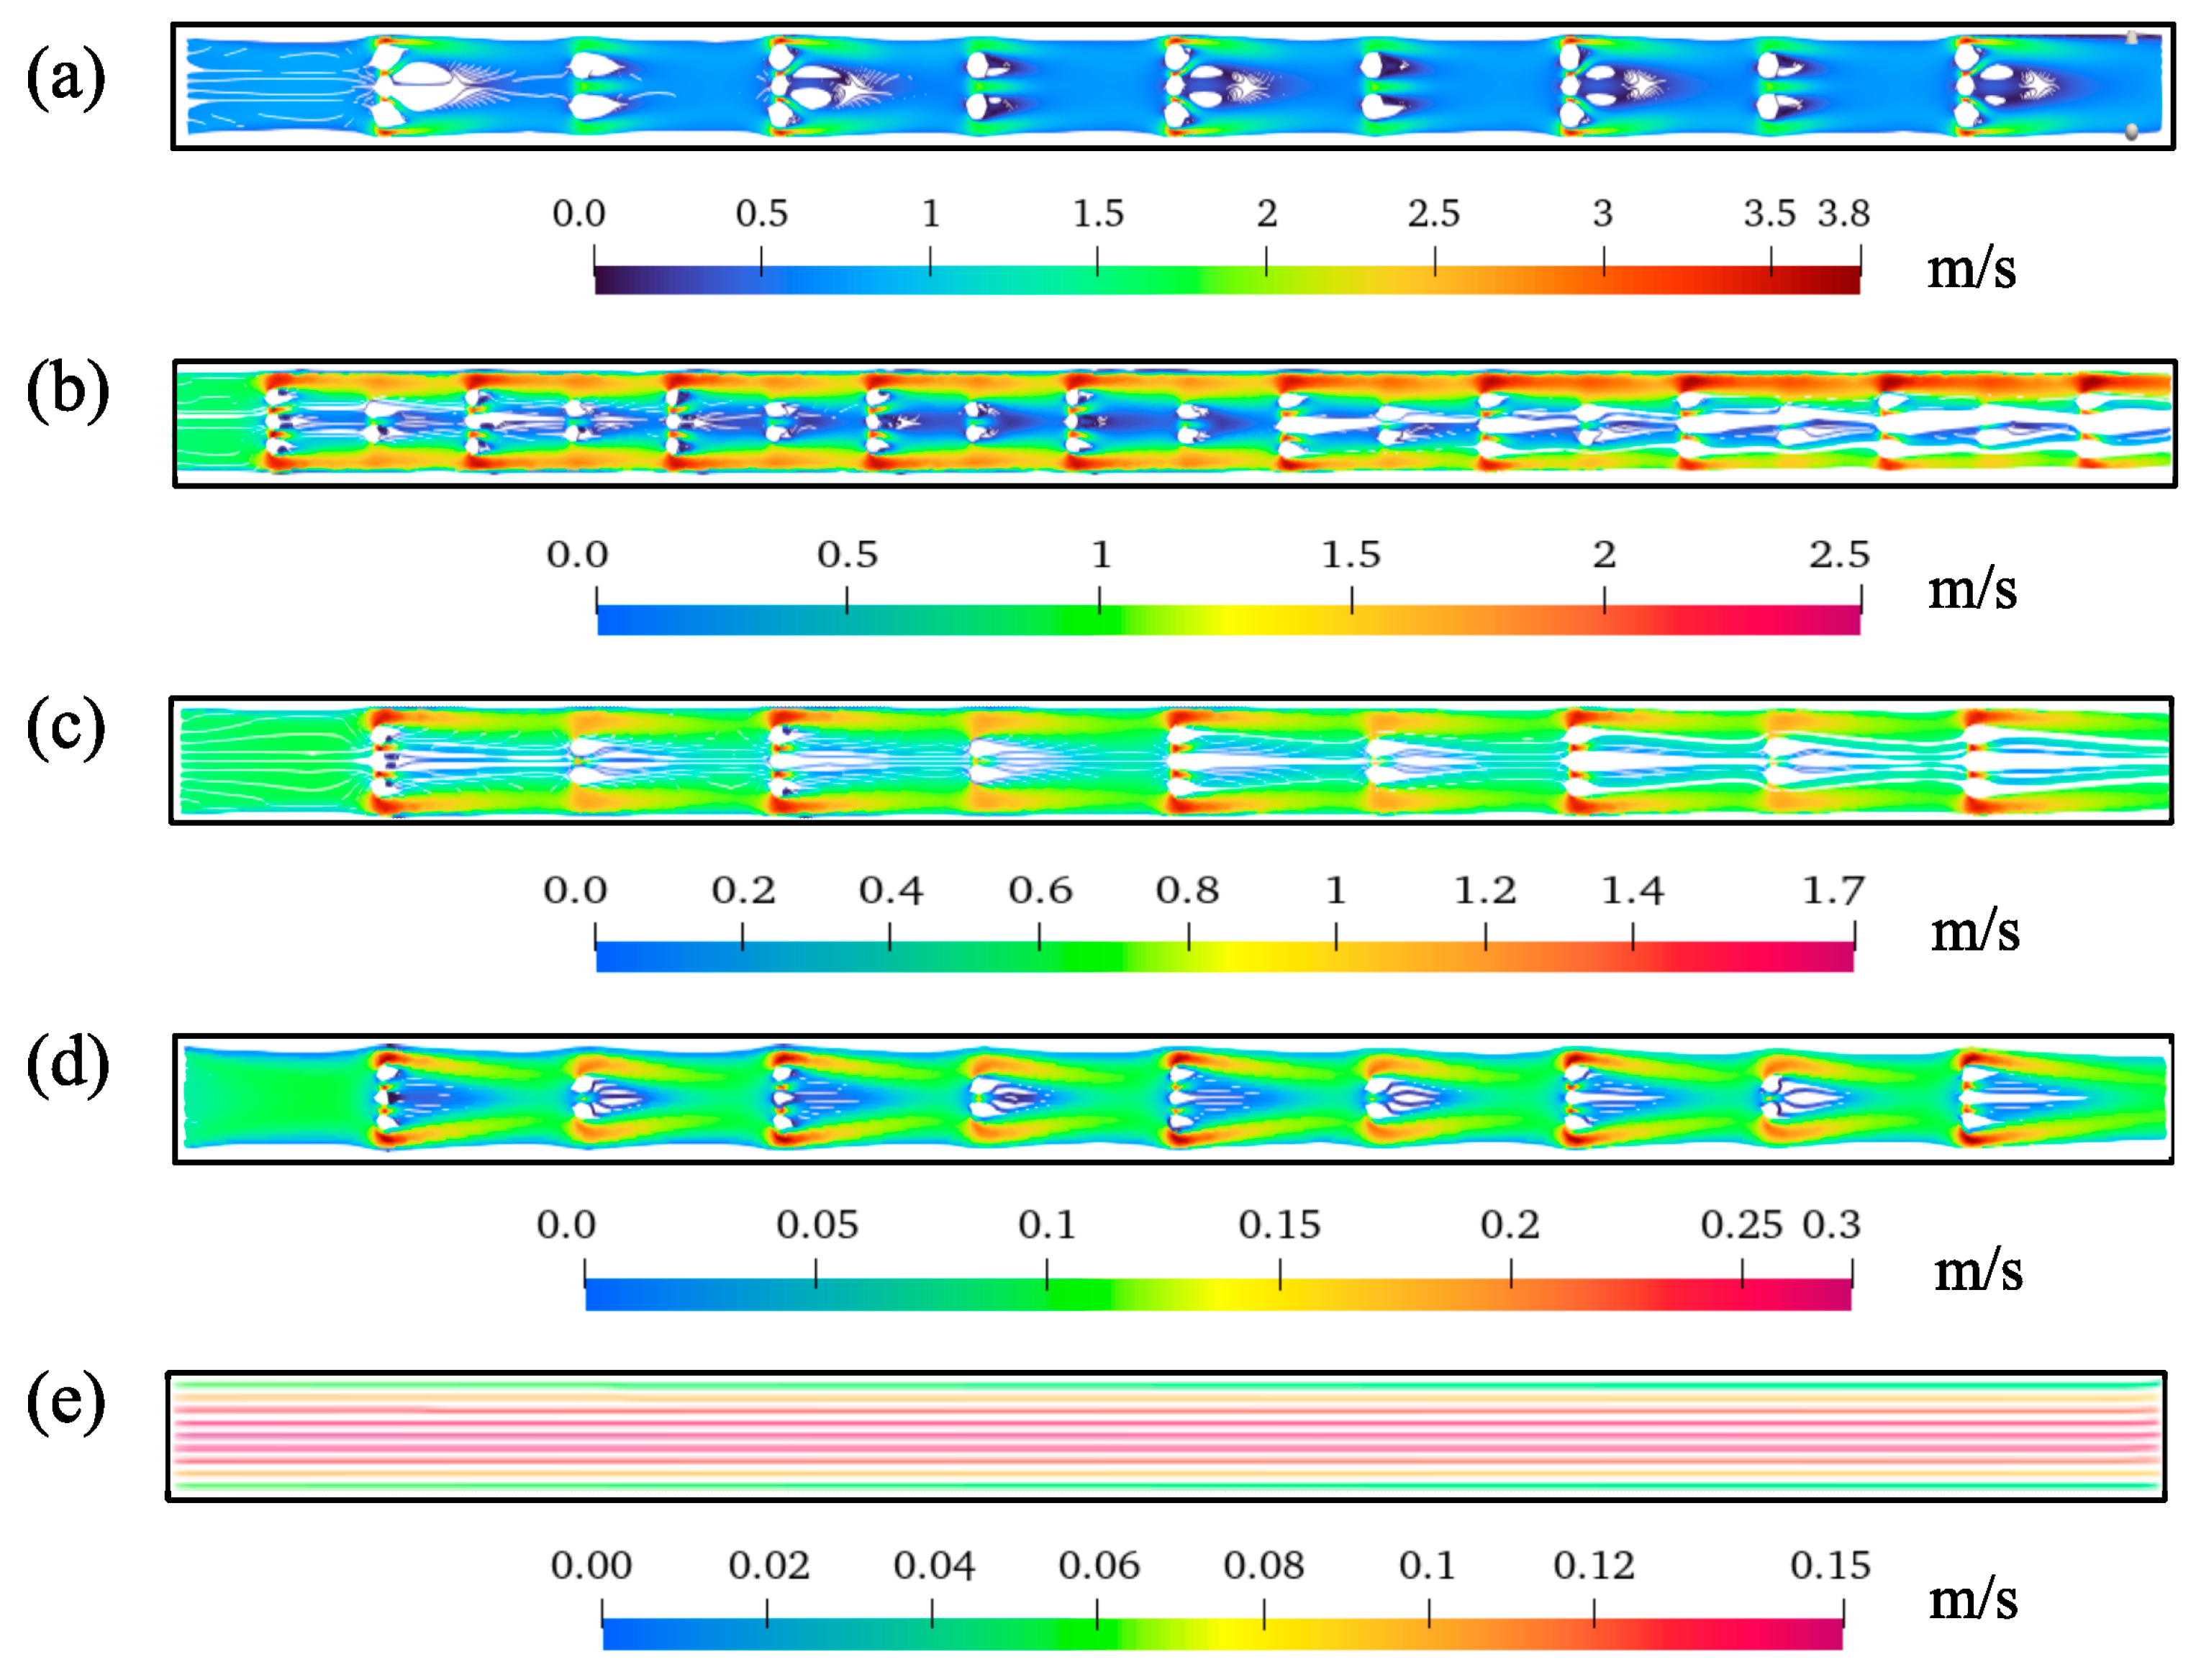
The simulations are performed for five different cases of the reactor channel: (a) a reactor with 23 spheres of different diameters ( 4   mm and 5   mm ); (b) a reactor with 48 spheres of 3   mm in diameter, and the horizontal distance between them is halved; (c) a reactor with 23 spheres of 3   mm in diameter with v = 0.4   m / s ; (d) the same reactor as case (c) and v = 0.1   m / s ;   and (e) plain reactor with no spheres. The inlet velocities and Reynolds number Re = ρ v D μ for the cases a, b, c, and e are set 0.4   m / s and Re = 7400 , while for the case d, the v = 0.1   m / s and Re = 1850 .
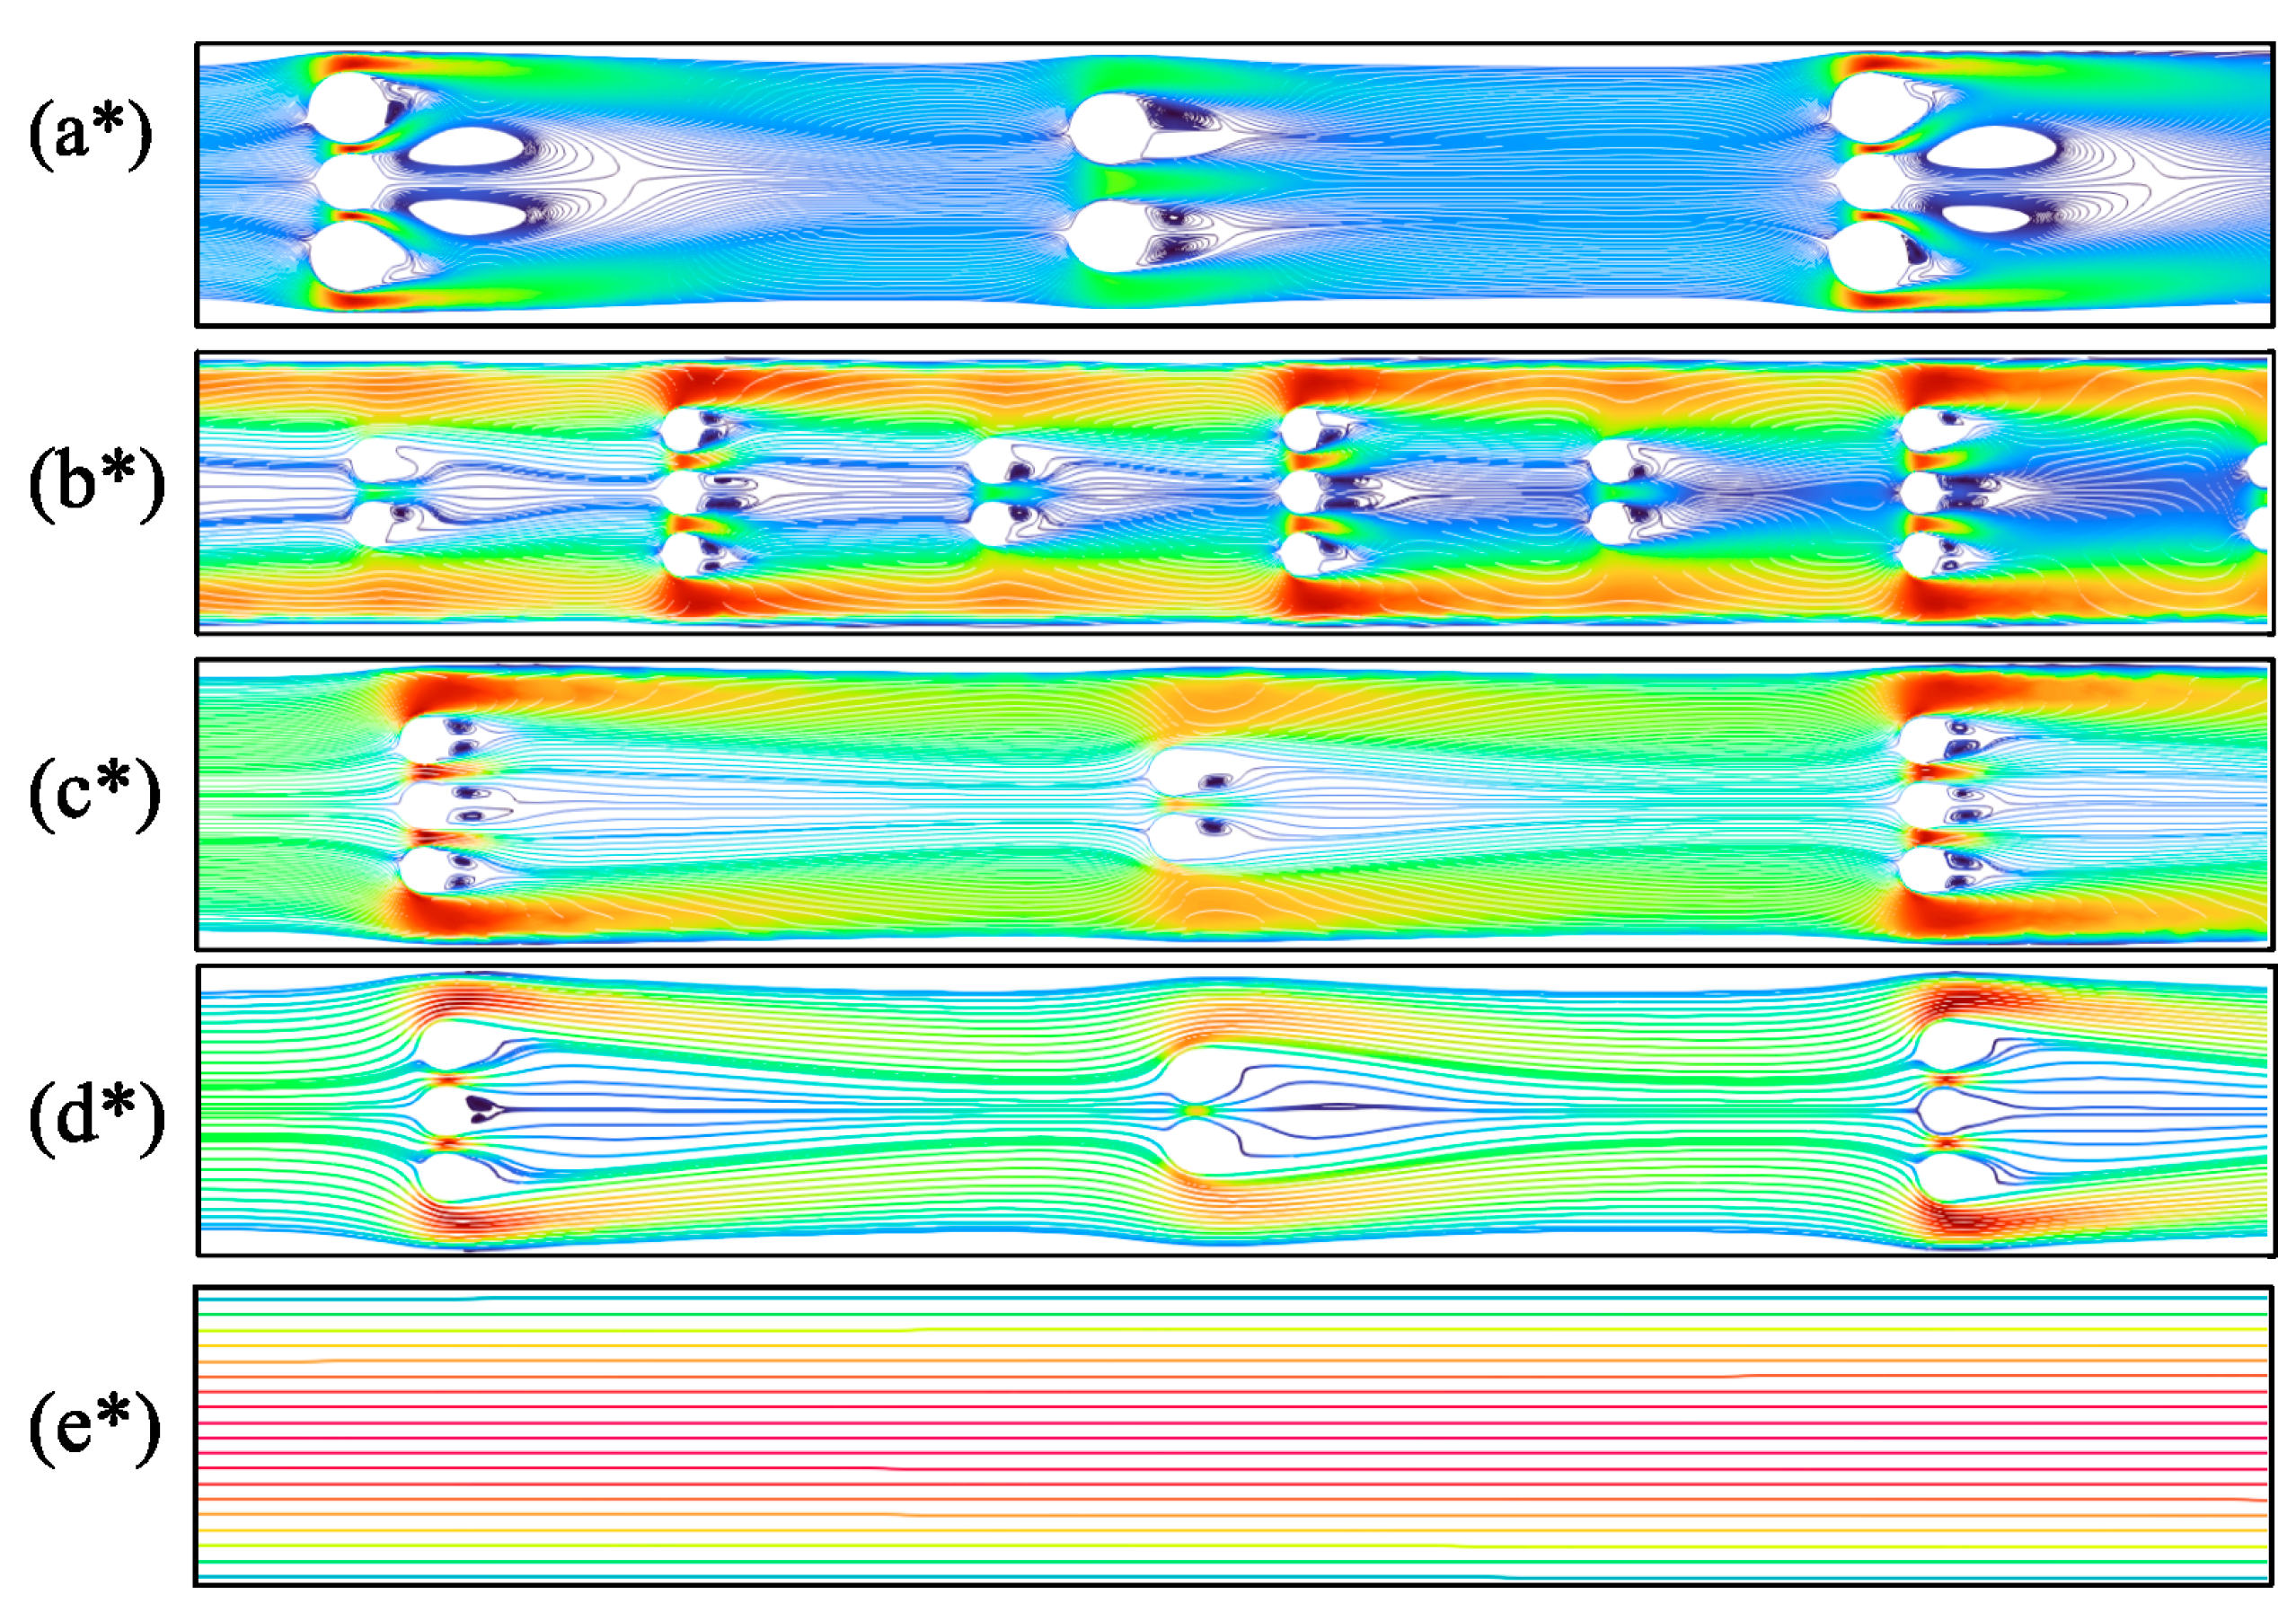
The streamlines for the velocity fields in all the above-mentioned reactor geometries are presented in Figure 7. For better visualization, the streamlines in a small region of the reactor are displayed in Figure 8 and zoomed in versions are displayed in Figure 9. The wall velocity significantly varies in each studied case depending on the inlet velocity, the distance between the spheres, and their sizes. The highest velocity was observed in case (a), where the velocity increased to 3.8 m/s. The spheres act as a blockage in the flow path and create high turbulence areas due to flow separation and recirculation around them. The vertical layer of the spheres significantly reduces the cross-sectional area of the channel. As the flow is incompressible and ρ remains constant, mass conservation demands that the change in area affect the velocity so that the mass flow Q = ρ A v can be conserved throughout the channel [33,34]. Therefore, the figure shows higher velocity values in regions with reduced cross-sectional area.
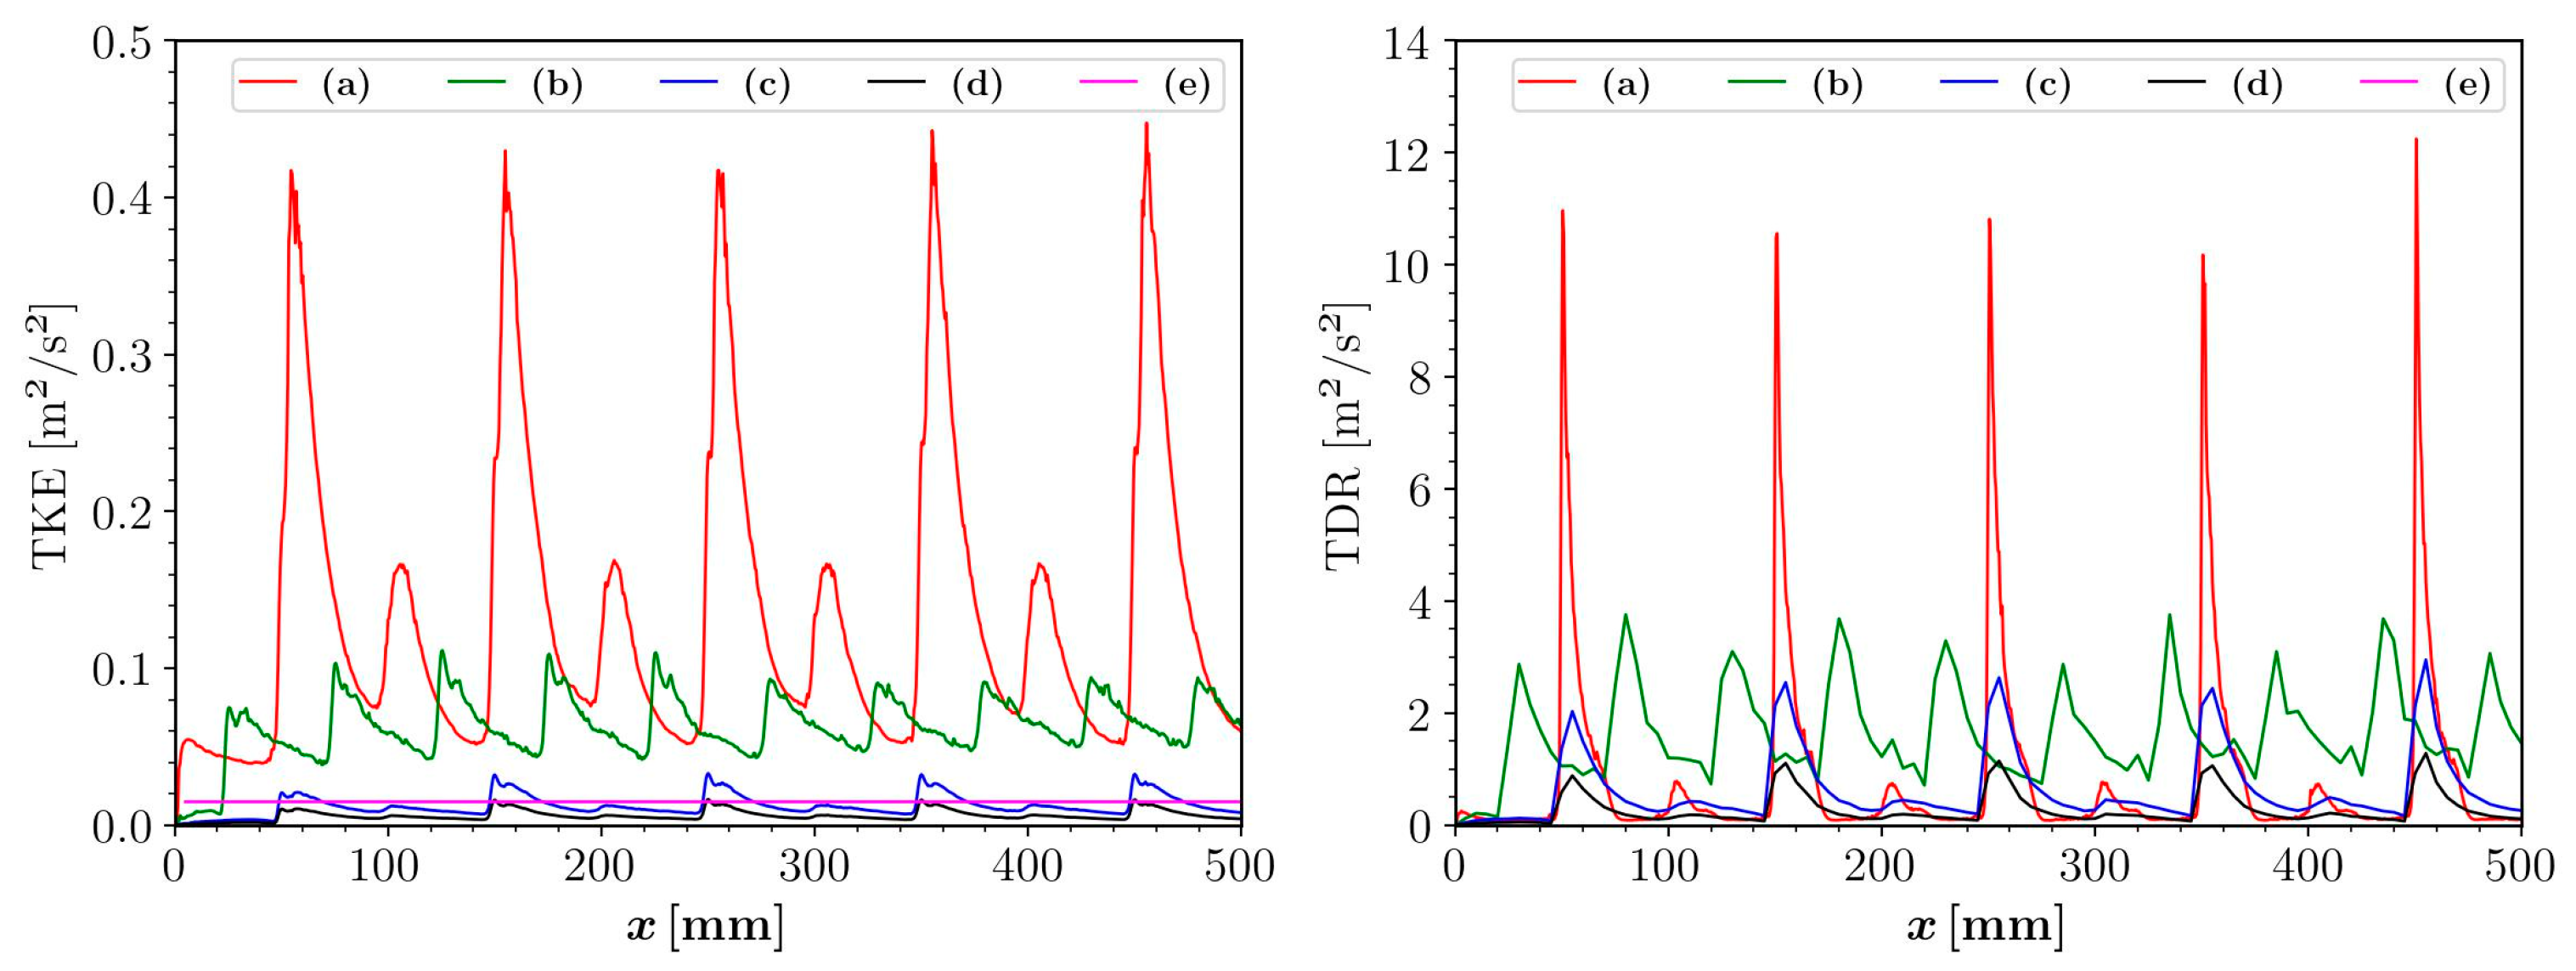
Turbulent kinetic energy (TKE) is a quantitative measure of the intensity of turbulence fluctuations in a flow [35], whereas turbulent dissipation rate (TDR) assesses the rate at which TKE is dissipated due to the viscous effect. For all the cases, the influence of distance between the spheres and the sizes of the spheres on the TKE and TDR is investigated numerically, and the results are presented in Figure 10. As can be seen in the figure, case A has the highest TKE value ( 0.42   m 2 / s 2 ) , which means that the TKE increases when the larger spheres are included. For case b, the TKE is increased when the spheres are placed closer to each other. The plain reactor has a constant TKE throughout the channel as it contains no obstruction to the fluid. Similar to the TKE, higher TDR values were also found in cases a and b.
The TKE has higher values in the regions closer to the walls of the three spheres, since the spheres act as flow obstacles, causing a velocity gradient and consequently generating turbulent kinetic energy through the phenomenon of viscous dissipation. The presence of three spheres reduces the cross-sectional area of the channel, which further increases this effect and leads to high peak TKE values compared with two spheres. For two spheres placed vertically, a larger area is available for the flowing fluid. Therefore, the TKE value is lower in this area, resulting in lower turbulence intensity. The results also show a consistent trend of high TKE value peaks near three spheres and comparatively lower peaks near two spheres throughout the channel. The above investigations revealed that the sphere size significantly impacts the hydrodynamics of the reactor. Therefore, the use of optimum-sized glass beads or different sizes of glass beads within the same reactor for photocatalyst deposition can enhance the mixing process.
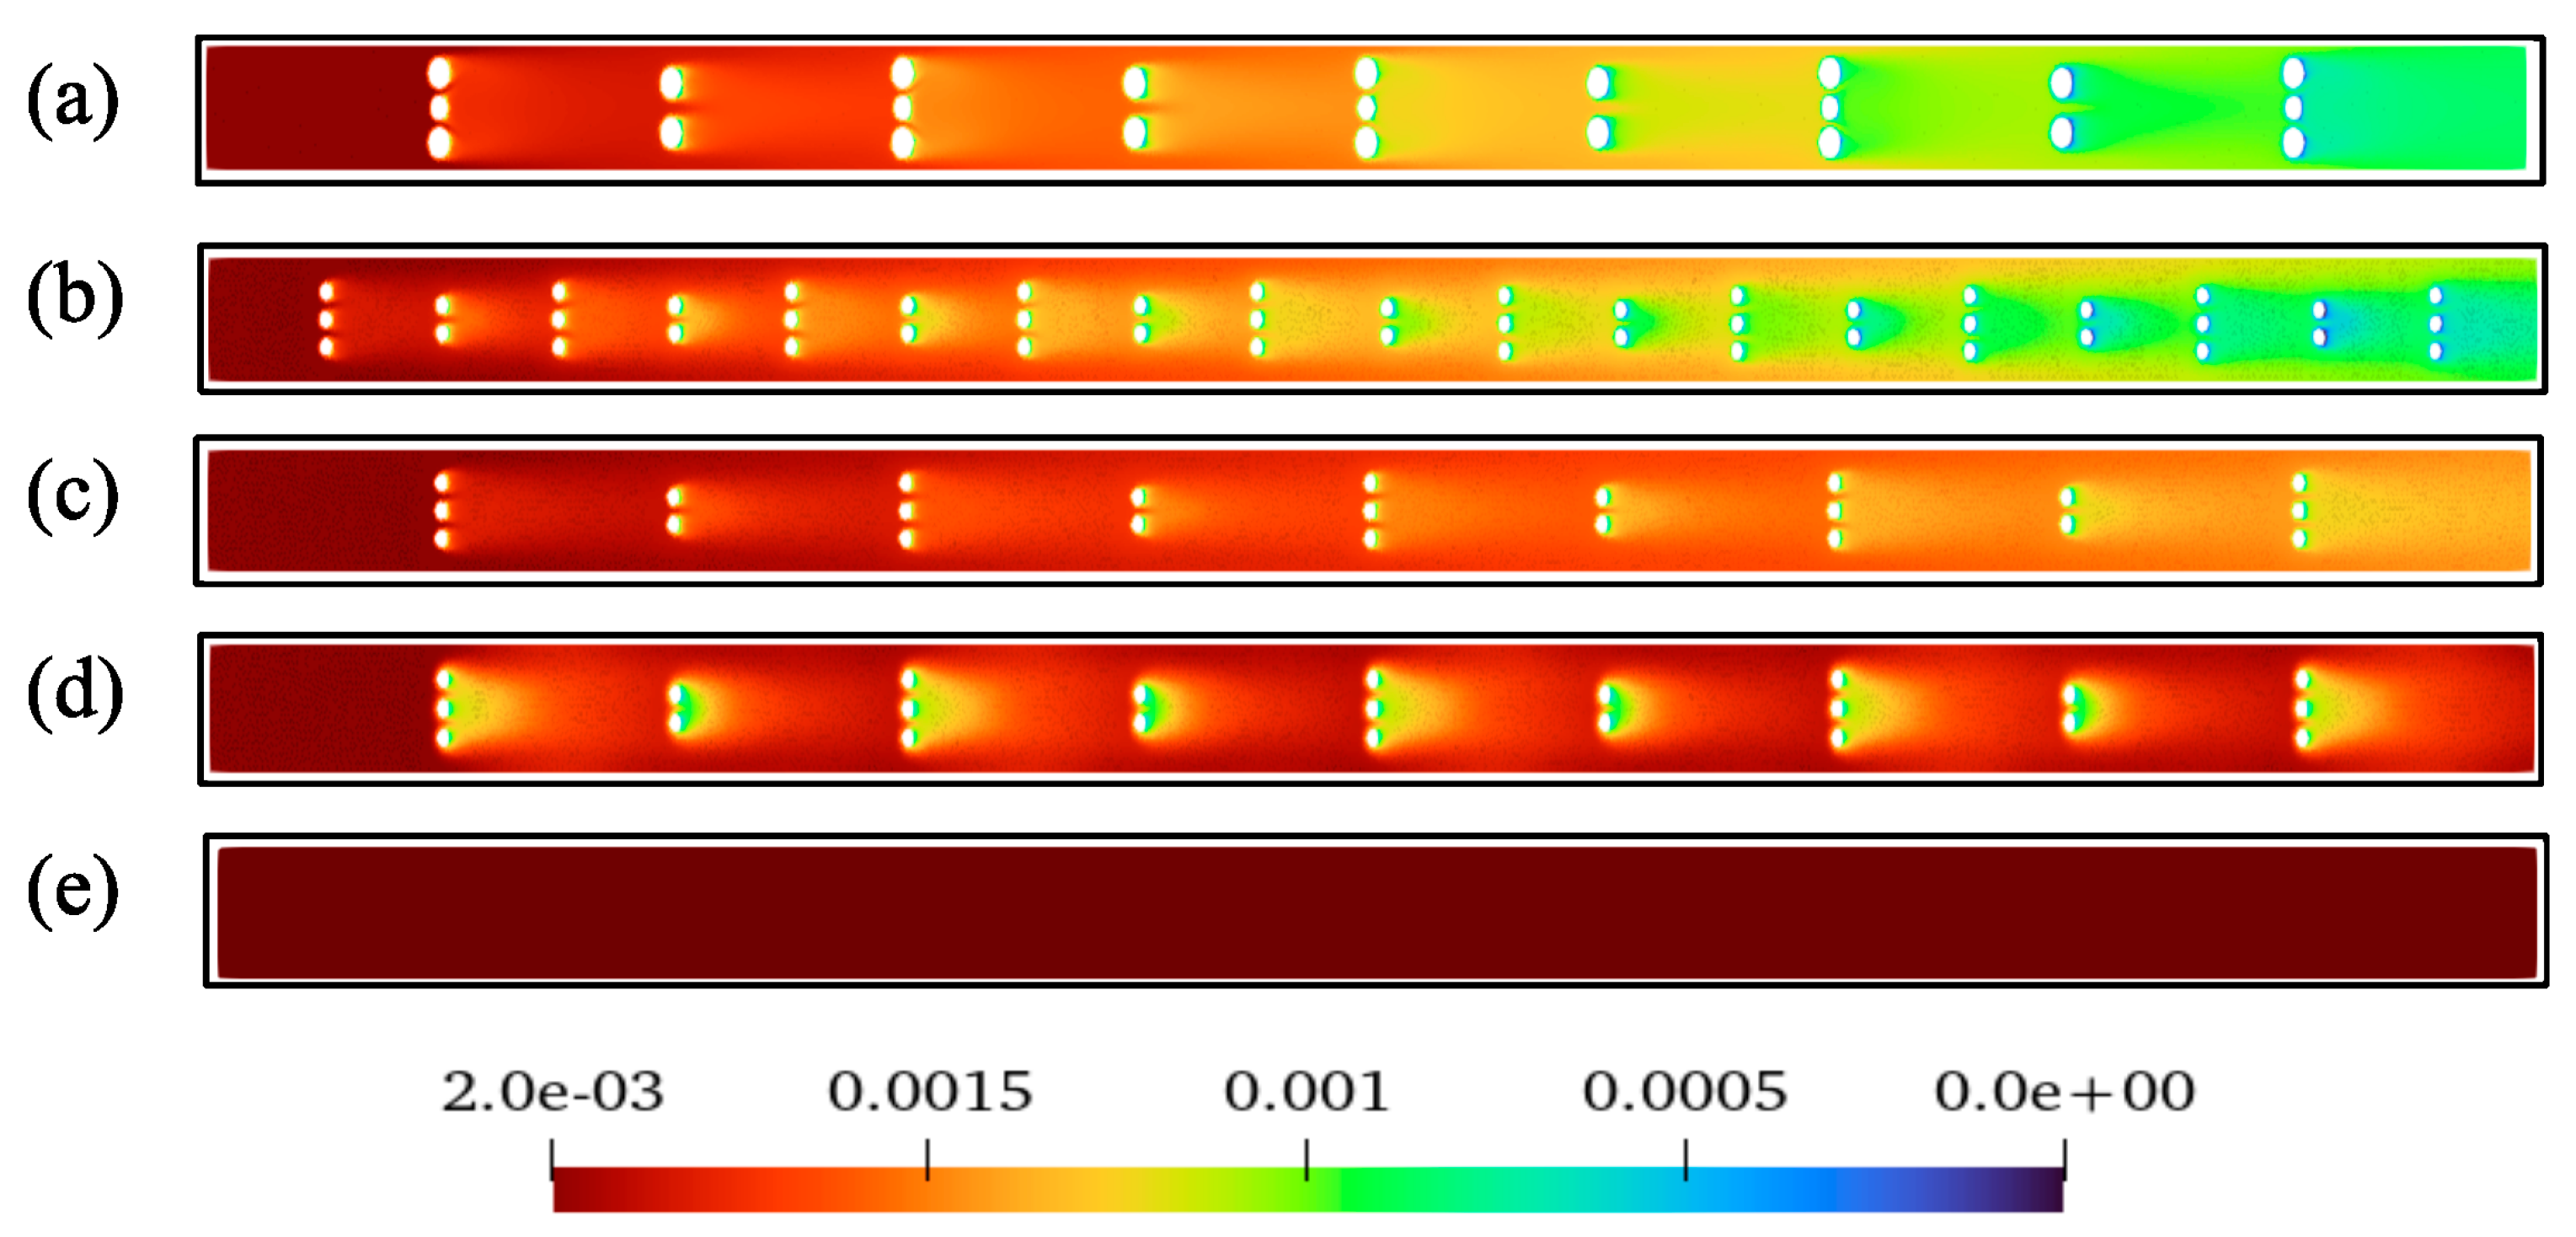
For all the cases, the contours of the molar concentration distribution of MO in the photocatalytic reactor channel are displayed in Figure 11. The molar concentration of MO decreases in all cases except in the plain reactor. The plain reactor has no beads, and hence, no photocatalyst is present in that simulation. The decrease in molar concentration in all other cases indicates degradation of the pollutant by photocatalysis on the surface of the spheres. The results are consistent with the previously mentioned results of the TKE and velocity streamlines. The cases with a larger sphere size (case a) and a smaller inter-sphere distance (case b) have a lower concentration at the outlet compared with the other cases. This can be attributed to two factors: firstly, the increased surface area of the photocatalyst and the availability of more active sites for the reaction; and secondly, the increased turbulence, as previously described in the TKE section, as these configurations can increase the turbulence intensity. The molar concentration is lower near the walls of the reactor on the outlet side, as the liquid flows through the spheres and vortices are formed here, which improve mixing and thus mass transfer. The molar concentration in case d at Re = 7400 is lower than in case c at low Re = 1850 , which shows that the turbulence promoters, which are spheres in the present work, significantly improve mass transfer [26,36,37]. The mass transfer coefficient was calculated for all the cases: (a) 2.37 × 10⁻⁶ m/s, (b) 2.14 × 10⁻⁶ m/s, (c) 6.53 × 10⁻⁸ m/s, and (d) 9.12 × 10⁻⁹ m/s. The high mass transfer coefficient promotes the adsorption of organic compounds on the photocatalyst surface. The photocatalytic degradation process is influenced by a lot of operating parameters. Therefore, optimizing hydrodynamics to achieve maximum mass transfer is one factor, and another is the photocatalyst’s surface area, crystallinity, and loading on glass spheres. A catalyst with a high surface area provides more active sites for adsorption, while crystallinity also plays a significant role as nanoflowers have a high surface area that has more exposed area for pollutant to adsorb [38]. Consequently, high degradation was achieved. The use of a suitable substrate for the immobilization of the photocatalyst not only eliminates the process of recovering the photocatalyst after treatment but also significantly improves the flow properties of the reactor. Studies have shown that closely spaced spheres of different sizes have high hydrodynamic parameters, and considering different sizes of closely spaced spheres is a practical approach.

4. Conclusions

The hydrodynamics, mass transfer, and light distribution were investigated in a photocatalytic reactor with TiO2-coated spheres using CFD analysis. The simplified 2D geometry with few spheres allowed the investigation to be done with less computing time and power. The simulations focused on key flow parameters, such as local velocity streamlines, turbulence kinetic energy, and turbulence dissipation rate, to evaluate the hydrodynamic behavior of the reactor. Moreover, the effects of two light configurations on the light distribution in the channel were also investigated. The simulation showed that the case with a larger sphere size has higher hydrodynamic parameters. A larger sphere results in a smaller cross-sectional area for the fluid flow. We also investigated the effects of two light configurations on the light distribution in the channel and, consequently, an increase in TKE, TDR, and maximum velocity. The high hydrodynamic parameters indicate fluid recirculation and promote mass transfer. Therefore, the lowest MO concentration was observed at the outlet. Furthermore, the analysis of the light distribution revealed a significant dependence on the irradiation configuration. Irradiation of the top wall led to non-uniform light distribution, as the spheres further away from the wall received comparatively less light. In contrast, more uniform light distribution was obtained with two irradiated walls, which significantly improved the accessibility of light to most spheres. As a result, a lower MO concentration was observed at the outlet of the reactor channel. The analysis of hydrodynamics, mass transfer, and light distribution at different velocities, sphere distances, and sizes showed the interaction of these parameters and provided information for the optimization and scale-up of this technology. The use of glass spheres together with an optimized light configuration is a promising solution, as they are chemically compatible with photocatalysts such as TiO2, provide a large surface area for adsorption, and are commercially available in different sizes and surface properties. This study also provides a solid basis for analyzing complex reactor geometries.

Author Contributions

Conceptualization, Q.J. and L.M.; methodology, Q.J.; software, Q.J and K.B.R.; validation, Q.J.; formal analysis, Q.J. and K.B.R.; writing—original draft preparation, Q.J.; writing—review and editing, K.B.R. and L.M.; visualization, K.B.R.; supervision, L.M.; funding acquisition, L.M. All authors have read and agreed to the published version of the manuscript.

Funding

Funding for this research is provided by the Slovenian Research and Innovation Agency (ARIS) within the framework of the Young Researcher program, research program groups P1-0134, P1-0418, and projects L7-1848, J2-4444, and N2-0310.

Data Availability Statement

Data are contained within the article.

Conflicts of Interest

The authors declare no conflicts of interest.

References

  1. Chong, M.N.; Jin, B.; Chow, C.W.K.; Saint, C. Recent Developments in Photocatalytic Water Treatment Technology: A Review. Water Res. 2010, 44, 2997–3027. [Google Scholar] [CrossRef]
  2. Gaya, U.I.; Abdullah, A.H. Heterogeneous Photocatalytic Degradation of Organic Contaminants over Titanium Dioxide: A Review of Fundamentals, Progress and Problems. J. Photochem. Photobiol. C Photochem. Rev. 2008, 9, 1–12. [Google Scholar] [CrossRef]
  3. Miklos, D.B.; Remy, C.; Jekel, M.; Linden, K.G.; Drewes, J.E.; Hübner, U. Evaluation of Advanced Oxidation Processes for Water and Wastewater Treatment—A Critical Review. Water Res. 2018, 139, 118–131. [Google Scholar] [CrossRef]
  4. Wang, J.; Chen, H. Catalytic Ozonation for Water and Wastewater Treatment: Recent Advances and Perspective. Sci. Total Environ. 2020, 704, 135249. [Google Scholar] [CrossRef]
  5. Paździor, K.; Bilińska, L.; Ledakowicz, S. A Review of the Existing and Emerging Technologies in the Combination of AOPs and Biological Processes in Industrial Textile Wastewater Treatment. Chem. Eng. J. 2019, 376, 120597. [Google Scholar] [CrossRef]
  6. Chen, G.; Yu, Y.; Liang, L.; Duan, X.; Li, R.; Lu, X.; Yan, B.; Li, N.; Wang, S. Remediation of Antibiotic Wastewater by Coupled Photocatalytic and Persulfate Oxidation System: A Critical Review. J. Hazard. Mater. 2021, 408, 124461. [Google Scholar] [CrossRef]
  7. Ahmed, M.B.; Zhou, J.L.; Ngo, H.H.; Guo, W. Adsorptive Removal of Antibiotics from Water and Wastewater: Progress and Challenges. Sci. Total Environ. 2015, 532, 112–126. [Google Scholar] [CrossRef]
  8. Matoh, L.; Žener, B.; Kovačić, M.; Kušić, H.; Arčon, I.; Levstek, M.; Lavrenčič Štangar, U. Photocatalytic Sol-Gel/P25 TiO2 Coatings for Water Treatment: Degradation of 7 Selected Pharmaceuticals. Ceram. Int. 2023, 49, 24395–24406. [Google Scholar] [CrossRef]
  9. Žener, B.; Matoh, L.; Rodič, P.; Škufca, D.; Heath, E.; Lavrenčič Štangar, U. Removal of 18 Bisphenols Co-Present in Aqueous Media by Effectively Immobilized Titania Photocatalyst. J. Environ. Chem. Eng. 2021, 9, 106814. [Google Scholar] [CrossRef]
  10. Babu, D.S.; Srivastava, V.; Nidheesh, P.V.; Kumar, M.S. Detoxification of Water and Wastewater by Advanced Oxidation Processes. Sci. Total Environ. 2019, 696, 133961. [Google Scholar] [CrossRef]
  11. Guerra-Rodríguez, S.; Rodríguez, E.; Singh, D.; Rodríguez-Chueca, J. Assessment of Sulfate Radical-Based Advanced Oxidation Processes for Water and Wastewater Treatment: A Review. Water 2018, 10, 1828. [Google Scholar] [CrossRef]
  12. Akyol, A.; Bayramoglu, M. The Degradation of an Azo Dye in a Batch Slurry Photocatalytic Reactor. Chem. Eng. Process. Process Intensif. 2008, 47, 2150–2156. [Google Scholar] [CrossRef]
  13. Li Puma, G.; Yue, P.L. Modelling and Design of Thin-Film Slurry Photocatalytic Reactors for Water Purification. Chem. Eng. Sci. 2003, 58, 2269–2281. [Google Scholar] [CrossRef]
  14. Shan, A.Y.; Ghazi, T.I.M.; Rashid, S.A. Immobilisation of Titanium Dioxide onto Supporting Materials in Heterogeneous Photocatalysis: A Review. Appl. Catal. A Gen. 2010, 389, 1–8. [Google Scholar] [CrossRef]
  15. Protti, S.; Ravelli, D.; Fagnoni, M. Design Consideration of Continuous-Flow Photoreactors. In Photochemical Processes in Continuous-Flow Reactors; World Scientific: Amsterdam, The Netherlands, 2017; Volume 23, pp. 1–36. [Google Scholar]
  16. Cao, H.; Ye, C.; Yan, X.-F.; Liu, X.-N.; Wang, X.-K. Experimental Investigation of Turbulent Flows through a Boulder Array Placed on a Permeable Bed. Water Supply 2020, 20, 1281–1293. [Google Scholar] [CrossRef]
  17. Huang, Y.-J.; Lyu, L.-M.; Lin, C.-Y.; Lee, G.-C.; Hsiao, K.-Y.; Lu, M.-Y. Improved Mass-Transfer Enhances Photo-Driven Dye Degradation and H2 Evolution over a Few-Layer WS2/ZnO Heterostructure. ACS Omega 2022, 7, 2217–2223. [Google Scholar] [CrossRef]
  18. Amiri, H.; Ayati, B.; Ganjidoust, H. Mass Transfer Phenomenon in Photocatalytic Cascade Disc Reactor: Effects of Artificial Roughness and Flow Rate. Chem. Eng. Process. Process Intensif. 2017, 116, 48–59. [Google Scholar] [CrossRef]
  19. Dionysiou, D.D.; Suidan, M.T.; Baudin, I.; Laîné, J.-M. Oxidation of Organic Contaminants in a Rotating Disk Photocatalytic Reactor: Reaction Kinetics in the Liquid Phase and the Role of Mass Transfer Based on the Dimensionless Damköhler Number. Appl. Catal. B Environ. 2002, 38, 1–16. [Google Scholar] [CrossRef]
  20. Pareek, V.; Chong, S.; Tadé, M.; Adesina, A.A. Light Intensity Distribution in Heterogenous Photocatalytic Reactors. Asia-Pacific J. Chem. Eng. 2008, 3, 171–201. [Google Scholar] [CrossRef]
  21. Boyjoo, Y.; Ang, M.; Pareek, V. CFD Simulation of a Pilot Scale Slurry Photocatalytic Reactor and Design of Multiple-Lamp Reactors. Chem. Eng. Sci. 2014, 111, 266–277. [Google Scholar] [CrossRef]
  22. Casado, C.; Marugán, J.; Timmers, R.; Muñoz, M.; Van Grieken, R. Comprehensive Multiphysics Modeling of Photocatalytic Processes by Computational Fluid Dynamics Based on Intrinsic Kinetic Parameters Determined in a Differential Photoreactor. Chem. Eng. J. 2017, 310, 368–380. [Google Scholar] [CrossRef]
  23. Duran, J.E.; Mohseni, M.; Taghipour, F. Computational Fluid Dynamics Modeling of Immobilized Photocatalytic Reactors for Water Treatment. AIChE J. 2011, 57, 1860–1872. [Google Scholar] [CrossRef]
  24. Versteeg, H.K.; Malalasekera, W. An Introduction to Computational Fluid Dynamics: The Finite Volume Method, 2nd ed.; Pearson Education Ltd.: Harlow, UK; New York, NY, USA, 2007; ISBN 978-0-13-127498-3. [Google Scholar]
  25. Ahmed, S.; Rasul, M.G.; Sattar, M.A.; Jahirul, M.I. Phenol Degradation of Waste and Stormwater on a Flat Plate Photocatalytic Reactor with TiO2 on Glass Slide: An Experimental and Modelling Investigation. J. Water Process Eng. 2022, 47, 102769. [Google Scholar] [CrossRef]
  26. Rasul, M.G.; Ahmed, S.; Sattar, M.A.; Jahirul, M.I. Modelling and Analysis of Hydrodynamics and Flow Phenomena of Fluid with Formic Acid as Pollutant in the Reactive Area of a Flat Plate Photocatalytic Reactor with Top and Bottom Turbulence Promote. Chem. Eng. J. 2023, 466, 142760. [Google Scholar] [CrossRef]
  27. Queffeulou, A.; Geron, L.; Archambeau, C.; Gall, H.L.; Marquaire, P.-M.; Zahraa, O. Kinetic Study of Acetaldehyde Photocatalytic Oxidation with a Thin Film of TiO2 Coated on Stainless Steel and CFD Modeling Approach. Ind. Eng. Chem. Res. 2010, 49, 6890–6897. [Google Scholar] [CrossRef]
  28. Duran, J.E.; Taghipour, F.; Mohseni, M. Irradiance Modeling in Annular Photoreactors Using the Finite-Volume Method. J. Photochem. Photobiol. A Chem. 2010, 215, 81–89. [Google Scholar] [CrossRef]
  29. Qi, N.; Zhang, H.; Jin, B.; Zhang, K. CFD Modelling of Hydrodynamics and Degradation Kinetics in an Annular Slurry Photocatalytic Reactor for Wastewater Treatment. Chem. Eng. J. 2011, 172, 84–95. [Google Scholar] [CrossRef]
  30. Meng, X.; Zhang, Z. Experimental Analysis of a Photoreactor Packed with Pd-BiVO4-Coated Glass Beads. AIChE J. 2019, 65, 132–139. [Google Scholar] [CrossRef]
  31. Moukalled, F.; Mangani, L.; Darwish, M. The Finite Volume Method in Computational Fluid Dynamics: An Advanced Introduction with OpenFOAM and Matlab; Fluid mechanics and its applications; Springer: Cham, Switzerland; Berlin/Heidelberg, Germany; New York, NY, USA; Dordrecht, The Netherlands; London, UK, 2016; ISBN 978-3-319-16874-6. [Google Scholar]
  32. Fluent, A. Ansys Fluent Theory Guide. Ansys Inc. USA 2011, 15317, 724–746. [Google Scholar]
  33. Rana, K.B.; Mavrič, B.; Zahoor, R.; Šarler, B. A Meshless Solution of the Compressible Viscous Flow in Axisymmetric Tubes with Varying Cross-Sections. Eng. Anal. Bound. Elem. 2022, 143, 340–352. [Google Scholar] [CrossRef]
  34. Maxworthy, T. Experiments on the Flow around a Sphere at High Reynolds Numbers. J. Appl. Mech. 1969, 36, 598–607. [Google Scholar] [CrossRef]
  35. Jung, E.C.; Lee, G.-H.; Shim, E.B.; Ha, H. Assessing the Impact of Turbulent Kinetic Energy Boundary Conditions on Turbulent Flow Simulations Using Computational Fluid Dynamics. Sci. Rep. 2023, 13, 14638. [Google Scholar] [CrossRef] [PubMed]
  36. Mehrotra, K.; Ray, A.K. Performance Enhancement of Photocatalytic Reactor Utilizing Flow Instability. Int. J. Chem. React. Eng. 2003, 1, 20121019. [Google Scholar] [CrossRef]
  37. Duran, J.E.; Mohseni, M.; Taghipour, F. Modeling of Annular Reactors with Surface Reaction Using Computational Fluid Dynamics (CFD). Chem. Eng. Sci. 2010, 65, 1201–1211. [Google Scholar] [CrossRef]
  38. Matoh, L.; Žener, B.; Skalar, T.; Štangar, U.L. Synthesis of Nanostructured TiO2 Microparticles with High Surface Area. Catalysts 2021, 11, 1512. [Google Scholar] [CrossRef]
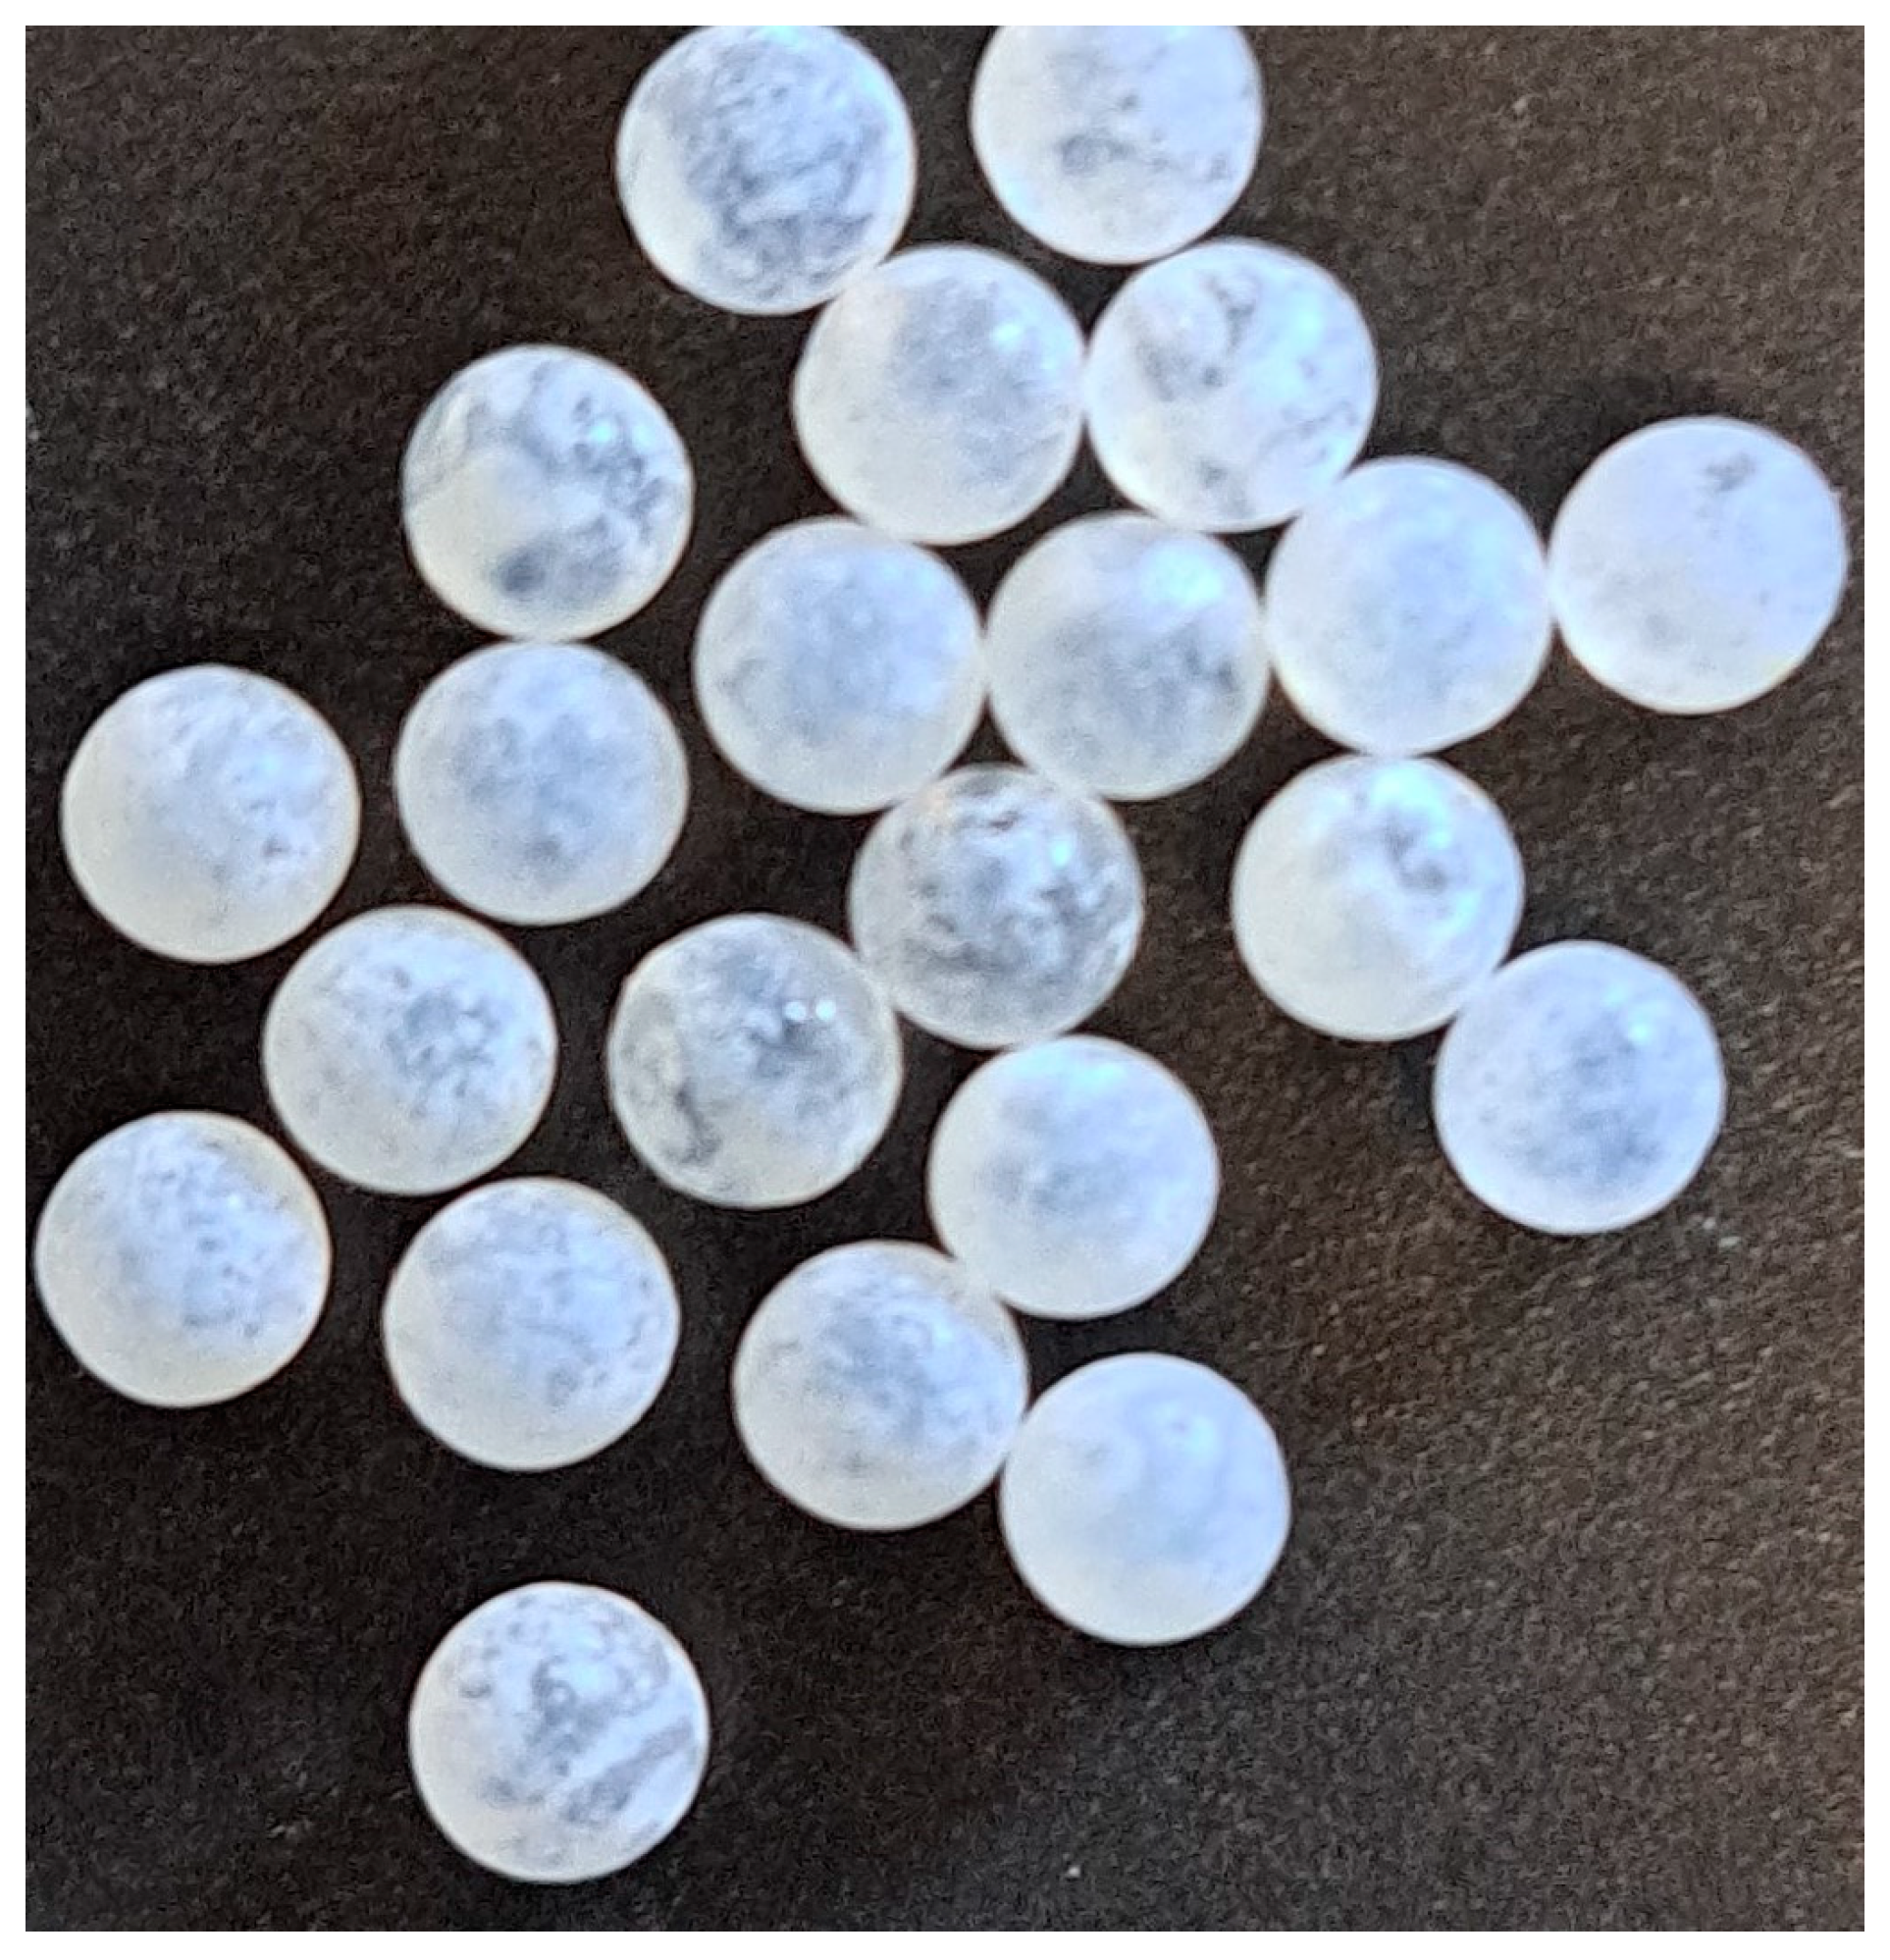
Figure 1. Glass spheres coated with TiO2.
Water 16 01828 g001
Figure 2. Schematic representation of the photocatalytic reactor with spheres.
Water 16 01828 g002
Figure 3. Grid representation of the geometry (top) and zoomed-in part (bottom).
Water 16 01828 g003
Figure 4. Comparison of the v x component of the velocity field along the length at the (a) center of the channel, (b) near the top wall, and (c) near the bottom wall, where x is the horizontal length of the channel.
Water 16 01828 g004
Figure 5. Comparison of concentration removal percentage between numerical and experimental measurements.
Water 16 01828 g005
Figure 6. Radiation profiles of cases where (i) the top wall was irradiated and (ii) both walls were irradiated ( 100   W / m 2 on each and total light intensity 200   W / m 2 ), (iii) both walls were irradiated ( 50   W / m 2 on each and total light intensity 100   W / m 2 ).
Water 16 01828 g006
Figure 7. Molar concentration of MO under different light distributions along the channel, where (i) the top wall was irradiated and (ii) both walls were irradiated ( 100   W / m 2 on each and total light intensity 200   W / m 2 ), (iii) both walls were irradiated ( 50   W / m 2 on each and total light intensity 100   W / m 2 ).
Water 16 01828 g007
Figure 8. Velocity streamlines of a channel with (a) a larger sphere size (23 spheres), (b) a smaller inter-sphere distance (48 spheres), (c) 23 spheres at 0.4 m/s, (d) the same as in case c but at a velocity of 0.1 m/s, and (e) no spheres.
Water 16 01828 g008
Figure 9. Zoomed in portion of velocity streamlines of a channel with (a) larger sphere size (23 spheres), (b) smaller inter-sphere distance (48 spheres), (c) 23 spheres at 0.4 m/s, (d) the same as case c but at a velocity of 0.1 m/s, and (e) no spheres. * Shows zoomed version of each case showed in Figure 10.
Water 16 01828 g009
Figure 10. Turbulence kinetic energy (TKE) (left) and turbulence dissipation rate (right) of different studied cases along the channel. x = the horizontal length of the channel.
Water 16 01828 g010
Figure 11. Molar concentration of MO along the photocatalytic reactor in different studied cases, where (a) larger sphere size (23 spheres), (b) smaller inter-sphere distance (48 spheres), (c) 23 spheres at 0.4 m/s, (d) the same as case c but at a velocity of 0.1 m/s, and (e) no spheres.
Water 16 01828 g011
Disclaimer/Publisher’s Note: The statements, opinions and data contained in all publications are solely those of the individual author(s) and contributor(s) and not of MDPI and/or the editor(s). MDPI and/or the editor(s) disclaim responsibility for any injury to people or property resulting from any ideas, methods, instructions or products referred to in the content.