Article

Seepage and Stability Analysis of Earth Dams’ Downstream Slopes, Considering Hysteresis in Soil–Water Characteristic Curves under Reservoir Water Level Fluctuations

1
College of Urban, Rural Planning and Architectural Engineering, Shangluo University, Shangluo 726000, China
2
School of Highway, Chang’an University, Xi’an 710046, China
*
Author to whom correspondence should be addressed.
Water 2024, 16(13), 1811; https://doi.org/10.3390/w16131811
Submission received: 20 May 2024 / Revised: 15 June 2024 / Accepted: 18 June 2024 / Published: 26 June 2024
(This article belongs to the Section Soil and Water)

Abstract

:
Fluctuations in reservoir water levels have a significant impact on the seepage and slope stability of earth dams. The varying rate of the water level and soil–water characteristic curve (SWCC) hysteresis are the main factors affecting the seepage and the stability of dam slopes; however, they are not adequately considered in engineering practices. In this study, the SEEP/W module and the SLOPE/W module of Geo-studio were employed to analyze the seepage features and the stability of downstream slopes, taking into account the water level fluctuation rate and the SWCC hysteresis. The results reveal that the pore water pressure of the representative point forms a hysteresis loop when the water level fluctuates, which becomes smaller as the water level variation rate increases. Within the loop, the pore water pressure with a rising water level is greater than the value when the water level is dropping, and the desorption SWCC derives greater pore water pressures than the adsorption SWCC. Similarly, the safety factor (Fs) curves under the condition of water level fluctuations also form a hysteresis loop, which becomes smaller as the variation rate of the water level increases. When the water level fluctuation rate increases to 4 m/d, the two curves are tangent, meaning that the Fs with a rising water level is always greater than the value when the water level is dropping. The desorption SWCC derives a lower Fs value than the adsorption SWCC as the water level draws up, but this initiates no evident difference in the Fs value when the water level draws down. These findings can be used to inform the design and operation of earth dams under fluctuating water levels.

1. Introduction

The remarkable growth in China’s economy has raised energy requirements in every field, leading to the mass construction of hydropower stations. Most of the hydropower stations built in the last century are located in western China, which houses approximately 70% of China’s hydropower resources [1,2,3]. Due to the simplicity of the available building technologies and the economic restrictions experienced in China over the last century, a large number of hydropower stations were constructed using earth dams, which inevitably experience slope failure disasters when reservoir water levels fluctuate [4,5,6]. As the reservoir water level fluctuates, the pore water pressure (PWP) in the earth dam varies, which affects the shear strength of the dam soils, ultimately inducing the downstream slope slippage of the earth dam [7].
Under the condition of fluctuating reservoir water levels, the phreatic line in the dam body also rises and drops, leading to variation in the unsaturated area within the dam body [8]. Thus, in this context, a seepage and stability analysis constitutes a saturated–unsaturated problem, requiring the incorporation of the unsaturated soil shearing strength theory of soil [9,10]. This widely used theory was proposed by Fredlund [11], who took into consideration the effects of the matric suction of the soil on the unsaturated shearing strength. Based on the SWCC, while the phreatic line in the dam body is dropping, the water content in the dam soils decreases, in turn leading to the matric suction inside the dam increasing; this has a favorable influence on the dam’s slope stability [12,13]. On the contrary, if the reservoir water level rises, the interior phreatic line will also rise, which has an unfavorable effect on the dam slopes [14,15]. This is a different mechanism from that of water infiltration inside rock slopes, as the hydrodynamic force can increase the rock fissure degree and soften the rock during infiltration, in turn leading to a larger permeability coefficient and degrading the safety of the rock slopes [16,17].
With the development of geotechnology, a range of techniques have been incorporated into interrogations of dam slope Fs under conditions of varying reservoir water levels, such as numerical studies [18,19,20], physical model studies [21,22,23], and field monitoring studies [24,25,26]. Among these, probabilistic stability analysis based on various numerical theories provides a unique means of incorporating uncertainties in the material properties into the calculation of dam slope safety factors [27,28]. In such studies, the unsaturated soil properties are rarely considered, though they play important roles in the slope’s stability. Based on the similarity theory, the physical model can simulate the actual conditions of dam slopes in every situation, including varying reservoir water levels and earthquakes [29,30,31]. If a centrifuge is available, the gravity stress within the dam slope can be loaded to the true value, as in the prototype, thus producing a more reliable test result [32,33]. Over the last several decades, dam slope stability has been studied using a centrifuge, an approach that revealed the mechanism of dam slope failure with water level fluctuations [34,35,36]. It was found that fluctuations in reservoir water levels lead to changes in the PWP and the matric suction in the dam body, reducing the effective stress there; this is unfavorable to the Fs of the dam slope [37]. With the help of modern data transmission technology, dam slopes have been widely studied using field monitoring, which has yielded many useful results [38,39]. The rapid drawdown of reservoir water levels coinciding with heavy rainfall was found to be a critical situation for dam slope safety [40]. Generally, dam slope safety has been studied using various methods, which have yielded considerable results. However, some important soil properties, such as the soil–water characteristic properties, have not been considered in the evaluation of dam slopes. Additionally, the hysteresis of the Fs variation curve was not addressed in previous studies. Thus, this study concentrated on the Fs variation curves of earth dams’ downstream slopes, taking into consideration SWCC hysteresis.
An earth dam prototype was selected as the study object to investigate the effects of the drawdown of reservoir water levels on the safety of the downstream dam slope, taking into account SWCC hysteresis. We introduce the theory of the finite element method (FEM) of seepage and the unsaturated soil strength theory, before outlining the testing program for the dam soil properties. The study results can be used to direct the operations and maintenance of earth dams during the storage and release of reservoir water.

2. Materials and Methods

2.1. Project Profile

The Hanyu reservoir, situated in Hu County of the Shan’xi province in China, is contained by a homogeneous earth dam that is 34 m high. The dam crest is at an elevation of 572.91 m, with a width of 8.0 m. To meet the stability criteria under critical situations, the upstream and downstream slopes of the dam were constructed with four different slope ratios. The four downstream slope ratios are 1:1.8, 1:2.6, 1:2.6, and 1:2.5, sequentially downward from the dam crest, as Figure 1 shows. The two slope ratios of the upstream slope above the sludge are 1:2.0 and 1:2.5.
Based on the field investigation, the normal water level of the reservoir is at an elevation of 568.90 m in summer; this falls to the sedimentation elevation of 559.40 m in the dry winter season. Generally, the reservoir water level fluctuates between the elevations of 568.90 m and 559.40 m.

2.2. Analysis Scheme and Calculation Theory

We employed the finite element theory of saturated–unsaturated seepage, included in the Geo-studio software, to calculate the transient PWP within the dam under a fluctuating water level. The seepage feature within the dam conforms to Darcy’s law, which can be used to derive the saturated–unsaturated seepage controlling equation as follows:
x k x H x + y k y H y + Q = Θ t
where H denotes the total water head inside the dam, kx and ky denote the permeability coefficients in the directions of the x-axis and y-axis, respectively, Q represents the boundary water flows, and Θ represents the volumetric water content within the soils.
First, a finite element model with 723 quadrilateral elements was built in the SEEP/W module of Geo-studio, as shown in Figure 2. The upstream boundary, A-A, was set with a variable water head, depicting the reservoir water level rising from an altitude of 19.4 m to 28.9 m, with rising rates of 1 m/d to 5 m/d. After staying at the altitude of 28.9 m for 6 days, the reservoir water level dropped to the altitude of 19.4 m, with the same variation rates as when it was rising. The downstream boundary, B-B, was set with potential seepage, while the rest of the model edges were set with an impermeable boundary. The points B, C, and D on the vertical line are the three representative points for the seepage study.
The soil–water characteristic curve (SWCC) equation proposed by Van Genuchten [41] was adopted to derive the volumetric water content according to the PWP in the soil:
θ θ r θ s θ r = 1 1 + α p n m
where θ denotes the general volumetric water content, θr denotes the residual volumetric water content, θs denotes the volumetric water content under saturated conditions, p is the negative pore water pressure, and α, m, and n are parameters referring to the air entry properties of the soil, the slope of the major part of the SWCC, and the residual volumetric moisture content within the soil, respectively.
Once the seepage field of the dam was generated, the safety factors of the downstream slope of the dam could be calculated using the SLOPE/W module in Geo-studio, employing the Morgenstern–Price method. During this operation, the pore water pressures from the SEEP/W module were transmitted into the SLOPE/W module to generate the effective soil pressures on the sliding surface, ultimately deriving the safety factors.
The Morgenstern–Price theory satisfies both the moment equilibrium and the force equilibrium; thus, it is recognized as the strictest limit equilibrium method. Based on the moment equilibrium, the safety factor (Fs) can be derived as:
F m = c β R + N u w β tan ϕ b tan ϕ u a β 1 tan ϕ b tan ϕ R tan ϕ W x N f + k W e + D d + A a
where c′ denotes the effective soil cohesion, φ’ denotes the effective soil friction angle, φb denotes the suction friction angle, R is the radius of the sliding arc, uw denotes the PWP on the soil strip bottom, β denotes the width of the soil strip, N denotes the norm force on the soil strip bottom, ua denotes the pore air pressure on the soil strip bottom, W denotes the weight of the soil strip, D denotes the external load on the soil strip, A denotes the external water force, x denotes the dimension from the soil strip centerline to the sliding arc center, f denotes the distance between the normal force arrow on the soil strip and the sliding arc center, e denotes the perpendicular distance between the centroid of the soil strip and the sliding arc center, d denotes the distance between the external load arrow and the sliding arc center, and a is the distance between the outside water force and the sliding arc center.
From the force equilibrium, the safety factor can be derived as:
F f = c β cos α + N u w β tan ϕ b tan ϕ u a β 1 tan ϕ b tan ϕ tan ϕ cos α N sin α + α k W D cos ω ± A
where α denotes the inclining angle of the bottom of the soil strip. The meanings of the symbols in Equation (4) are identical to those in Equation (3). The safety factor satisfies both Equations (3) and (4) and is adopted as the real Fs.

2.3. Material Properties

There are five materials contained in the existing dam: the sludge in the reservoir, the dam body, the drainage prism, the sandy gravel layer, and the red clay layer. In the current study, the seepage within the dam under a fluctuating water level constitutes a saturated–unsaturated problem, incorporating the unsaturated infiltration function proposed by Van Genuchten, which is based on the SWCC as well as the saturated permeability coefficient [41]. Table 1 shows the permeability parameters involved in the seepage analysis under a decreasing water level, i.e., desorption.
In Table 1, Kh is derived from the standard varying water head permeability test, while the other parameters are taken from the SWCC test, which incorporated a tensiometer to measure the matric suction inside the soils. When the matric suction data and the water content data were obtained from the test, they could be fitted using the SWCC equation of Van Genuchten, thus deriving the parameters a, m, n, θs, and θr.
Except for the dam body material, all the soil materials are always underwater, while the reservoir water level fluctuates. That is, only the dam body experiences desorption–adsorption processes. Thus, only the material properties of the adsorption SWCC of the dam body are presented in Table 2.
The symbol Kh in Table 1 and Table 2 is the saturated permeability coefficient, and Kr is the relative permeability coefficient, which can be derived as the ratio of permeability under the saturated condition to that under the unsaturated condition. All the other symbols in the above tables are the same as in Equation (2). While the saturated permeability coefficients of the soils were determined based on the variable head permeability test, the unsaturated permeability coefficients can be determined by Kr. The parameters a′, m′, and n′ were derived using the same method used for the parameters a, m, and n in Table 1.
The extended Mohr–Coulomb criterion accounts for the matric suction of the soils under the unsaturated condition; thus, it was employed here to describe the shear strengths of the soils. The densities of the soils were determined using the ring knife method, while the cohesion and the internal friction angles were determined using the direct shear method. The mechanical parameters of the soils in the model are listed in Table 3.

3. Results

Referring to the research scheme addressed in the last section, the variable seepage boundary representing the varying reservoir water level was imposed on the upstream slope surface of the dam, which determined the transient seepage field. Then, the obtained seepage field was incorporated into the SLOPE/W module in Geo-studio to analyze the downstream slope stability under the condition of fluctuations in the reservoir water level.

3.1. Downstream Slope Stability under Water Level Fluctuations

3.1.1. Seepage under Water Level Fluctuations

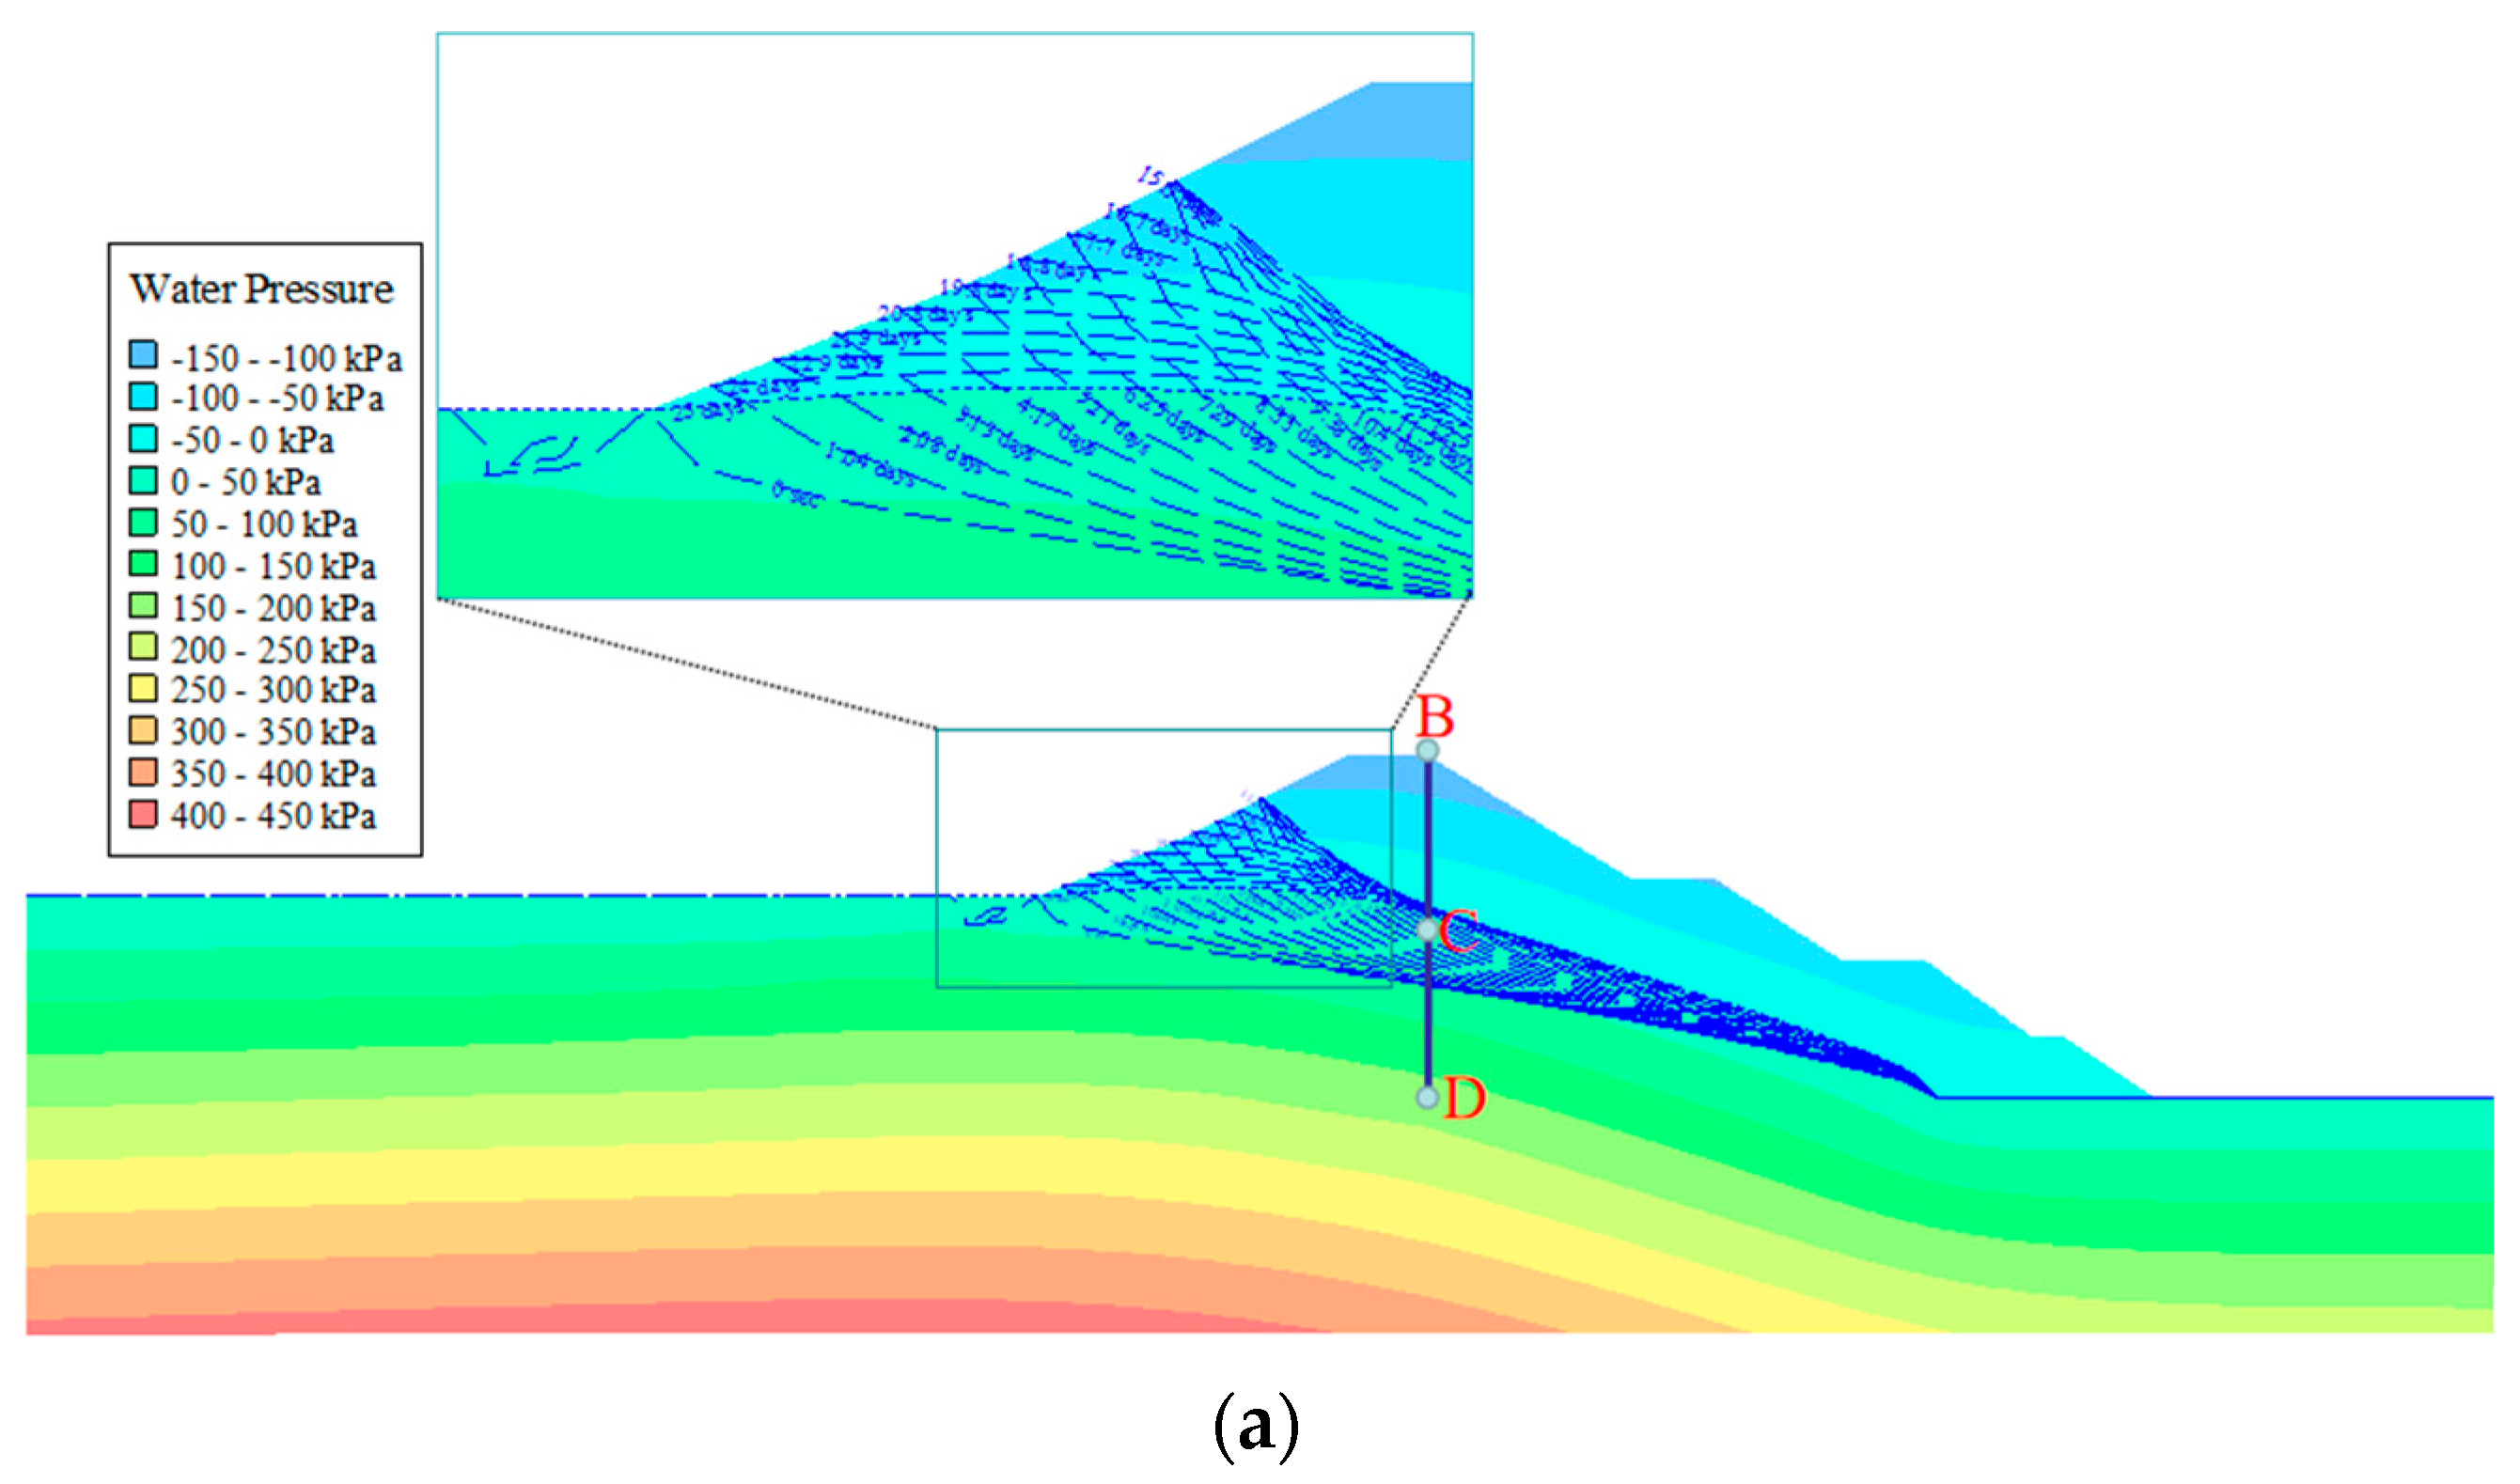
To reveal the seepage characteristics of the dam under the conditions of water level drawup and drawdown, the permeability properties tabulated in Table 1, incorporating the desorption SWCC parameters, were inputted into SEEP/W. Based on that calculation, the PWP values within the dam under the lowest water level and the water level of 5 m, with the water level variation rate of 1 m/d, are presented in Figure 3. Moreover, the phreatic lines under different water levels are presented in Figure 4a.
There were evident differences in seepage between the rising and dropping water levels. When the water levels were identical, the lowest PWP when the dam’s water level dropped was larger than that when the water level was rising, but there was only a negligible difference for the maximum PWP. This may be because of the water holding capacity of the dam soils. However, the PWP for higher water levels is generally larger than that for lower water levels.
The phreatic line rises with the drawup of the reservoir water level and drops with the drawdown of the reservoir water level. The height difference between the phreatic lines of different reservoir water levels is evident near the upstream boundary, while it is increasingly negligible in the downstream direction. Thus, the varying phreatic lines show a profile of a horn shape. It is also clear that, for identical water levels, the phreatic line from the water level dropping is higher than the one from the water level rising, which forms a hysteresis loop. As the varying rate of the reservoir water level increases, the hysteresis loop grows, implying that the water holding ability causes the hysteresis loops.
Figure 4 presents the variations in the PWP at points B, C, and D with the reservoir water level under the water level fluctuation rate of 1 m/d. Generally, the pore water pressure values of the three points increase with the drawup of the reservoir water level and decrease with the drawdown of the reservoir water level. The curve of the pore water pressure with the water level drawup intersects with the curve of the water level drawdown; thus, a loop was formed at the right part of the curve. Within the loop, the pore water pressure of the water level drawup is greater than that of the water level drawdown at identical water levels. However, in the left part of the PWP curve, the PWP of the water level drawup is less than the one of the water level drawdown. Thus, at the end of the water level drawdown, the pore water pressure is greater than that at the start of the water level drawup, demonstrating the water holding capacity of the dam soil. We can infer that the right loop of the PWP curve is formed by the mechanism of the SWCC hysteresis of the dam soil. The deeper we travel inside the dam, the larger the loop, because the soils become more involved in the desorption and adsorption processes.

3.1.2. Fs of the Downstream Slope under Water Level Fluctuations

When the pore water pressures from the SEEP/W module are incorporated into the SLOPE/W module, the safety factors of the downstream slope under different reservoir water levels are calculated. Figure 5 presents the critical sliding surface of the downstream slope of the dam, which appears in the shape of an arc.
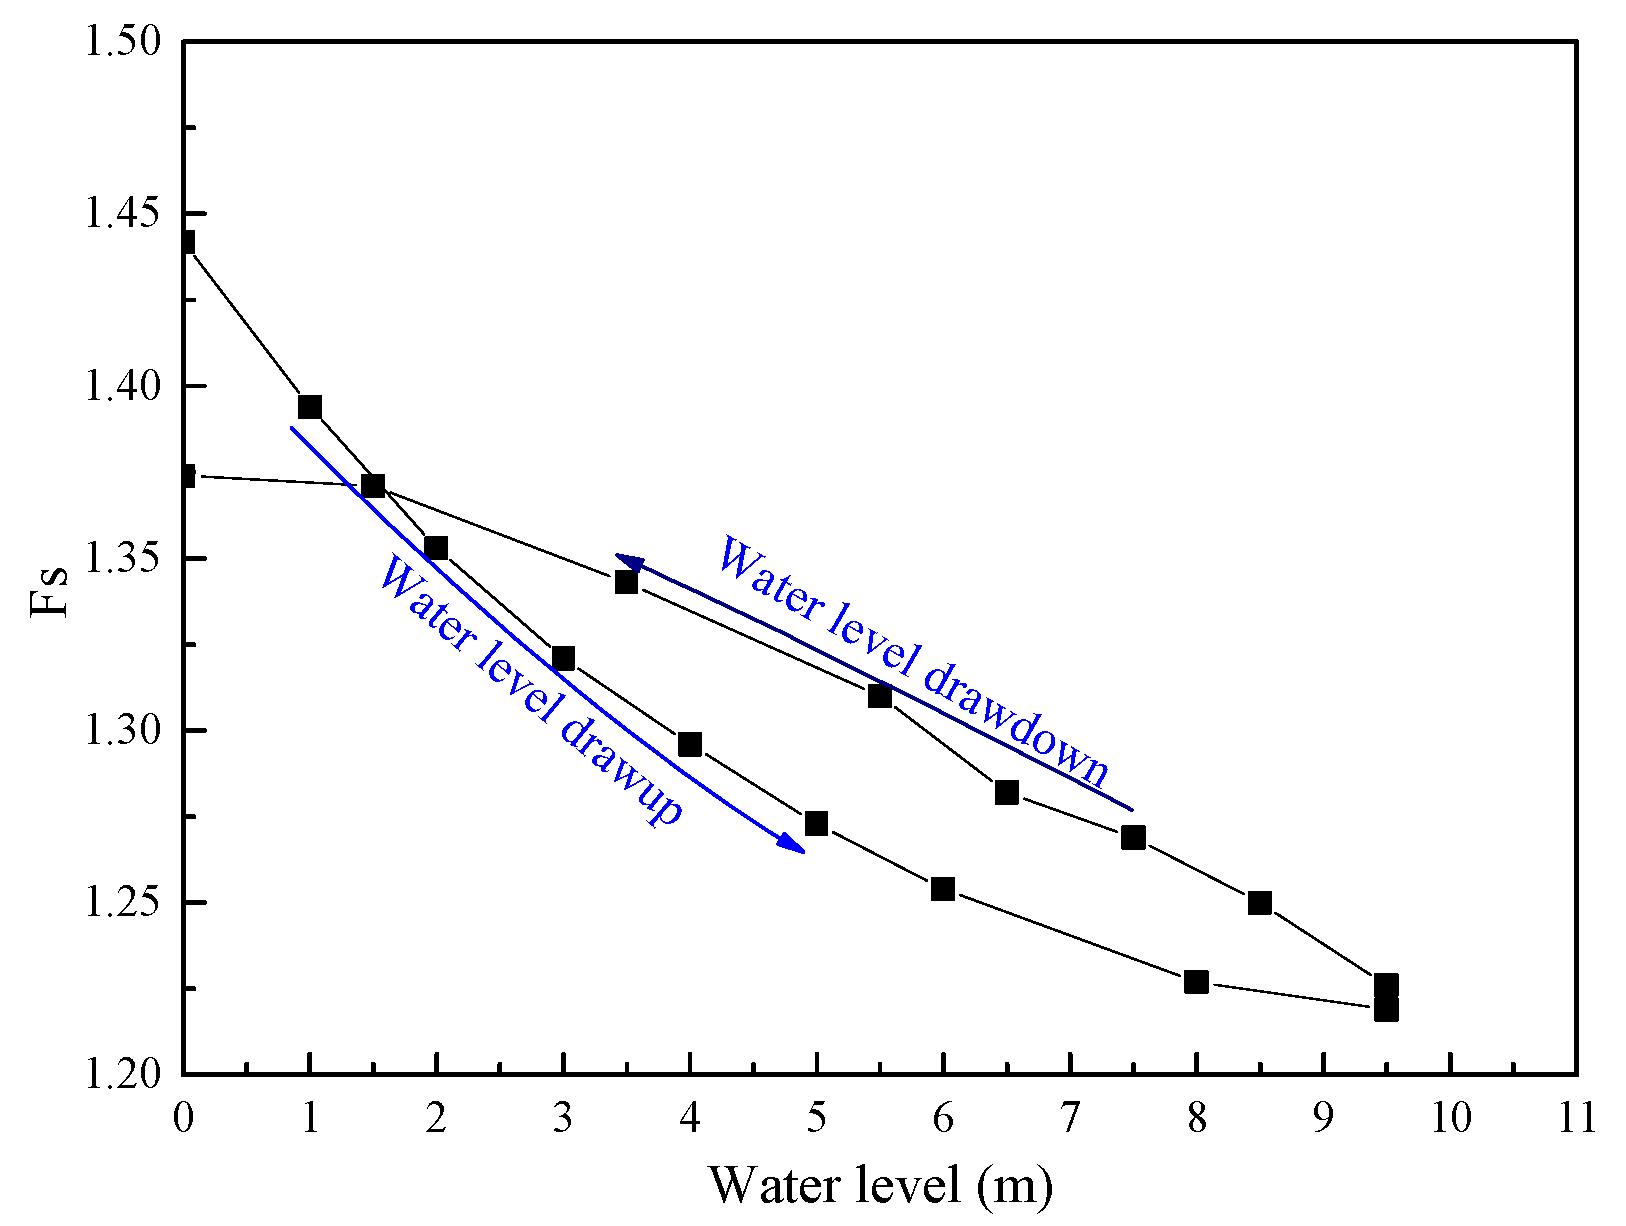
Figure 6 presents the variation in the downstream slope Fs with the reservoir water level fluctuation rate of 1 m/d. The downstream slope Fs increases with the reservoir water drawdown and decreases with the water level drawup. Similarly to the PWP at the representative points, the safety factor variation curves of the water level drawup and drawdown form a loop, implying the hysteresis mechanism of the downstream slope Fs under reservoir water level fluctuations. Within the hysteresis loop, the Fs from the water level dropping is larger than that from the water level rising. However, outside the hysteresis loop, on the left, the Fs of the water level drawup is greater than that of the water level drawdown, which is possibly caused by the water holding capability of the dam soils.

3.2. Influence of the Water Level Fluctuation Rate on the Downstream Slope Stability

3.2.1. Influence of the Water Level Fluctuation Rate on Seepage

Figure 7 shows the pore water pressure variations at the three representative points under different reservoir water level fluctuation rates. As point B is located at the highest point of the dam, which is always above the phreatic line, while the reservoir water level fluctuates, the PWP at point B varies within the range of negative values. On the other hand, the PWP at point C varies within the range of positive values, indicating the saturated condition of the adjacent soils in the test. The reservoir water level variation rate mainly affects the pore water pressures at the representative points under water level drawup, but it has little effect on the pore water pressures when the water level drops. That is, when water levels rise, the greater water level fluctuation rates lead to lower pore water pressures.
Moreover, as the reservoir water level fluctuation rate increases, the intersection of the pore water pressure variation curves under water level drawup and drawdown moves rightward, making the hysteresis loop smaller. This may be due to the more evident lag in the variation in the phreatic line as the reservoir water level fluctuation rate increases. However, the difference between the pore water pressures at the end of the reservoir water drawdown and the start of the water level drawup shows no visible change as the water level fluctuation rate increases.

3.2.2. Influence of the Water Level Fluctuation Rate on the Fs of the Downstream Slope

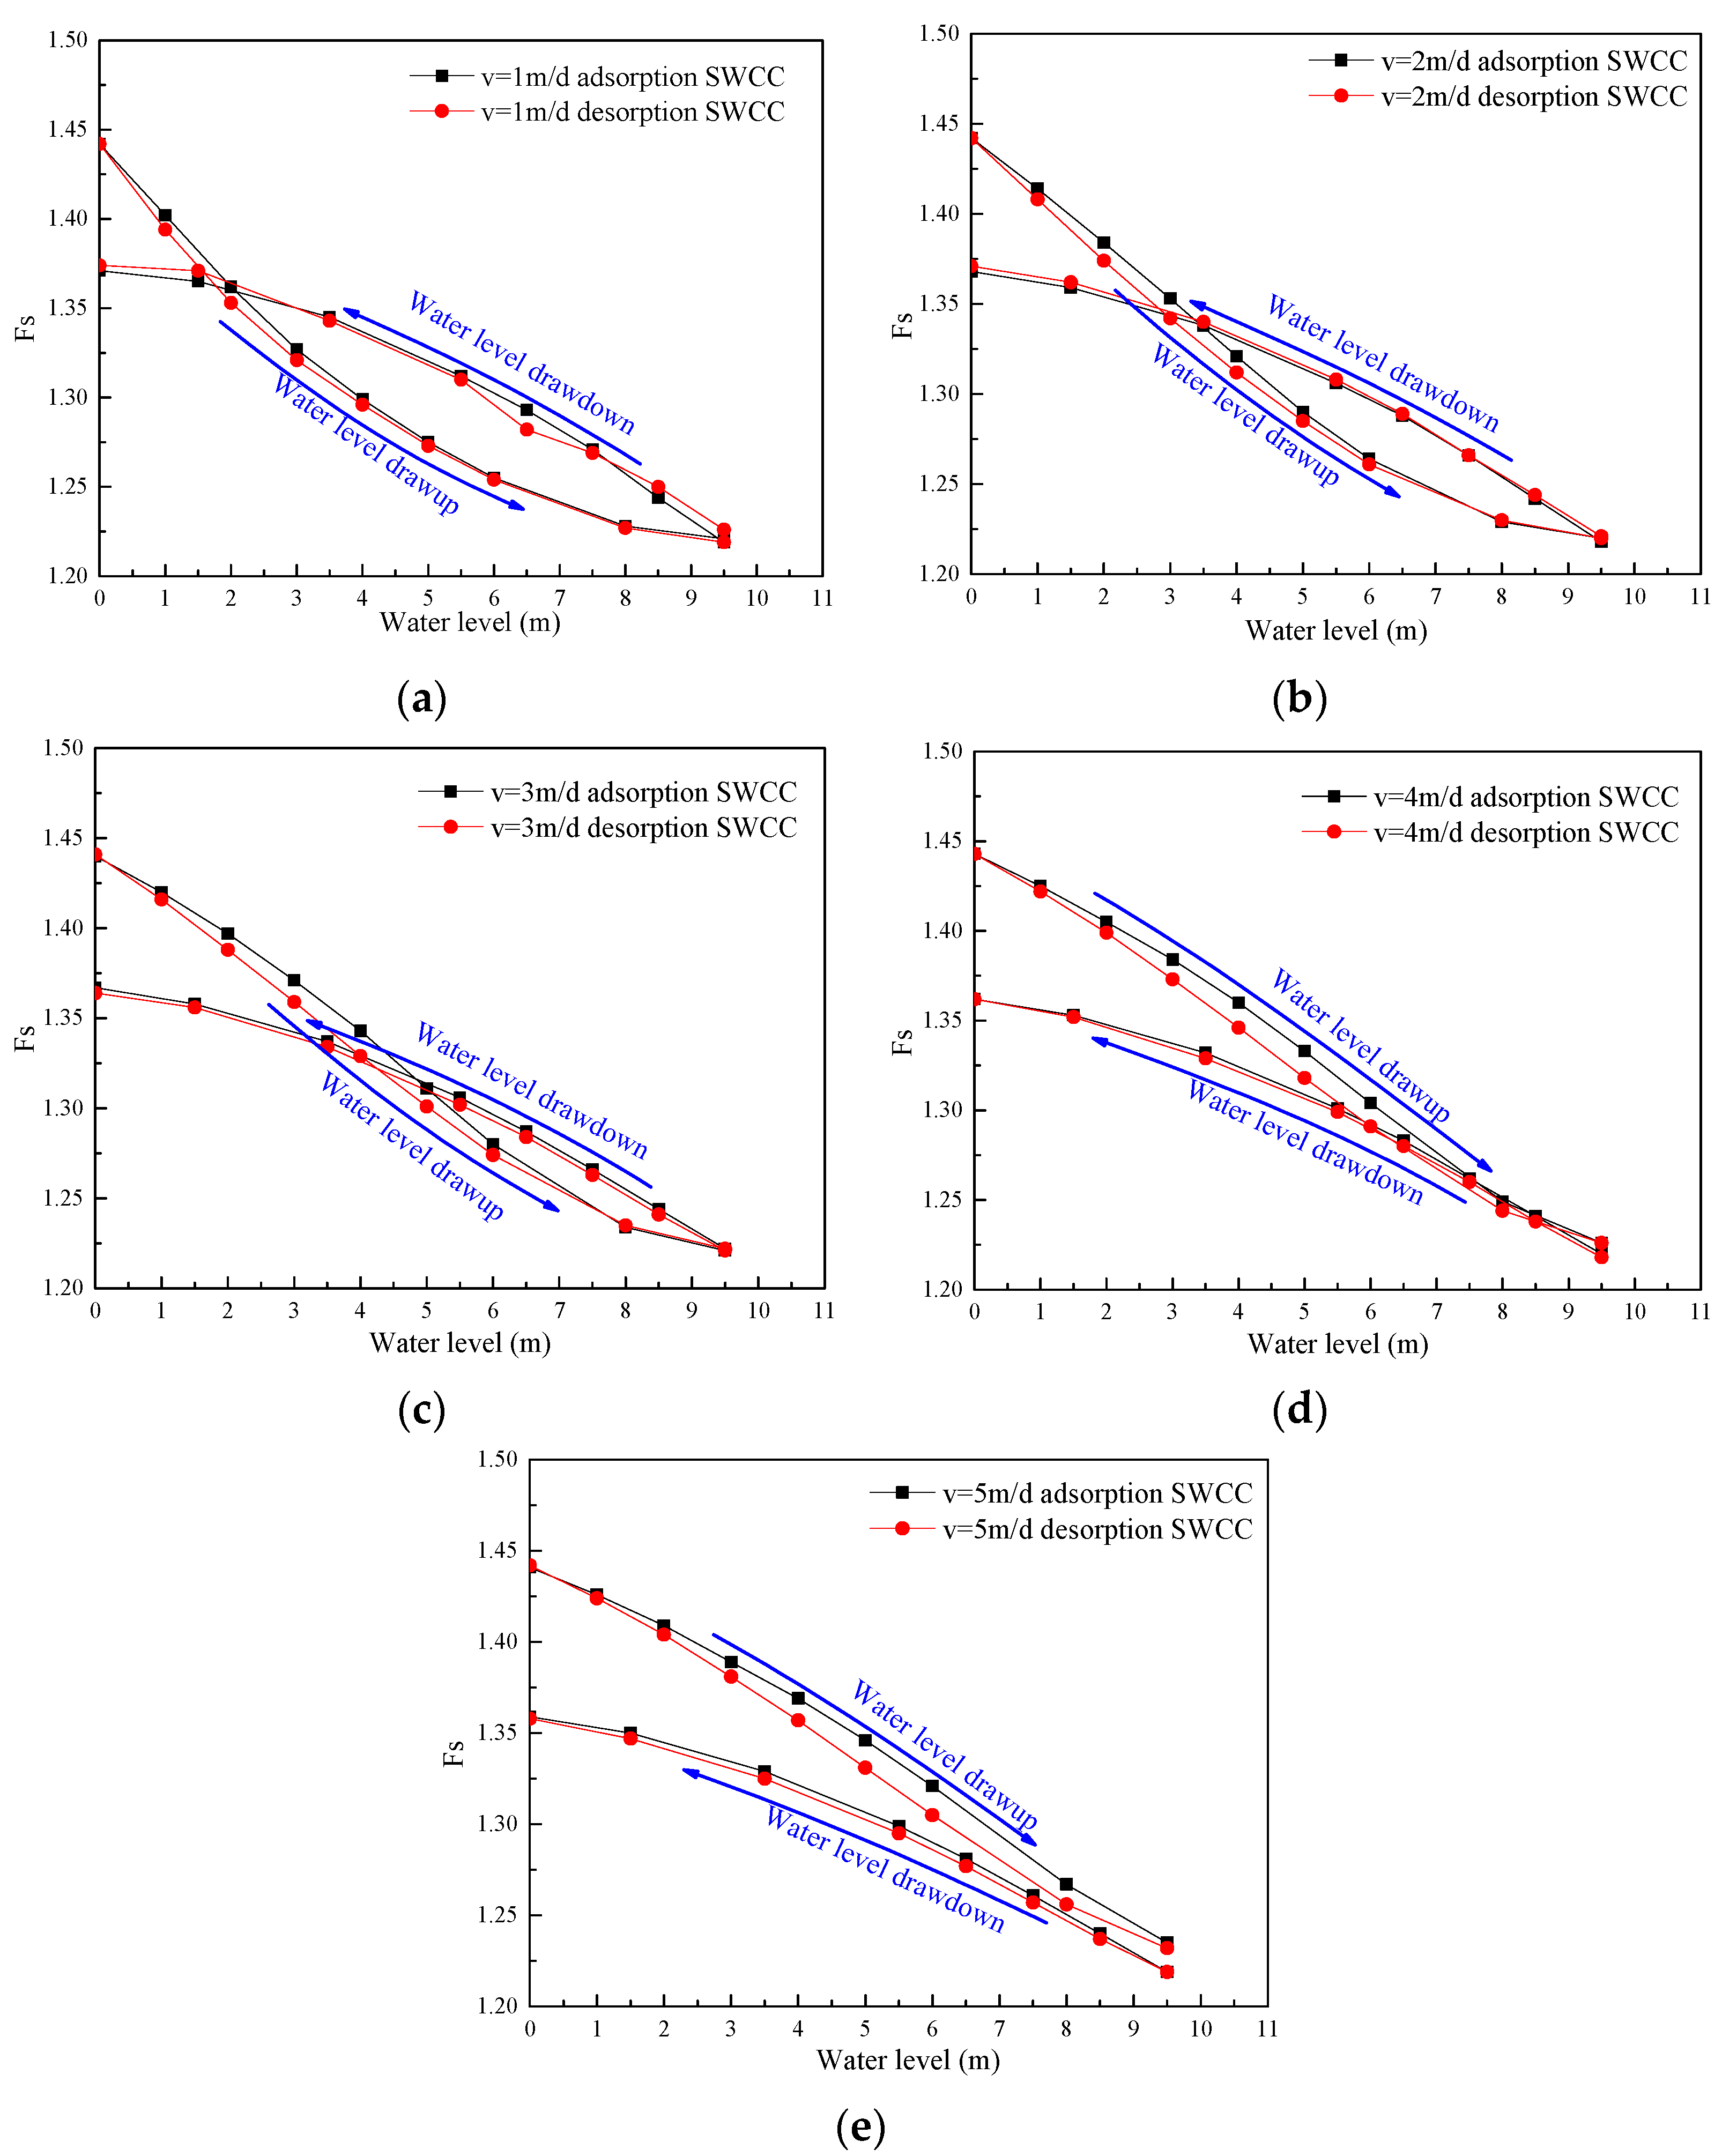
The variation in the Fs of the downstream slope with the reservoir water level under different water level fluctuation rates is presented in Figure 8. It appears that the water level fluctuation rate has a substantial influence on the Fs value of the downstream slope at the end of the water level drawdown. That is, while the water level fluctuation rate increases, the Fs value at the end of the water level drawdown decreases. It is about 1.37 when the water level fluctuation rate is 1 m/d and drops to about 1.34 when the water level fluctuation rate is 5 m/d. We can speculate that this is because more water is retained in the dam slope at the end of the water level drawdown when the water level fluctuation rate is increasing.
Moreover, the water level fluctuation rate has a clear influence on the Fs of the downstream slope under water level drawup, but it has little effect during water level drawdown, corresponding to the pore water pressures of the representative points. Thus, it can be inferred that the PWP makes the main contribution to the Fs variation of the downstream slope under fluctuating water levels. As the water level variation rate increases, the slope of the main section of the Fs variation curve decreases, inducing the Fs variation curve to change from downward concave to flat. Thus, the intersection of the Fs curves when the water rises and drops moves rightward, leading to a smaller hysteresis loop. When the water level fluctuation rate increases to 4 m/d, the two curves are tangent, and the hysteresis loop disappears. When the water level fluctuation rate increases to 5 m/d, the two curves diverge from each other, and the Fs when the water level is rising is always greater than when it is dropping.

3.3. Influence of SWCC Hysteresis on the Stability of the Downstream Slope

3.3.1. Influence of SWCC Hysteresis on the Seepage

In order to investigate the influence of the SWCC hysteresis on the seepage field and the slope stability of the dam, the SWCC of both the adsorption and the desorption were incorporated into the seepage analysis. Figure 9 shows the pore water pressure variation at the three representative points under the water level fluctuation rate of 1 m/d, taking into account the adsorption and desorption SWCC values. It appears that the hysteresis of the SWCC has a considerable influence on the pore water pressure when the water level is rising, but it has little effect on the pressure during water level drawdown. When the water level is increasing, the pore water pressure under the adsorption SWCC is lower than that of the desorption SWCC. This is more obvious at point B and is negligible at point D, implying that the SWCC hysteresis mainly influences the pore water pressures of the unsaturated areas. This makes sense because the SWCC only depicts the process of the water adsorption and desorption of the soils under changes in suction. Thus, the intersection of the pore water pressure variation curves for the adsorption SWCC moves rightward, forming a smaller loop, which has a similar effect to the water level fluctuation rate increasing.

3.3.2. Influence of SWCC Hysteresis on the Fs of the Downstream Slope

Figure 10 presents the Fs variation curves of the downstream slope under fluctuating water levels for the SWCC of both adsorption and desorption. The hysteresis of the SWCC mainly affects the Fs variation of the water level drawup and has little influence on the Fs during the water drawdown, which is similar to the result of the PWP variation in the hysteresis of the SWCC. During the water level drawup process, the Fs in the desorption SWCC is lower than that in the adsorption SWCC, thus leading the intersection point of the Fs variation curve to move leftward, forming a larger loop. Because the pore water pressure is the only control variable for the downstream slope stability, and it makes a negative contribution to the downstream slope stability, the greater PWP for the desorption SWCC inevitably leads to a lower Fs during the water level drawup.

4. Discussion

At identical reservoir water levels lower than 1.5 m, the pore water pressures at the representative points of the water level drawdown are greater than those of the water level drawup, which is an inevitable result of the water retaining capacity of the dam soil. As the reservoir water level drops, the phreatic line in the dam shows a trend of dropping, thus leading to a decrease in the pore water pressures at the representative points. However, the water holding capacity keeps the water stored in the soils, which prevents the water pressures from dissipating. Thus, at low water levels, the PWP values of the representative points under water drawdown are higher than when the water level is rising.
However, at a high water level, the pore water pressures at the representative points under a rising water level are greater than when the water level is dropping, seemingly due to the difference between the saturated and unsaturated permeability of the dam soil. In the water level drawdown process, most of the downstream slope soils are saturated and have greater permeability; this can vent the water infiltrated into the dam, thus leading to lower pore water pressures at high water levels. In the water level drawup process, most of the downstream slope soils are unsaturated; they therefore have lower permeability and cannot vent the infiltrated water fluently, thus leading to greater water pressures at high water levels.
As the water pressure is the only control variable for the downstream slope stability, the hysteresis of the PWP inevitably leads to the hysteresis of the Fs of the downstream slope. Because the pore water pressure makes a negative contribution to the slope stability, the greater pore water pressure of the rising water level than the falling water level leads to the lower Fs of the water level drawup within the hysteresis loop. Moreover, the greater water level fluctuation rate makes a smaller pore water pressure hysteresis loop, producing a smaller Fs hysteresis loop.
In SEEP/W, the unsaturated permeability of the soil is predicted based on the SWCC, and the desorption SWCC usually predicts a smaller unsaturated permeability than the adsorption SWCC [41]. Under the conditions of water level drawup, most of the downstream slope soils are unsaturated, exhibiting lower levels of permeability. As a result, under the condition of water level drawup, the downstream slope soils with the desorption SWCC are less able to vent the infiltrated water, inevitably leading to higher water pressure. Thus, the Fs of the downstream slope has a lower value under the desorption SWCC when the water level is rising. However, most of the downstream slope soils are saturated when the water level is falling, showing nearly identical permeability; this leads to the identical pore water pressure and Fs values of the slope.

5. Conclusions

In this study, the SEEP/W and SLOPE/W modules of Geo-studio were employed to analyze the influence of reservoir water fluctuations on seepage and downstream slope stability, taking into account the water level variation rate and the hysteresis of SWCC. The following conclusions can be drawn:
  • With the fluctuation in the reservoir water level, the phreatic line inside the dam shows a profile of a horn shape, while the variation curves of the PWP of the representative points form a hysteresis loop. The deeper the representative point inside the dam, the larger the hysteresis loop.
  • As the water level variation rate increases, the PWP hysteresis loop becomes smaller. When the water level rises, the pore water pressures of the desorption SWCC are greater than those of the adsorption SWCC. However, the difference in the pore water pressures is negligible when the water level is falling.
  • The variation curve of the Fs of the downstream slope also forms a hysteresis loop with the water level fluctuation. Within the Fs hysteresis loop, the Fs value of the falling water level is larger than that for a rising water level, which is converse outside the hysteresis loop. The hysteresis loop of Fs becomes smaller with the increase in the water level variation rate. When the water level fluctuation rate increases to 4 m/d, the Fs variation curves of the rising and falling water levels are tangent; the Fs of the rising water level is always greater than that of the falling water level.
  • The SWCC hysteresis mainly influences the slope’s Fs as the water level rises, but it has little effect on the Fs as the water level falls. As the water level rises, the Fs value from the desorption SWCC is smaller than that from the adsorption SWCC.

Author Contributions

Conceptualization, G.L. and Z.Z.; methodology, J.Z.; software, G.J.; validation, Z.Z.; formal analysis, G.L.; investigation, W.M.; resources, G.L.; data curation, G.J.; writing—original draft preparation, G.L.; writing—review and editing, W.M.; visualization, J.Z.; supervision, Z.Z.; project administration, Z.Z.; funding acquisition, G.L. All authors have read and agreed to the published version of the manuscript.

Funding

This research was funded by Shangluo University, grant number 23SKY007, and the Science and Technology Bureau of Shangluo City, grant number 23JT010.

Data Availability Statement

The data presented in this study are available on request from the corresponding author.

Acknowledgments

The authors express their thanks to all supporters.

Conflicts of Interest

The authors declare no conflicts of interest.

References

  1. Yu, S.; Ren, X.; Zhang, J.; Wang, H.; Wang, J.; Zhu, W. Seepage, deformation, and stability analysis of sandy and clay slopes with different permeability anisotropy characteristics affected by reservoir water level fluctuations. Water 2020, 12, 201. [Google Scholar] [CrossRef]
  2. Chen, M.L.; Qi, S.C.; Lv, P.F.; Yang, X.G.; Zhou, J.W. Hydraulic response and stability of a reservoir slope with landslide potential under the combined effect of rainfall and water level fluctuation. Environ. Earth Sci. 2021, 80, 25. [Google Scholar] [CrossRef]
  3. Liu, D.; Lin, T.; Gao, J.; Xue, B.; Yang, J.; Chen, C.; Zhang, W.; Sun, W. Study on the influence of water level on earth dam reinforced by cut-off wall: A case study in Wujing reservoir. Water 2022, 15, 140. [Google Scholar] [CrossRef]
  4. Liu, G.; Zhou, Z.; Xu, S.; Mi, W. Hysteresis of dam slope safety factor under water level fluctuations based on the LEM coupled with FEM Method. CMES-Comp. Model. Eng. 2022, 133, 351–375. [Google Scholar] [CrossRef]
  5. Huang, F.; Luo, X.; Liu, W. Stability analysis of hydrodynamic pressure landslides with different permeability coefficients affected by reservoir water level fluctuations and rainstorms. Water 2017, 9, 450. [Google Scholar] [CrossRef]
  6. Xiong, X.; Shi, Z.; Xiong, Y.; Peng, M.; Ma, X.; Zhang, F. Unsaturated slope stability around the Three Gorges Reservoir under various combinations of rainfall and water level fluctuation. Eng. Geol. 2019, 261, 105231. [Google Scholar] [CrossRef]
  7. Mao, J.Z.; Guo, J.; Fu, Y.; Zhang, W.P.; Ding, Y.N. Effects of rapid water-level fluctuations on the stability of an unsaturated reservoir bank slope. Adv. Civ. Eng. 2020, 2020, 6661593. [Google Scholar] [CrossRef]
  8. Zhang, Y.; Zhang, Z.; Xue, S.; Wang, R.; Xiao, M. Stability analysis of a typical landslide mass in the Three Gorges Reservoir under varying reservoir water levels. Environ. Earth Sci. 2020, 79, 42. [Google Scholar] [CrossRef]
  9. Su, Z.; Chen, G.; Meng, Y. Study on seepage characteristics and stability of core dam under the combined action of the variation of reservoir water level and rainfall. Geotech. Geol. Eng. 2021, 39, 193–211. [Google Scholar] [CrossRef]
  10. Li, D.; Li, L.; Xu, L.; Li, C.; Meng, K.; Gao, Y.; Yang, Z. Stability analysis of upstream and downstream dam slopes with water level drawdown using response surface function. Geotech. Geol. Eng. 2022, 40, 3107–3123. [Google Scholar] [CrossRef]
  11. Fredlund, D.; Morgenstern, N.; Widger, R. The shear strength of unsaturated soils. Can. Geotech. J. 1978, 15, 313–321. [Google Scholar] [CrossRef]
  12. Yan, Z.; Wang, J.; Chai, H. Influence of water level fluctuation on phreatic line in silty soil model slope. Eng. Geol. 2010, 113, 90–98. [Google Scholar] [CrossRef]
  13. Xia, M.; Ren, G.; Zhu, S.; Ma, X. Relationship between landslide stability and reservoir water level variation. Bull. Eng. Geol. Environ. 2015, 74, 909–917. [Google Scholar] [CrossRef]
  14. Yang, H.; Zhang, L. Bayesian back analysis of unsaturated hydraulic parameters for rainfall-induced slope failure: A review. Earth-Sci. Rev. 2024, 251, 104714. [Google Scholar] [CrossRef]
  15. Gharehdaghi, M.; Shahbodagh, B.; Khalili, N. Pore pressure parameters for unsaturated soils. Comput. Geotech. 2024, 172, 106441. [Google Scholar] [CrossRef]
  16. Ye, Z.; Liu, X.; Dong, Q.; Wang, E.; Sun, H. Hydro-damage properties of red-bed mudstone failures induced by nonlinear seepage and diffusion effect. Water 2022, 14, 351. [Google Scholar] [CrossRef]
  17. Sun, H.; Liu, X.; Ye, Z.; Wang, E. A new proposed method for observing fluid in rock fractures using enhanced x-ray images from digital radiography. Geomech. Geophys. Geo-Energy Geo-Resour. 2022, 8, 10. [Google Scholar] [CrossRef]
  18. Duncan, J.M.; Wright, S.G. The accuracy of equilibrium methods of slope stability analysis. Eng. Geol. 1980, 16, 5–17. [Google Scholar] [CrossRef]
  19. Song, K.; Yan, E.; Zhang, G.; Lu, S.; Yi, Q. Effect of hydraulic properties of soil and fluctuation velocity of reservoir water on landslide stability. Environ. Earth Sci. 2015, 74, 5319–5329. [Google Scholar] [CrossRef]
  20. Zhou, C.; Cao, Y.; Yin, K.; Intrieri, E.; Catani, F.; Wu, L. Characteristic comparison of seepage-driven and buoyancy-driven landslides in Three Gorges Reservoir area, China. Eng. Geol. 2022, 301, 106590. [Google Scholar] [CrossRef]
  21. Miao, F.; Wu, Y.; Li, L.; Tang, H.; Li, Y. Centrifuge model test on the retrogressive landslide subjected to reservoir water level fluctuation. Eng. Geol. 2018, 245, 169–179. [Google Scholar] [CrossRef]
  22. Li, S.; Xu, Q.; Tang, M.; Li, H.; Yang, H.; Wei, Y. Centrifuge modeling and the analysis of ancient landslides subjected to reservoir water level fluctuation. Sustainability 2020, 12, 2092. [Google Scholar] [CrossRef]
  23. Fang, K.; An, P.; Tang, H.; Tu, J.; Jia, S.; Miao, M.; Dong, A. Application of a multi-smartphone measurement system in slope model tests. Eng. Geol. 2021, 295, 106424. [Google Scholar] [CrossRef]
  24. Wang, Y.; Shen, D.; Chen, J.; Pei, L.; Li, Y.; Lu, X.; Zhang, L. Research and application of a smart monitoring system to monitor the deformation of a dam and a slope. Adv. Civ. Eng. 2020, 2020, 9709417. [Google Scholar] [CrossRef]
  25. Adamo, N.; Al-Ansari, N.; Sissakian, V.; Laue, J.; Knutsson, S. Geophysical methods and their applications in dam safety monitoring. J. Earth Sci. Geotech. Eng. 2021, 11, 291–345. [Google Scholar] [CrossRef]
  26. Vazquez-Ontiveros, J.R.; Martinez-Felix, C.A.; Vazquez-Becerra, G.E.; Gaxiola-Camacho, J.R.; Melgarejo-Morales, A.; Padilla-Velazco, J. Monitoring of local deformations and reservoir water level for a gravity type dam based on GPS observations. Adv. Space Res. 2022, 69, 319–330. [Google Scholar] [CrossRef]
  27. Wang, L.; Wu, C.; Gu, X.; Liu, H.; Mei, G.; Zhang, W. Probabilistic stability analysis of earth dam slope under transient seepage using multivariate adaptive regression splines. Bull. Eng. Geol. Environ. 2020, 79, 2763–2775. [Google Scholar] [CrossRef]
  28. Kumar, V.; Samui, P.; Himanshu, N.; Burman, A. Reliability-based slope stability analysis of Durgawati Earthen Dam considering steady and transient state seepage conditions using MARS and RVM. Indian Geotech. J. 2019, 49, 650–666. [Google Scholar] [CrossRef]
  29. Zewdu, A. Modeling the slope of embankment dam during static and dynamic stability analysis: A case study of Koga dam, Ethiopia. Model. Earth Syst. Environ. 2020, 6, 1963–1979. [Google Scholar] [CrossRef]
  30. Hailu, M.B. Modeling assessment of seepage and slope stability of dam under static and dynamic conditions of Grindeho Dam in Ethiopia. Earth Syst. Environ. 2021, 7, 2231–2239. [Google Scholar]
  31. Pakmanesh, M.; Jahromi, S.H.M.; Khosrojerdi, A.; Darvishi, H.H.; Babazadeh, H. Experimental and numerical study of upstream slope stability in an earth dam reservoir under rapid drawdown conditions. Prog. Comput. Fluid Dyn. 2021, 21, 248–260. [Google Scholar] [CrossRef]
  32. Izumi, A.; Sawada, Y.; Hori, T.; Maki, R. Centrifuge modelling of small earth dams subjected to the combined effects of rainfall and earthquakes. Soil Dyn. Earthq. Eng. 2021, 151, 106963. [Google Scholar] [CrossRef]
  33. Chen, J.; Cai, X.; Lale, E.; Yang, J.; Cusatis, G. Centrifuge modeling testing and multiscale analysis of cemented sand and gravel (CSG) dams. Constr. Build. Mater. 2019, 223, 605–615. [Google Scholar] [CrossRef]
  34. Jia, C.; Chen, F.; Zhang, Q.; Gu, J.; Hu, J.; Chen, H.; Cheng, W. Centrifuge modeling and numerical analysis of reservoir bank landslides triggered by a fast two-step drop in water level. Bull. Eng. Geol. Environ. 2023, 82, 465. [Google Scholar] [CrossRef]
  35. Miao, F.; Wu, Y.; Török, Á.; Li, L.; Xue, Y. Centrifugal model test on a riverine landslide in the Three Gorges Reservoir induced by rainfall and water level fluctuation. Geosci. Front. 2022, 13, 101378. [Google Scholar] [CrossRef]
  36. Harada, Y.; Goto, H.; Sawada, S. Initiation process of tension cracks in soil embankment on liquefied sandy ground investigated from centrifuge model test. Soil Dyn. Earthq. Eng. 2022, 161, 107444. [Google Scholar] [CrossRef]
  37. Lee, Y.H.; Yamakawa, S.; Tobita, T.; Hong, H.K.; Song, H.S.; Kim, J.J.; Lee, D.W. Centrifugal model study of seepage and seismic behavior in a homogeneous reservoir dam with parapet. Appl. Sci. 2023, 13, 6347. [Google Scholar] [CrossRef]
  38. Abdoun, T.; Bennett, V.; Desrosiers, T.; Simm, J.; Barendse, M. Asset management and safety assessment of levees and earthen dams through comprehensive real-time field monitoring. Geotech. Geol. Eng. 2013, 31, 833–843. [Google Scholar] [CrossRef]
  39. Wang, Q.; Gao, Y.; Gong, T.; Liu, T.; Sui, Z.; Fan, J.; Wang, Z. Dam surface deformation monitoring and analysis based on PS-InSAR technology: A case study of xiaolangdi reservoir dam in China. Water 2023, 15, 3298. [Google Scholar] [CrossRef]
  40. Su, H.; Hu, J.; Yang, M. Dam seepage monitoring based on distributed optical fiber temperature system. IEEE Sens. J. 2014, 15, 9–13. [Google Scholar] [CrossRef]
  41. Van Genuchten, M.T. A closed-form equation for predicting the hydraulic conductivity of unsaturated soils. Soil Sci. Soc. Am. J. 1980, 44, 892–898. [Google Scholar] [CrossRef]
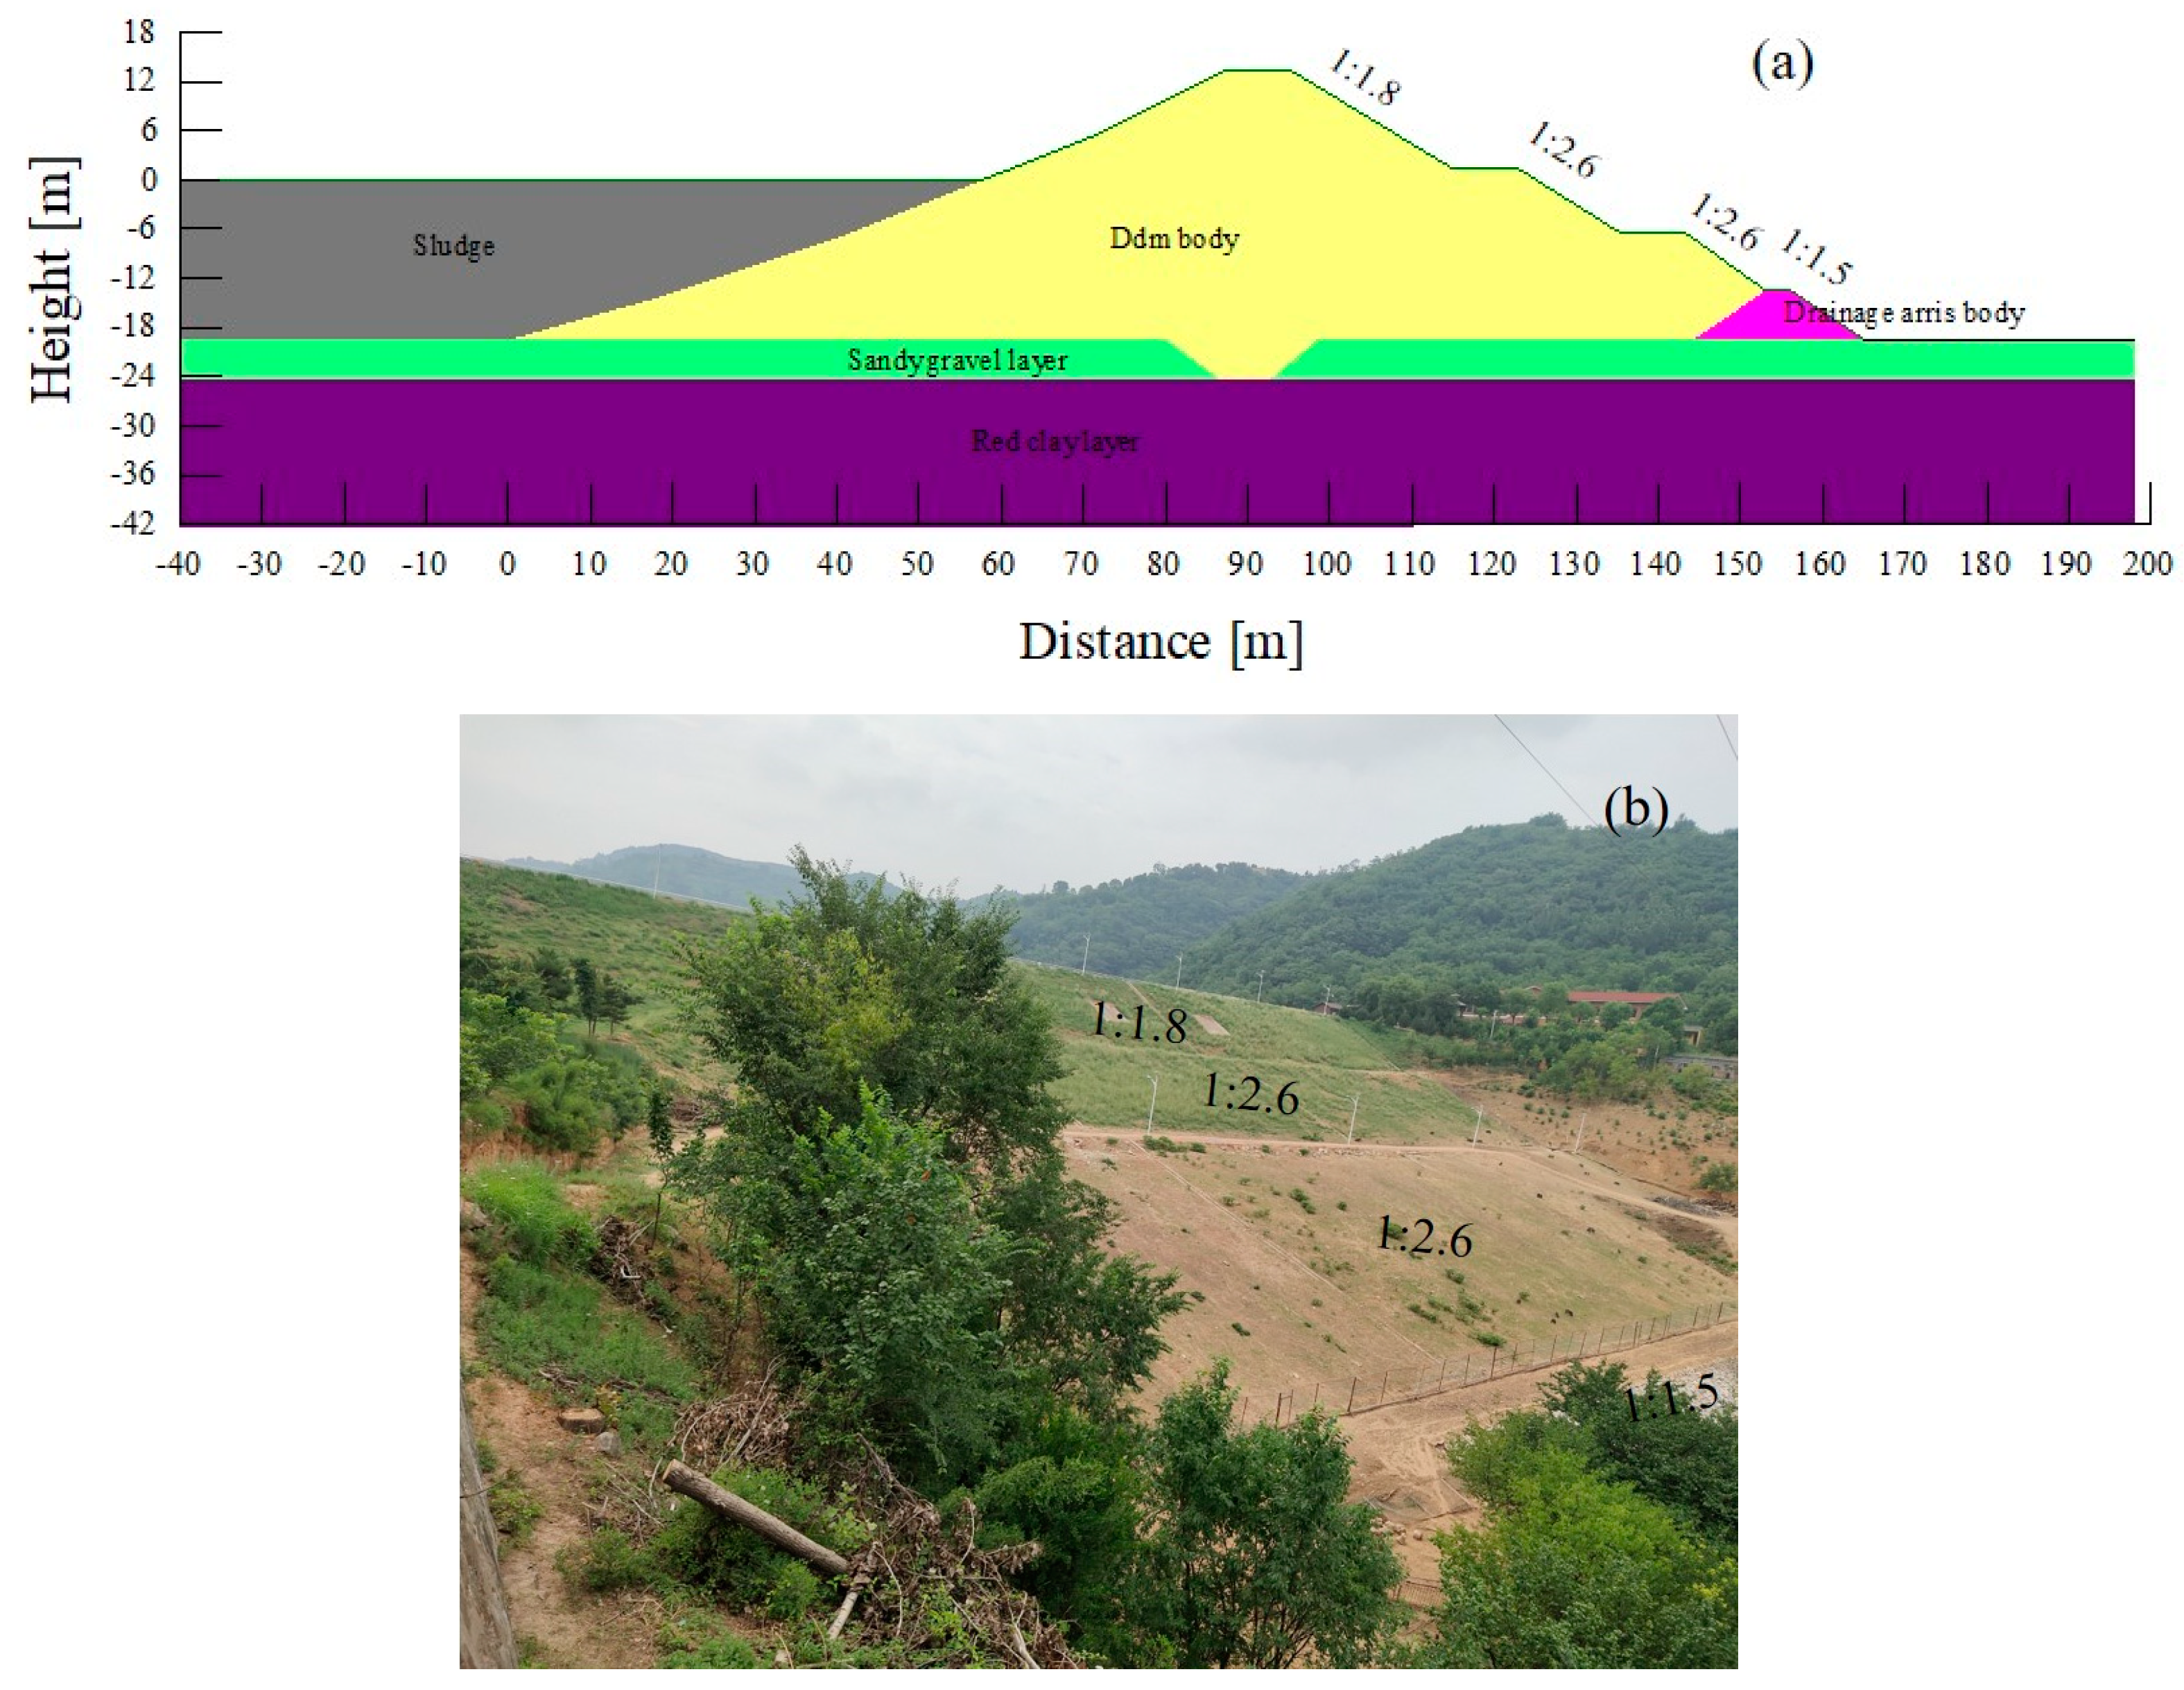
Figure 1. Project profile of the Hanyu reservoir. (a) Model of the reference dam. (b) Picture of the dam slope.
Water 16 01811 g001
Figure 2. Finite element model of the dam.
Water 16 01811 g002
Figure 3. Seepage within the dam under different reservoir water levels. (a) Seepage at the lowest water level under the water level dropping. (b) Seepage at the lowest water level under the water level rising. (c) Seepage at the water level of 5 m under the water level dropping. (d) Seepage at the water level of 5 m under the water level rising.
Water 16 01811 g003aWater 16 01811 g003b
Figure 4. Pore water pressures at the representative points as water levels fluctuate. (a) Pore water pressure variation at point B. (b) Pore water pressure variation at point C. (c) Pore water pressure variation at point D.
Water 16 01811 g004
Figure 5. The critical sliding surface of the downstream slope.
Water 16 01811 g005
Figure 6. Variations in the downstream slope safety factor with fluctuations in the reservoir water level.
Water 16 01811 g006
Figure 7. Pore water pressure variation at the representative points under different water level fluctuation rates. (a) Pore water pressure at point B. (b) Pore water pressure at point C. (c) Pore water pressure at point D.
Water 16 01811 g007
Figure 8. Downstream slope Fs variation under different water level fluctuation rates. (a) Fs variation under a water level fluctuation rate of 1 m/d. (b) Fs variation under a water level fluctuation rate of 2 m/d. (c) Fs variation under a water level fluctuation rate of 3 m/d. (d) Fs variation under a water level fluctuation rate of 4 m/d. (e) Fs variation under a water level fluctuation rate of 5 m/d.
Water 16 01811 g008
Figure 9. Variation in the pore water pressure of the representative points under the water level fluctuation rate of 1 m/d, taking into account the SWCC hysteresis. (a) Variation in the pore water pressure at point B. (b) Variation in the pore water pressure at point C. (c) Variation in the pore water pressure at point D.
Water 16 01811 g009
Figure 10. Variation in the Fs of the downstream slope under different water level fluctuation rates, taking into account the SWCC hysteresis. (a) Variation in Fs under a water level fluctuation rate of 1 m/d. (b) Variation in Fs under a water level fluctuation rate of 2 m/d. (c) Variation in Fs under a water level fluctuation rate of 3 m/d. (d) Variation in Fs under a water level fluctuation rate of 4 m/d. (e) Variation in Fs under a water level fluctuation rate of 5 m/d.
Water 16 01811 g010
Table 1. Permeability parameters of desorption.
MaterialsKh
m/s
KrDesorption SWCC
a
kPa
mnθsθr
Dam body5.41 × 10−60.22869.550.512.030.5200.213
Drainage arris6.11 × 10−41.001266.770.9010.400.2500.153
Sludge1.50 × 10−80.936576.950.151.170.4460.002
Sandy gravel6.00 × 10−41.001265.800.9210.400.2510.153
Red clay1.00 × 10−81.016576.950.652.770.4300.201
Notes: Kh is the saturated permeability coefficient; Kr is the relative permeability coefficient defined as the ratio of permeability under the saturated condition and the unsaturated condition.
Table 2. Permeability parameters of adsorption.
MaterialsKh
m/s
KrAdsorption SWCC
a′
kPa
mn′θsθr
Dam body5.41 × 10−60.22510.000.642.770.4300.213
Table 3. Mechanical parameters of the dam model.
Materialsγ
kN/m3
γs
kN/m3
C′
kPa
Φ′
°
Φb
°
Sludge17.018.2017.2218.219.20
Dam body material18.8719.6114.1521.0010.75
Drainage arris21.6222.500.0035.2117.52
Sandy gravel layer21.6222.100.0033.0017.22
Red clay layer21.5521.3058.2116.538.10
Disclaimer/Publisher’s Note: The statements, opinions and data contained in all publications are solely those of the individual author(s) and contributor(s) and not of MDPI and/or the editor(s). MDPI and/or the editor(s) disclaim responsibility for any injury to people or property resulting from any ideas, methods, instructions or products referred to in the content.