1. Introduction
The Saudi Water Authority (SWA), formerly the Saline Water Conversion Corporation (SWCC), is the largest producer of potable water in the Kingdom of Saudi Arabia (KSA), producing approximately 6 million m
3/day of desalinated water and responsible for delivering approximately 11 million m
3/day of water to domestic and industrial consumers. Most of the water transported through the SWA system is produced by desalination of seawater by the SWA or private operators, but at a number of locations, significant quantities of groundwater (e.g., Riyadh province) or surface water (e.g., Makkah al-Mukarrimah, Asir, Jazan) are added. Of necessity, SWA carries out regular analysis of water quality in its water production and transmission system, comprising over thirty desalination plants, three major dams, thousands of kilometers of transmission lines, and hundreds of storage tanks (
Figure 1). Currently, about 35% of SWCC desalinated water production is by reverse osmosis (RO), with the majority of the rest by multistage flash (MSF) thermal desalination. This proportion is expected to reverse by 2030, with only the most recently constructed and relatively efficient thermal plants remaining in operation by that date and a new generation of RO plants having been completed. KSA is the most populous country dependent primarily on drinking water from seawater desalination and is unique among these countries in that the majority of this water is transported for considerable distances before consumption.
A concerted program to monitor the quality of water produced by the SWCC first began in 1991. At that time, it was limited to stations on the Arab Gulf coast only, with monthly samples of water produced from the desalination plants at Jubail, Khobar, and Khafji sent to the SWCC’s research centre in Jubail for chemical analysis. In 2011, this water quality monitoring program was extended to the produced water from all plants on the eastern and western coasts.
In 2013, a program to monitor the formation of bromate ions was initiated. This program includes collecting four samples of produced water taken from different places as follows: produced water before treatment; produced water after remineralisation; produced water after chlorination; and water at storage tank outlet.
Development of a systematic program to monitor the quality of water produced from desalination plants in the SWCC system began in 2018, with implementation of the developed program from 2019 onwards. The goal of the program is to perform all necessary chemical, physical, and biological analyses in a timely manner in internal SWCC laboratories. This is necessary for the water produced from desalination plants with high accuracy and reliability to verify its conformity with national specifications and standards.
The program must be able to deal with developments, changes, and emergency situations, such as the following:
Replacement of disinfectants used in the desalination industry;
Adding groundwater or dam water to desalinated water;
Dealing with incidents such as oil spills or chemical contamination of seawater;
Incorporation of new analyses in response to changes in specifications, standards, and other variables.
The critical values for water quality are the national standards of the Saudi Arabian Standards Organization (SASO) approved by the Ministry of Environment, Water and Agriculture of the Kingdom of Saudi Arabia (MEWA) [
1,
2], which are based on the current World Health Organization (WHO) guidelines [
3]. In addition, SWA has a more rigorous internal set of standards for produced water quality based on ensuring the reliability of the transmission system. Variables that are monitored in the developed monitoring program are as follows:
Basic chemical analysis. pH, TDS, electrical conductivity, total alkalinity, residual chlorine, chloride, sodium, potassium, calcium, magnesium, bicarbonate, and sulfate.
Nutrients for microbial organisms. Ammonia, nitrate, nitrite, phosphate, and silica.
Inorganic elements. Arsenic, selenium, mercury, lead, chromium, cadmium, iron, copper, manganese, nickel, cobalt, aluminium, uranium, zinc, barium, vanadium, beryllium, molybdenum, etc.
Organic materials. Qualitative and quantitative estimation of organic compounds likely to be present in water.
Disinfection by-products. Trihalomethanes, haloacetic acids, bromate, chlorate, chlorite.
Biological (microbial) analysis.
Radioactive isotopes.
This report gives an overview of key aspects of water quality throughout the SWCC system for the years 2020–2022, focussing on basic chemical analyses, inorganic elements, and disinfection by-products. To our knowledge, this is the first published comprehensive assessment of water quality across the water production and transmission network in KSA. Due to the nature of the water produced, microbial nutrients, organic materials, biological contamination, and radioactive isotopes are uniformly low throughout the SWCC system over the period of study.
Parameters reported on in this manuscript are pH, total dissolved solids (TDS), total hardness, residual chlorine concentration, total trihalomethane (TTHM) load, and bromate, arsenic, cadmium, chromium, mercury, lead, selenium, copper, iron, manganese, nickel, and boron concentrations. Together with microbiological parameters, these are the most critical parameters for ensuring the safety and robustness of the water supply.
Currently, the SWA water production and transmission system is in a state of transition as the company implements a vision to replace less energy-efficient thermal desalination methods with more energy-efficient membrane-based methods over a relatively short period. A snapshot of the current water quality is a valuable tool to help ensure that water quality is maintained as production shifts from one method to the other.
3. Results and Discussion
3.1. pH
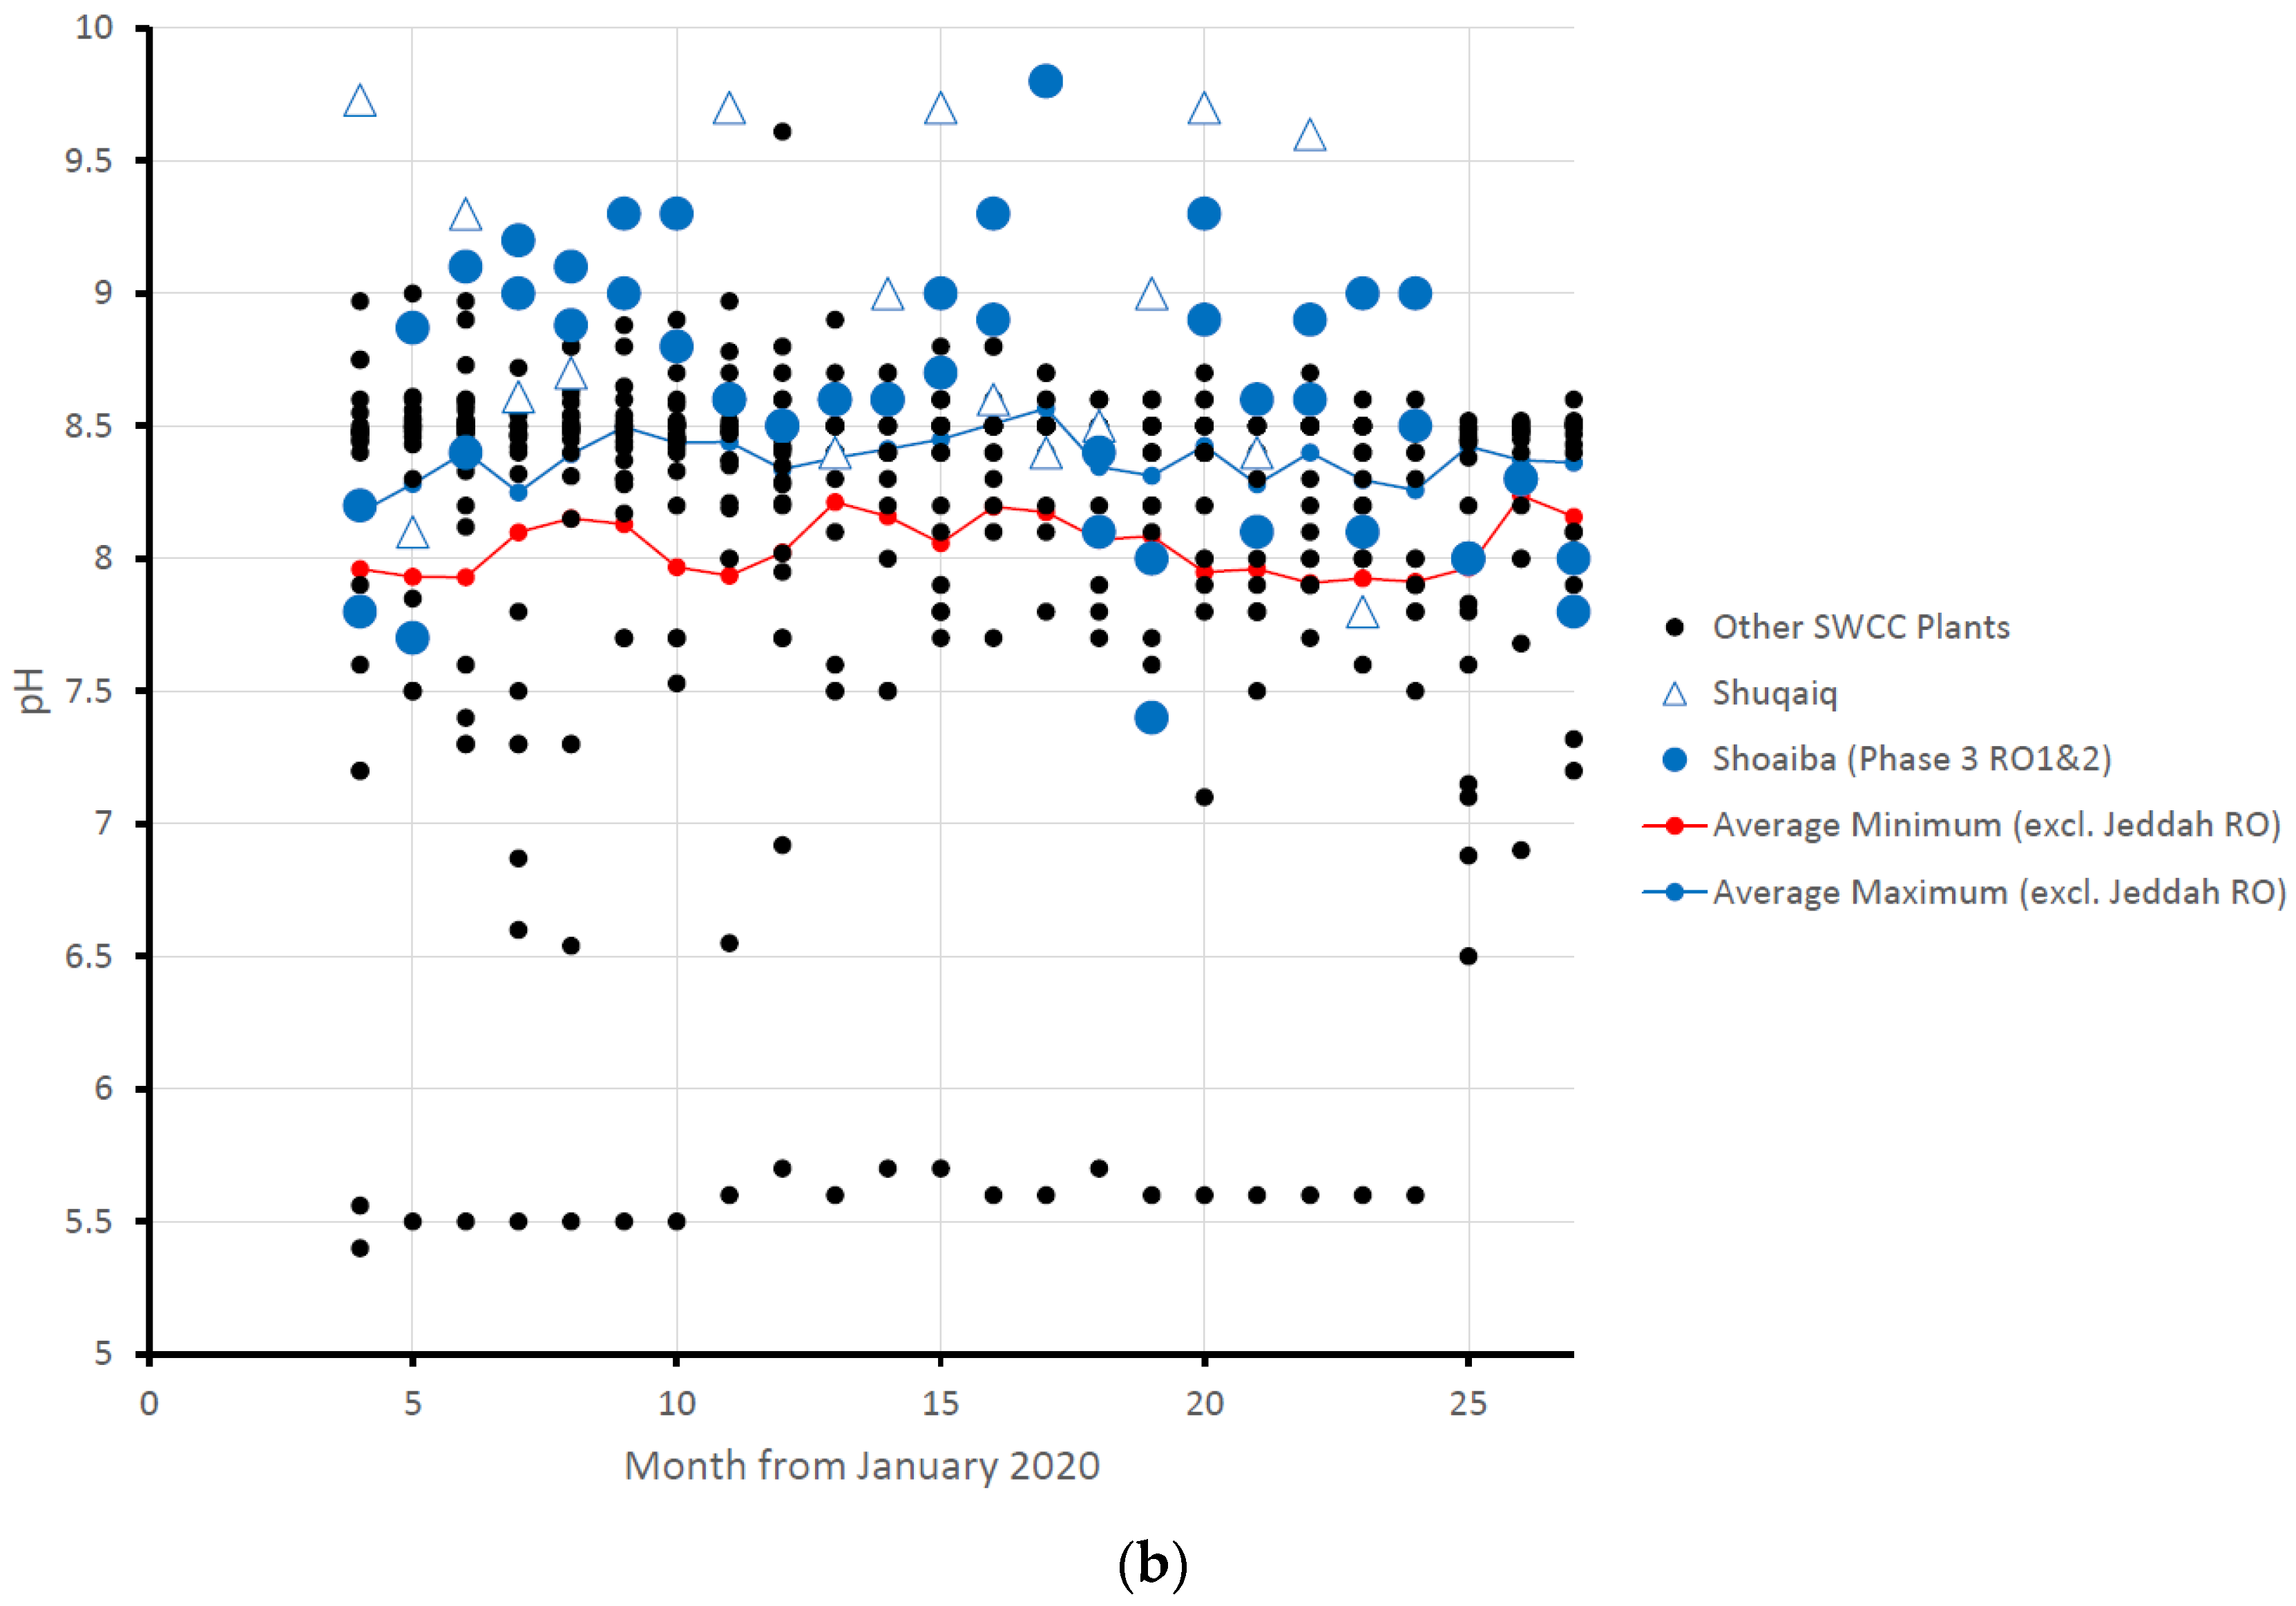
Maximum and minimum monthly pH values recorded for sites across the SWCC system are given in
Tables S1 and S2. For desalination, plants produce water, and these results are summarised in
Figure 2. To meet MEWA requirements, nonbottled drinking water should be between pH 6.5 and 8.5. The only plant that produced water below MEWA requirements, Jeddah 3, is a privately operated plant that does not carry out post-treatment on site and relies on mixing with other sources to meet final quality requirements.
For the protection of older transmission and distribution systems from corrosion, SWCC aims to achieve a pH between 8.1 and 8.5. Post-treatment frequently did not meet the minimum target of pH 8.1, with a number of thermal (Khobar 2, Shoaibah 1&2, Shuqaiq, Yanbu 2) and RO (Khobar, Shoaibah 3, Jeddah 1&2), Yanbu 3, Azizia) desalination plants often having an average minimum monthly pH below the target. The plants where minimum average values consistently below the SWCC target were found over the entire course of the study were Khobar 2, Shoaibah 1&2, Shoiabah 3 RO, and Jeddah 1&2. These low levels may lead to potential difficulties in maintaining a Langelier saturation index (LSI) sufficient to prevent corrosion in transmission and distribution systems reliant on water transported from these sites.
Excursions above the target pH maximum (8.5) were more frequent, with numerous plants having an average maximum monthly pH above the MEWA guidelines and SWCC target for one or more years of the study. Only one plant (Shuqaiq) showed annual average maximum pH values for produced water (pH 8.7–9.0) over the course of the study. While these elevated pH levels have no direct effects on health, the suitability of water for industrial applications, or the reliability of the transmission and distribution systems, higher pH levels make chlorination less effective and lead to higher concentrations of THMs and bromate. This suggests that monitoring residual chlorine, TTHMs, and bromate is critical in distribution systems dependent on the Jubail, Shuqaiq, and Shoaibah plants.
The dams administered by the SWCC and all sampling points within the transmission system met MEWA guidelines for minimum pH at all times. Surface freshwaters usually have pH values in the wider range of 6.0–8.5 [
4], so it is not surprising that these dams had pH levels below the SWCC target of 8.1. Average annual values for the three dams surveyed ranged between pH 6.6 and 8.0 over the period of the study. The groundwater feed into Riyadh city was also below the SWCC target (average annual minimum values pH 7.4–7.9).
Within the transmission system, average monthly minimum values below the SWCC target were reported from pumping stations and storage tanks along the transmission lines serving Makkah al-Mukarrimah, Abha, and Jazan. This is consistent with the desalination plant data, where the plant serving Abha and Jazan (Shuqaiq) and the majority of the plants serving Makkah al-Mukarrimah (Shoaibah 1&2 and RO 3) showed excursions below pH = 8.1. Only a small number of tanks on the lines to Makkah al-Mukarrimah and Abha lines had pH values consistently below the monthly SWCC target minimum over the time period of the study, consistent with loss of carbonate to scale deposition on transmission and storage.
Average monthly maximum pH values slightly exceeding the MEWA and SWCC guidelines were consistently reported throughout the transmission line running from Riyadh northwest to Buraidah in 2020–2021 (pH 8.5–8.7), which is fed by the Jubail desalination plant. Vales of pH were not consistently above the guidelines at other pumping stations or storage tanks in the transmission system. No systematic correlation was observed between plants showing high pH excursions and the transmission lines dependent on them, suggesting that high pH excursions in produced water are often smoothed out by temporal and spatial mixing of source waters.
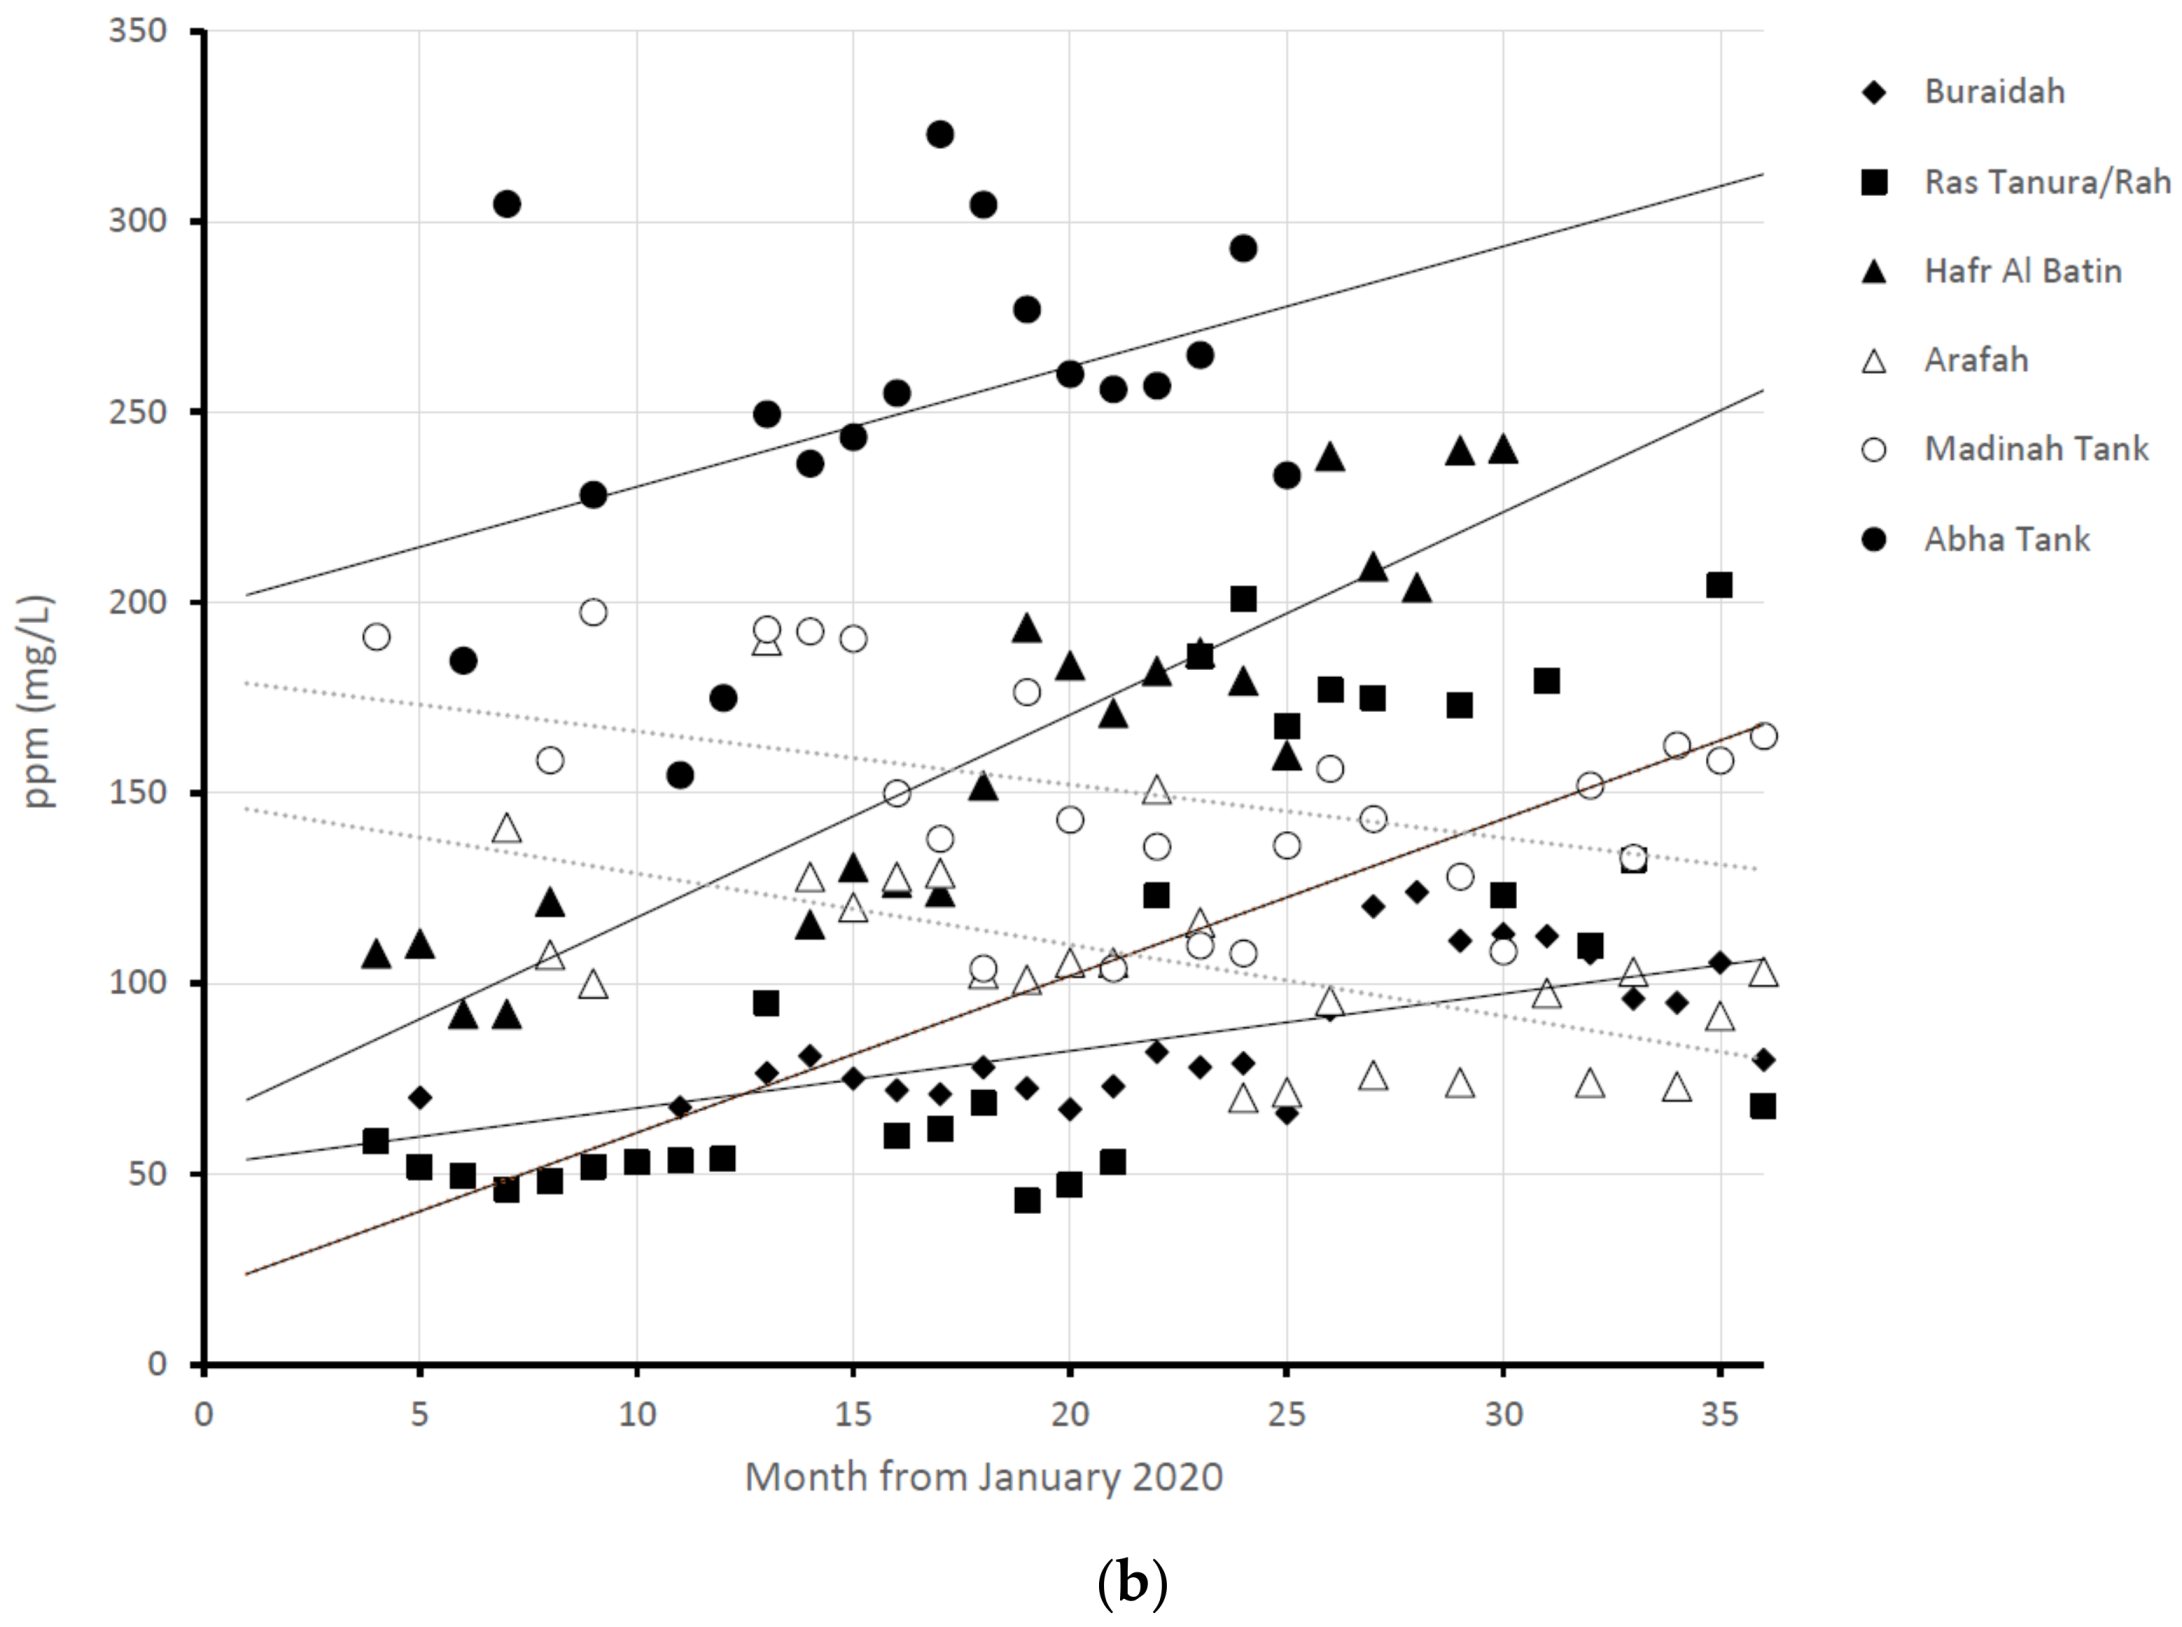
3.2. Total Dissolved Solids
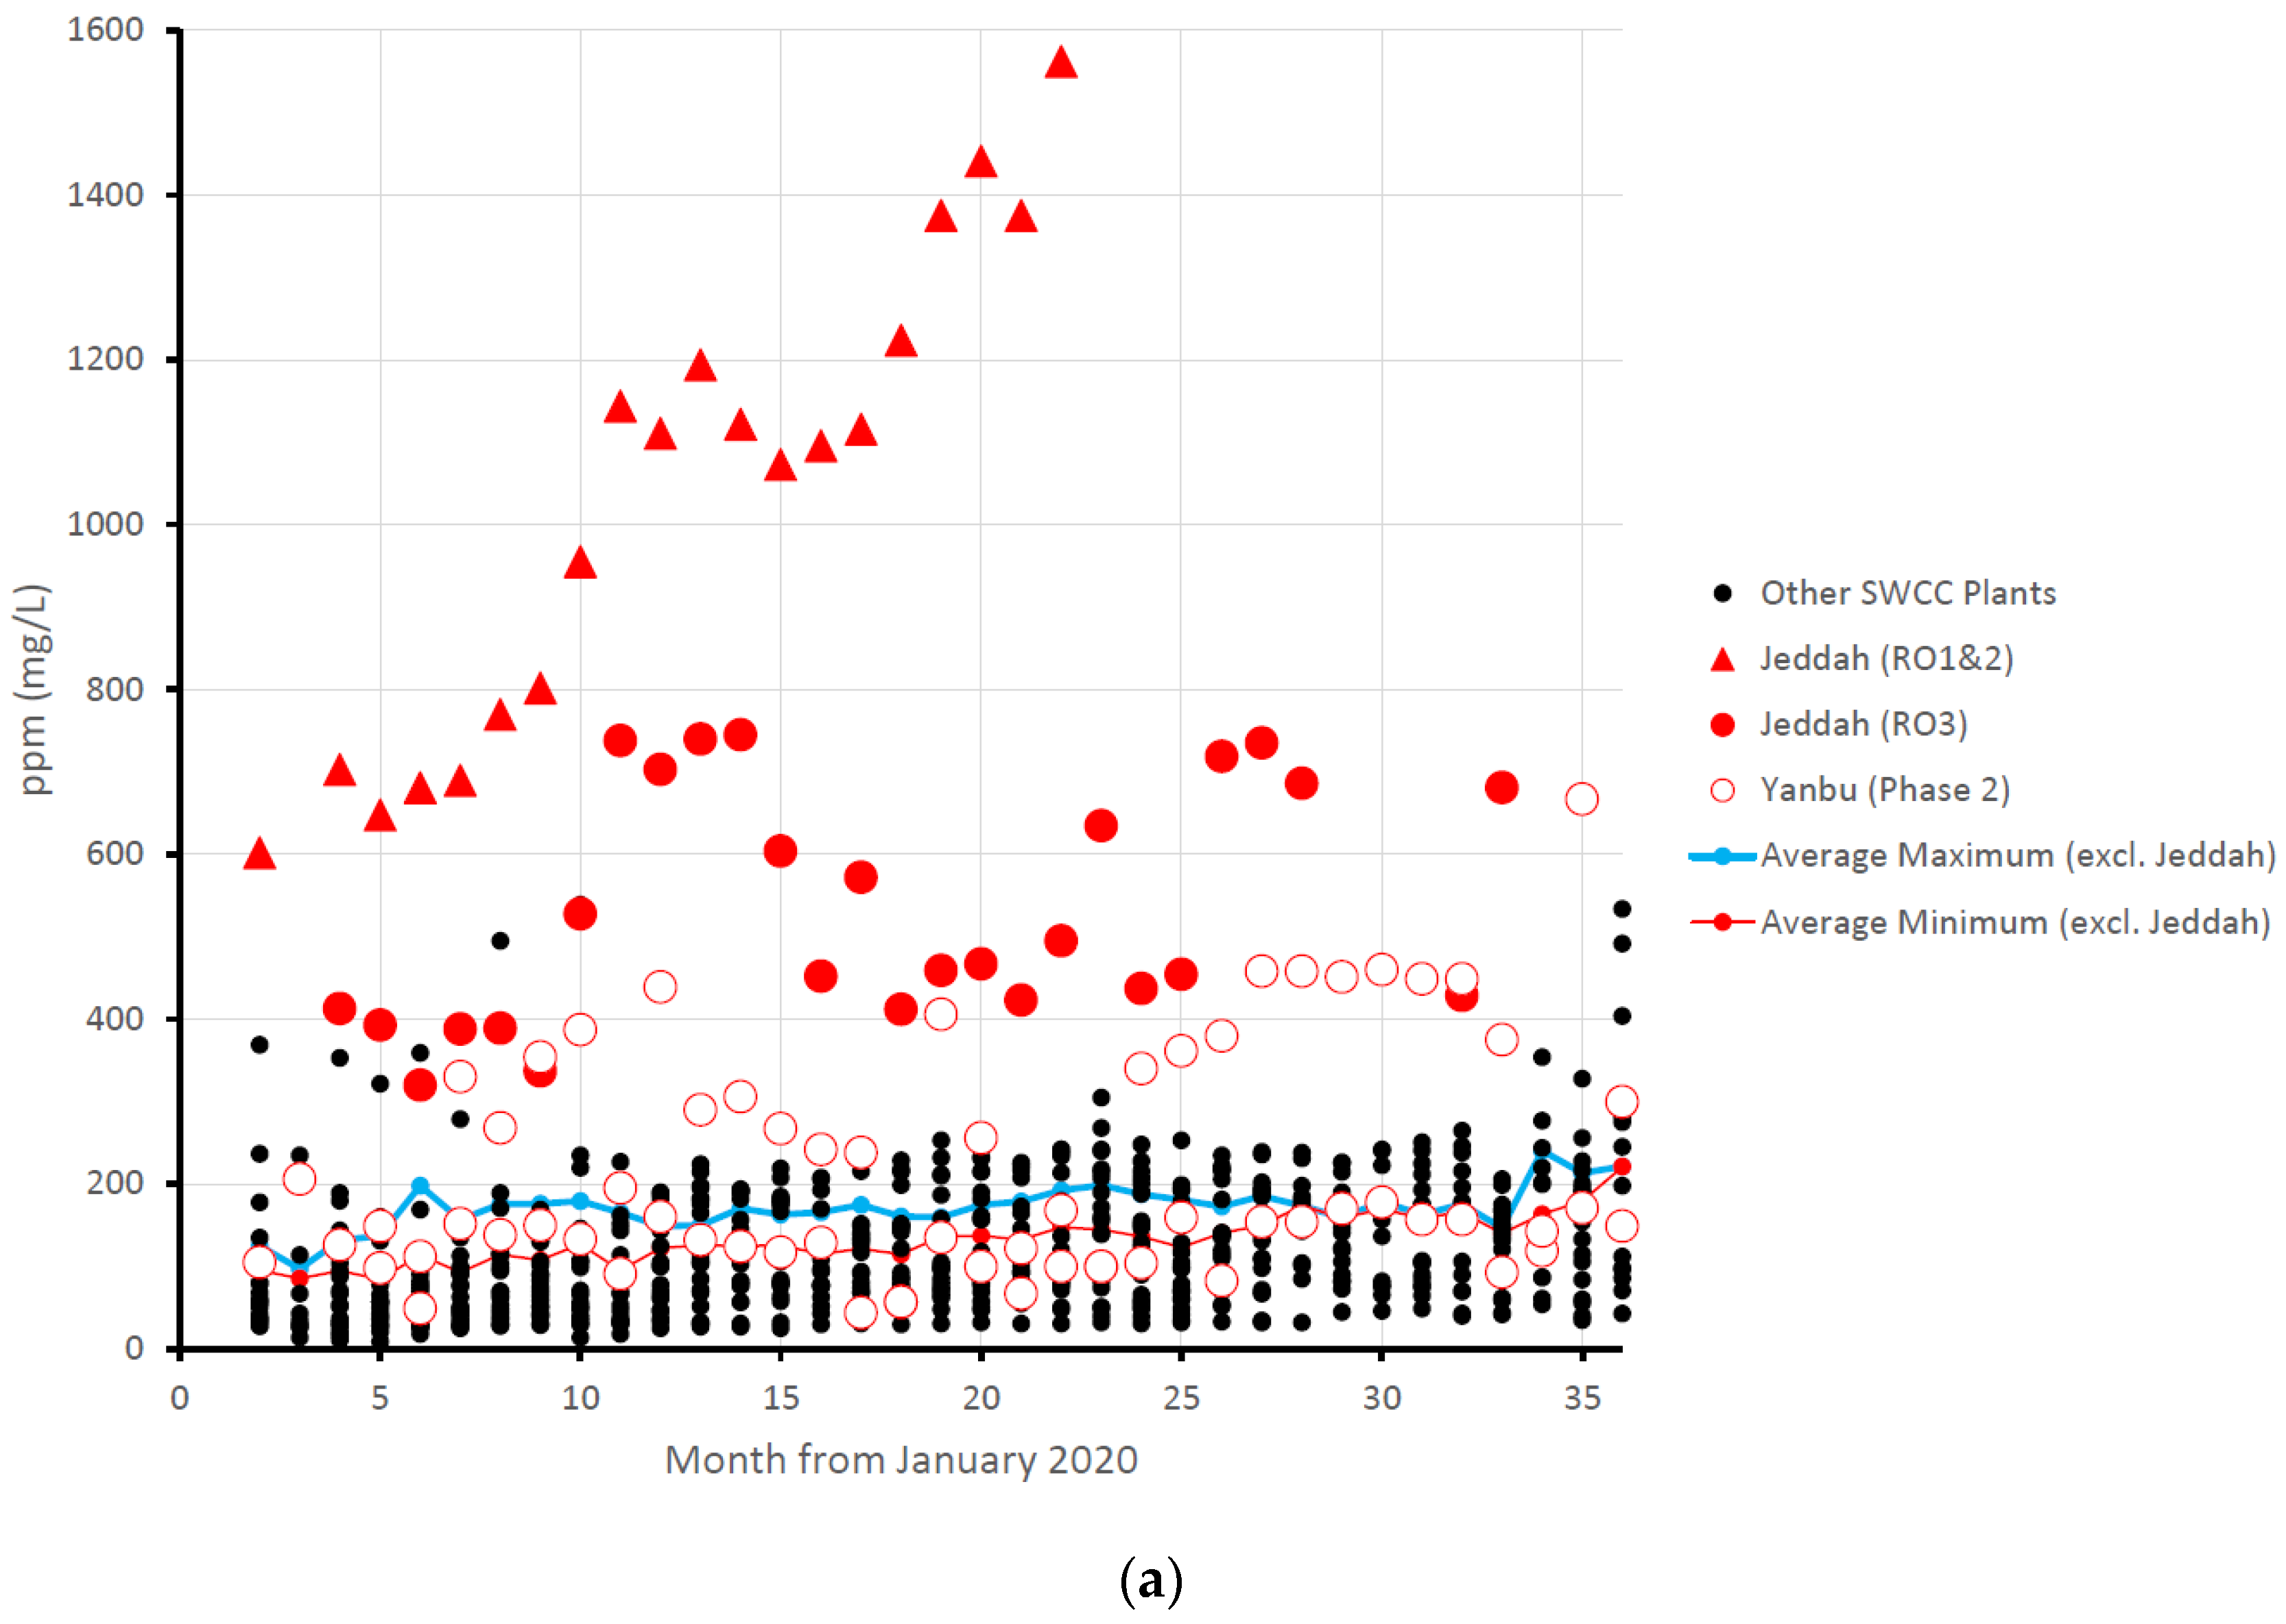
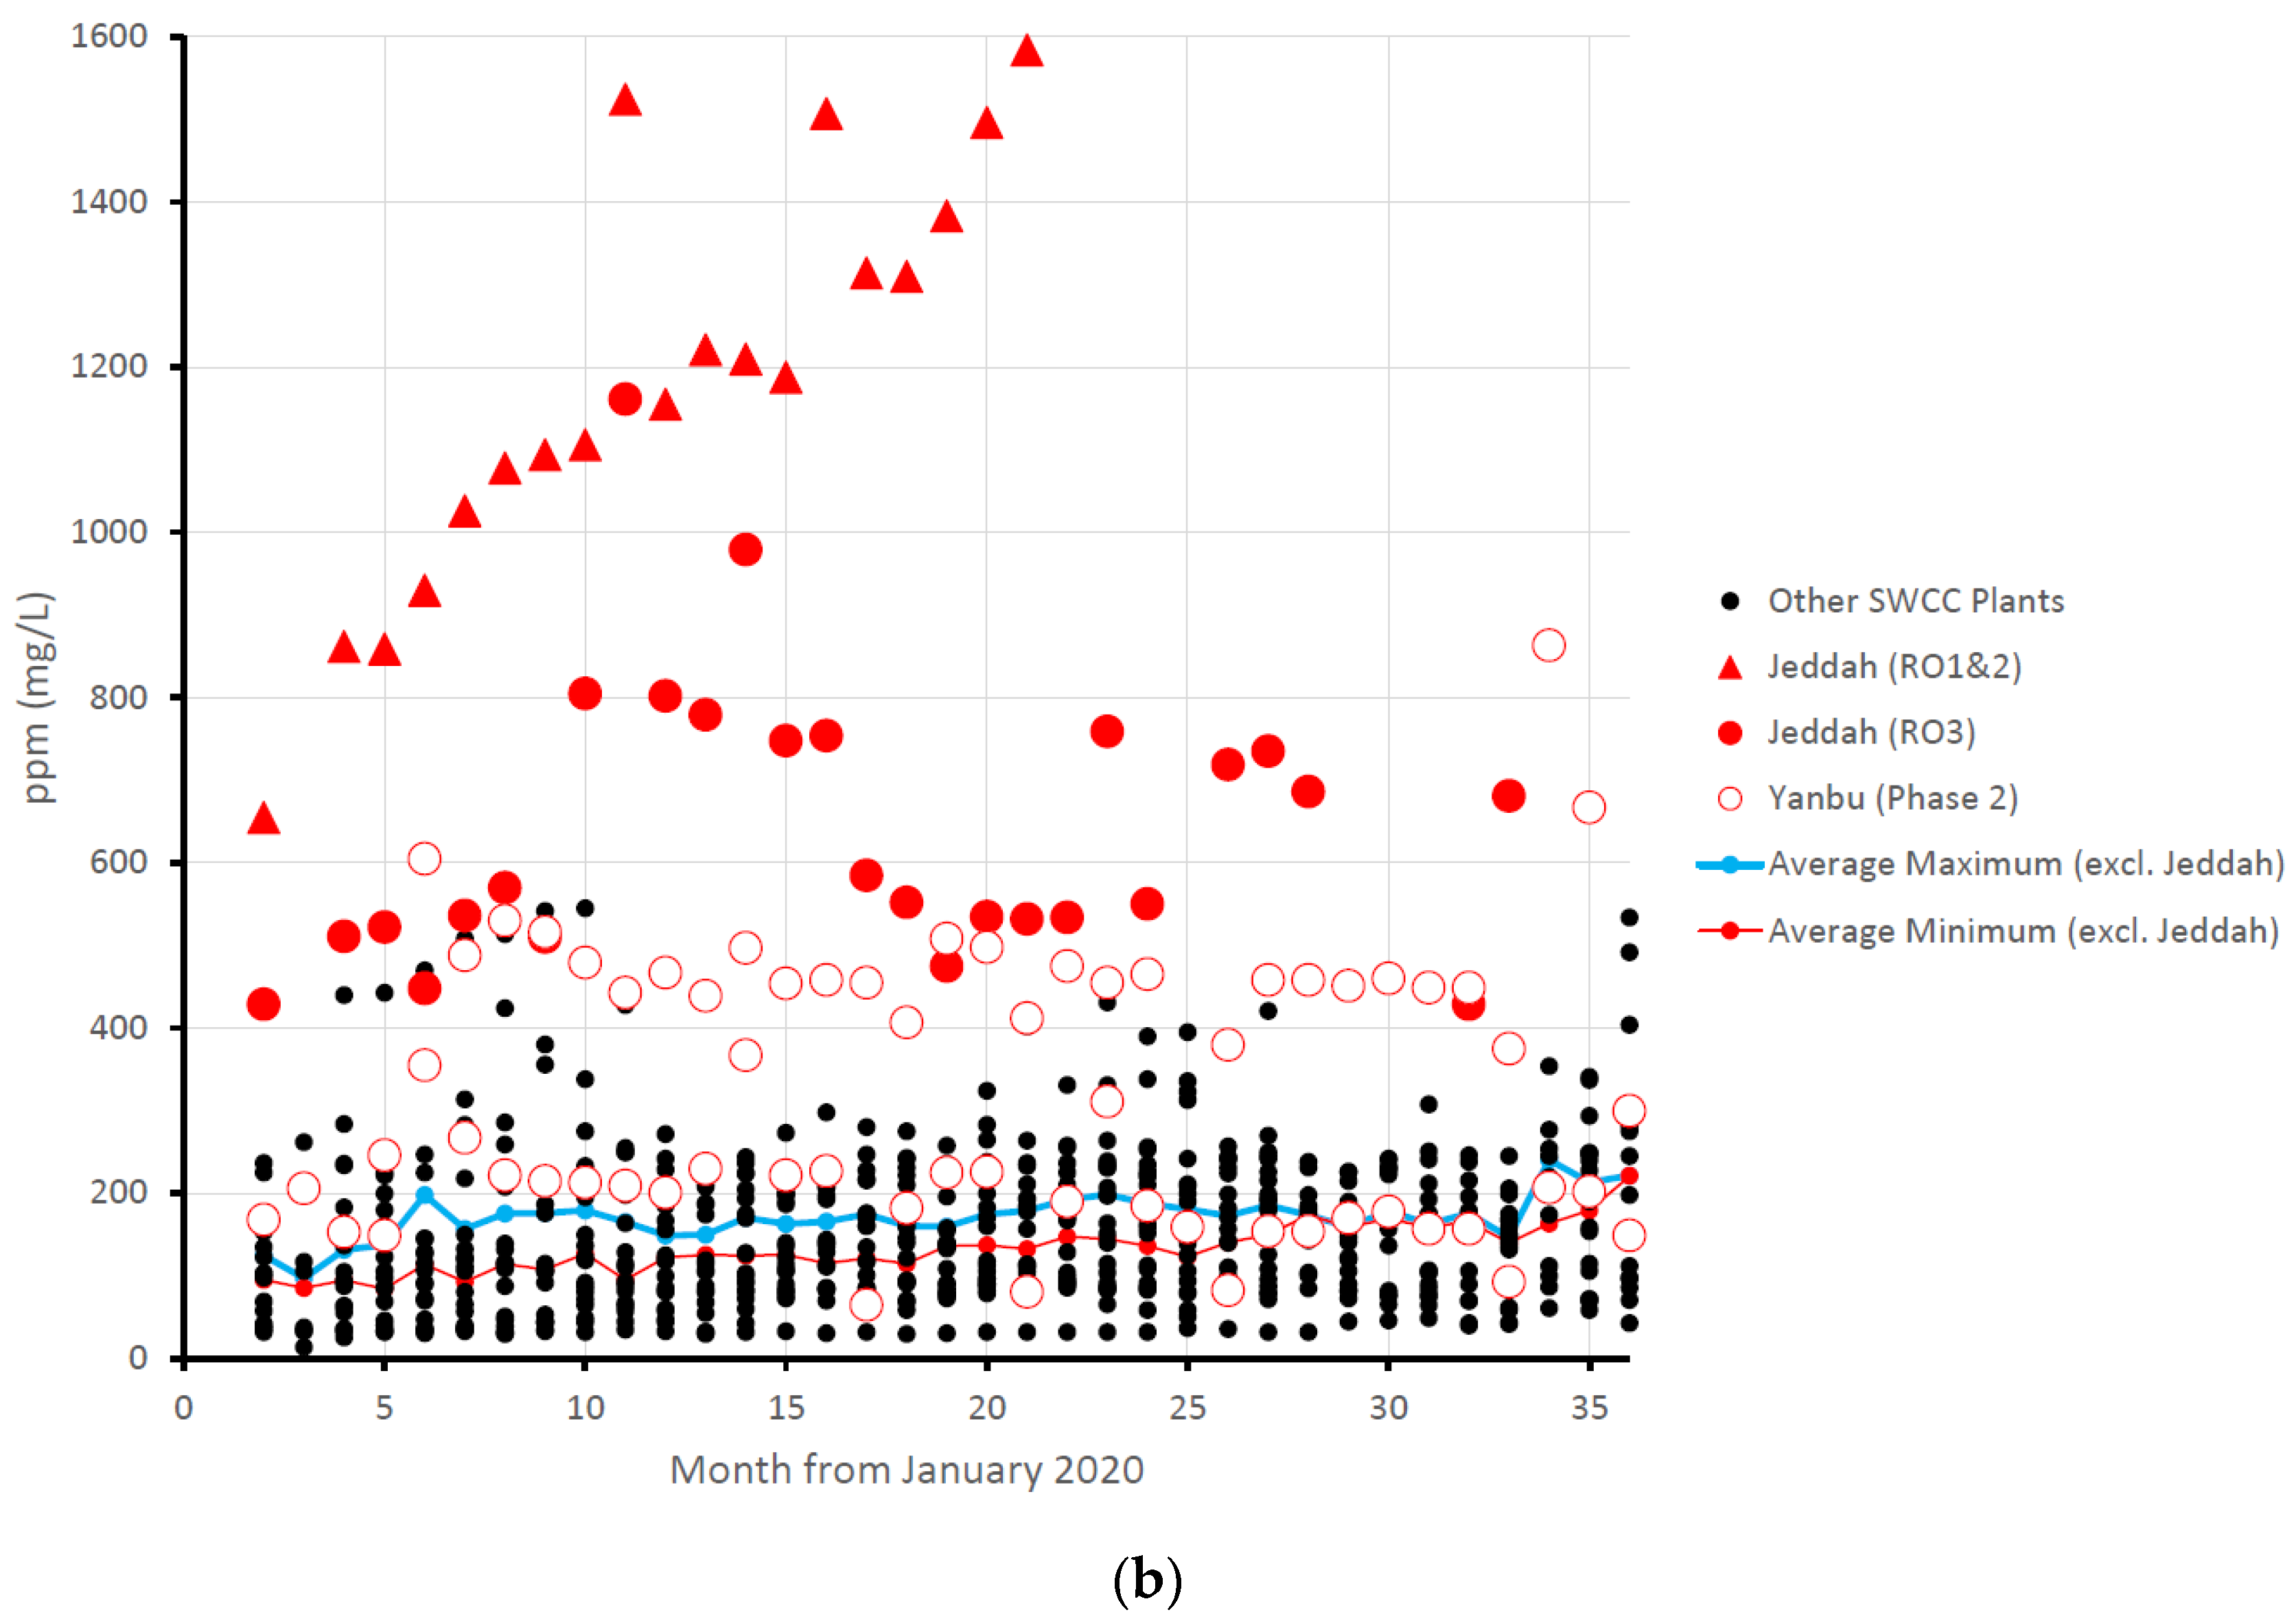
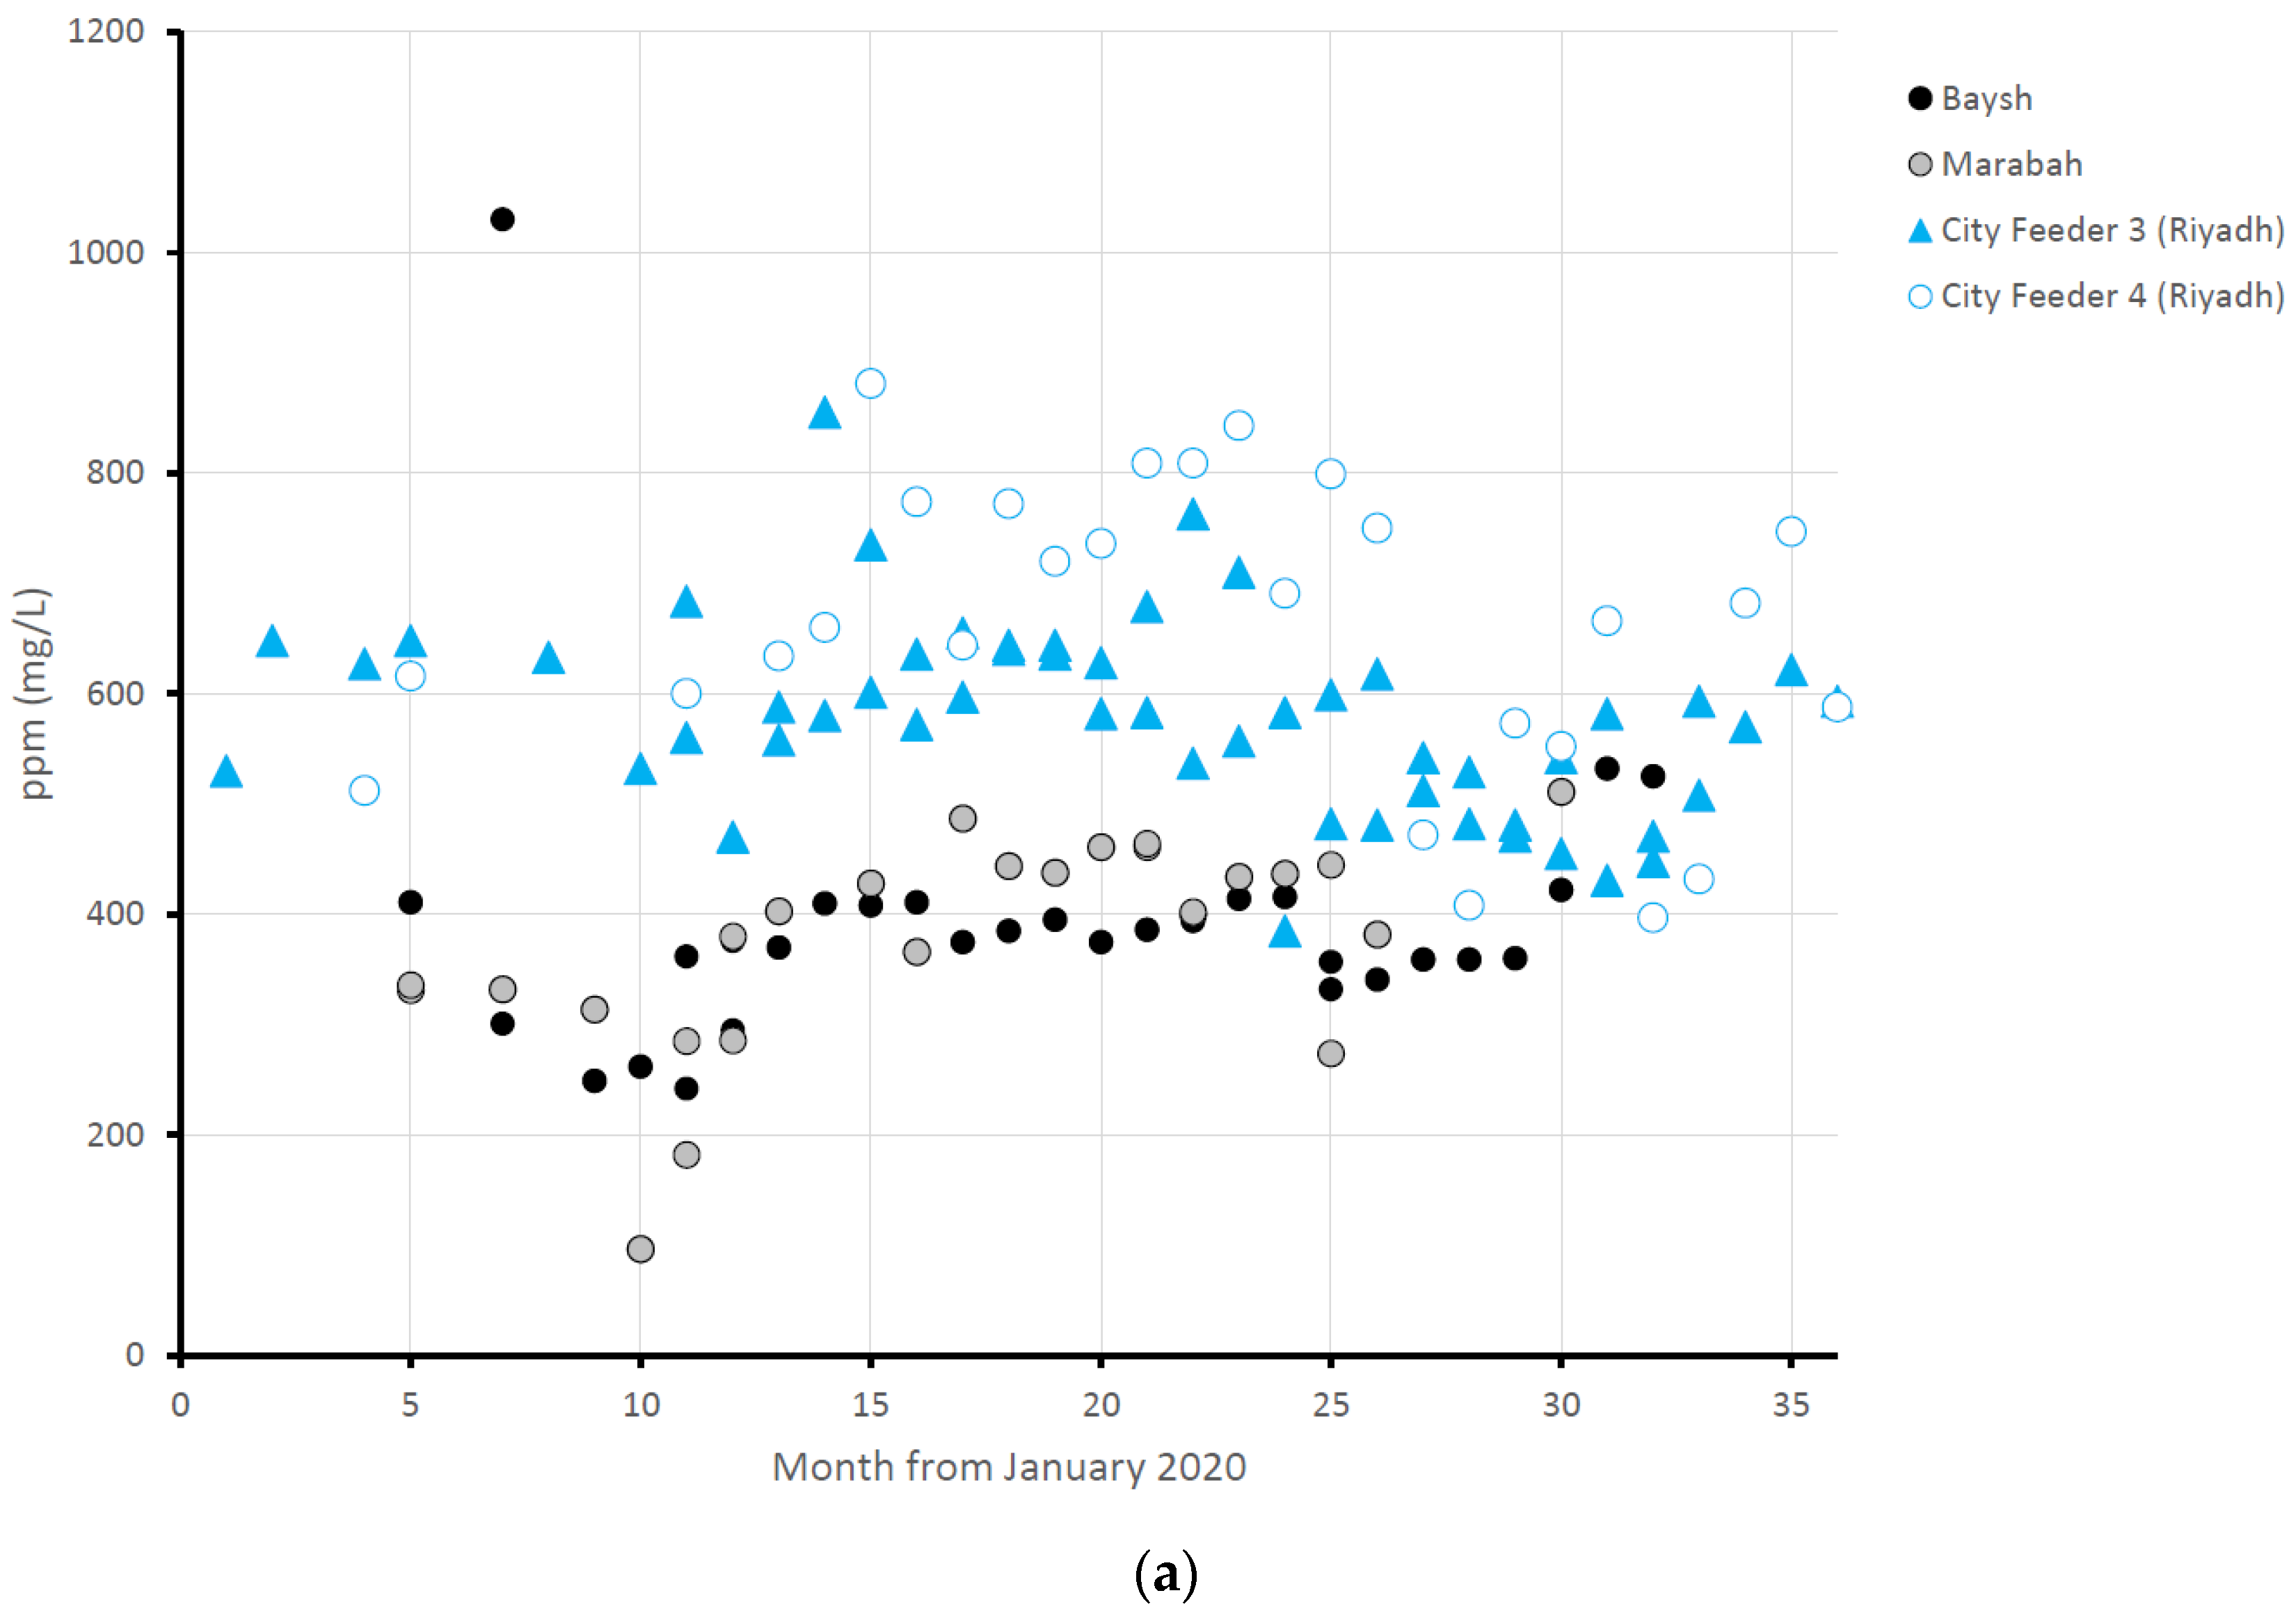
Maximum and minimum monthly pH values recorded for sites across the SWCC system are summarised in
Figure 3 (for desalination plants) and
Figure 4 (for transmission lines and non-desalination sources), with details given in
Tables S3 and S4.
Maintenance of a minimum TDS in potable water is necessary for the security of the transmission system, as it is difficult to maintain an appropriate LSI to avoid corrosion at low TDS. There is no WHO guideline for minimum levels of TDS and no firm evidence for any negative health effects of consuming low TDS water, but MEWA has set a guideline of 100 ppm, which is the target for SWCC. Desalination plants consistently producing water with minimum TDS below the MEWA guideline of 100 ppm over the course of the study are the thermal plants Jubail 2, Shoaibah 2&3, and Shuqaiq and the RO plants Shoaibah 3, Azizia, Rabigh and Yanbu 3. The waters produced at Shoiabah and Yanbu are mixed with other sources prior to transmission, so they should not be of concern, but these low TDS values are of potential concern to the extensive transmission systems extending from Jubail and Shuqaiq. With the planned replacement of the thermal plant system with additional RO plants, which usually produce higher TDS water, this is not likely to be a long-term concern.
There are no health-based guidelines for maximum TDS in KSA. However, above 1000 ppm TDS, water becomes increasingly unpalatable, and 1000 ppm is the MEWA guideline for maximum TDS. At higher TDS, the corrosive effects of sulfate and chloride on the concrete and steel of transmission systems become significant, which puts a more stringent requirement on water quality. SWCC guidelines mandate no more than 400 ppm TDS for newer transmission systems and no more than 200 ppm for older transmission systems. Only two plants currently operating, Jeddah RO3 and Yanbu 2, were found to produce water above the SWCC guideline for newer transmission systems of 400 ppm (Jeddah RO1&2 ceased operation in 2021). These produced waters are also mixed with waters from other sources before transmission and consumption, so they are not of significant concern. A large number of plants consistently produce water with average maximum TDS values in excess of the recommended SWCC value for older distribution systems (Thermal: Shoaibah 1, Yanbu 2; RO: Khobar RO, Yanbu 3, Farasan, Umlujj, Wajh, Duba, Haql). Except for the small plants on the west coast, the produce of these plants is also mixed with water, meeting requirements.
Minimum TDS values within the transmission system falling below the recommended threshold are found in the Khobar-Ras Tanura, Riyadh-Buraidah, and Shoiabah-Makkah al Mukarrimah pipelines, with the majority of sampling points in these systems reporting minimum TDS values below the MEWA guideline. This is perhaps due to the deposition of calcium carbonate scale within transmission systems reducing TDS. The lowest individual TDS measured was 42 ppm at Safwa and Saihat, and the lowest average minimum TDS was 58 ppm at Saihat; both these locations are in the Eastern Province, served by water from the Khobar plants.
In the SWCC dams, TDS was above the SWCC guidelines for all transmission systems for Hali (Makkah-al-Mukarrimah) and Marabah (Asir) and close to the limit for newer transmission systems for Baysh (Jazan). The groundwater feeder into Riyadh was also well above the 400 ppm upper limit. Appropriate mixing of water sources appears to be effective in keeping the maximum TDS level in transmission systems within the SWCC guidelines. The only transmission system that exceeded the average maximum guideline for older systems (200 ppm) was the lines radiating from Shuqaiq. This may be attributed to the relatively large fraction of dam water transmitted in this system.
3.3. Total Hardness
Values for maximum and minimum total hardness reported in desalination plant product waters are shown in
Figure 5 and for all measurement sites in
Tables S5 and S6. MEWA prescribes only a maximum value for total hardness of 300 ppm. The most recent SWA limits give a suggested range of 60–80 ppm for total hardness, but as of 2021, most SWA plants continue to operate according to older guidelines, giving a minimum calcium hardness of 30 ppm. As there was no systematic fortification of water with magnesium in KSA in 2021, more than 90% of total hardness will be calcium hardness in all cases.
Only one plant, Shoaibah Phase 3 RO1, had an average minimum total hardness below the 30 ppm guidelines throughout 2020–2022. In 2020, Shoaibah Phase 1 also had an average minimum total hardness below the guidelines. This is unlikely to be an issue for the transmission system as the product water from these units is mixed with other product waters before distribution. Of more possible concern are low average values reported in 2022 for some of the smaller plants on the Red Sea, Farasan, and Aziziah, which were slightly below the acceptable threshold. If this trend continues, there may be negative consequences for local distribution systems. Within the wider transmission system, minimum values below 30 ppm were reported for only two sites on the Shoiabah-Makkah al Mukarrimah pipeline during one month in 2021, with pumping stations along that line giving average minimum total hardness values between 33 and 43 ppm for the year. No sites on other transmission lines reported average minimum total hardness values below 35 ppm over the period of the study.
No desalination plants produced water with maximum hardness above the level of the MEWA limit, but a number of sites consistently produced water with maximum total hardness above the SWCC guidelines, one thermal plant (Shoaibah 1), and the RO plants at Khobar, Shoiabah RO4, Jeddah 3, and the (since decommissioned). Unsurprisingly, the water from the three SWCC dams and the groundwater feeder into Riyadh also exceeded the SWCC guidelines for total hardness, with hardnesses in the range of 197–281 ppm. The high total hardness levels in Baysh and Marabah dams are reflected in the only sites in the transmission system that reported average maximum total hardness values exceeding SWCC guidelines, at the tank outlets in Abha outlet 1 (2020 average 100 ppm and 2021 average 130 ppm) and Sabya (2020 average 113 ppm and 2021 average 121 ppm).
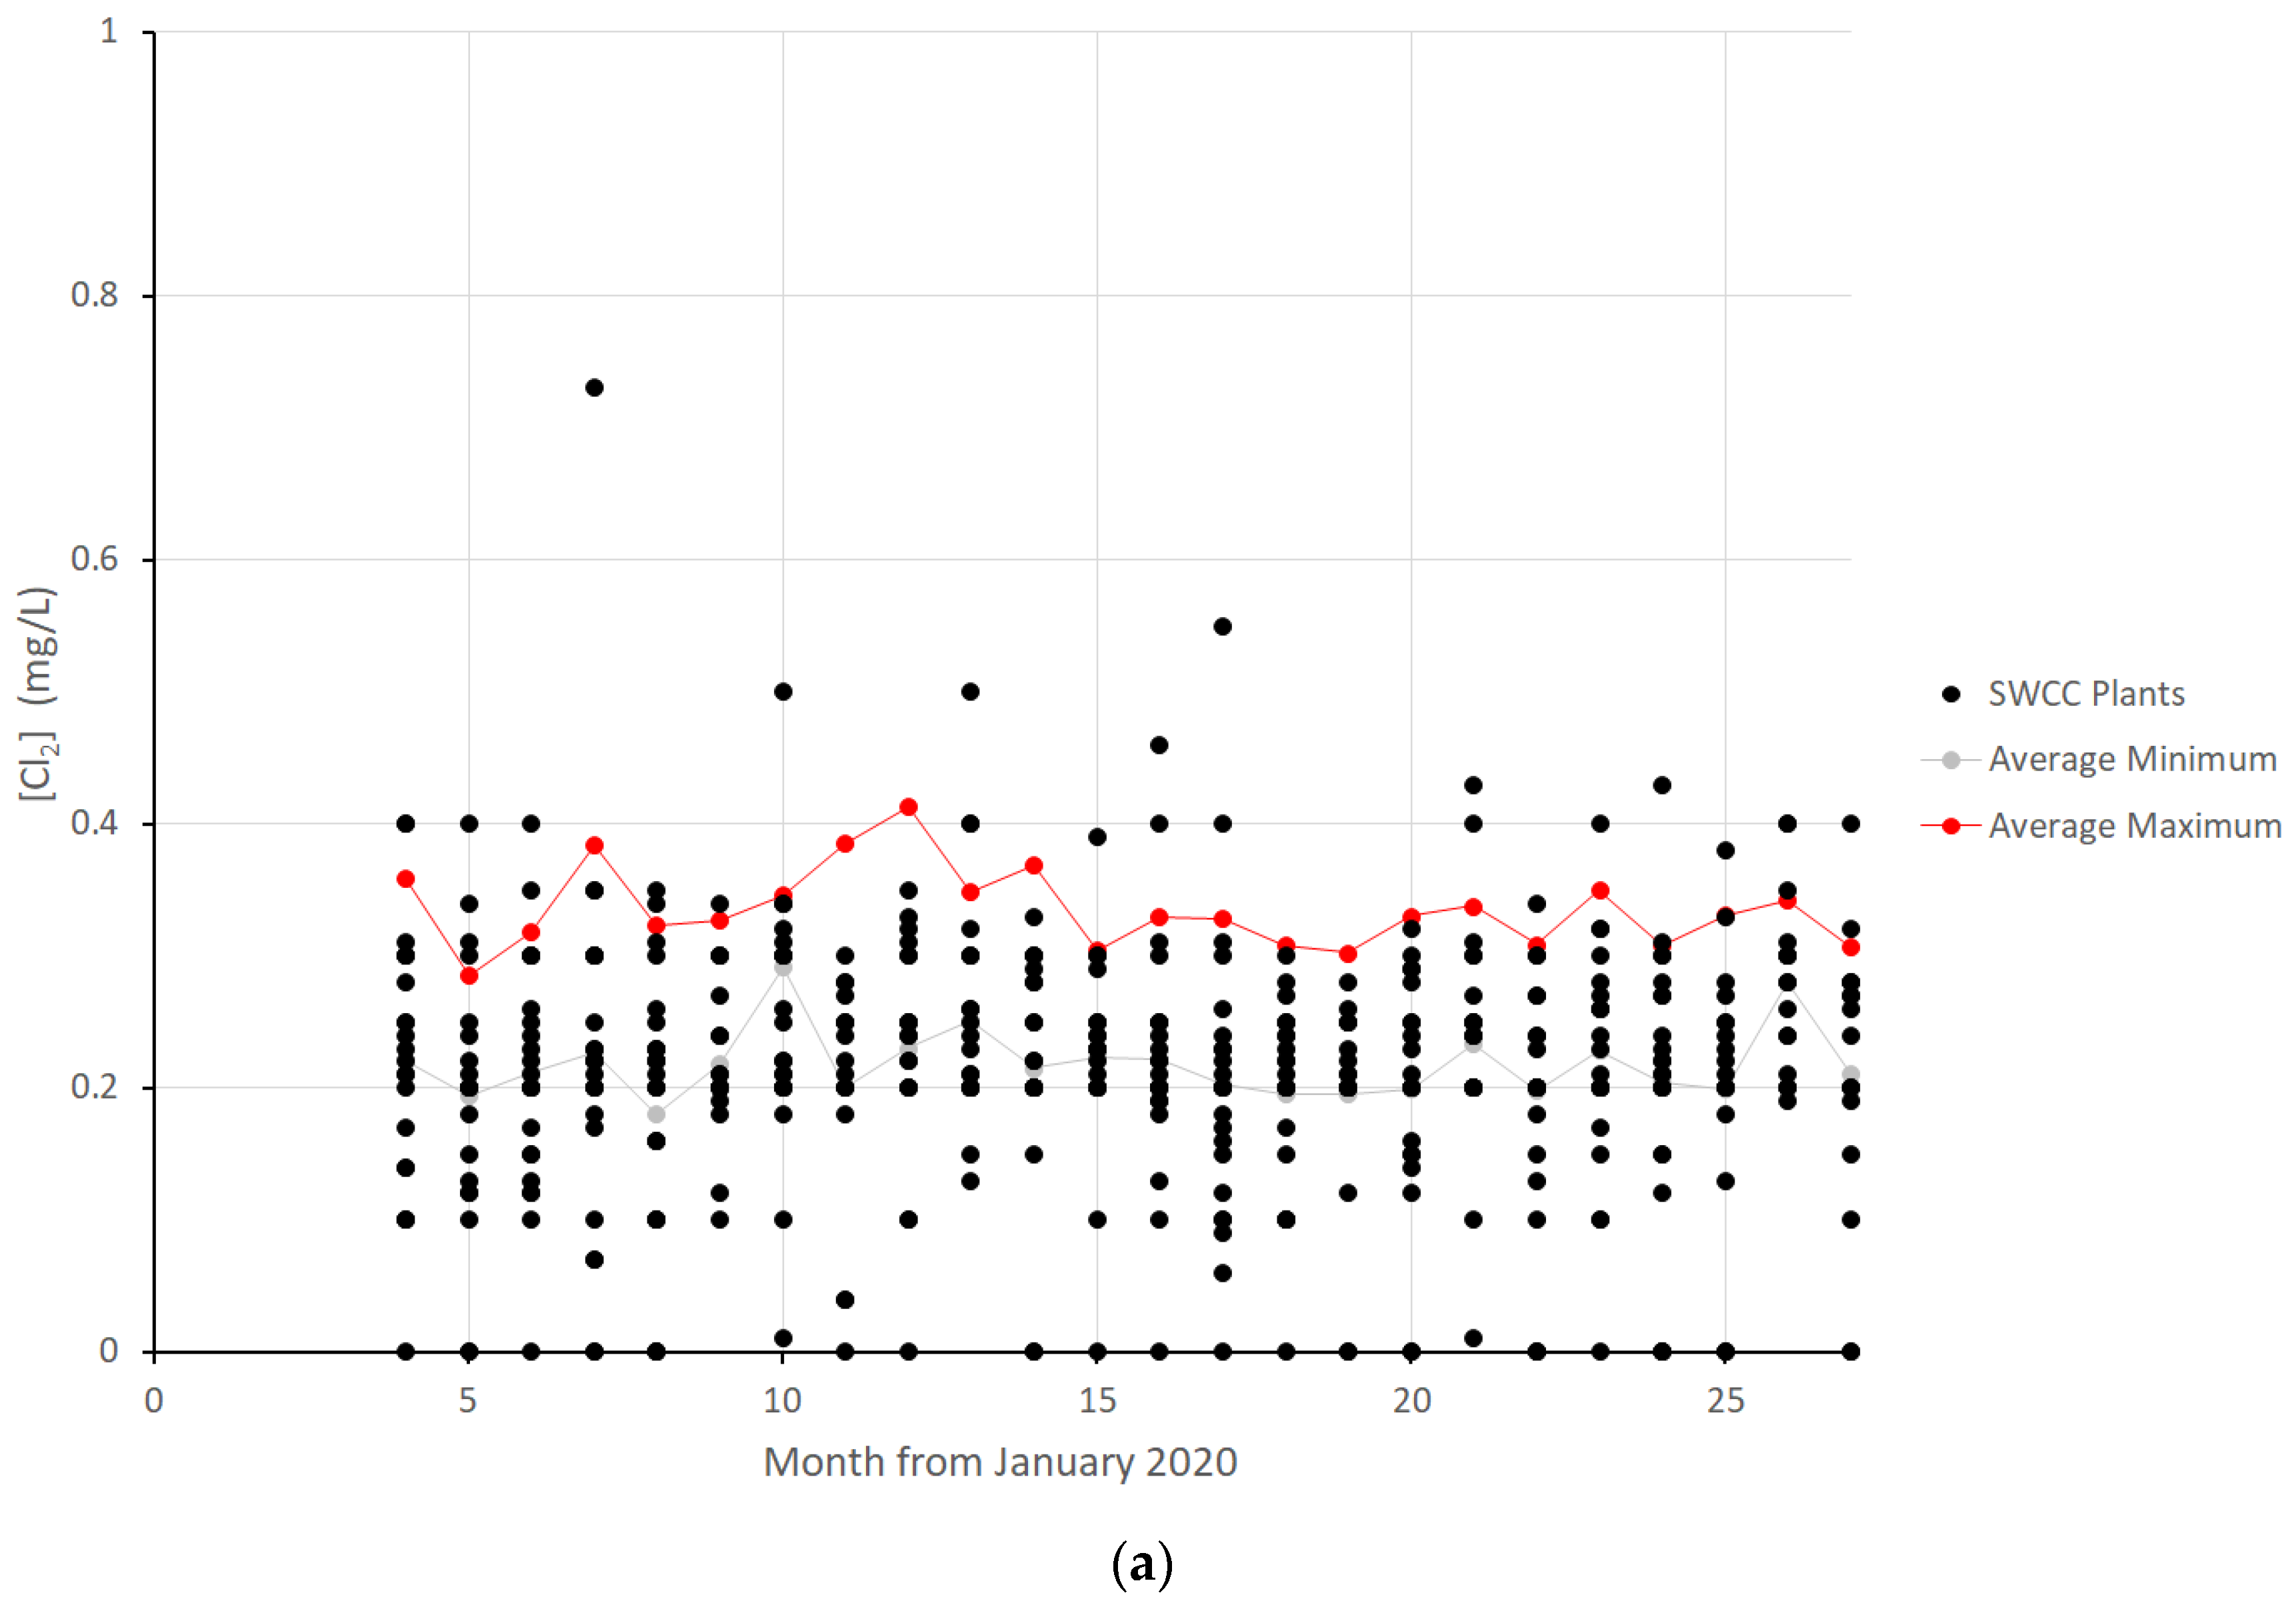
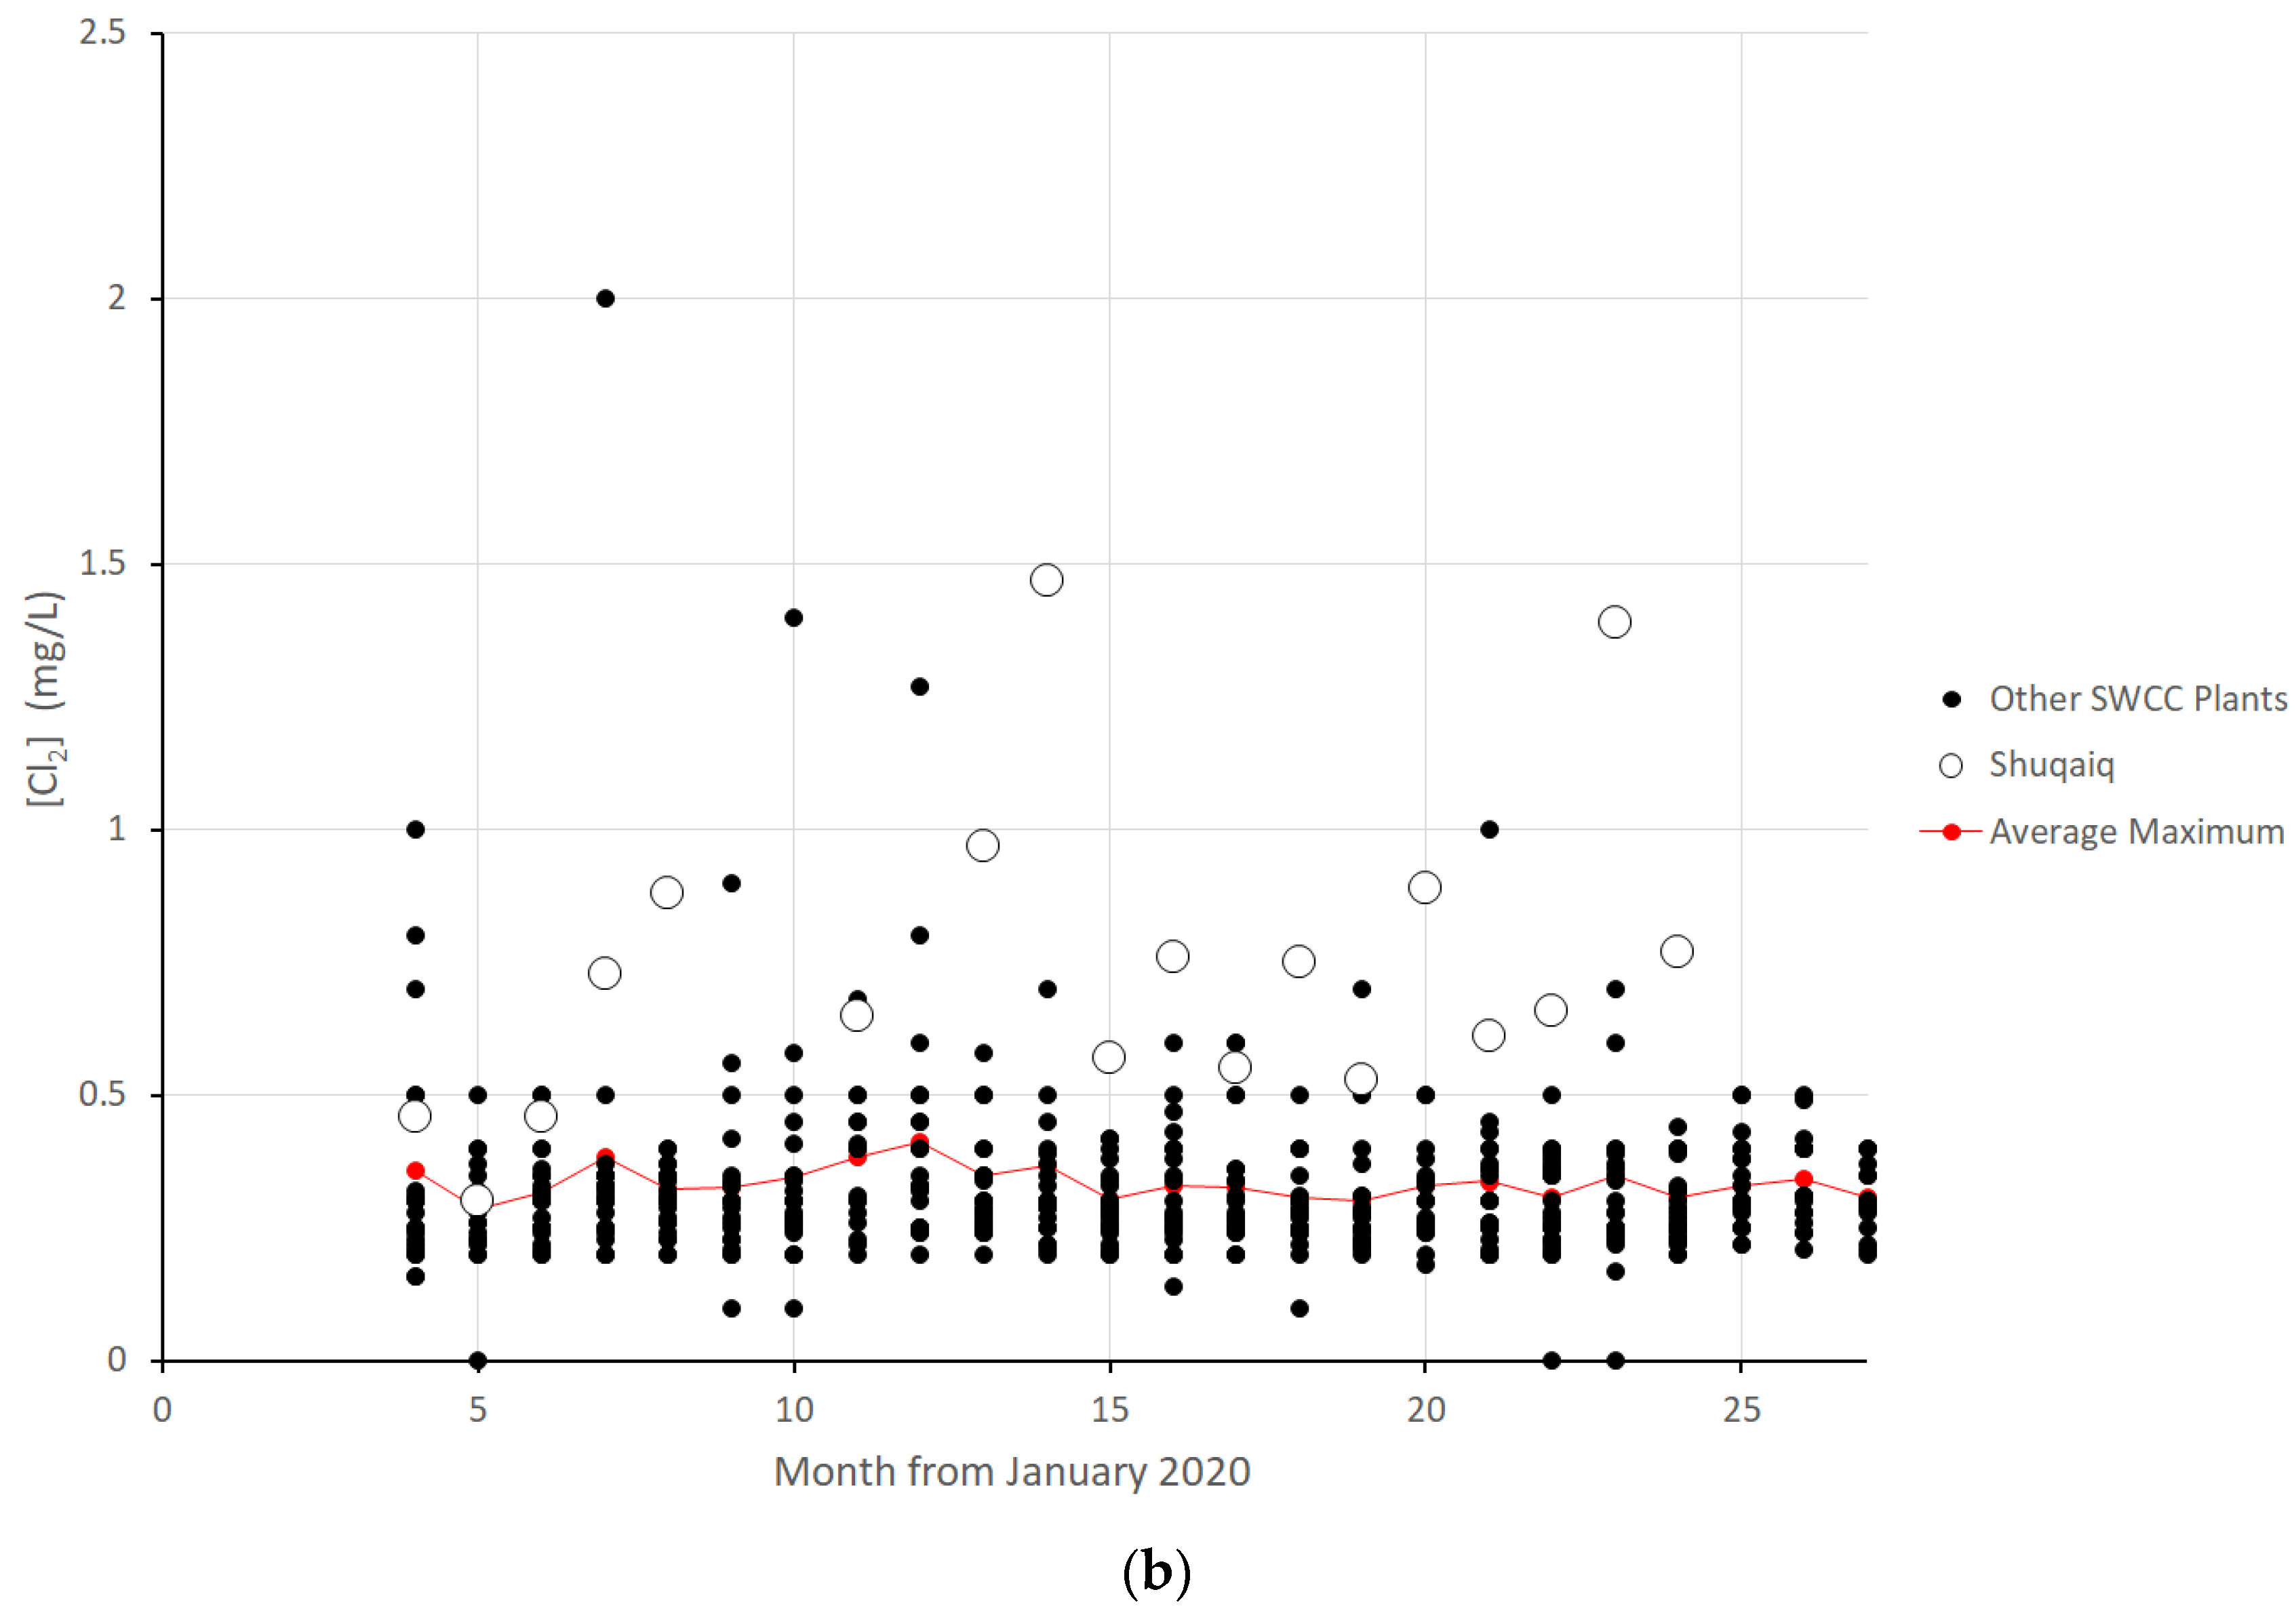
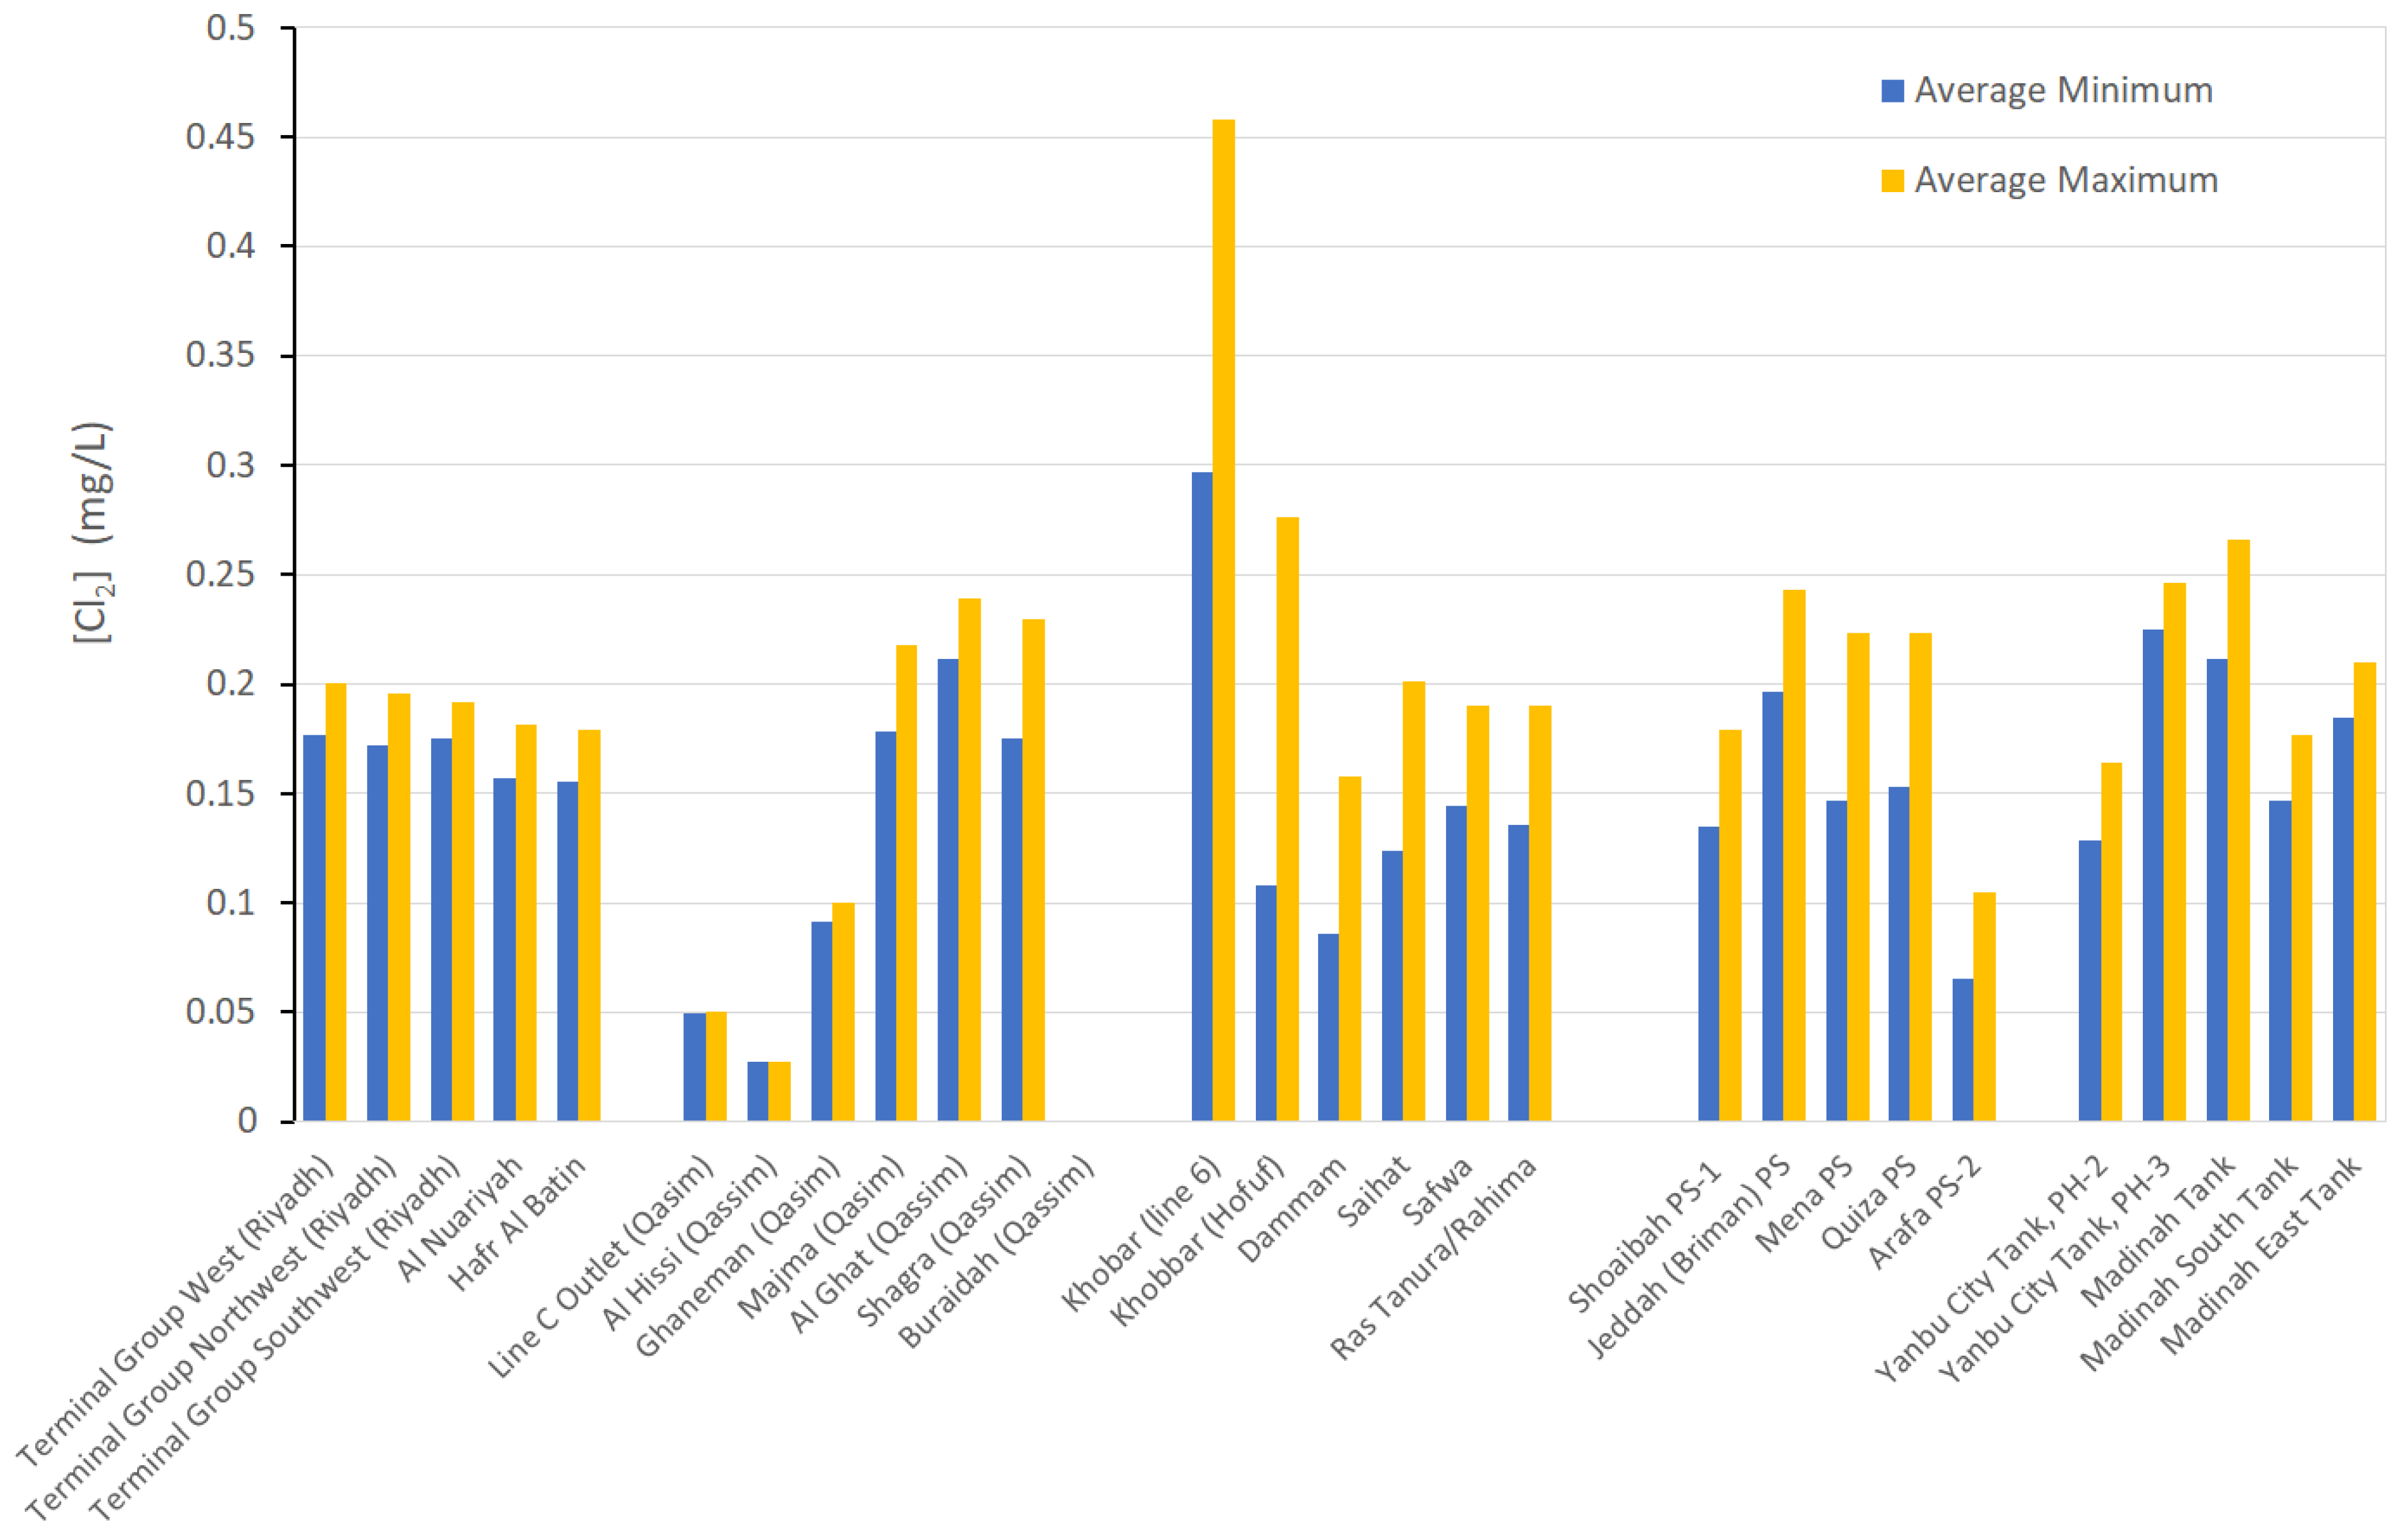
3.4. Residual Chlorine
Values for minimum and maximum residual chlorine reported across the SWCC system are given in
Tables S7 and S8; results from desalination plants are shown in
Figure 6, and for selected sites, along the transmission lines in
Figure 7. Residual chlorine is an important parameter for ensuring control of potentially harmful microorganisms in the water supply. However, excessive residual chlorine can encourage the formation of disinfection by-products and negatively impact water palatability. Accordingly, both MEWA and SWA guidelines stipulate a residual chlorine value between 0.2 and 0.5 ppm.
Excursions below the minimal residual chlorine level were reported from numerous desalination plants, but the average minimum value was maintained at 0.20 ppm or above at almost all plants, with only Khobar 2, Shuqaiq, and the plants at Shoaibah giving average minimum residual chlorine values between 0.15 and 0.19 ppm.
Excursions above the maximum residual chlorine level were rarer, and only one plant, Shuqaiq, had an average maximum residual chlorine value significantly above the guidelines (0.83 ppm). Elevated average levels were also reported from Marabah dam (0.95 ppm). Despite these high levels going into the distribution system in Jazan/Asir, the residual chlorine values reported were low at tank outlets in this system, with average maximum residual chlorine values of only 0.13 ppm at Abha Tank Outlet Ph1 and 0.04 ppm at Sabya Tank Outlet. Residual chlorine levels were also low at sampling points in the other longer transmission systems (
Figure 6). This is not unexpected, as it is difficult to maintain residual chlorine levels as water is transported over longer distances.
3.5. Total Trihalomethanes
Total permissible trihalomethane concentration is defined in terms of the individual limits for chloroform (300 ppb), bromodichloromethane (60 ppb), chlorodibromomethane (100 ppb), and bromoform (100 ppb), by the expression TTHM = [CHCl
3]/300 ppb + [CH
2ClBr]/60 ppb+ [CHClBr
2]/100 ppb + [CHBr
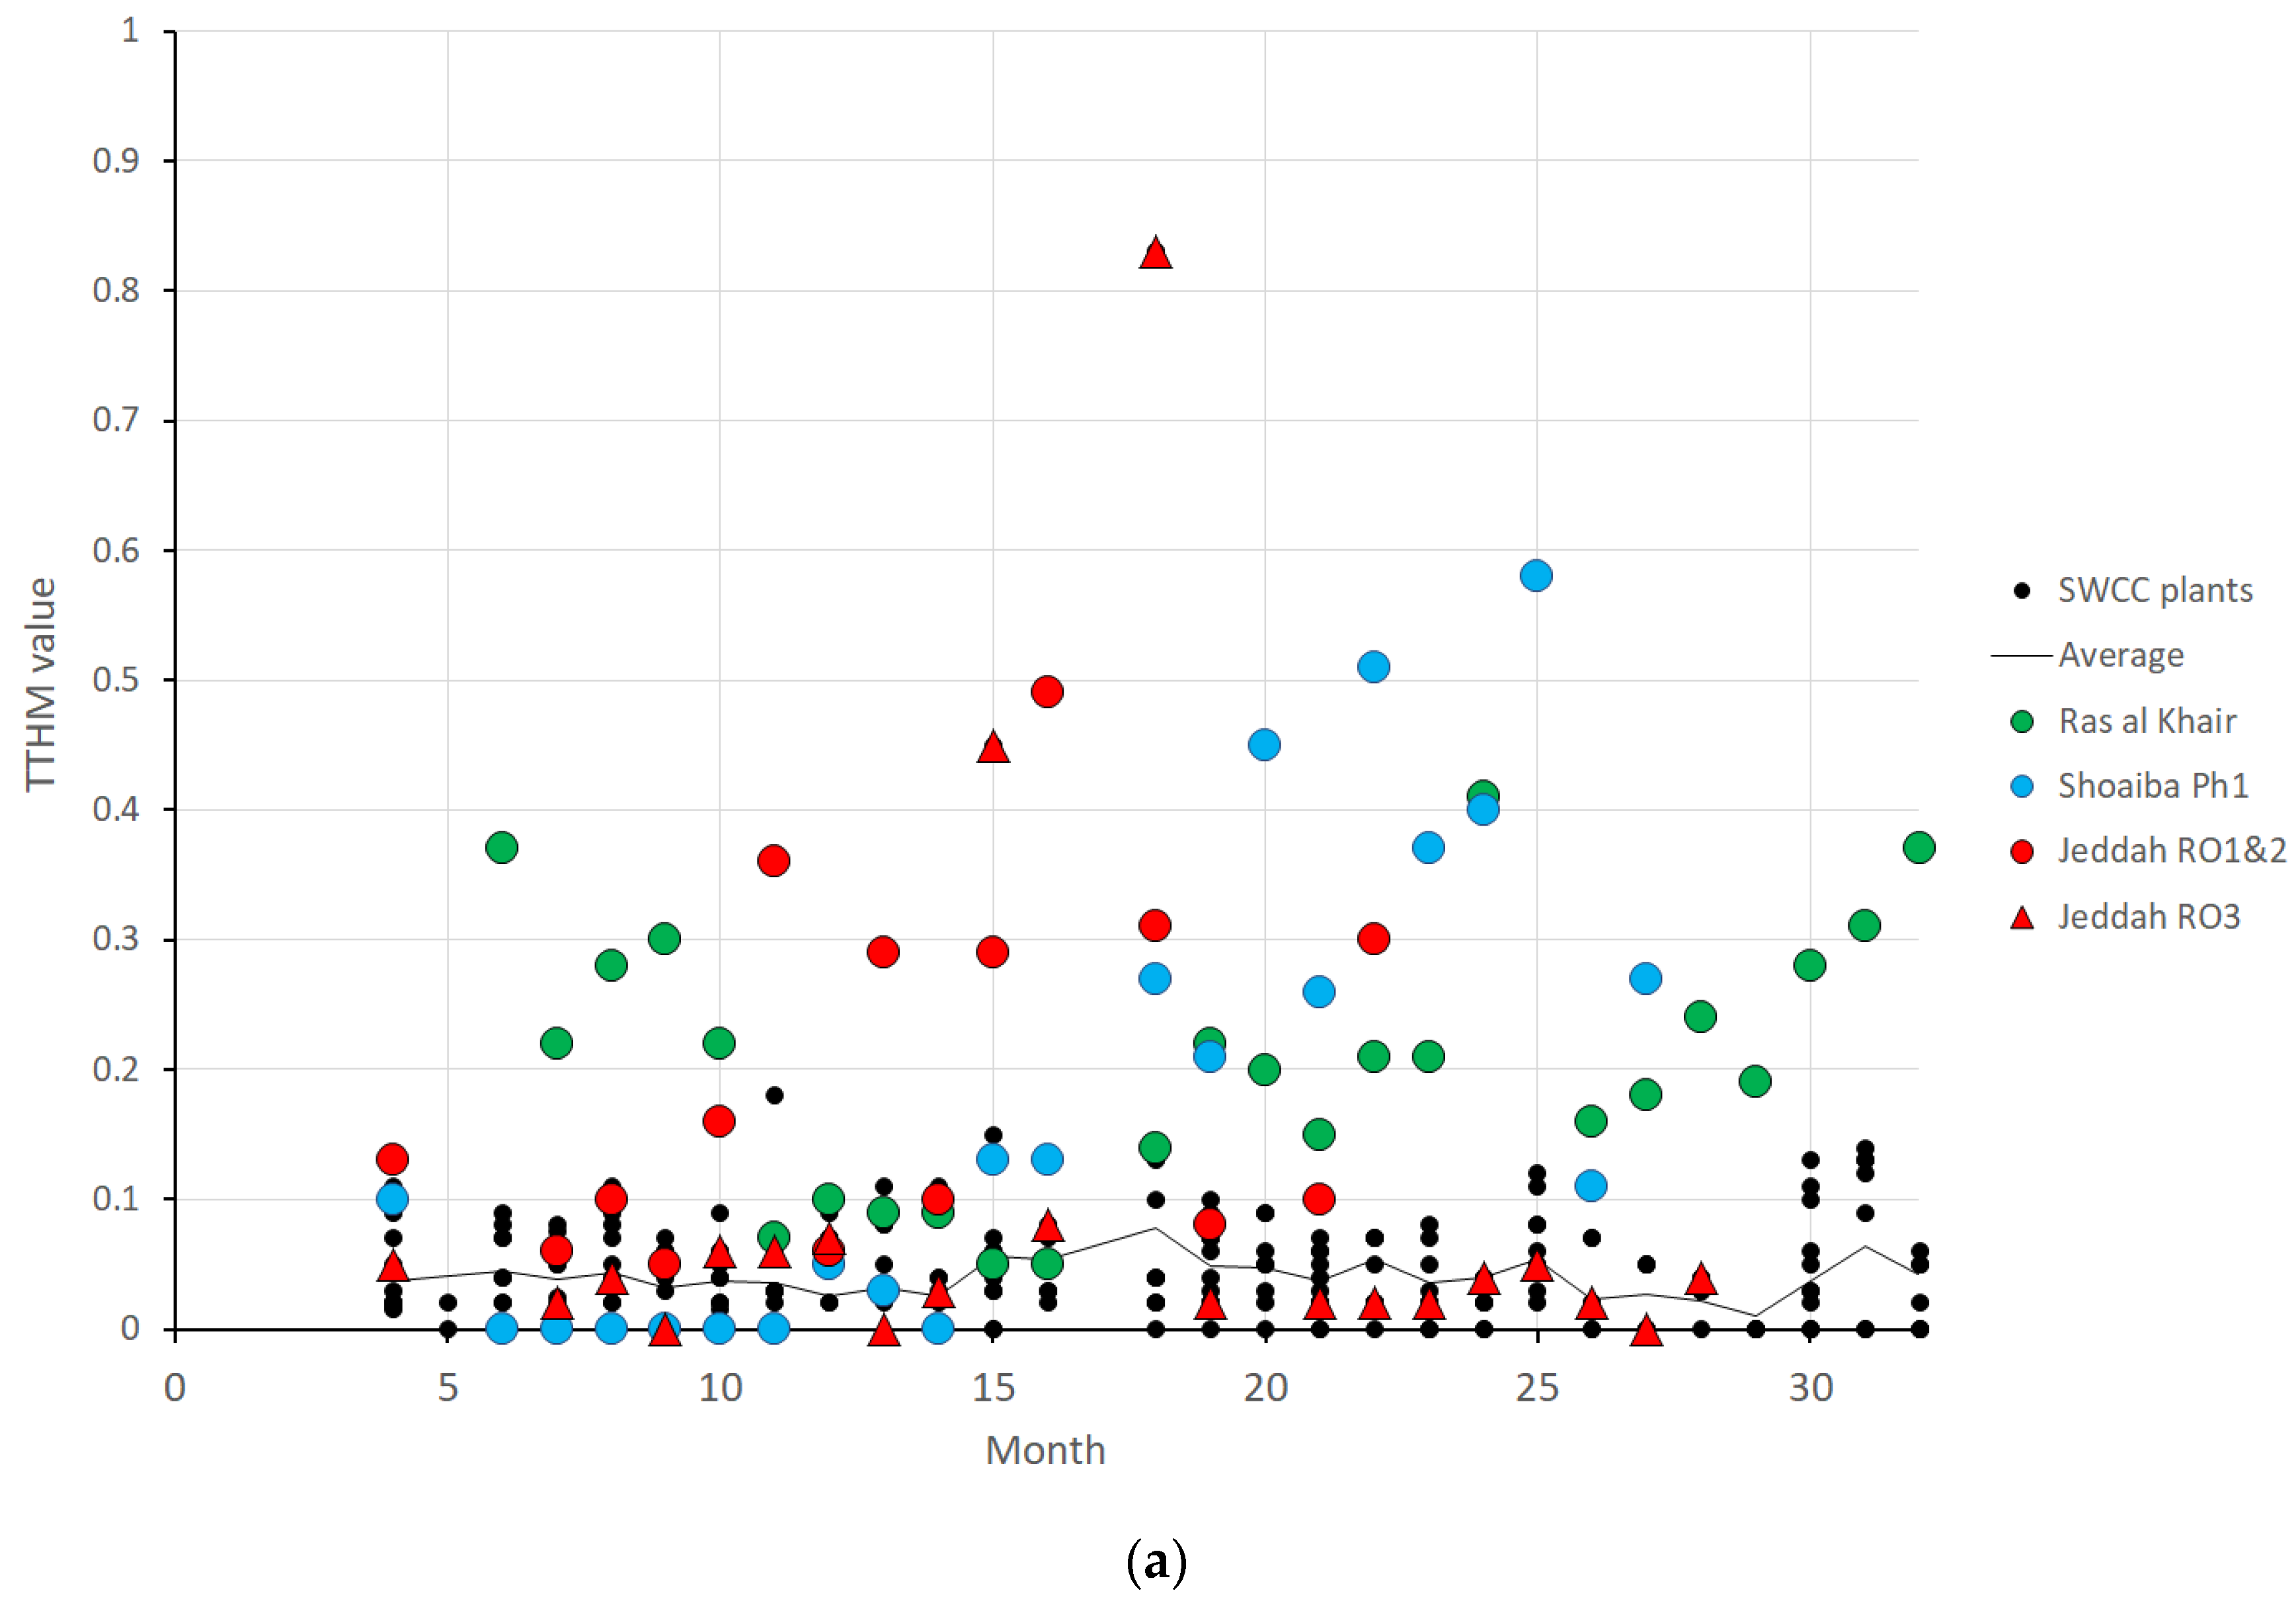
3]/100 ppb, with a TTHM value of <1 required by SASO standards. Maximum values recorded from across the SWCC systems are collected in
Table S9 and shown for the desalination plants and dams in
Figure 8.
From
Figure 8, it can be seen that all SWCC desalination plants met TTHM limits at all times. Plants frequently reporting relatively high TTHM values were Ras al Khair, Shoaibah 1, and the RO plants at Jeddah. However, no levels measured are of any concern. Levels above the MEWA guidelines were, however, reported at certain times of the year for all water produced from the three dams. As these surface waters will be expected to carry a much larger load of organic material, this is not entirely unexpected. The high residual chlorine values reported from Shuqaiq are not reflected in elevated TTHM values; instead, Shuqaiq showed the lowest aggregate TTHM concentration of any major SWCC desalination plant (
Table 1).
While all sampling points in the transmission network gave maximum TTHM values below the level of concern, significantly elevated average maximum TTHM levels were reported from tank outlets at Abha (0.38) and Sabya (0.42), presumably affected by the high levels in the dam water. Relatively high levels were also reported from sites served only by water from Ras al Khair, Al Nuariyah (0.17), and Hafr al Batin (0.21), consistent with the relatively high TTHM value reported at Ras al Khair.
A total of 1528 samples were analysed for THMs, which is comparable in size to the European sampling sizes analysed by Evlampidou et al. [
5] Thus, the mean THM concentration (total ppb of THMs) in the SWCC network as a whole and in the produced water from individual plants may be compared to the drinking water of the European Union (
Table 3). Trihalomethanes are one of the most significant classes of disinfection by-products but are usually low in desalinated seawater because of the low organic content of the source water [
6].
3.6. Bromate
The bromate limit specified by MEWA regulations and SWA guidelines is 10 ppb. Maximum values of bromate recorded throughout the SWCC system are given in
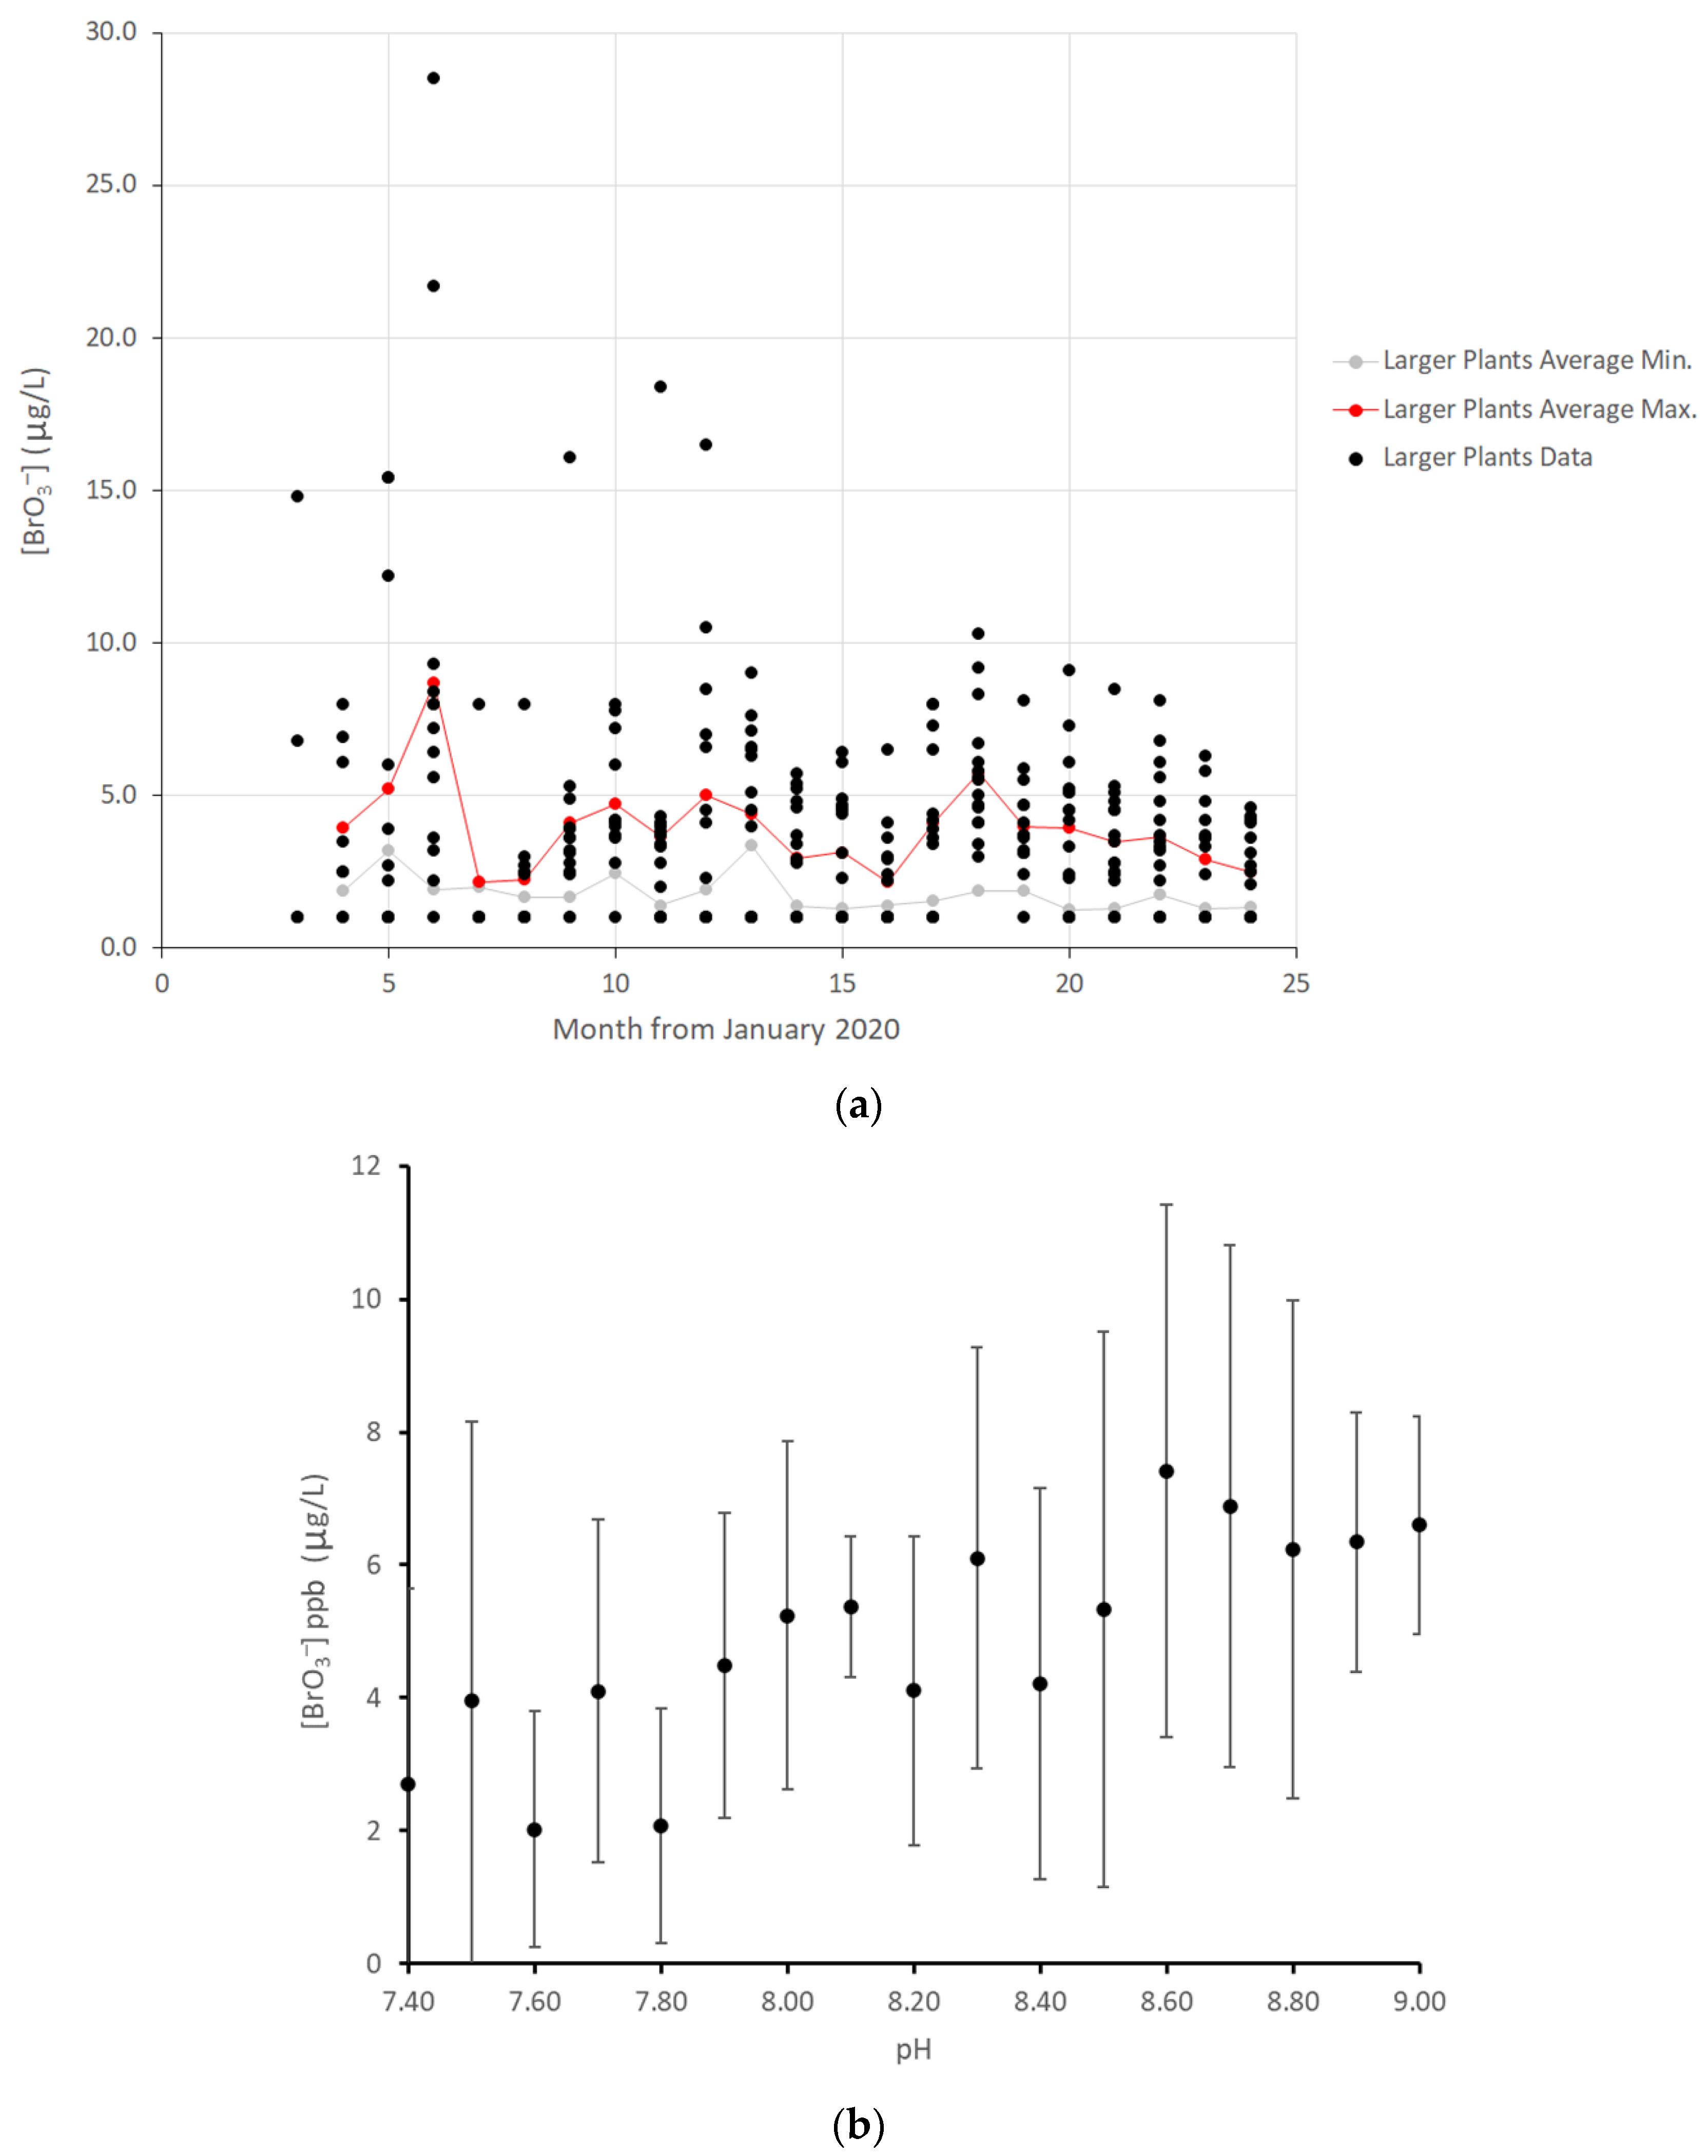
Table S10. In water produced in SWCC desalination plants, only one instance of the target being exceeded was recorded in 2021, while the target was exceeded several times in 2020 (
Figure 9). This is an illustration of how measurement allows control. Values exceeding 10 ppb were reported at Jubail, Khobar RO, Shoaibah Phase 2, Shoiabah Phase 3 RO1&2, and Yanbu Phase 2&3, with Shoiabah Phase 2 RO2 reporting the maximum value found in the course of the study, 28.5 ppb in June 2020.
As the minimum bromate levels are dominated by points recorded as below the limit of detection (2 ppb), approximated as 1 ppb for graphing, the seasonal temperature dependence of bromate levels is likely to be more prominent than noted in
Figure 9a. The other main significant factor that should be correlated with bromate concentration in produced water is pH, but no clear correlation between plant-produced water pH and bromate concentration was apparent in the data.
The average bromate concentration in the water produced by the large SWCC desalination plants, which account for the majority of production, is shown in
Table 4, together with average values reported for water supplies in Canada [
8] and the United States of America [
9].
Excursions above 10 ppm bromate were reported at a number of locations across the SWCC transmission system over the period of the study. Values in excess of the SASO limit were reported in the pipeline from Riyadh to Buraidah (14 instances), from Yanbu to Madinah-al-Munawarah (6 instances), from Khobar to Ras Tanura (3 instances), and Shuqaiq to Abha (1 instance). Excessive bromate levels were also reported in a storage tank at Yanbu City for several months in early 2021, where the single highest value of 29.4 ppb was reported, which was associated with a period of abnormally high pH (8.5–8.8); this tank was most likely responsible for the elevated bromate levels in the line running from Yanbu to Madinah-al-Munawarah in early 2021. Values above 10 ppb bromate were also reported from tanks in Yanbu and Medinah in September–October 2020, which was not a time associated with elevated pH. It seems likely that the elevated bromate levels in the Riyadh-Buraidah line can be attributed at least partly to the higher pH values in this line, which in turn, depends on the relatively high pH water produced at the Jubail plant. A clear correlation between bromate and pH was observed in water samples obtained from the transmission system (
Figure 9b). Overall, it also seems that bromate excursions are related to longer transport times and higher ambient temperatures. A comprehensive report on the factors contributing to elevated bromate concentrations is under preparation.
Due to bromate being a potentially carcinogenic disinfection by-product, SWA is actively pursuing two approaches to control bromate formation in produced and transmitted water. The first approach is the replacement of hypochlorite in post-treatment by chorine dioxide [
10]. The second is to trap intermediates in bromate formation by the addition of ammonia (100–200 ppb) to the produced water [
11]. These recent operational advances, which are now being implemented across the SWCC system, suggest that high bromate measurements will become rarer in the future. It should also be noted that the performance of the SWCC system compares extremely favourably to recent reports of tap water quality in Kuwait, which found bromate levels of between 10.7 and 50.3 ppb at all sites with an overall concentration of 19.6 ppb of bromate in drinking water [
12].
3.7. Heavy Metals (As, Cd, Cr, Hg, Pb, Se, Fe, Cu, Mn, Ni)
The data collected on heavy metal content in SWCC waters are collected in
Tables S11–S20. All samples collected had heavy metal concentrations well below the mandated limits for drinking water, which pose no concerns for water quality. These results are compatible with the results that were obtained over more than 20 years (1998–2018) of monitoring heavy metals in desalinated water [
13].
The SASO limit for arsenic in drinking water is 10 ppb, and all samples measured gave readings well below this, with the exception of three storage tanks on the Shoiabah-Makkah al Mukarramah line (Sedera, Qiya, and TTRK) where values of up to 19.6 ppb were reported in February and December 2022. The cause of this contamination is undetermined. Besides these, only eight sites reported at any time waters with As levels above the limit of detection of 1 ppb. These were the three dams (Baysh, Hali, and Marabah), which reported values up to 3.8 ppb between November 2021 and June 2022: Jeddah RO3, which reported values of 1.2 ppb in December 2021 and 1.4 ppb in February 2021, and Shoaibah 1, which reported a value of 1.6 ppb in January 2022. The dam waters are all high TDS waters with TDS between 342 and 612 ppm. As typical concentrations of arsenic in seawater are <3 ppb and the pK
a of arsenic acid is well above the pH of seawater, arsenic will always be present as negatively charged species [
14]; the values obtained for Jeddah RO3 and Shoiabah 1 suggest potentially elevated levels of arsenic in the seawater feeding the Jeddah desalination plants. The clustering of these elevated levels in time and space suggests they may potentially be linked to a period of increased rain activity, with run-off from soils with elevated arsenic content affecting both dams and near-shore waters.
The SASO limit for cadmium in drinking water is 3 ppb. All samples measured gave Cd below the limit of detection of 1 ppb.
The SASO limit for chromium in drinking water is 50 ppb. The vast majority of samples measured gave Cr below the limit of detection of 1 ppb. Values between 2 and 9.6 ppb were measured on numerous occasions in 2021 and 2022 for the City Feeder, which provides groundwater to Riyadh. This is not surprising, as Cr levels of up to 30 ppb have been measured historically in groundwaters in the vicinity of Riyadh [
15,
16]. Elevated levels were reported on occasions at numerous sites in 2022, which may reflect an increased sensitivity of measurement. All were close to the level of detection (<3 ppb), except for Khobar AK2 (where values up to 6 ppb were found from September 2022), Shoiabah RO2 (where a single value of 6 ppb was recorded in October 2022), and at Al Wajh and Duba plants, where values in September/October 2022 were recorded in the range of 8–10 ppb. As Al Wajh and Duba are close together and near busy shipping lanes, this may record a non-artefactual contamination event.
The SASO limit for mercury in drinking water is 6 ppb. All samples measured gave Hg below the detection limits of 0.15 ppb (with AAS, used from January to June 2021) or 1 ppb (with ICP-OES, used from July to December 2021).
The SASO limit for lead in drinking water is 10 ppb. Only one sample measured gave a Pb concentration above the detection limit of 1 ppb. This sample measured at Farasan had 2 ppb on a date where elevated Cr levels were also reported, so it may correspond to a non-artefactual contamination event in the vicinity of the intake.
The SASO limit for selenium in drinking water is 10 ppb. All samples measured gave Se below the detection limits of 1 ppb (with AAS, used up until August 2021) or 5 ppb (with ICP-OES, used from September 2021 onward), with the exception of a cluster of results reported from the City Feeder 3&4 (groundwater), where 1.8–2.2 ppb was reported in January–February 2022, and a single measurement at Marabah (surface water) of 1.4 ppb in February 2022.
The SASO limit for iron in drinking water is 300 ppb. Values above this were reported only on one occasion at Qunfudah (550 ppb) and on a number of occasions for the City Feeder 3&4—which, as groundwater, had consistently higher iron values—in June–November 2022. Previous reports of high iron in tap water in Jeddah are most likely attributable to corrosion within the distribution system [
17].
Copper values were also always well below the limit of 2 ppm, with a maximum value of 340 ppb reported anywhere in the system. The maximum manganese value (8 ppb), well below the SASO limit of 400 ppb, was reported from surface water (Marabah dam). Insignificant levels of nickel were also reported within the SWCC system, well below the SASO limit of 70 ppb with a maximum value of 59 ppb reported on one occasion at Shoaibah Phase 2 with almost all values < 5 ppb.
It should be noted that the levels of heavy metals found in this study for the water supplied to Riyadh are consistently below the levels reported at households in Riyadh by Al-Omran et al. [
18] (2015) and El-Rehaili and Misbahuddin [
19] (1992), probably indicating a progressive improvement in water quality over time and/or a major contribution of corrosion within the municipal delivery system to the heavy metal load. The text continues here.
3.8. Boron
An upper limit of 2.4 ppm boron is mandated for potable water in KSA. Boron is an element of concern for desalination, as boron is present at a concentration of upwards of 5 ppm in Red Sea and Arabian Gulf waters and largely exists as the uncharged H
3BO
3 species, which is unaffected by RO membranes. Thus, if the pH of the permeate is not adjusted to near the upper range of the quality limit (~8.5) after the initial SWRO process and subjected to an additional brackish water reverse osmosis (BWRO) process, it is probable that boron levels above the limit will be delivered by an RO system. Data for SWCC plants and transmission systems are collected in
Table S21.
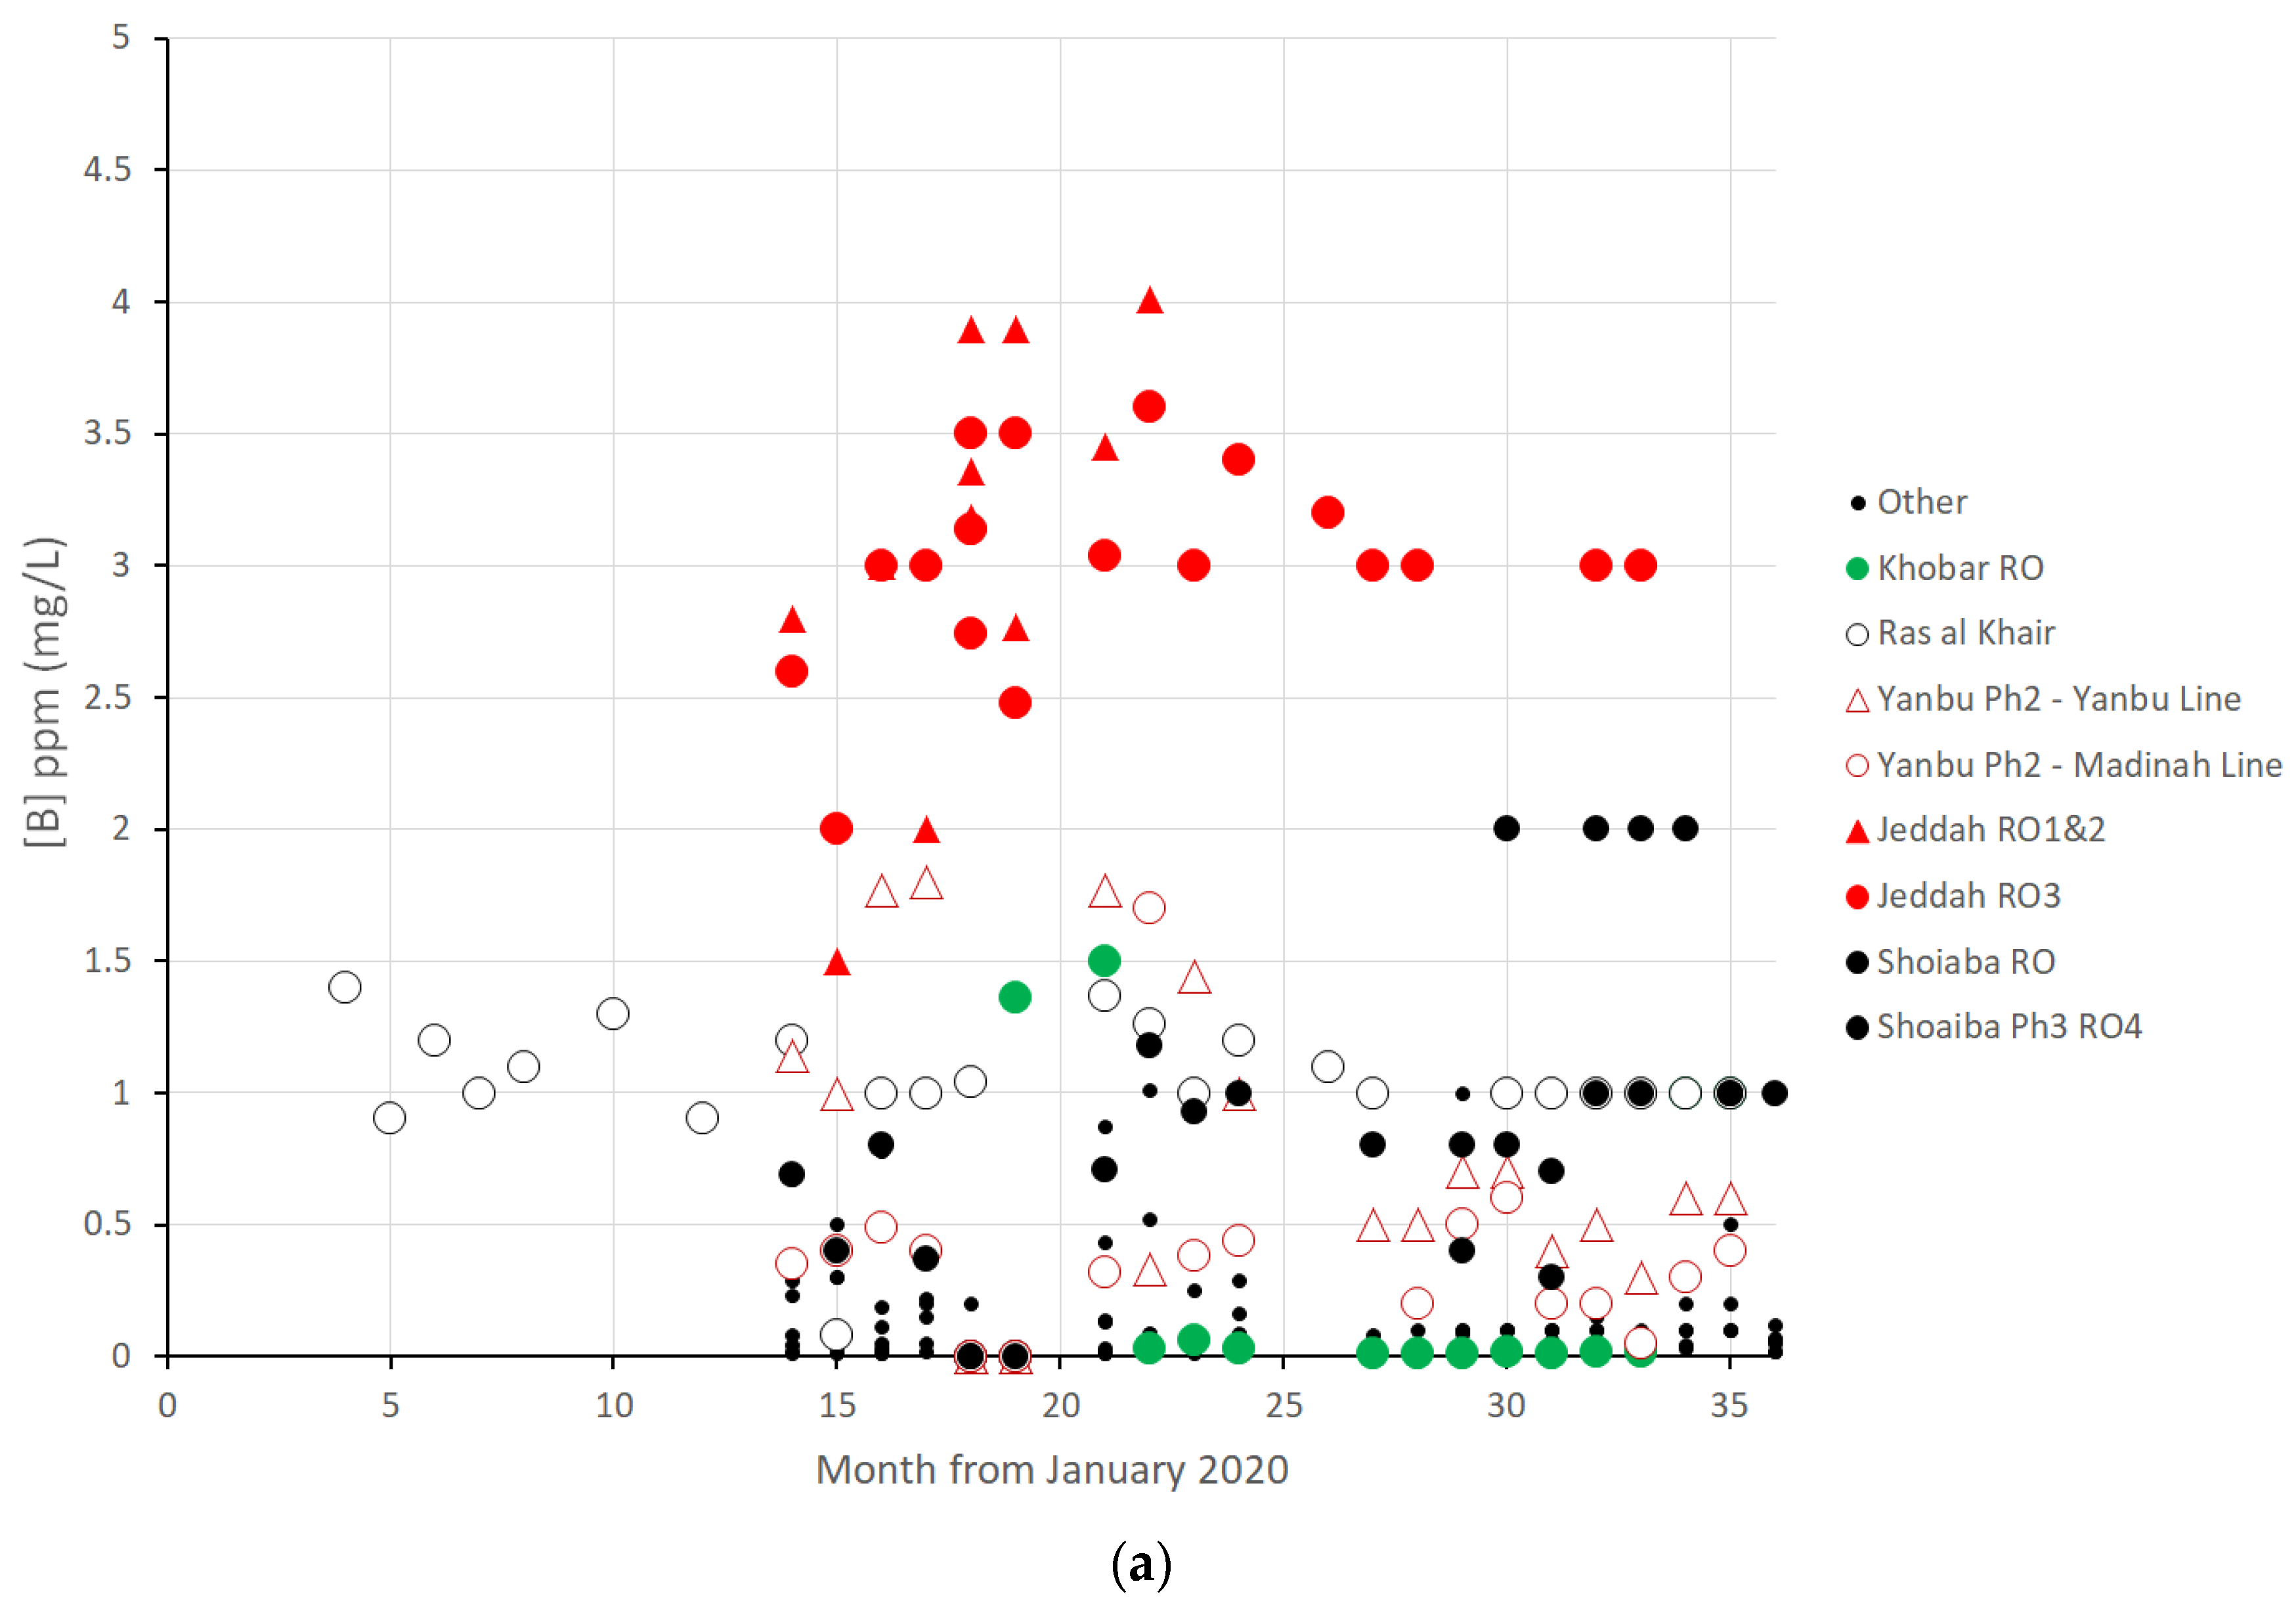
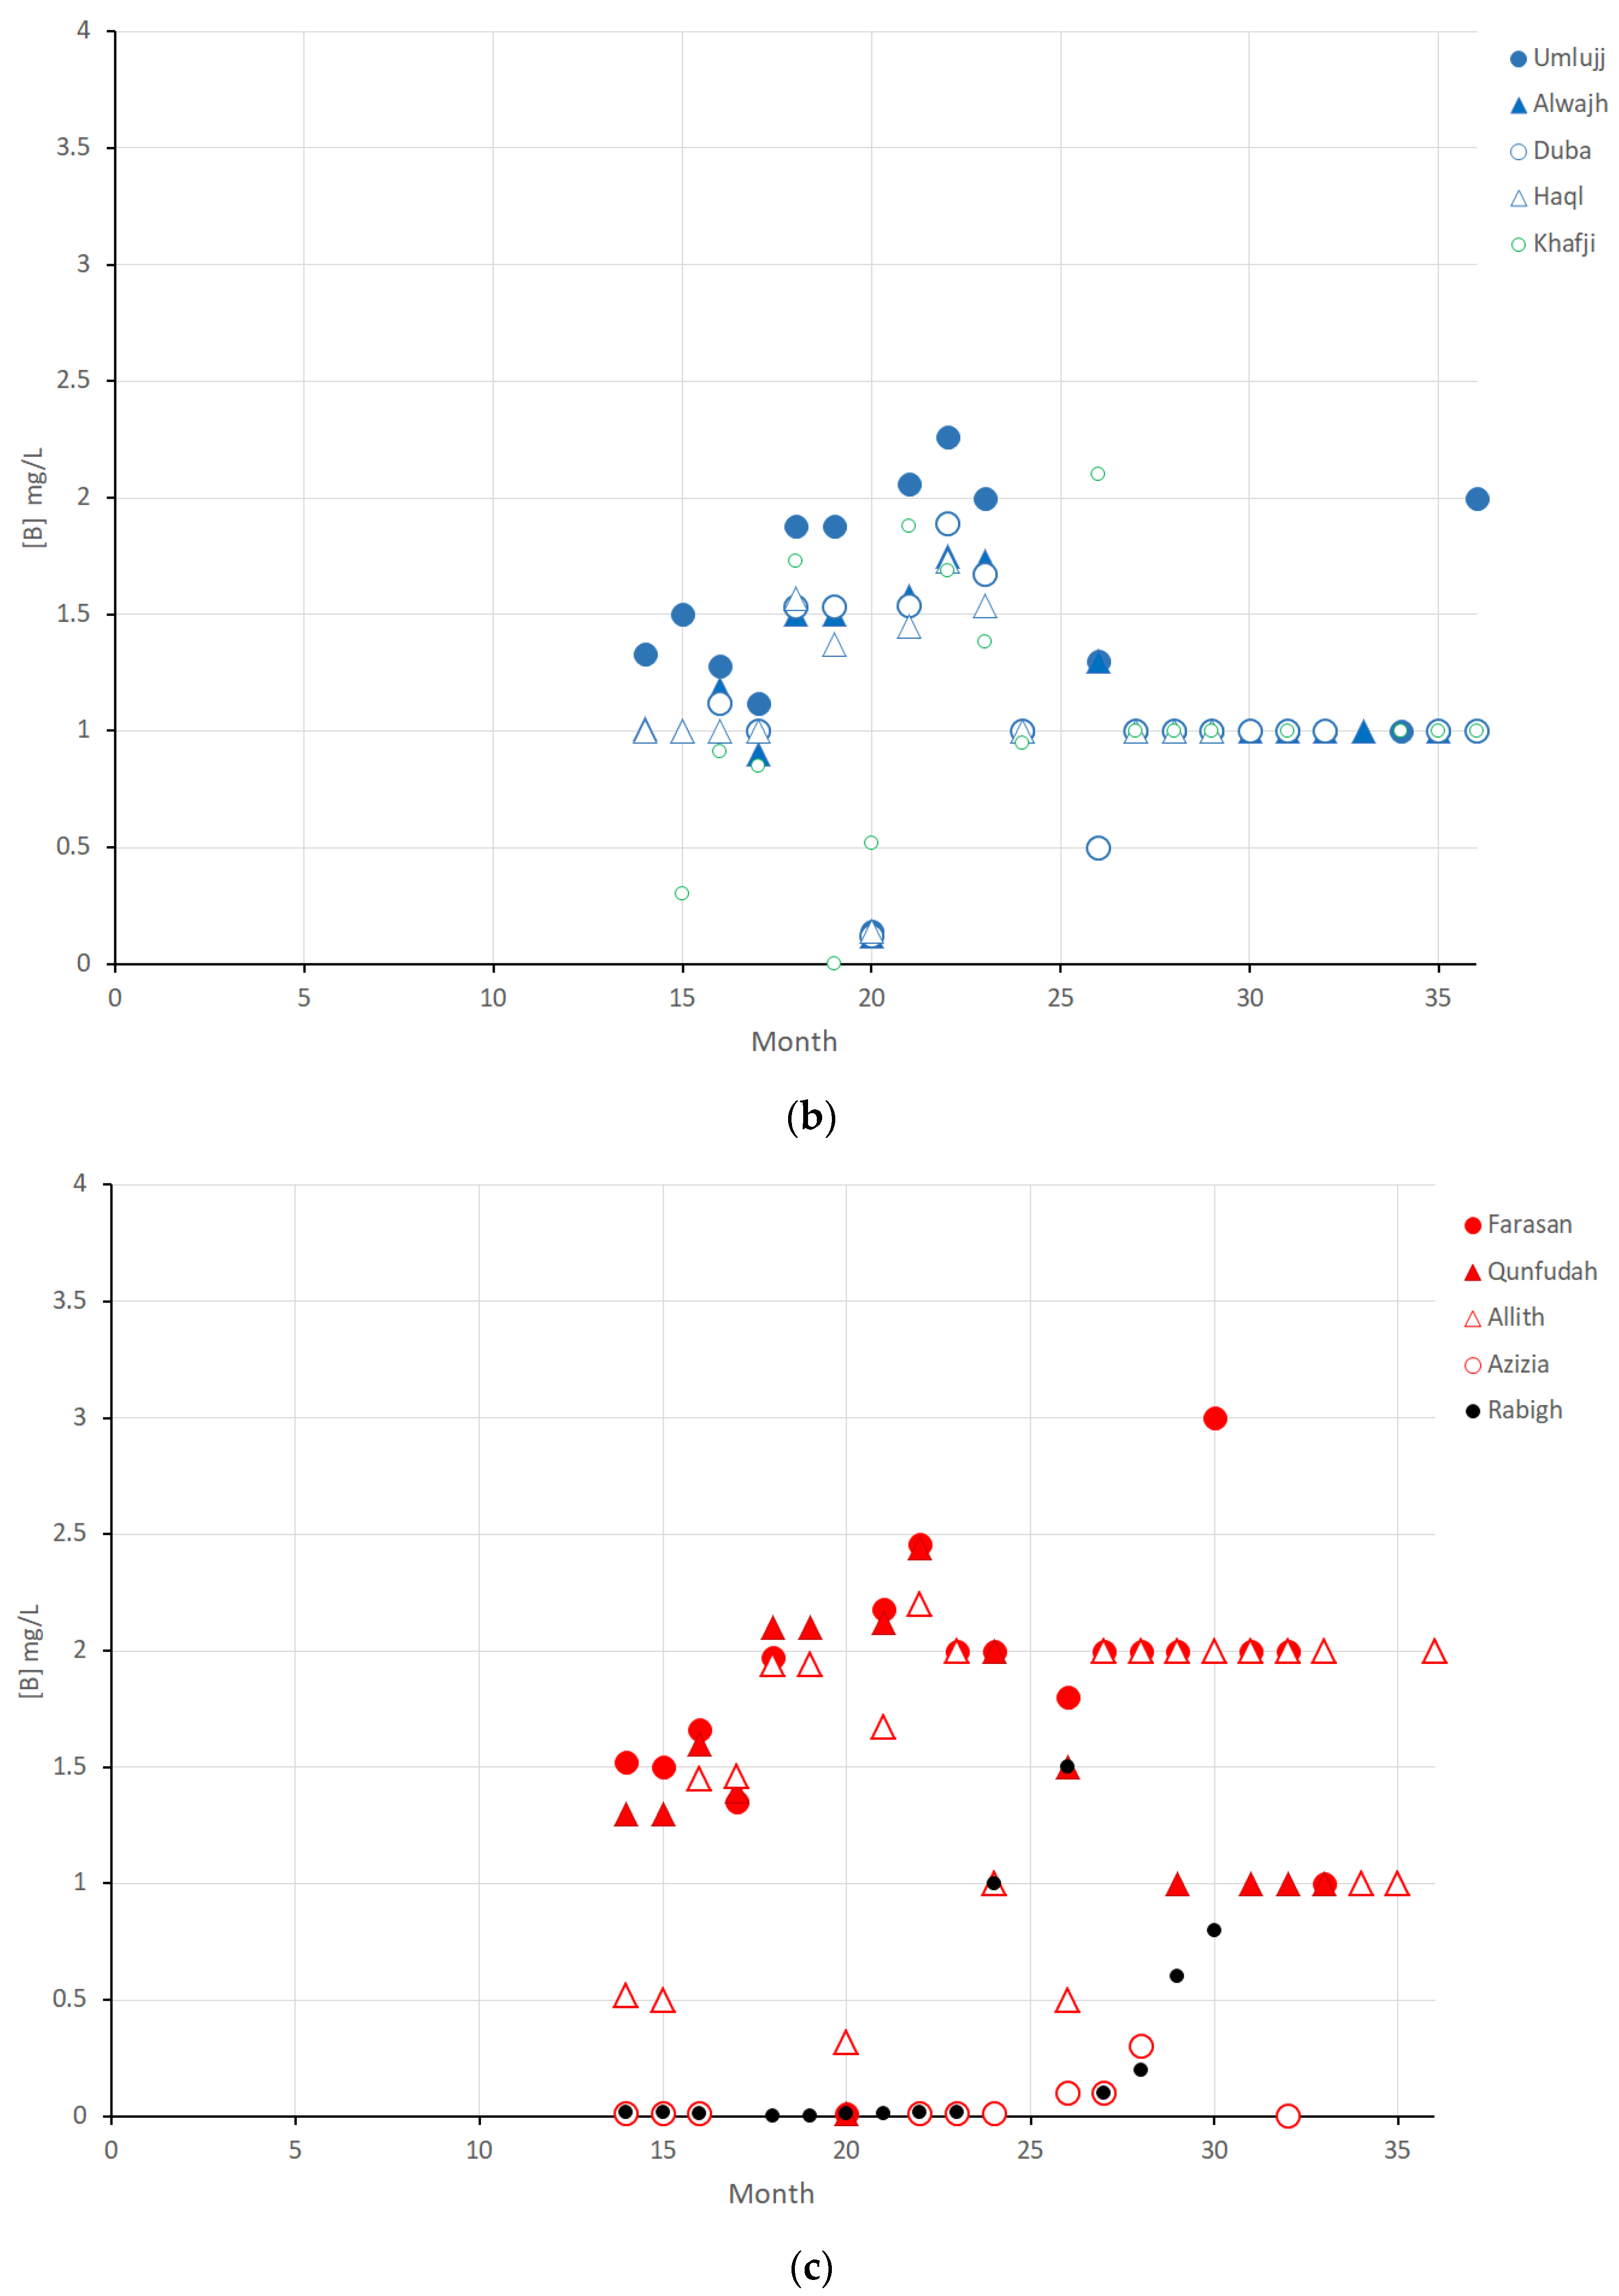
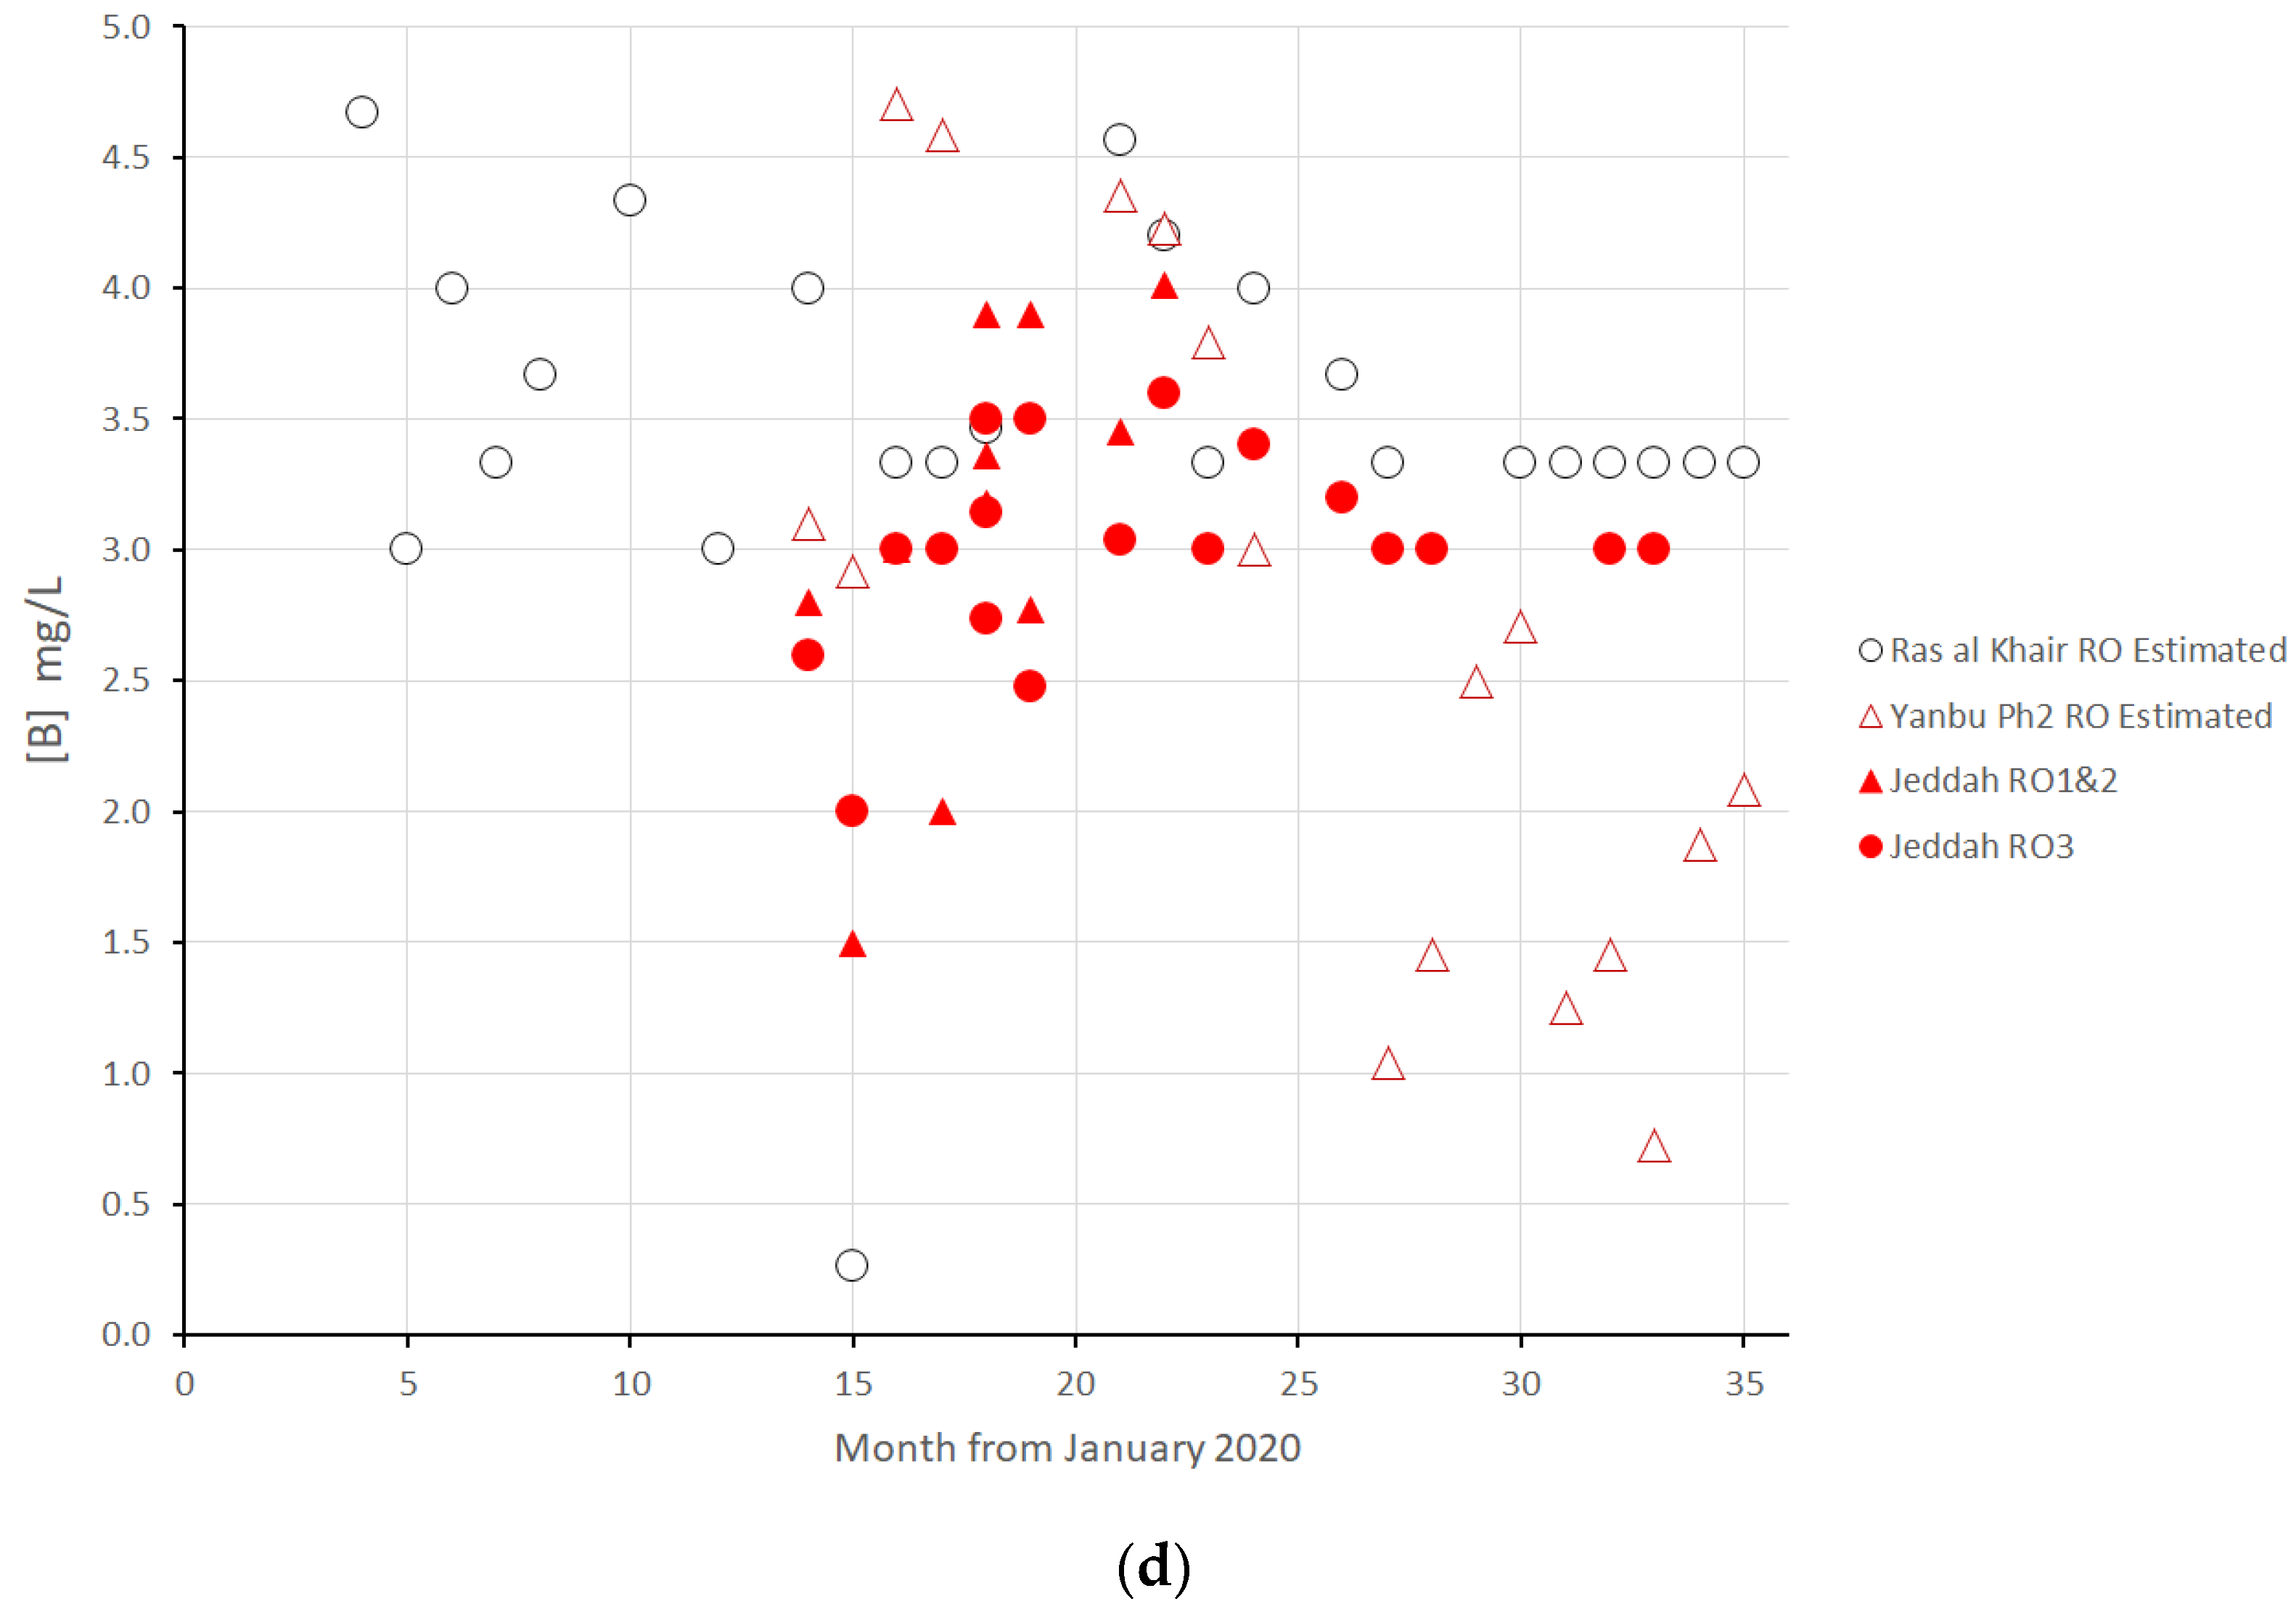
Figure 10 indicates the boron levels measured in waters produced by the SWCC network of desalination plants in 2020–2022.
It can be seen that the Jeddah RO plants consistently deliver water with boron levels in excess of the limit, presumably by avoidance of a pH-adjusted BWRO stage. Jeddah RO3 is the only currently operating plant producing water with an average level above the threshold value over the time period of the study (2.7 ppm). While the Ras al Khair results are well below 2.4 ppm, this analysis is for the combined water produced from approximately 30% SWRO and 70% MSF, suggesting that similarly high levels of boron are being passed by the Ras al Khair SWRO plant. Similarly, the frequent values reported above 1 ppm at the Yanbu Phase 2 plant suggest that the Yanbu RO plant is not consistently producing water with acceptable boron levels.
Boron values in excess of 2.4 ppm are reported on a few occasions at the smaller SWRO plants at Farasan and Qunfudah. The majority of the smaller plants in
Figure 10b,c were built to the same plan and introduced at the same time to replace thermal plants on the Red Sea. It is most likely that the plants with low values are adjusting the pH in the second stage RO to ensure boron is present as dihydrogenborate ion, while those with high boron levels are not. The similar trend over the year for the plants with higher boron concentrations indicates the strong seasonal effect of temperature on boron passage [
20]. Khafji, which is located in waters that have a very large change in temperature from winter to summer (~17–37 °C), has low boron levels in the cooler months, and the plants in the southern part of the Red Sea (Farasan, Qunfudah, Allith) with maximum water temperatures of 33–34 °C have boron levels greater than plants in the northern part of the Red Sea (Haql, Duba, Alwajh) with maximum water temperatures of 28–30 °C [
21].
Within the distribution system, the mixing of water from various sources ensures that the water delivered to the consumer is below the mandated limit in almost all cases. The elevated levels coming from Ras al Khair can be clearly traced through the levels of water delivered to Riyadh and Hafr al Batin; these can be used together with the Ras al Khair values and the relative capacity of the thermal and RO units to estimate the level of boron in the water produced by the Ras al Khair SWRO plant (
Figure 10d). From the relative capacity of the thermal and RO units at Yanbu Phase 2, the boron production at that plant can also be estimated. It can be seen that all three of these major RO plants apparently produce water with levels of boron above the mandated limit at almost all times, and quality delivery to the consumer is met only by mixing with water produced by thermal desalination. It is clear that these plants are not carrying out adequate pH adjustment in second-stage RO treatment over the entire period of the study.
Besides occasional high boron levels in pipelines dependent on the large RO plants listed above, high boron levels are found at some times in the transmission system in Jazan and Asir provinces, with maximum boron concentrations of 2.89 ppm reported at the Abha tank outlet (drawing water from Shuqaiq SWRO and Maraba dam) and 2.58 ppm at the Sabya tank outlet (drawing water from Shuqaiq SWRO and Baysh dam). It is not clear what is responsible for the occasional high levels of boron reported at the Abha and Sabya tank outlets, as the Shuqaiq plant reports low boron levels (<0.04 ppm) at all times and much lower maximum boron levels are reported at Maraba (0.24 ppm) and Baysh (1.38 ppm).
RO plants across the SWA system are producing water with excessive boron levels, especially in the warmer months. Addressing these elevated boron levels by appropriate changes to operations should be a priority to ensure that the water delivered to consumers meets quality standards as the SWA system shifts to a greater dependence on RO.
3.9. Aluminium
One month of data on aluminium concentrations throughout the SWCC network were obtained (
Table S22). Levels of 32–47 ppb were detected in Baysh and Hali dams, well below the SASO limit of 200 ppb, with the highest level for any desalination plant at Aziziah (27 ppb) and levels everywhere in the transmission system of 22 ppb or less, with the highest reported at a site drawing on the water from Baysh Dam (Sabya outlet).
3.10. Calcium, Magnesium, Potassium, and Sodium
Data collected on the major cationic contributors to seawater TDS are given in
Tables S23–S26. These major cations of seawater are not toxic and are all essential for human health to some degree, so they have relatively little direct impact on water quality. While low concentrations of calcium and magnesium in drinking water have been correlated with poorer health outcomes, especially for cardiovascular disease, there are no explicit legislated limits on the concentration of these ions in KSA or other jurisdictions [
22,
23]. Conversely, excessively high levels of these ions will be reflected in TDS exceeding regulatory limits.
The relative proportions of the main divalent and monovalent ions in product water may provide information about the state of desalination processes. These ions enter thermal processes by direct contamination with seawater or brine (e.g., through aerosols in MSF), so the relative numbers of these ions in the produced water before post-treatment should be the same as in the source water. With SWRO, while direct leakage is a possible source of contamination, it is also possible that the membrane will also not reject ions equally but act to an extent as a nanofiltration membrane, with a higher selectivity for divalent ions such that the produced water will have a higher monovalent/divalent cation ratio than seawater.
As the data obtained are after post-treatment in which significant amounts of calcium are added, the ratio (Na + K)/Mg was determined and compared with expected values of this ratio for seawater (
Table 5). Small but variable quantities of sodium are added in remineralization of product water from the addition of sodium hydroxide for pH adjustment, so this ratio should at all times be greater than the value for seawater.
Note that with the exception of Rabigh, which produced water with very low TDS, all the Red Sea RO plants are delivering water with significantly elevated ratios of monovalent to divalent cations, equivalent to a relative selectivity of 2:1 to 7:1 for Mg over Na and K, suggesting that the RO membranes are demonstrating selectivity for divalent ions. These ratios are highest for the new small plants and lowest for the large plants where TDS results suggest significant leakage or degradation of the membranes. Large thermal plants are producing water with a relative cation composition similar to seawater, as expected, while samples of water from combined thermal and RO sources (e.g., Yanbu Phase 2 and Ras al Khair) understandably have intermediate values.
Concerns about the potential health impact of consumption of water with a low Mg content have motivated the SWCC to fortify product water with Mg. Currently, processes have been implemented at two sites within the SWCC system to add Mg by replacing limestone with dolomite in post-treatment and by adding a Mg-rich concentrate obtained by nanofiltration of desalination brine, and Mg supplementation will be applied more widely in the coming years [
24,
25]. Over the period of this study, artificial supplementation of SWCC product water with Mg began at one site in 2022, Shoaibah RO4.
4. Conclusions
The tap water delivered by the Saudi Water Authority (SWA) in the Kingdom of Saudi Arabia is of high quality and is as safe to drink as the water provided by municipal water systems in Europe or North America. The water delivered to consumers meets the specifications of the Ministry of Environment, Water and Agriculture (MEWA) of KSA with a few minor exceptions: (i) TDS below specifications in stations served by long pipelines, which carry only desalinated water, with no admixture of groundwater or surface water; (ii) pH slightly above or below specifications, mostly on longer pipelines; (iii) occasional excursions above the bromate limit of 10 ppb, possibly associated with high initial concentrations of bromide and higher temperatures; and (iv) occasional boron levels exceeding the limit of 2.4 ppm at sites served primarily by desalinated water from SWRO.
The system that produces and transmits potable water for the SWCC is not unique in its dependence on desalination, but it differs from systems elsewhere in the Middle East, North Africa, and elsewhere in its scale and complexity. Nowhere else in the world are such large quantities of desalinated water mixed with such large quantities of groundwater and dam water in a single distribution system, and the widely different properties of the source water make it difficult to supply water with consistent properties across the Kingdom. The relatively higher TDS levels produced by the new generation of RO plants present potential challenges in maintaining acceptable levels of chloride, sulfate, and disinfection by-products, while the intrinsic inability of RO to separate neutral species makes it imperative to implement operational improvements such that boron remains at acceptable levels. At the same time, the replacement of older transmission and distribution systems should make the system more robust and remove the incentive to operate at high pH to achieve an appropriate LSI, reducing the risk of disinfection by-product formation. Phasing out the use of groundwater in Riyadh will also reduce the load of potentially problematic ions in the system.
In summary, while the continuing development of the potable water production and transmission system in the Kingdom of Saudi Arabia presents numerous challenges, the water provided is of high and consistent quality and should become more so with appropriate investment in operations and maintenance into the future.


