Abstract
Surfactants have been widely used in various fields in recent years, but subsequent treatment of their wastewater has always been a problem that needs to be solved. As a new sewage treatment method, algal–bacterial aerobic granule sludge (algal–bacterial AGS) is considered to be one of the potential methods for treating this kind of wastewater. This study investigated the efficiency of using algal–bacterial AGS to treat wastewater containing surfactants and compared it with bacterial AGS. The results indicated that when confronting a high-concentration surfactant, algal–bacterial AGS could keep a relatively high nutrient removal capacity (about 90% dissolved organic carbon, 99% ammonia nitrogen, 52% total phosphorus) and improved the adaptability to sudden changes in high-concentration surfactant environments compared with bacterial AGS. These results illustrated that algal–bacterial AGS is a potential method to process wastewater containing surfactants with superior treatment efficiency and adaption response.
1. Introduction
The demand for surfactants, the essential ingredients of industrial and daily necessities, has geometrically increased during the past ten years because of economic growth [1]. It is estimated that the consumption of anionic surfactants reached nearly 60% of the total [2]. Among them, sodium dodecyl sulfate (SDS) is widely applied to daily household care products such as hand sanitizer and body soap, because of its excellent foaming ability and easy degradability [3]. However, the increased frequency of cleaning has resulted in elevated surfactant concentrations in wastewater treatment plants (WWTPs) [4]. In addition, approximately 60% of the surfactants consumed by anthropogenic activity are predicted to enter natural water bodies every year [5]. Therefore, their excessive use poses a latent threat to the environment such as water pollution, which has adverse effects on aquatic life [6].
Many methods have been investigated to treat surfactant-containing wastewater [7,8,9]; however, high demand in energy and cost and partial removal efficiency limited their prospects for sustainable development. In addition, the foaming and sludge bulking problems resulting from their excellent foamability properties and unique structure increase the difficulty of treating such wastewater in WWTPs [10]. Based on this, a new global trend towards a relatively novel and highly efficient method is in urgent development.
Algal–bacterial aerobic granular sludge (AGS) has attracted much attention in recent years because of its excellent properties such as good granular stability, self-oxygenation, and superior removal efficiency [11,12,13]. Additionally, because of the mutualism between algae and bacteria, studies have demonstrated that algal–bacterial AGS exhibits outstanding biodegradability, particularly with challenging substances like microplastics [14] and antibiotics [15], simultaneously achieving high removal rates of target pollutants and nutrients in wastewater. As a novel technology, algal–bacterial AGS is expected to be widely used in wastewater treatment. In addition, the recovered algal sludge can be considered for fertilizer or other uses as it still contains a large amount of recovered nutrients [16]. Our previous study first demonstrated the excellent performance of algal–bacterial AGS in treating SDS-containing wastewater in cycle tests [14]; however, whether the stability and removal performance of algal–bacterial AGS would be affected when exposed to SDS in the long term has not been clarified. So, a continuous experiment should be carried out to explore the feasibility of using algal–bacterial AGS to treat surfactant-containing wastewater.
Therefore, this study aimed to investigate the stability and treatment efficiency of algal–bacterial AGS in response to different concentrations of surfactant in domestic wastewater during continuous operation. The performance was also compared to the conventional bacterial AGS method. It is hoped that this study will provide useful reference about the applications of algal–bacterial AGS when dealing with the treatment of surfactant-containing wastewater.
2. Materials and Methods
2.1. Seed Sludge and Reactor Set-Up
Algal–bacterial AGS and bacterial AGS sampled from lab-scale reactors that were maintained for half a year were used as seed sludge in the experimental group and control group, respectively. The basic characteristics of the seed sludge are shown in Table 1. A continuous experiment was carried out in six lab-scale sequencing batch reactors (SBRs) with a working volume of 500 mL. The basic operation conditions for the reactors are shown in Table 2. During the experiment, an LED light was suspended above the algal–bacterial AGS reactor, and the light intensity was kept at about 3760 lux, whereas the bacterial AGS reactor was covered by a hood to avoid light exposure. The entire experiment was conducted under a constant room temperature (25 ± 2 °C). The compositions of synthetic domestic wastewater used in this study are the same as in a previous study [17].
Table 1.
The characteristics of algal–bacterial AGS and bacterial AGS cultured in lab-scale reactors.
Table 2.
The parameters of the reactors in the continuous experiment.
2.2. Experimental Design
The continuous experiment was divided into 4 stages in order to investigate the effect of different surfactant concentrations on the performance of algal–bacterial AGS and bacterial AGS. Each stage lasted for 4 weeks. In Stage I both groups were cultivated with synthetic wastewater with no surfactant addition [17]. In Stage II, 10 mg/L SDS was added to synthetic wastewater, while the concentration of dissolved organic carbon (DOC) was kept the same by adjusting the additional amount of sodium acetate. In Stage III, 30 mg/L SDS was added to synthetic wastewater, and the DOC concentration was also kept the same by adjusting the sodium acetate concentration. In Stage IV, the addition of SDS was stopped, and synthetic wastewater with the same composition as in Stage I was adopted. During the whole experiment, water samples were taken weekly, and sludge samples were taken at the end of each stage for measurements.
2.3. Analytical Methods
The dissolved organic carbon (DOC), dissolved inorganic carbon (DIC), SDS concentration, pH, and the morphology of algal–bacterial AGS and bacterial AGS were detected by the same method described in a previous study [17]. The NH4+-N, NO3−-N, NO2−-N, total nitrogen (TN), and total phosphorus (TP) in the water samples were measured according to the standard method [18]. The SVI5 and chlorophyll a (Chl-a) content of the sludge samples were measured using the method described in a previous study [16]. Mixed liquor (volatile) suspended solids (ML(V)SS) were tested in the same way as described in Capodici et al. [19]. The specific oxygen uptake rate (SOUR) was measured following the method mentioned by Kwon et al. [20].
2.4. EPS Extraction and Measurement
The protein (PN) and polysaccharide (PS) contents were the main components of EPS, which were extracted and analyzed according to the method mentioned in Dong et al. [16].
2.5. Statistical Analysis
All analyses were performed in triplicate, and the results are shown as the mean ± standard deviation. Analysis of significant differences was carried out using the t-test method by Microsoft Excel 2019. A p value < 0.05 was deemed statistically significant.
3. Results and Discussion
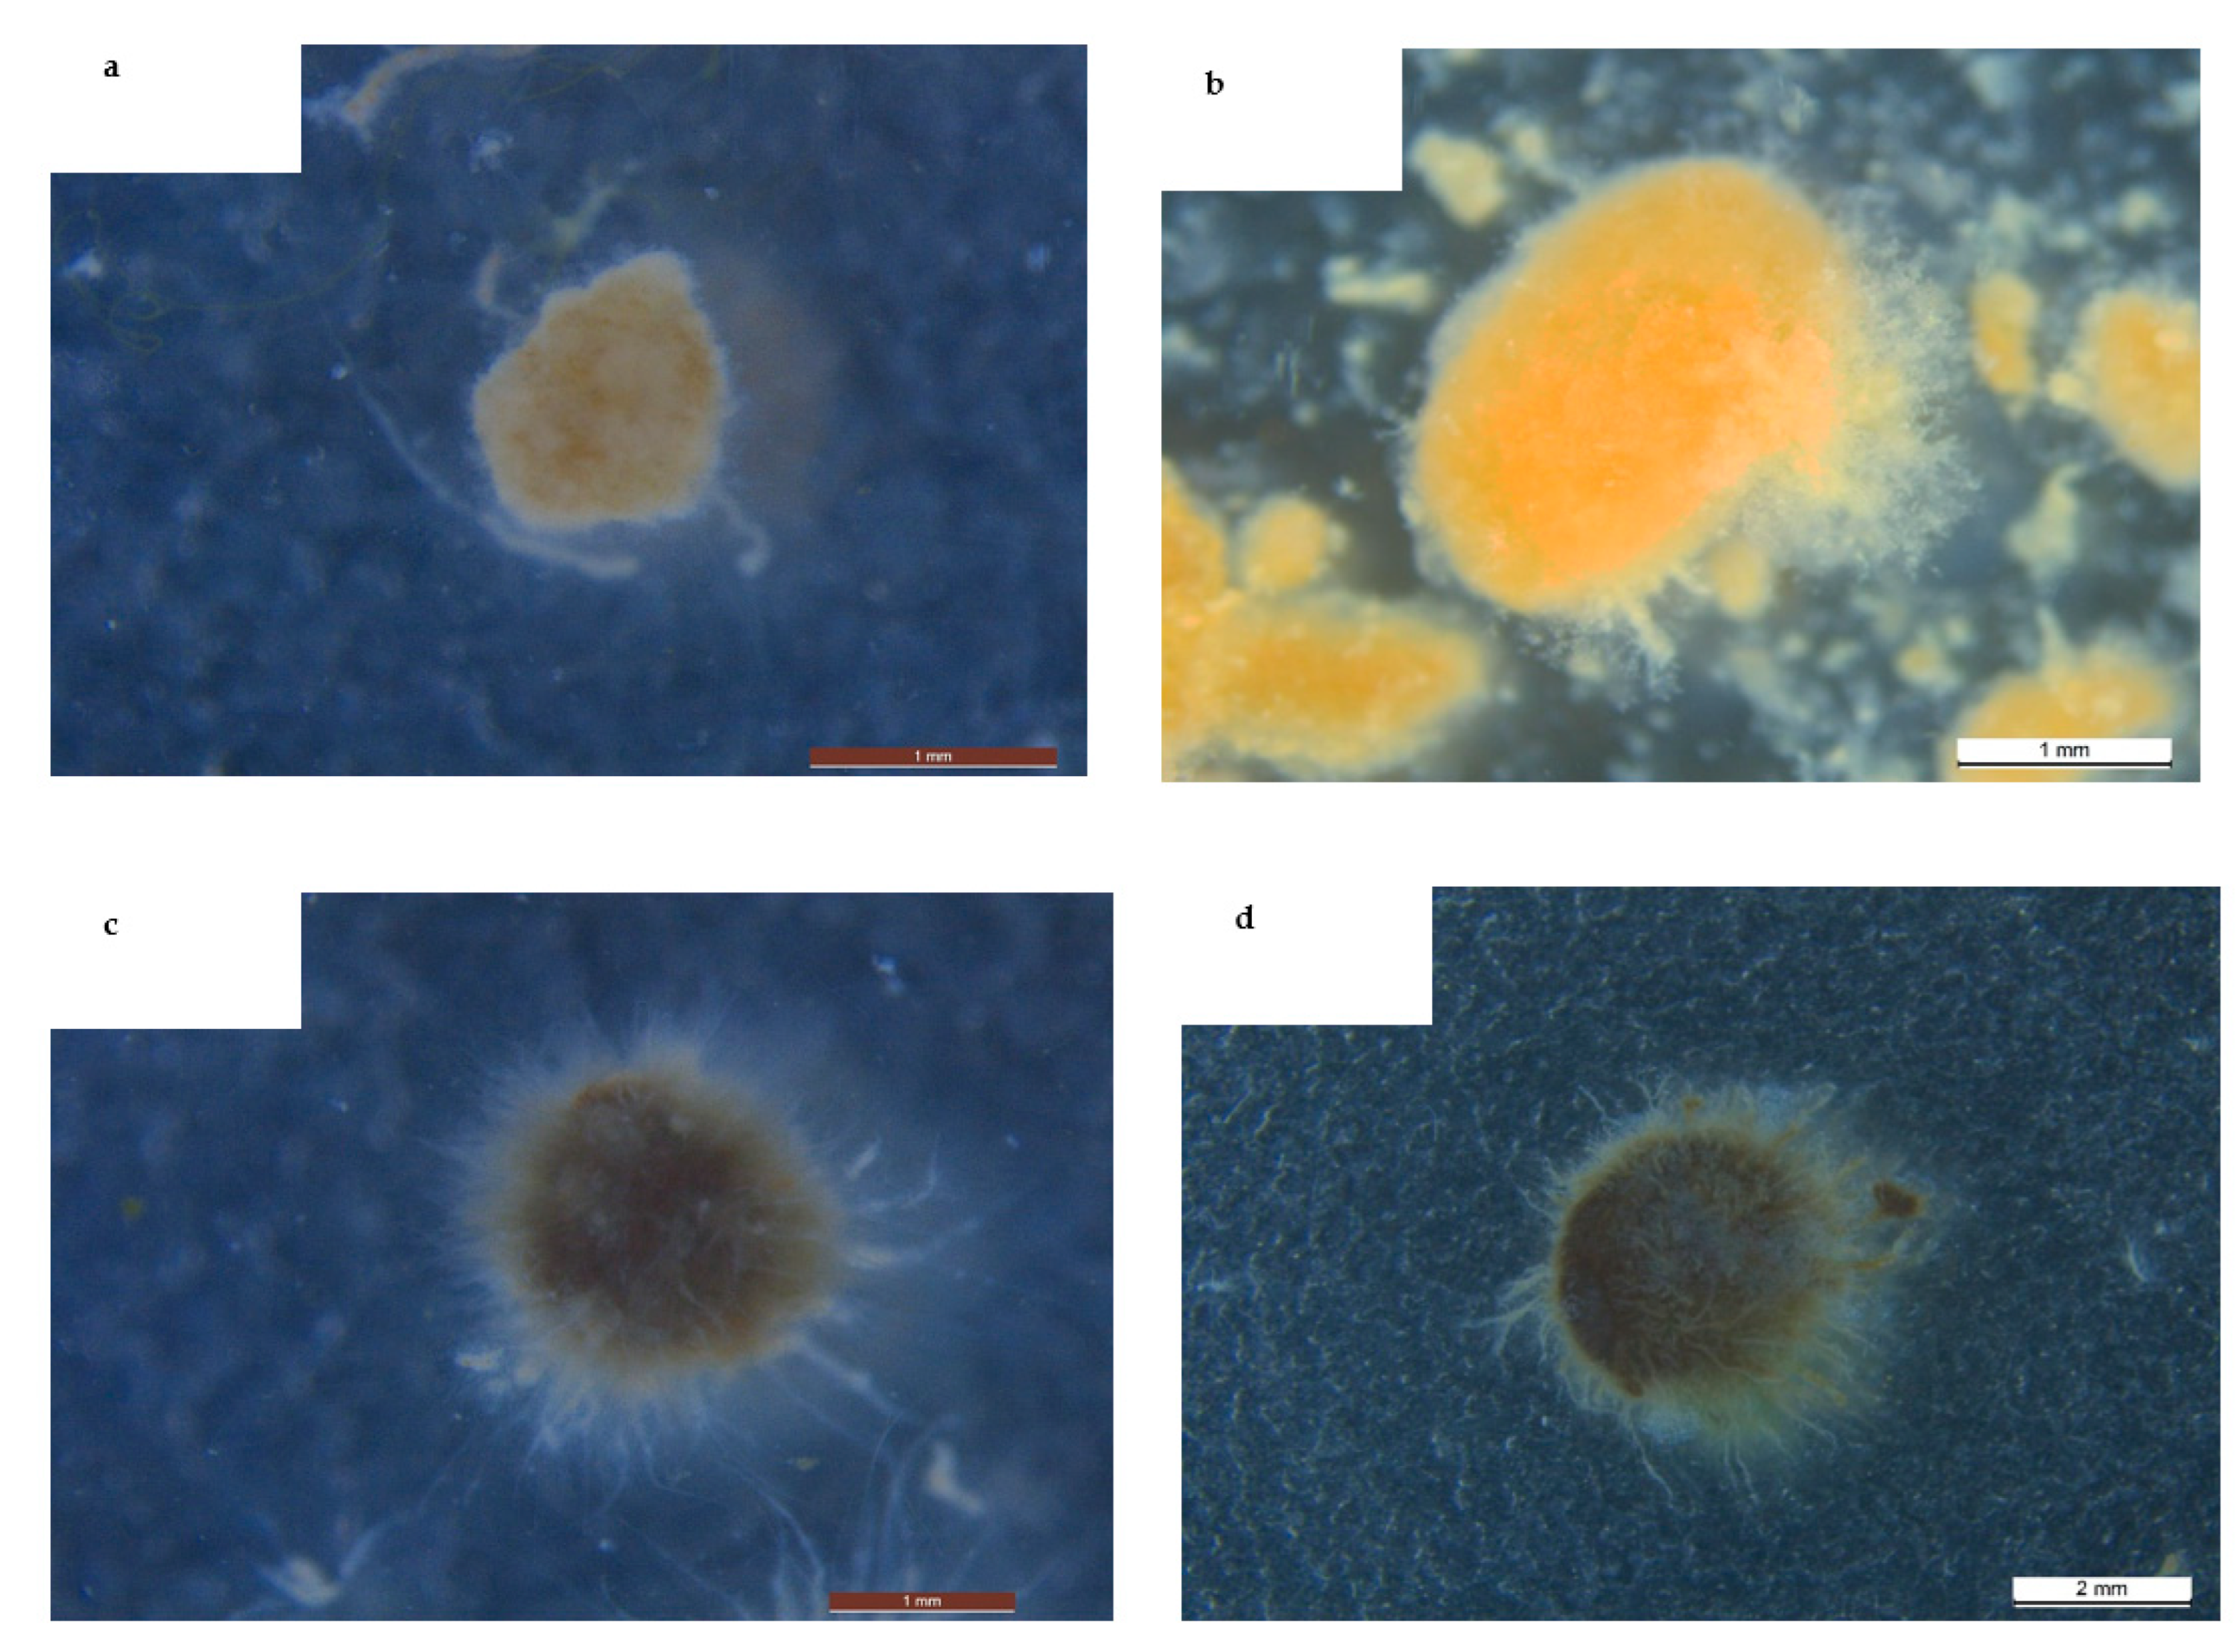
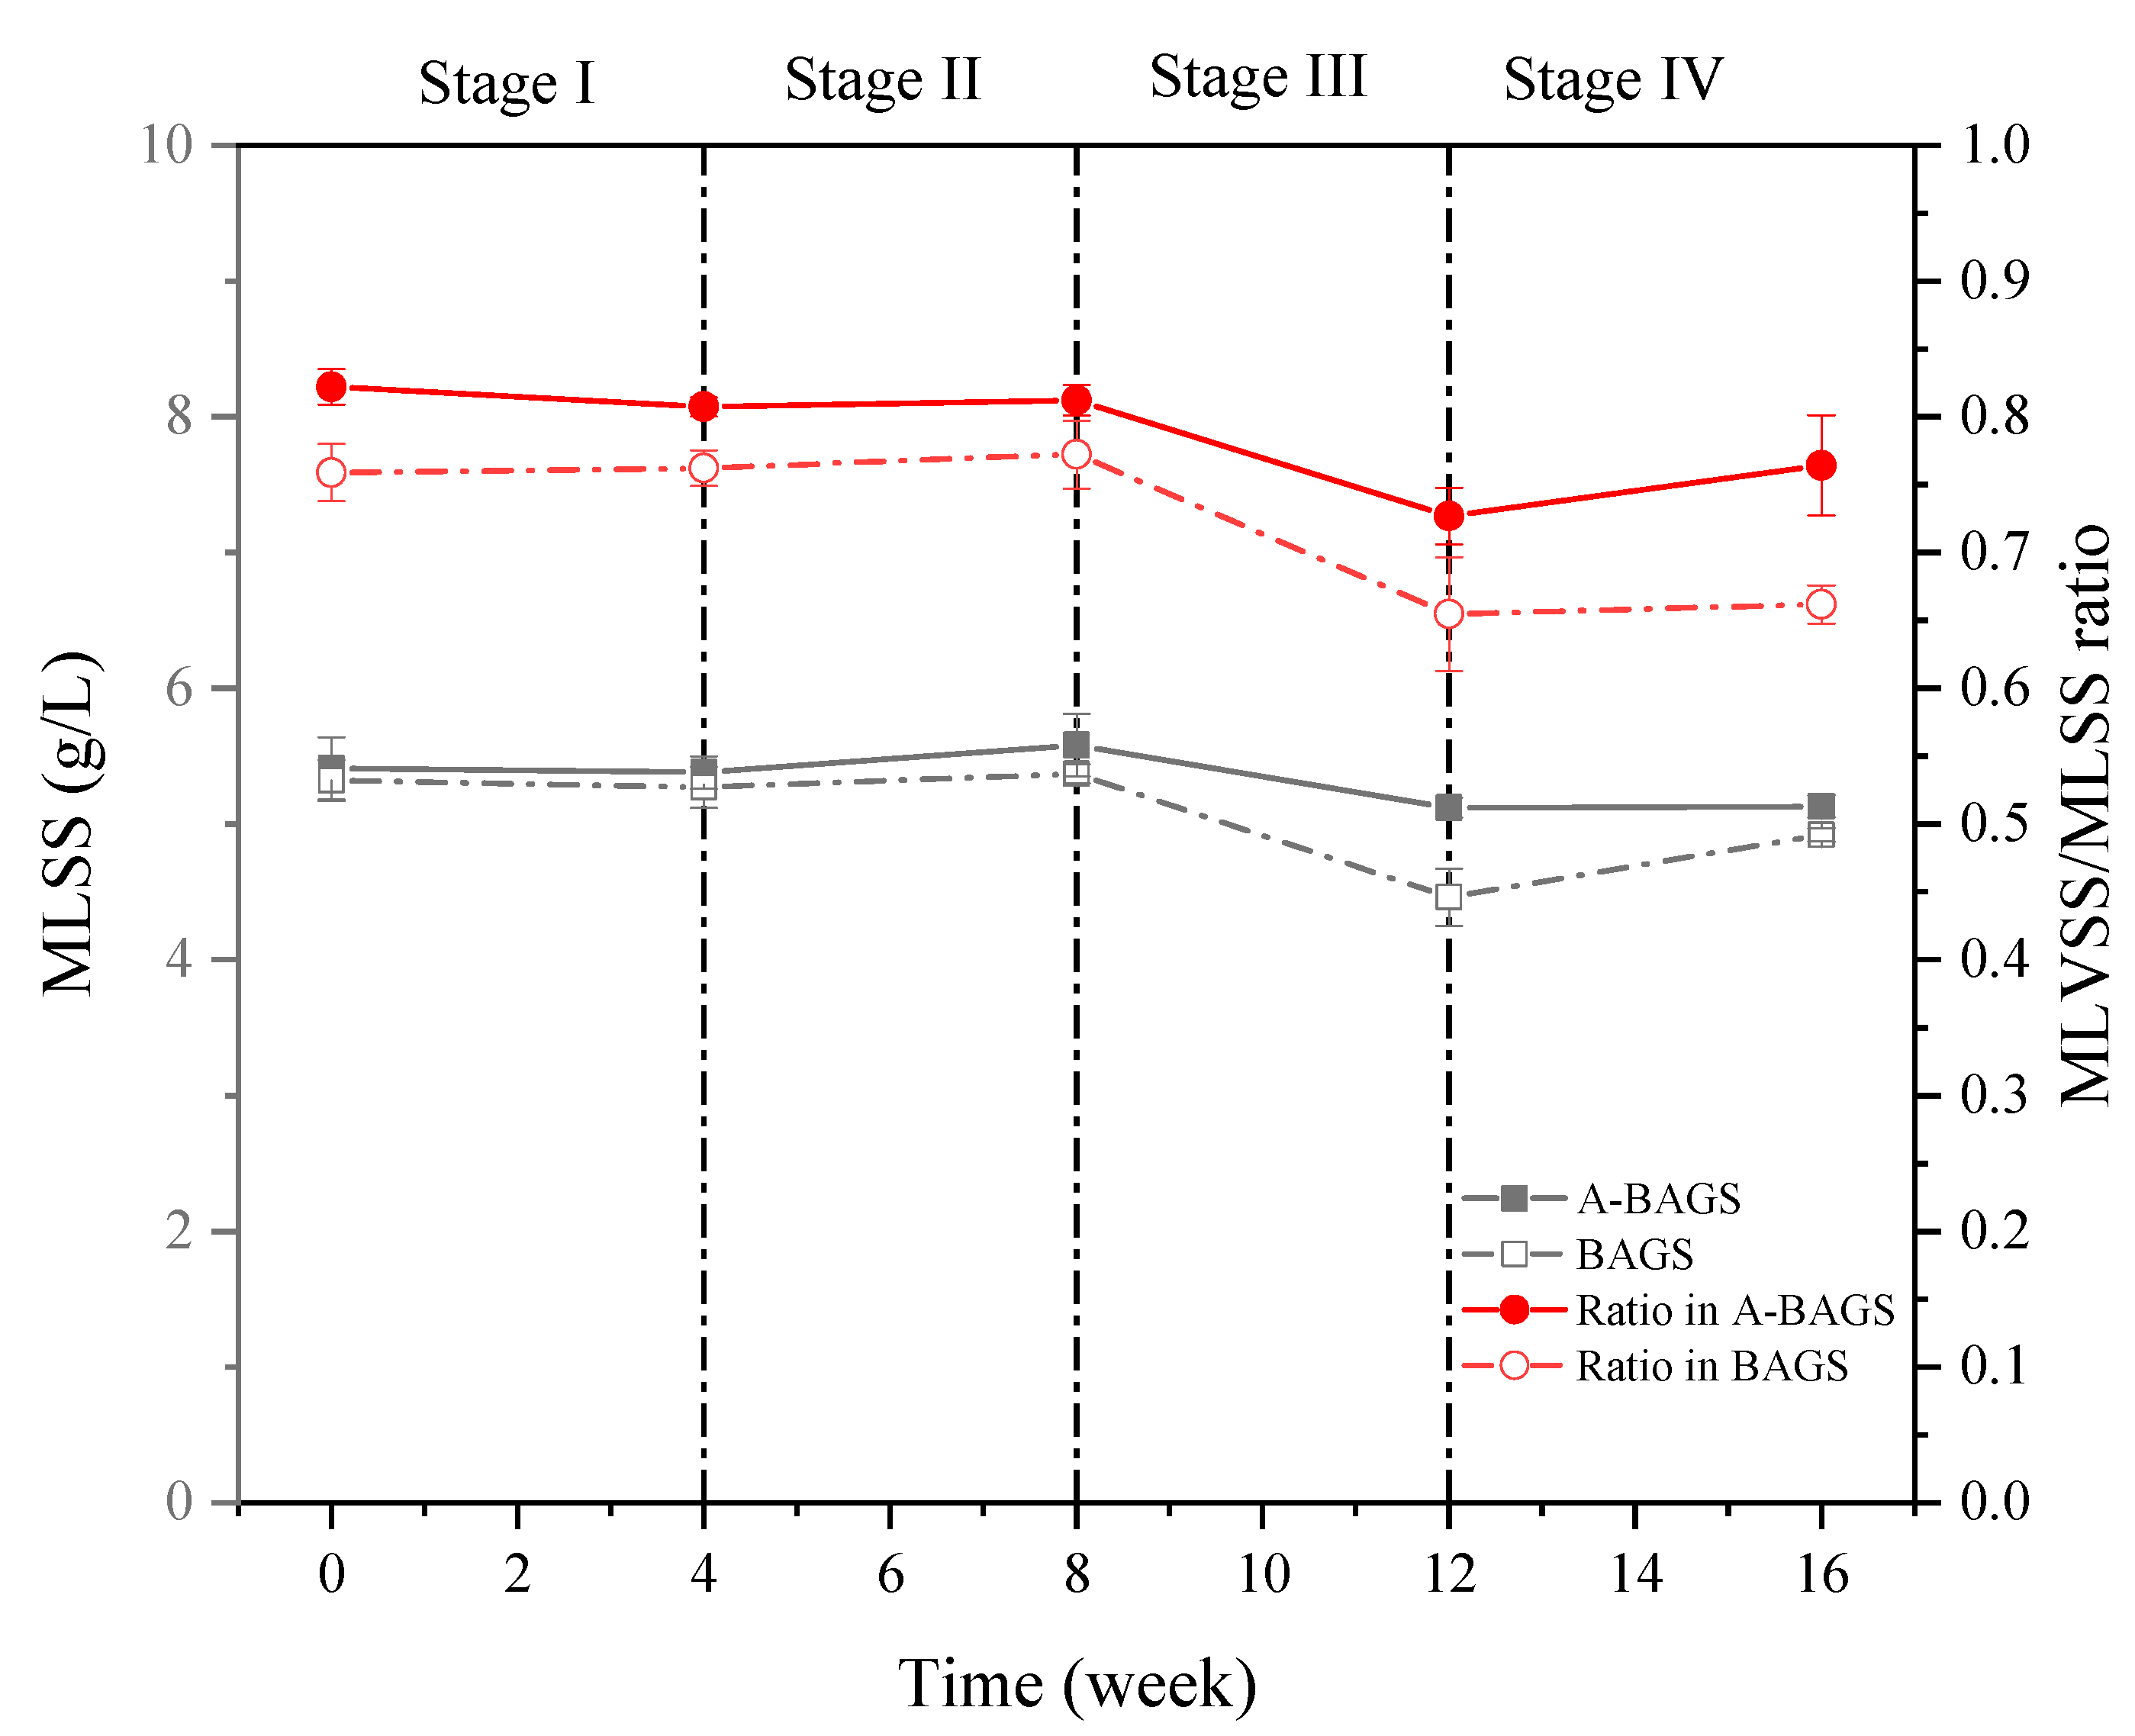
3.1. Morphology and Biomass Growth
As shown in Table 3, the particle size of the two granular sludges slightly changed in Stage II, but during Stage III, the particle size of the algal–bacterial AGS group increased from 2.23 ± 0.38 mm to 3.39 ± 0.58 mm, and the bacterial AGS group from 1.87 ± 0.27 mm to 2.41 ± 0.41 mm, representing increases of 43% and 28%, respectively. According to the analyzed EPS data, the results indicate that complex organic matter stimulates EPS secretion by algal–bacterial AGS, resulting in an obvious increase in particle size, which is consistent with the observations of Ji et al. [21]. SVI5 showed an increasing trend with the increase in surfactant concentration in both reactors, but the growth in the algal–bacterial AGS group was more obvious than that of the bacterial AGS group, with an increase of about 23% (p < 0.05). Figure 1 demonstrates the morphological changes in both sludges before and after the continuous experiment. It indicates that in the case of long-term exposure to surfactants, the surface of the granular sludge became rougher and overgrown with white filamentous bacteria, which may be the reason for the decrease in the SVI5 parameter [22]. Campbell and Wang [23] also indicated that prolonged exposure to SDS would affect the morphological changes in flocs in sludge and thus their settling properties.
Table 3.
The changes in size and SVI5 of algal–bacterial AGS and bacterial AGS during the continuous experiment.
Figure 1.
The change in morphology of bacterial AGS before (a) and after (b) the continuous experiment and algal–bacterial AGS before (c) and after (d) the continuous experiment.
Regarding the biomass growth results shown in Figure 2, at the beginning of the experiment, the initial value of the algal–bacterial AGS group reached 5.41 ± 0.23 g/L, which was similar to the 5.32 ± 0.15 g/L value of the bacterial AGS group. After adding a low-concentration surfactant, the biomass growth of both groups showed a limited increase, reaching 5.58 ± 0.23 g/L and 5.37 ± 0.07 g/L, respectively, indicating that low-concentration surfactants may be used as carbon source supplementation that promotes microbial growth [4]. When entering Stage III, the high concentration of surfactant apparently inhibited the growth of microorganisms in the bacterial AGS group, which decreased by about 16.1% (p < 0.05); however, algal–bacterial AGS showed an insignificant change of only about 5.3%. In Stage IV, both groups finally recovered to their initial states. In addition, the ratio of MLVSS/MLSS also showed the same trend; however, the ratios of the two groups at the end of the experiment decreased by 8% and 13%, respectively. A potential reason may be that surfactants inhibit sludge activity, thereby affecting the organic content and thus reducing this ratio [4].
Figure 2.
Changes in mixed liquid suspended solids (MLSS and the MLVSS/MLSS ratio) of algal–bacterial AGS and bacterial AGS cultivated at different conditions in the continuous experiment. Stage I, SDS 0 mg/L; Stage II, SDS 10 mg/L; Stage III, SDS 30 mg/L; Stage IV, SDS 0 mg/L; A-BAGS stands for algal–bacterial AGS, and BAGS stands for bacterial AGS.
3.2. Carbon Removal
Figure 3 illustrates the changes in DOC and DIC during the exposure experiment. Both algal–bacterial AGS and bacterial AGS maintained a DOC removal rate of more than 93% in the first two stages; however, when the surfactant concentration increased to 30 mg/L, the DOC removal efficiencies of algal–bacterial AGS and bacterial AGS dropped to 81.21 ± 1.2% and 72.69 ± 2.4%, respectively, at the end of the first week, and the effluent concentration reached 18.79 ± 0.12 mg/L and 27.31 ± 0.24 mg/L. After that, the removal rate of both groups began to recover slowly in the following three weeks. By the end of Stage III, the algal–bacterial AGS group reached 89.88 ± 2.2%, which was higher than the value of 80.22 ± 2.7% in the bacterial AGS group, indicating that algal–bacterial AGS could more simply adapt to the harsh environment and return to the normal treatment level [24]. In contrast to DIC, the effluent concentration of the algal–bacterial AGS group was lower than that of the bacterial AGS group under the no surfactant condition. However, when entering Stage II, the effluent concentration of DIC in the algal–bacterial AGS group increased and then gradually decreased. By the end of Stage II, the DIC concentration in the effluent reached 10.18 ± 0.18 mg/L, which was significantly lower than that of the bacterial AGS group. This phenomenon may be attributed to the inhibition of algal cell activity in algal–bacterial AGS after the addition of surfactant, resulting in an increase in DIC effluent concentration; then, the DIC removal efficiency gradually returns to normal levels after adapting to the new environment and even increases to maintain its cell growth under the stimulation of surfactant [25]. When it came to Stage III, the concentration of DIC in the effluent of the algal–bacterial AGS group suddenly increased to 23.17 ± 0.12 mg/L. Although the removal efficiency slowly recovered afterward, it was still unable to return to the initial state, which shows that the destruction of algae cells caused by the surfactant is irreversible [25]. This result may be also associated with the change in chlorophyll-a. As shown in Table 4, the chlorophyll content decreased significantly from Stage II to Stage III (p < 0.05), and, as we know, chlorophyll content is closely related to the growth of algae [26]. Decreased chlorophyll content means decreased DIC utilization. The DIC concentration in the bacterial AGS group was relatively stable compared with the algal–bacterial AGS group, and the effluent concentration was constant at around 19 mg/L. This result also showed that the absorption and utilization of inorganic carbon by algae cells is the main reason for the high removal efficiency of algal–bacterial AGS for DIC [25]. As confirmed by many articles, bicarbonate is the main form of carbon ingested by algae, which facilitates the growth of algal cells and lipid accumulation [26].
Figure 3.
Changes in DOC (a) and DIC (b) of the algal–bacterial AGS and bacterial AGS reactors with SDS addition at different concentrations in the continuous experiment. Stage I, SDS 0 mg/L; Stage II, SDS 10 mg/L; Stage III, SDS 30 mg/L; Stage IV, SDS 0 mg/L; A-BAGS stands for algal–bacterial AGS, and BAGS stands for bacterial AGS.
Table 4.
The changes in chlorophyll-α (Chl-α) in algal–bacterial AGS during the continuous experiment.
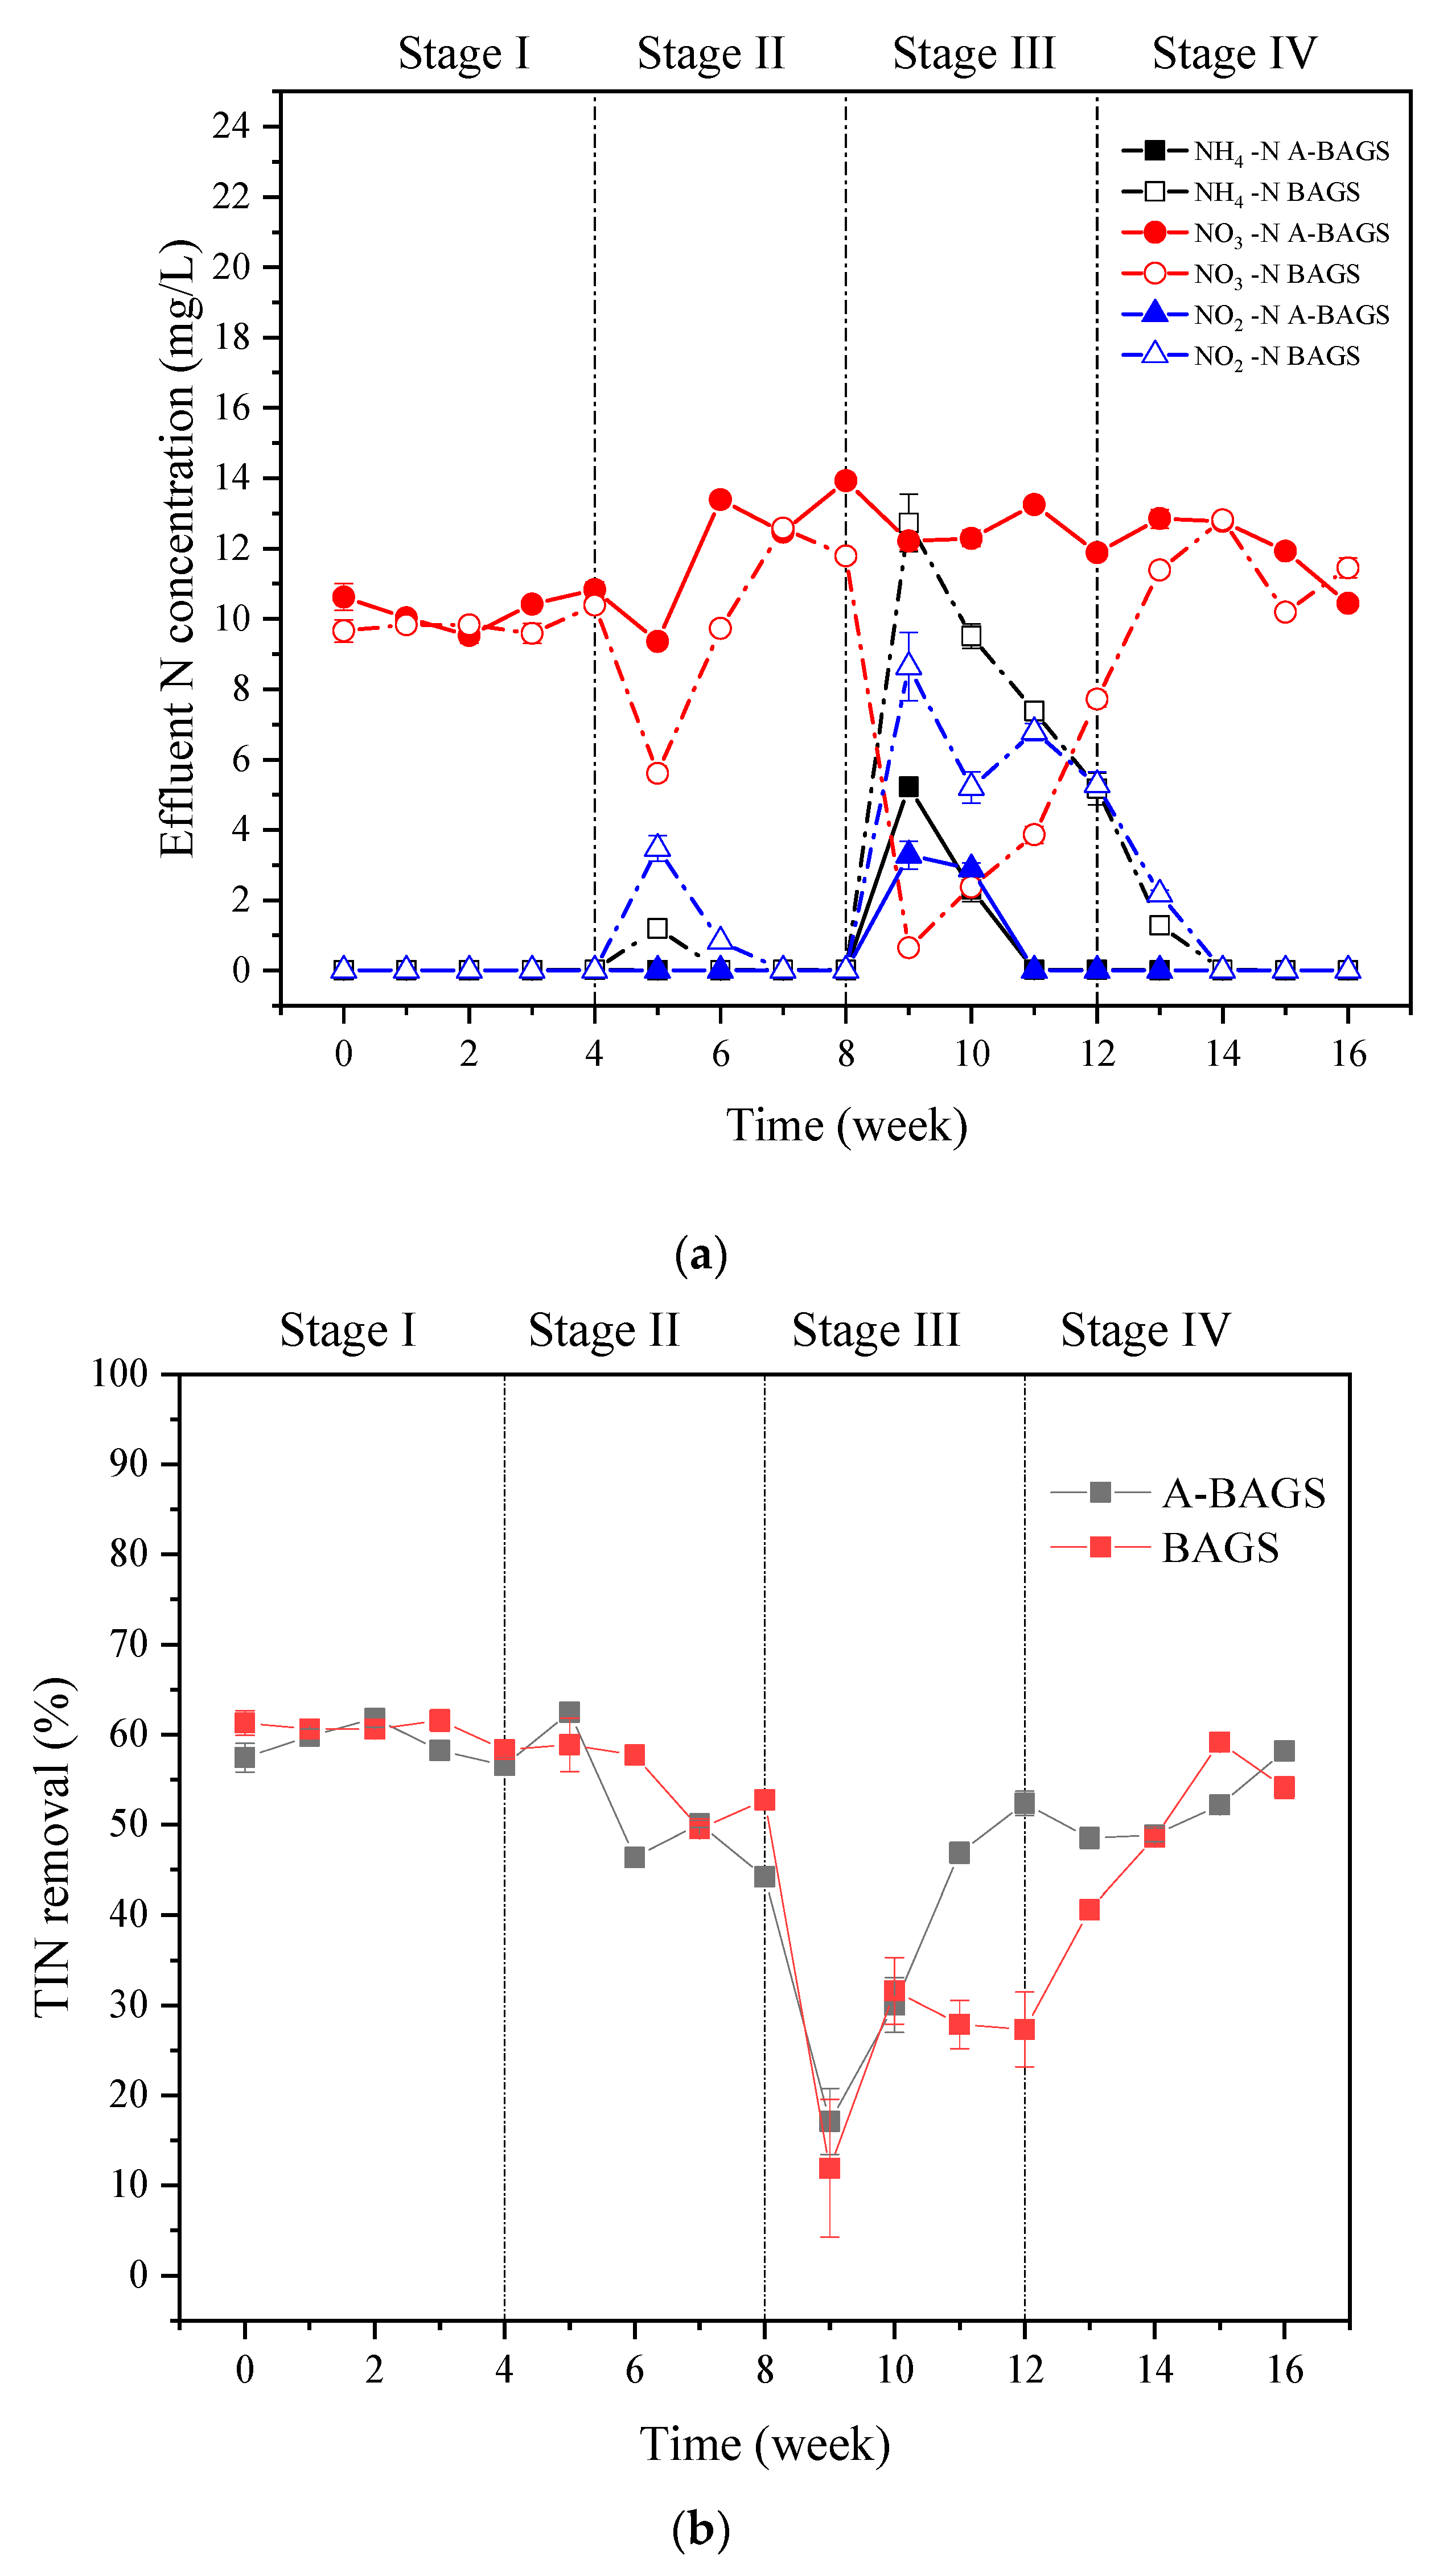
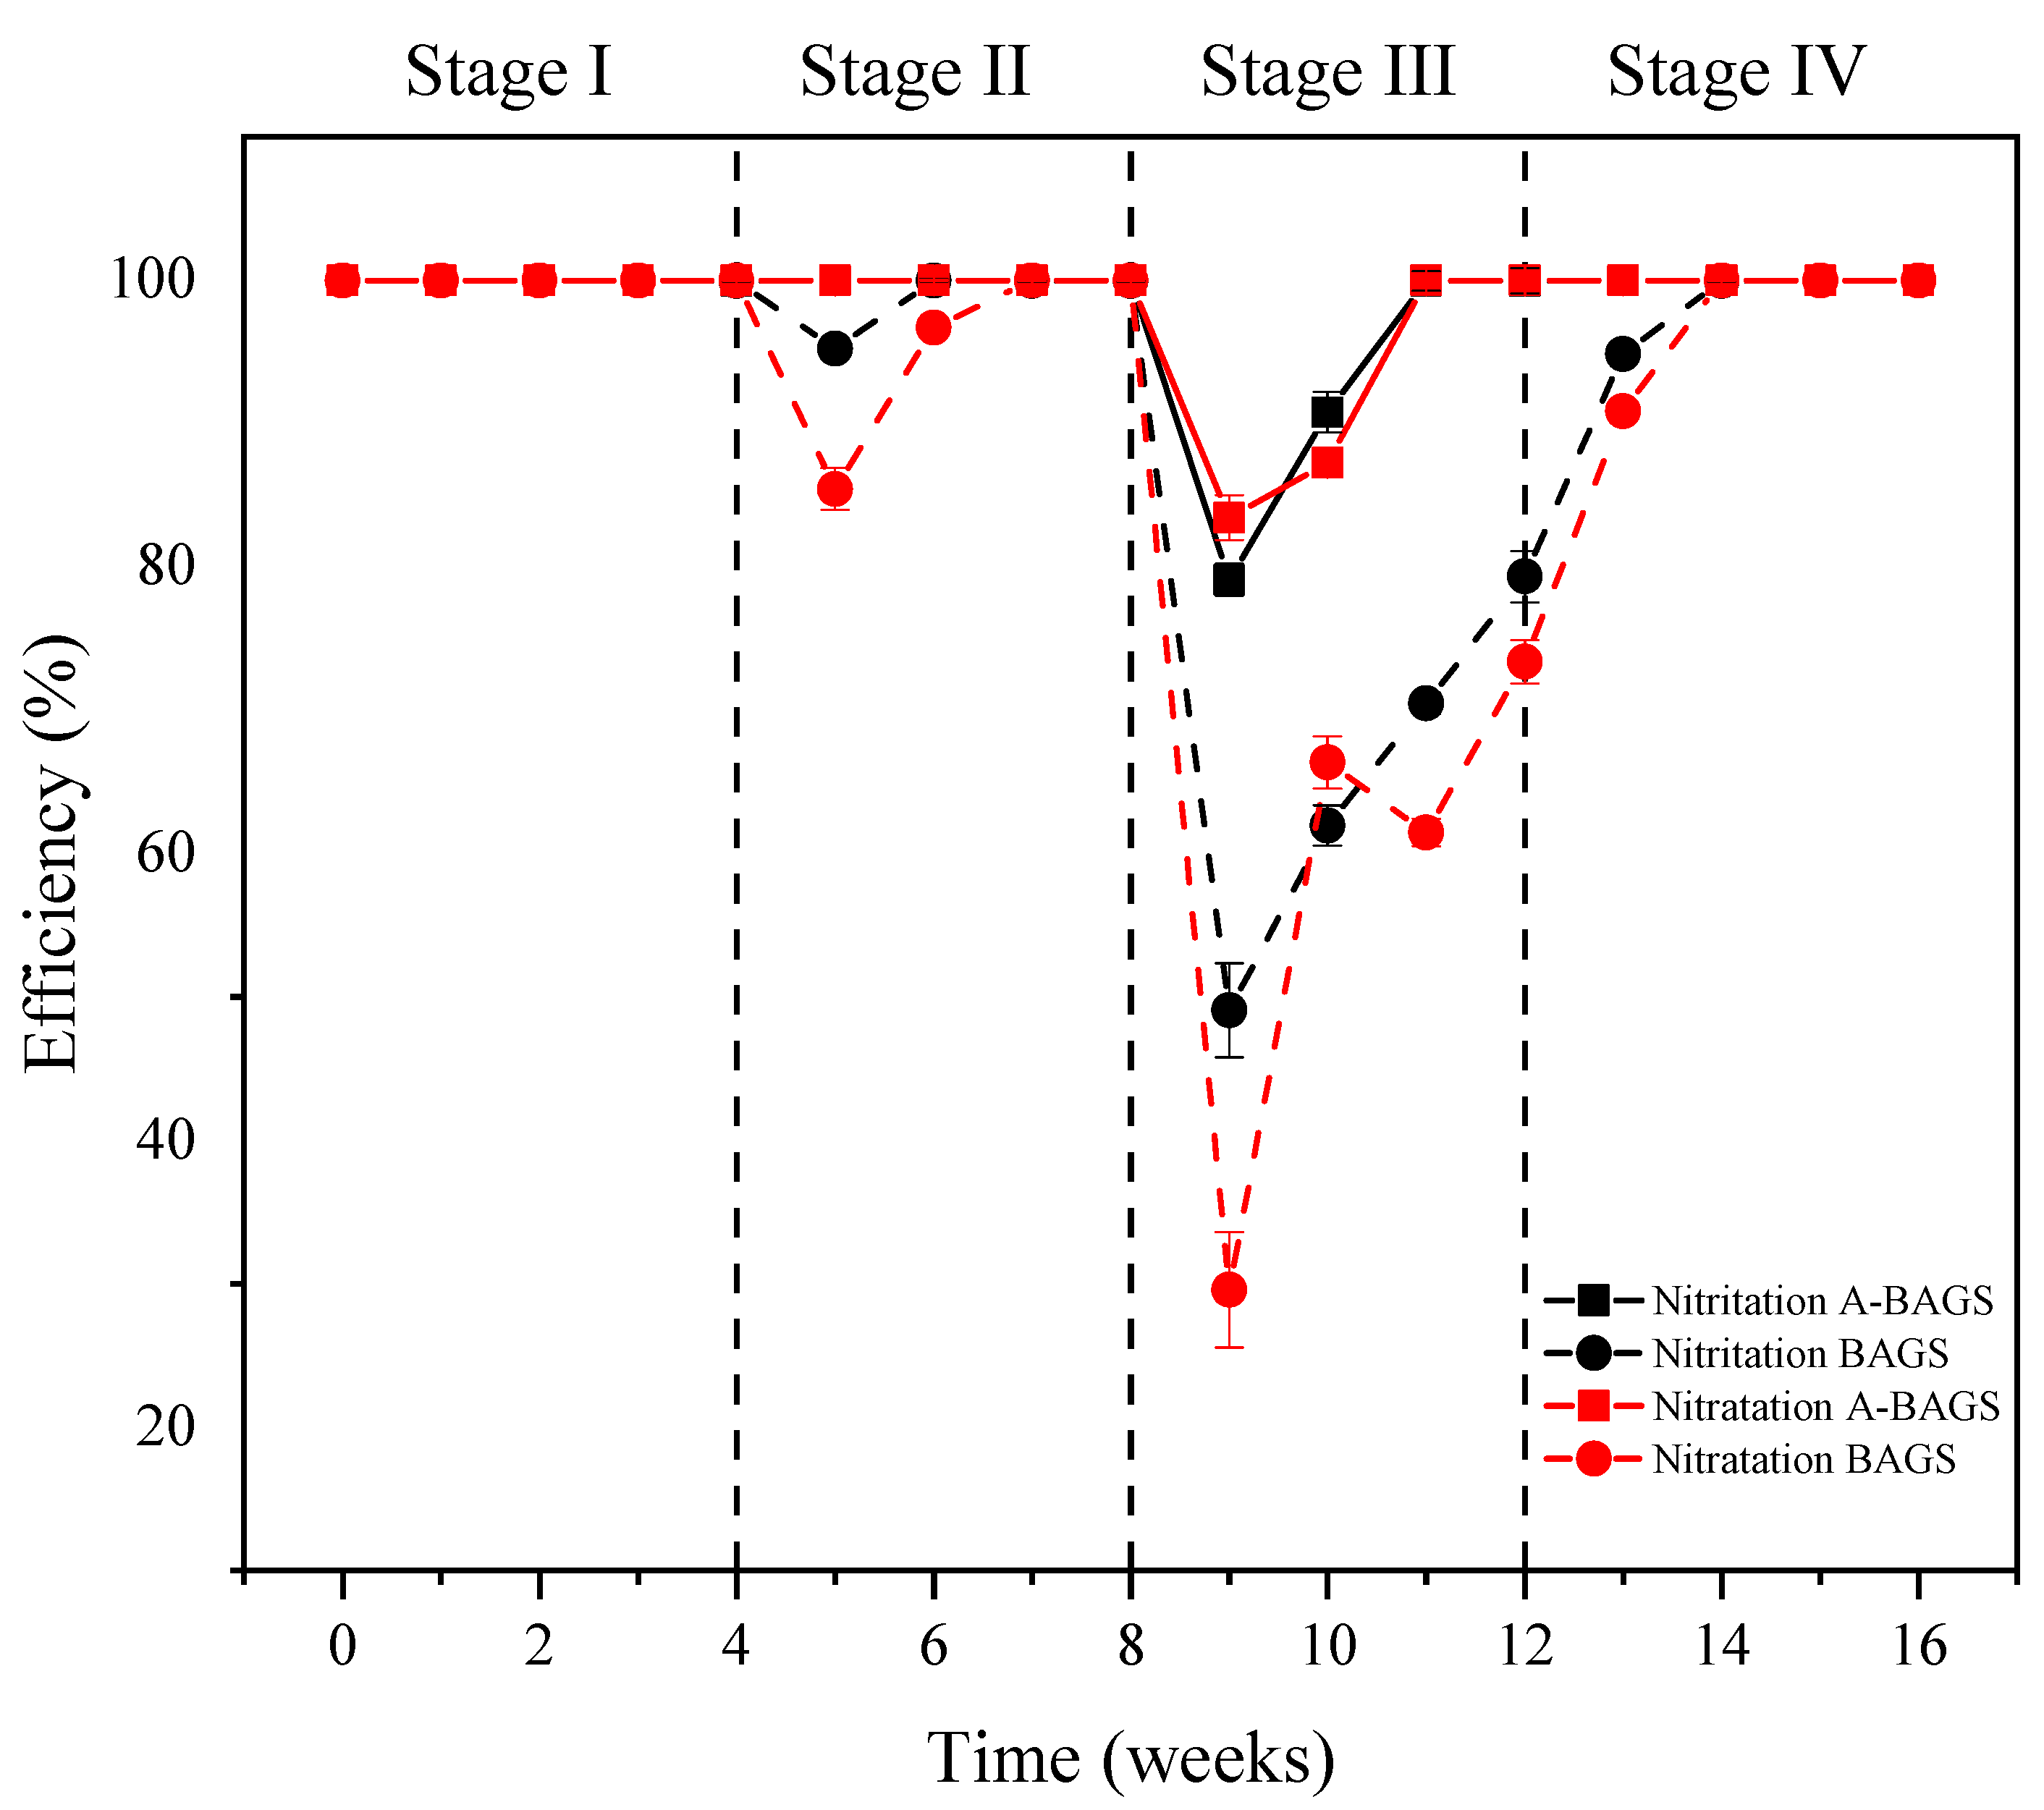
3.3. The Removal of N
Figure 4 demonstrates the removal efficiency and effluent concentration of TIN between the two groups during the whole process. It shows that without the addition of surfactants, the presence of ammonia nitrogen and nitrite was basically not detected in the effluent of both groups. The main nitrogen component was nitrate, and both systems maintained a TIN removal rate of about 58%. In Stage II, the nitrification process of the bacterial AGS group was inhibited by surfactant interference, and the nitrite concentration in the effluent increased to 3.47 ± 0.36 mg/L. Algal–bacterial AGS maintained a good nitrification ability, but the effluent concentration of nitrate increased by about 23%, indicating that the denitrification process was inhibited. As the surfactant concentration increased, algal–bacterial AGS and bacterial AGS showed obvious differences during Stage III. Although the TIN removal efficiency of algal–bacterial AGS and bacterial AGS decreased rapidly to 17.12 ± 3.68% and 11.92 ± 7.64% in the early stage, algal–bacterial AGS recovered to the initial state after two weeks. On the contrary, the removal efficiency of the bacterial AGS group only reached 27.32 ± 4.16% at the end of Stage III, which was significantly lower than that of the algal–bacterial AGS group (52.36 ± 1.34%) (p < 0.05), and then gradually recovered to normal level in Stage IV. This result indicates that algal–bacterial AGS had better nitrogen removal ability in treating wastewater containing a high concentration of surfactants compared with traditional wastewater treatment methods [27]. Moreover, the assimilation of algae is also one of the reasons for the higher efficiency of nitrogen removal by algal–bacterial AGS [28].
Figure 4.
Changes in TIN of algal–bacterial AGS and bacterial AGS at different conditions in the continuous experiment. (a) The effluent concentration of TIN in algal–bacterial AGS and BAGS. (b) TIN removal of algal–bacterial AGS and bacterial AGS. Stage I, SDS 0 mg/L; Stage II, SDS 10 mg/L; Stage III, SDS 30 mg/L; Stage IV, SDS 0 mg/L; A-BAGS stands for algal–bacterial AGS, and BAGS stands for bacterial AGS.
Figure 5 illustrates the nitritation and nitratation efficiencies in both systems, which were calculated according to Li et al. [29]. The results showed that low concentrations of surfactants had little impact on the nitrification processes of the two systems. However, as the surfactant concentration increased, obvious differences between the algal–bacterial AGS group and the bacterial AGS group began to appear. Although the nitratation and nitritation processes were inhibited, algal–bacterial AGS could basically return to normal levels after three weeks, which was significantly better than bacterial AGS. When surfactant addition was removed, bacterial AGS also quickly returned to normal levels in the fourth stage, indicating that the inhibitory effect of SDS on nitrifying bacteria is reversible. Besides that, during Stage III, the decreasing trend in the nitratation rate was significantly more obvious than that of the nitritation rate, suggesting that nitrite-oxidizing bacteria (NOB) is more sensitive to surfactants compared with ammonia oxidation bacteria (AOB), and this result is similar to the results of some previous studies [28].
Figure 5.
Changes in nitritation and nitratation efficiencies of algal–bacterial AGS and bacterial AGS at different conditions in the continuous experiment. Stage I, SDS 0 mg/L; Stage II, SDS 10 mg/L; Stage III, SDS 30 mg/L; Stage IV, SDS 0 mg/L; A-BAGS stands for algal–bacterial AGS, and BAGS stands for bacterial AGS.
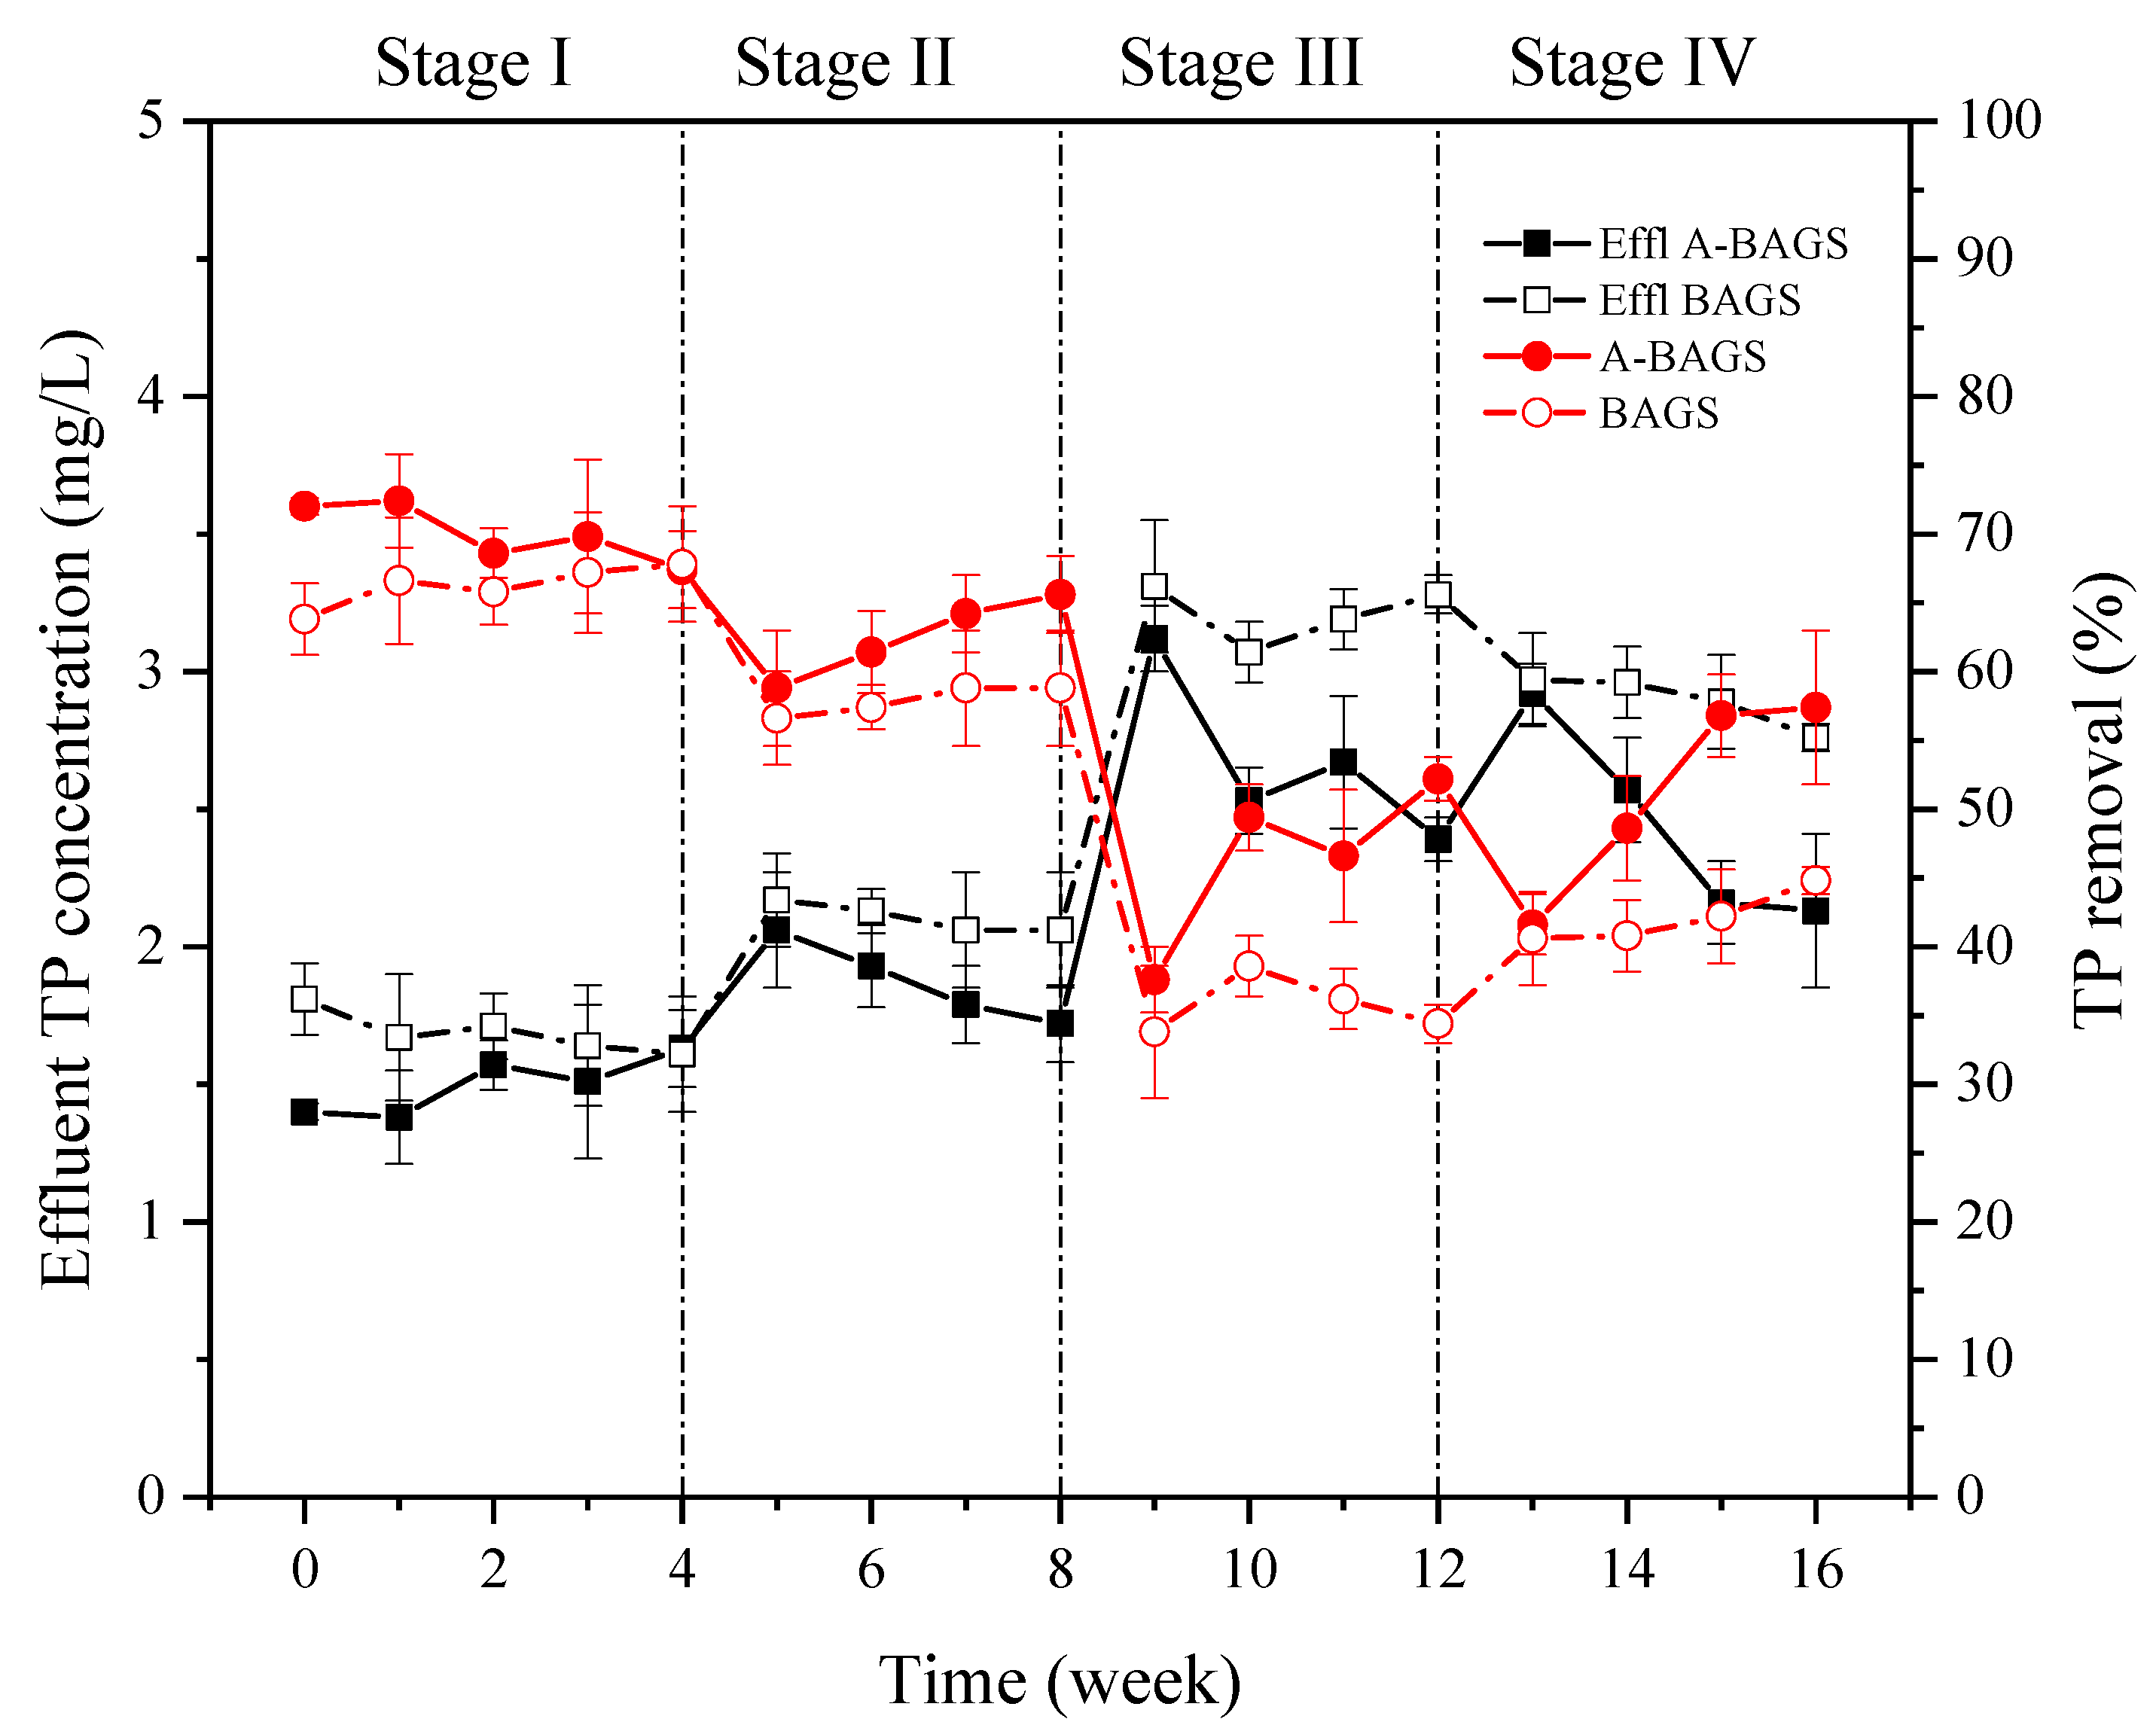
3.4. The Removal of P
The effluent concentration of phosphorus has always been a key concern of WWTPs. In this experiment, as depicted in Figure 6, during Stage I, both systems were able to achieve a stable removal efficiency of TP of about 66%. Although the removal efficiency of the bacterial AGS group was slightly reduced under the addition of 10 mg/L surfactant, the removal efficiency of algal–bacterial AGS and bacterial AGS were maintained at about 57.4 ± 1.6% and 61.4 ± 3.0%, respectively, which showed no significant difference. After entering Stage III, the TP concentration in the effluent of algal–bacterial AGS and bacterial AGS reached 3.12 ± 0.12 mg/L and 3.31 ± 0.24 mg/L, respectively, and the removal efficiency also decreased significantly to 37.6 ± 2.4% and 33.8 ± 4.8% (p < 0.05). However, by the end of Stage III, the removal efficiency of TP in the algal–bacterial AGS group recovered to 52.2 ± 1.6%. On the contrary, the bacterial AGS group only recovered to 34.4 ± 1.4%. Two reactors continued to show this gap in Stage IV until the end of the experiment, indicating that algal–bacterial AGS could maintain adequate phosphorus removal efficiency even in the face of a high surfactant concentration. Many studies have revealed that algal–bacterial AGS is indeed more effective than bacterial AGS in removing phosphorus [11,30,31,32]. Firstly, the particles formed by the coupling of algae and AGS make PAOs better aggregated. Secondly, the oxygen produced by photosynthesis ensures better aerobic phosphorus uptake by PAOs. Besides that, the previous cycle test also confirmed that the P removal efficiency of algal–bacterial AGS is higher than bacterial AGS [17].
Figure 6.
Changes in TP of algal–bacterial AGS and bacterial AGS cultivated at different conditions in the continuous experiment. Stage I, SDS 0 mg/L; Stage II, SDS 10 mg/L; Stage III, SDS 30 mg/L; Stage IV, SDS 0 mg/L; A-BAGS stands for algal–bacterial AGS, and BAGS stands for bacterial AGS.
3.5. The Change in the Specific Oxygen Uptake Rate
As indicated in Table 5, the overall SOUR of the algal–bacterial AGS group was entirely higher than that of the bacterial AGS group throughout the whole experiment. The SOUR value dramatically decreased to 28.5 ± 2.17 mgO2/(gMLVSS·h) under a high surfactant concentration (p < 0.05) and recovered to 32.7 ± 1.15 mgO2/(gMLVSS·h) at the end of the experiment. Compared with the algal–bacterial AGS group, the bacterial AGS group could maintain a relatively stable SOUR value of around 25.8 ± 2.03 when exposed to surfactants. A potential reason for this condition may be that surfactants damage the cell wall of the algae and inhibit the activity of algae [25], thus leading to SOUR values that fluctuate more significantly in the algal–bacterial AGS group.
Table 5.
The changes in SOUR in algal–bacterial AGS and bacterial AGS during the continuous experiment.
3.6. Sodium Dodecyl Sulfate
The SDS value was also detected in the continuous experiment. As shown in Table 6, no obvious disparity was observed between the two groups in the no SDS addition condition. However, when entering Stage III, there was an evident difference between the two groups in the removal efficiencies. The removal rate of the bacterial AGS dropped to 81.9 ± 4.3%, while algal–bacterial AGS maintained a high removal rate of 91.6 ± 6.2%, showing excellent surfactant removal capacity. A possible reason may be that in the event that simple carbon sources are depleted, algal–bacterial AGS takes up and breaks down complex carbon sources to maintain its activities [21].
Table 6.
The changes in the removal efficiency of SDS in algal–bacterial AGS and bacterial AGS during the continuous experiment.
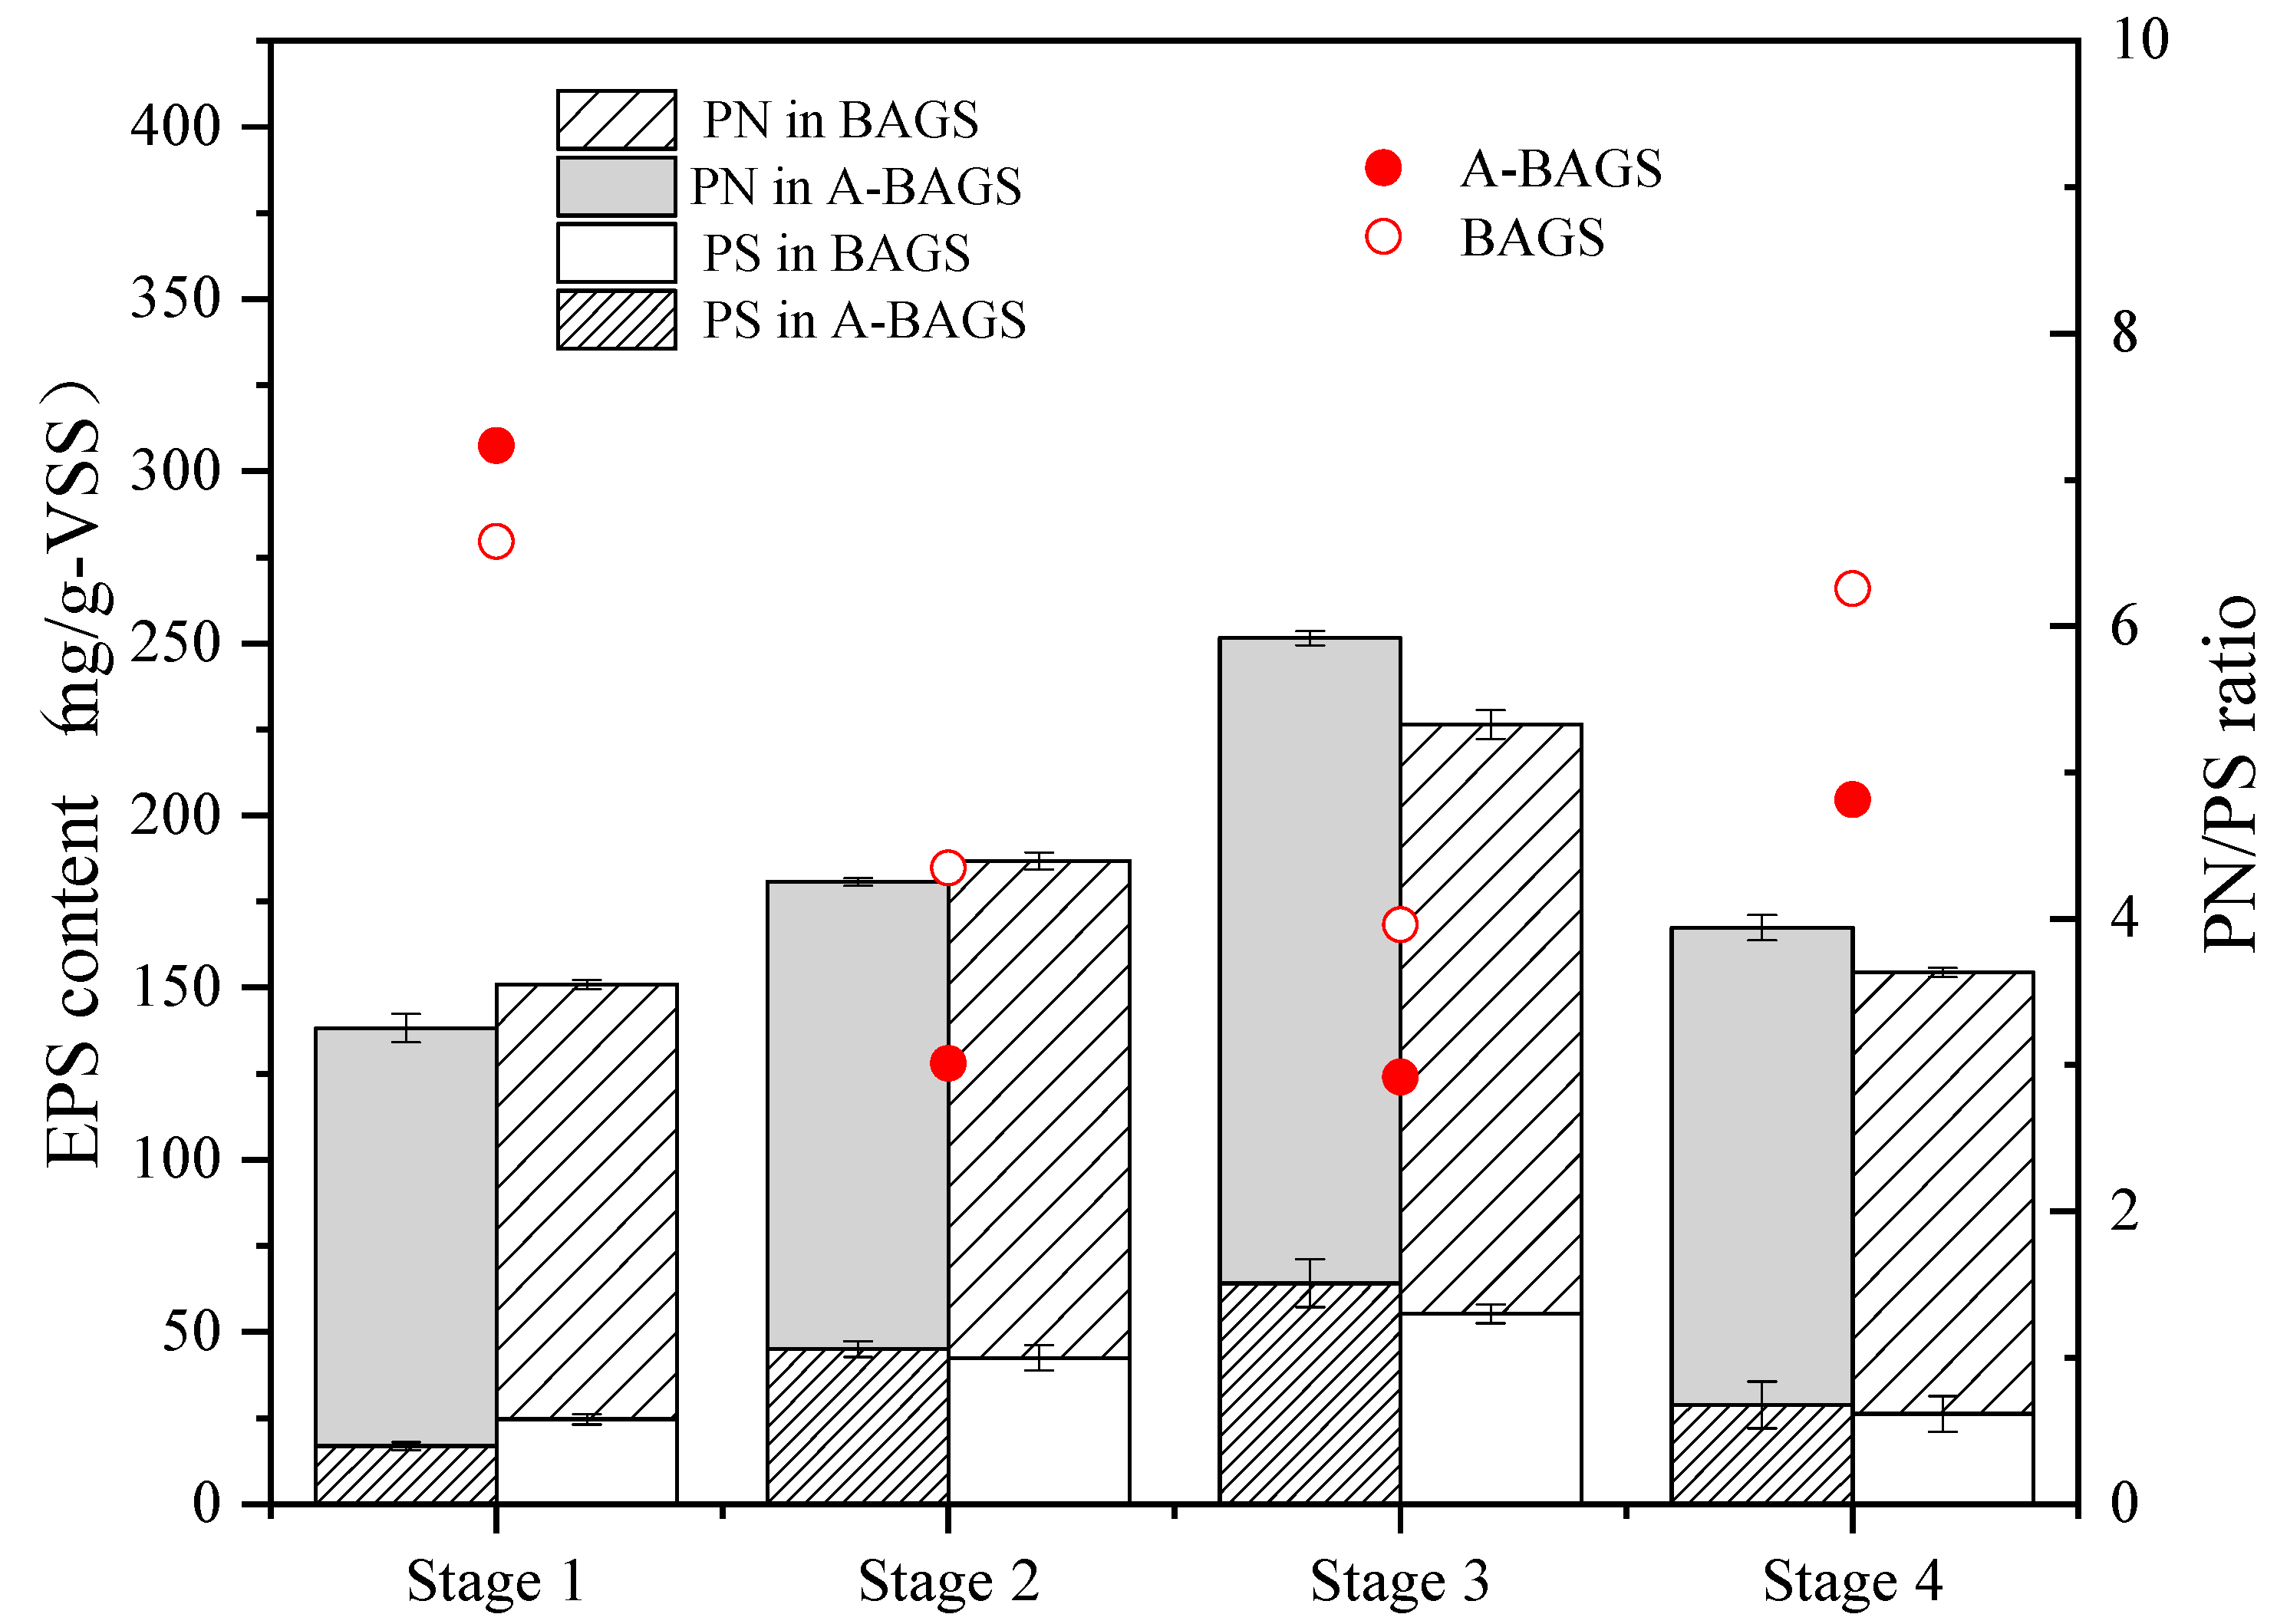
3.7. Analysis of Extracellular Polymeric Substances
Extracellular polymeric substances (EPSs) refer to polymeric substances released by microorganisms, predominantly bacteria, into their external environment under specific environmental conditions. These substances share a similar composition to the intracellular components of microorganisms, comprising polymers such as polysaccharides, proteins, and nucleic acids [11].
As shown in Figure 7, the total EPS of the algal–bacterial AGS and bacterial AGS groups in Stage I were 138.24 ± 5.2 mg/g-VSS and 150.97 ± 3.1 mg/g-VSS, respectively. The algal–bacterial AGS group showed a slightly lower EPS content than the bacterial AGS group, and the PN/PS ratios of the two groups were 7.3 and 6.6, respectively. When adding a low-concentration surfactant, the PS content of both reactors showed a markable increase (p < 0.05). The PS content in the algal–bacterial AGS and bacterial AGS groups increased from 16.79 ± 1.2 mg/g-VSS to 45.04 ± 2.3 mg/g-VSS and from 24.58 ± 1.5 mg/g-VSS to 42.48 ± 3.7 mg/g-VSS, respectively. In addition, the corresponding PN/PS ratios dropped to 3.01 and 4.35, respectively. This phenomenon was similar to a previous study in which algal–bacterial AGS secreted more PS to ensure mass transfer when encountering changes in the external environment [33]. In addition, PS is one of the main factors that can protect the structure of the cell [34]. The upward trend was still maintained in Stage III, where the total EPS content reached 251.53 ± 6.5 mg/g-VSS and 226.44 ± 3.6 mg/g-VSS, respectively. The EPS content of the algal–bacterial AGS group was higher than that of the bacterial AGS group at this stage. In Stage IV, the EPS in algal–bacterial AGS and bacterial AGS progressively reduced to its initial values. In the whole process, PN was the main composition of EPS, which ensures the formation and stability of algal–bacterial AGS [30]. A previous study also proved that a reduction in PS would reduce sludge bulking, and the decline in settleability and the entanglement of filamentous bacteria around the surfaces of the particles may be related to the large amount of PS secreted by algal–bacterial AGS [35]. In addition, algal EPS acts as a nutrient to promote bacterial growth, while bacterial EPS can reduce adverse effects [36]. These points may be the key reason why algal–bacterial AGS has high resilience when facing high-concentration surfactants and maintains stable removal efficiency.
Figure 7.
Changes in EPS of both algal–bacterial AGS and bacterial AGS from continuous reactors. A-BAGS stands for algal–bacterial AGS, and BAGS stands for bacterial AGS.
3.8. Discussion
The results illustrated the excellent performance of algal–bacterial AGS when faced with surfactant-containing wastewater. Regarding nutrient removal, the algal–bacterial AGS system consistently achieved relatively stable DOC removal efficiency throughout the entire experiment. Although the same decline in nitrogen and phosphorus removal efficiency was observed in both systems at the beginning of Stage III, the algal–bacterial AGS system could promptly adapt to sudden changes in the environment and recover to normal processing levels in a short time, which was clearly superior to the bacterial AGS system under the same condition. The PN content may be the main factor for this phenomenon. It should also be noted that in the case of surfactant exposure, a slightly shorter SRT is required to prevent sludge bulking to ensure the stability of the entire algal–bacterial AGS wastewater treatment system. However, this experiment is a laboratory-scale experiment, not a plant-scale experiment, so there are still many limitations in this study. Firstly, the sampling frequency (4 weeks) is based on the set SRT to compare the initial and final state of the algal–bacterial AGS, but the change in the sludges during these 4 weeks should also be explored in later experiments. Secondly, regarding the DOC problem, the DOC concentration of the influent water was relatively stable in this experiment, but the DOC concentration fluctuates a lot in actual WWTPs. Therefore, whether this would affect the treatment effect or not is also a problem that needs to be considered. In addition, the effect of different species of algae on the experimental results also needs further testing. Therefore, more parameters should be considered in next step like the change in the microbial community and the degradation form of SDS.
4. Conclusions
This study first confirmed the feasibility of using algal–bacterial AGS to deal with surfactant-containing wastewater in a continuous test. The results indicated that compared with bacterial AGS, algal–bacterial AGS showed superior treatment efficiency and resilience under high surfactant concentrations (about 90% DOC, 99% ammonia nitrogen, 52% TP). In addition, this experiment also revealed that when exposed to high concentrations of surfactants, algal–bacterial AGS can still maintain a relatively stable structure. The PN content may be the key factor for algal–bacterial AGS to maintain high removal efficiency and stability. The results proved the viability of utilizing algal–bacterial AGS to deal with wastewater containing surfactants; however, further experiments are necessary to explore the deeper mechanism for better performance of algal–bacterial AGS.
Author Contributions
H.W.: conceptualization, data curation, formal analysis, investigation, methodology, and writing—original draft. T.L.: data curation and investigation. X.H.: formal analysis, methodology, supervision, funding acquisition, and writing—review and editing. All authors have read and agreed to the published version of the manuscript.
Funding
This research was financially supported by the Project of Ecological and Environmental Protection Integration Research Institute in the Yangtze River Delta (ZX2023SZY118).
Data Availability Statement
Data are contained within the article.
Conflicts of Interest
The authors declare that they have no known competing financial interests or personal relationships that could have appeared to influence the work reported in this paper.
References
- Hayes, D.G.; Smith, G.A.J.B.S. Biobased surfactants: Overview and industrial state of the art. Biobased Surfactants 2019, 3–38. [Google Scholar] [CrossRef]
- Siyal, A.A.; Shamsuddin, M.R.; Low, A.; Rabat, N.E. A review on recent developments in the adsorption of surfactants from wastewater. J. Environ. Manag. 2020, 254, 109797. [Google Scholar] [CrossRef] [PubMed]
- Moldes, A.B.; Rodriguez-Lopez, L.; Rincon-Fontan, M.; Lopez-Prieto, A.; Vecino, X.; Cruz, J.M. Synthetic and Bio-Derived Surfactants Versus Microbial Biosurfactants in the Cosmetic Industry: An Overview. Int. J. Mol. Sci. 2021, 22, 2371. [Google Scholar] [CrossRef] [PubMed]
- Hao, X.; Yang, Z.; Li, J. Effects and associated mechanisms of surfactants on wastewater treatment in the context of COVID-19. Chin. J. Chem. Eng. 2021, 15, 1831–1839. [Google Scholar]
- Pradhan, A.; Bhattacharyya, A. Quest for an eco-friendly alternative surfactant: Surface and foam characteristics of natural surfactants. J. Clean. Prod. 2017, 150, 127–134. [Google Scholar] [CrossRef]
- Liang, Q.; Liu, X.; Zeng, G.; Liu, Z.; Tang, L.; Shao, B.; Zeng, Z.; Zhang, W.; Liu, Y.; Cheng, M.; et al. Surfactant-assisted synthesis of photocatalysts: Mechanism, synthesis, recent advances and environmental application. Chem. Eng. J. 2019, 372, 429–451. [Google Scholar] [CrossRef]
- Zhang, Y.; Zhang, T. Culturing the uncultured microbial majority in activated sludge: A critical review. Crit. Rev. Environ. Sci. Technol. 2023, 53, 601–624. [Google Scholar] [CrossRef]
- Xu, Q.; Huang, Q.; Wei, W.; Sun, J.; Dai, X.; Ni, B. Improving the treatment of waste activated sludge using calcium peroxide. Water Res. 2020, 187, 116440. [Google Scholar] [CrossRef]
- Sharmila, V.G.; Kumar, G.; Sivashanmugham, P.; Piechota, G.; Park, J.H.; Kumar, S.A.; Banu, J.R. Phase separated pretreatment strategies for enhanced waste activated sludge disintegration in anaerobic digestion: An outlook and recent trends. Bioresour. Technol. 2022, 363, 127985. [Google Scholar]
- Wang, J.; Nguyen, A.V.; Farrokhpay, S. Foamability of sodium dodecyl sulfate solutions: Anomalous effect of dodecanol unexplained by conventional theories. Colloids Surf. A Physicochem. Eng. Asp. 2016, 495, 110–117. [Google Scholar] [CrossRef]
- Zhang, Y.; Dong, X.; Liu, S.; Lei, Z.; Shimizu, K.; Zhang, Z.; Adachi, Y.; Lee, D.-J. Rapid establishment and stable performance of a new algal-bacterial granule system from conventional bacterial aerobic granular sludge and preliminary analysis of mechanisms involved. J. Water Process. Eng. 2020, 34, 101073. [Google Scholar] [CrossRef]
- Ahmad, J.S.M.; Cai, W.; Zhao, Z.; Zhang, Z.; Shimizu, K.; Lei, Z.; Lee, D.-J. Stability of algal-bacterial granules in continuous-flow reactors to treat varying strength domestic wastewater. Bioresour. Technol. 2017, 244, 225–233. [Google Scholar] [CrossRef] [PubMed]
- Wang, J.; Lei, Z.; Wei, Y.; Wang, Q.; Tian, C.; Shimizu, K.; Zhang, Z.; Adachi, Y.; Lee, D.-J. Behavior of algal-bacterial granular sludge in a novel closed photo-sequencing batch reactor under no external O-2 supply. Bioresour. Technol. 2020, 318, 124190. [Google Scholar] [CrossRef] [PubMed]
- Huang, S.; Zhang, B.; Liu, Y.; Feng, X.; Shi, W. Revealing the influencing mechanisms of polystyrene microplastics (MPs) on the performance and stability of the algal-bacterial granular sludge. Bioresour. Technol. 2022, 354, 127202. [Google Scholar] [CrossRef] [PubMed]
- Liu, W.; Huang, W.; Cao, Z.; Ji, Y.; Liu, D.; Huang, W.; Zhu, Y.; Lei, Z. Microalgae simultaneously promote antibiotic removal and antibiotic resistance genes/bacteria attenuation in algal-bacterial granular sludge system. J. Hazard. Mater. 2022, 438, 129286. [Google Scholar] [CrossRef]
- Dong, X.; Zhao, Z.; Yang, X.; Lei, Z.; Shimizu, K.; Zhang, Z.; Lee, D.-J. Response and recovery of mature algal-bacterial aerobic granular sludge to sudden salinity disturbance in influent wastewater: Granule characteristics and nutrients removal/accumulation. Bioresour. Technol. 2021, 321, 124492. [Google Scholar] [CrossRef] [PubMed]
- Wang, H.; Liu, T.; Ding, Y.; Wang, Z.; Zhang, Z.; Lei, Z.; Shimizu, K.; Yuan, T. Enhanced performance of algal-bacterial aerobic granular sludge in comparison to bacterial aerobic granular sludge for treating surfactant-containing wastewater. Bioresour. Technol. Rep. 2023, 22, 101462. [Google Scholar] [CrossRef]
- APHA. Standard Methods for the Examination of Water and Wastewater; National Government Publication: Washington, DC, USA, 2007. [Google Scholar]
- Capodici, M.; Corsino, S.F.; Torregrossa, M.; Viviani, G. Shortcut nitrification-denitrification by means of autochthonous halophilic biomass in an SBR treating fish-canning wastewater. J. Environ. Manag. 2018, 208, 142–148. [Google Scholar] [CrossRef]
- Kwon, G.; Kim, H.; Song, C.; Jahng, D. Co-culture of microalgae and enriched nitrifying bacteria for energy-efficient nitrification. Biochem. Eng. J. 2019, 152, 107385. [Google Scholar] [CrossRef]
- Ji, B.; Shi, Y.; Yilmaz, M. Microalgal-bacterial granular sludge process for sustainable municipal wastewater treatment: Simple organics versus complex organics. J. Water Process. Eng. 2022, 46, 102613. [Google Scholar] [CrossRef]
- Wang, L.; Huang, B.; Wang, L.; Min, Y.; Yu, H. Experimental and theoretical analyses on the impacts of ionic surfactants on sludge properties. Sci. Total Environ. 2018, 633, 198–205. [Google Scholar] [CrossRef] [PubMed]
- Campbell, K.; Wang, J. New insights into the effect of surfactants on oxygen mass transfer in activated sludge process. J. Environ. Chem. Eng. 2020, 8, 104409. [Google Scholar] [CrossRef]
- Wang, S.; Ji, B.; Zhang, M.; Gu, J.; Ma, Y.; Liu, Y. Tetracycline-induced decoupling of symbiosis in microalgal-bacterial granular sludge. Environ. Res. 2021, 197, 111095. [Google Scholar] [CrossRef] [PubMed]
- de Carvalho, R.C.; Feijao, E.; Matos, A.R.; Cabrita, M.T.; Utkin, A.B.; Novais, S.C.; Lemos, M.F.L.; Caçador, I.; Marques, J.C.; Reis-Santos, P.; et al. Ecotoxicological effects of the anionic surfactant Sodium Dodecyl Sulfate (SDS) in two marine primary producers: Phaeodactylum tricornutum and ulva lactuca. Toxics 2022, 10, 780. [Google Scholar] [CrossRef] [PubMed]
- Agbebi, T.V.; Ojo, E.O.; Watson, I.A. Towards optimal inorganic carbon delivery to microalgae culture. Algal Res.-Biomass Biofuels Bioprod. 2022, 67, 102841. [Google Scholar] [CrossRef]
- Zhao, Z.; Liu, S.; Yang, X.; Lei, Z.; Shimizu, K.; Zhang, Z.; Lee, D.-J.; Adachi, Y. Stability and performance of algal-bacterial granular sludge in shaking photo-sequencing batch reactors with special focus on phosphorus accumulation. Bioresour. Technol. 2019, 280, 497–501. [Google Scholar] [CrossRef] [PubMed]
- Cao, J.; Chen, F.; Fang, Z.; Gu, Y.; Wang, H.; Lu, J.; Bi, Y.; Wang, S.; Huang, W.; Meng, F. Effect of filamentous algae in a microalgal-bacterial granular sludge system treating saline wastewater: Assessing stability, lipid production and nutrients removal. Bioresour. Technol. 2022, 354, 127182. [Google Scholar] [CrossRef] [PubMed]
- Li, B.; Huang, W.; Zhang, C.; Feng, S.; Zhang, Z.; Lei, Z.; Sugiura, N. Effect of TiO2 nanoparticles on aerobic granulation of algal-bacterial symbiosis system and nutrients removal from synthetic wastewater. Bioresour. Technol. 2015, 187, 214–220. [Google Scholar] [CrossRef]
- Xiong, W.; Wang, S.; Jin, Y.; Wu, Z.; Liu, D.; Su, H. Insights into nitrogen and phosphorus metabolic mechanisms of algal-bacterial aerobic granular sludge via metagenomics: Performance, microbial community and functional genes. Bioresour. Technol. 2023, 369, 128442. [Google Scholar] [CrossRef]
- Li, Z.; Wang, J.; Liu, J.; Chen, X.; Lei, Z.; Yuan, T.; Shimizu, K.; Zhang, Z.; Lee, D.-J.; Lin, Y.J.W.R. Highly efficient carbon assimilation and nitrogen/phosphorus removal facilitated by photosynthetic O2 from algal-bacterial aerobic granular sludge under controlled DO/pH operation. Water Res 2023, 238, 120025. [Google Scholar] [CrossRef]
- Cai, W.; Hu, P.; Li, Z.; Kang, Q.; Chen, H.; Zhang, J.; Zhu, S. Effect of high ammonia on granular stability and phosphorus recovery of algal-bacterial granules in treatment of synthetic biogas slurry. Heliyon 2022, 8, e09844. [Google Scholar] [CrossRef] [PubMed]
- He, Q.; Wang, H.; Chen, L.; Gao, S.; Zhang, W.; Song, J.; Yu, J. Elevated salinity deteriorated enhanced biological phosphorus removal in an aerobic granular sludge sequencing batch reactor performing simultaneous nitrification, denitrification and phosphorus removal. J. Hazard. Mater. 2020, 390, 121782. [Google Scholar] [CrossRef] [PubMed]
- Li, J.; Ye, W.; Wei, D.; Ngo, H.H.; Guo, W.; Qiao, Y.; Xu, W.; Du, B.; Wei, Q. System performance and microbial community succession in a partial nitrification biofilm reactor in response to salinity stress. Bioresour. Technol. 2018, 270, 512–518. [Google Scholar] [CrossRef] [PubMed]
- Si, G.; Liu, B.; Liu, Y.; Yan, T.; Wei, D. Light-introduced partial nitrification in an algal-bacterial granular sludge bioreactor: Performance evolution and microbial community shift. Bioresour. Technol. 2022, 354, 127226. [Google Scholar] [CrossRef]
- Hou, H.; Wang, S.; Ji, B.; Zhang, Y.; Pi, K.; Shi, Y. Adaptation responses of microalgal-bacterial granular sludge to polystyrene microplastic particles in municipal wastewater. Environ. Sci. Pollut. Res. 2022, 29, 59965–59973. [Google Scholar] [CrossRef]
Disclaimer/Publisher’s Note: The statements, opinions and data contained in all publications are solely those of the individual author(s) and contributor(s) and not of MDPI and/or the editor(s). MDPI and/or the editor(s) disclaim responsibility for any injury to people or property resulting from any ideas, methods, instructions or products referred to in the content. |
© 2024 by the authors. Licensee MDPI, Basel, Switzerland. This article is an open access article distributed under the terms and conditions of the Creative Commons Attribution (CC BY) license (https://creativecommons.org/licenses/by/4.0/).