1. Introduction
Ships are moored using a mooring system consisting of mooring cables connected to anchor points on land. As a key part of the ship’s mooring process, it is important to consider that there are many reasons why a ship’s mooring cables may break in service [
1,
2,
3]. Due to the influence of wind, waves, and currents when the ship is moored, the ship’s cable is in the process of dynamic force change [
4], and when the cable is subjected to a weight exceeding its rated load capacity, it will be subjected to excessive stress, resulting in breakage [
5]. In 2018, the Guidelines for Mooring Equipment also clearly stated that the rupture of a ship’s cable poses a great threat to the safety of personnel in the mooring area and that appropriate measures should be taken to minimise the hidden dangers [
6,
7,
8]. For this reason, reducing the risk of cable rupture accidents in complex mooring conditions has become a major safety issue that needs to be urgently addressed in port operations [
9,
10,
11].
Ship cables can be categorised according to their function as first, first transverse, first inverted, stern, stern transverse, and stern inverted, and each functional group of cables is composed of several mooring cables [
12]. If one cable breaks, it also means that the other cables are unevenly loaded, and if they are overloaded, they will break one by one, which can lead to catastrophic accidents such as the ship running out of control and crashing into the pier or other ships. In this respect, the most durable and effective solution is to monitor the tension value of the ship’s cable in real-time and provide a timely warning, and there are the following major methods regarding the measurement of bollard pull: (1) the direct measurement method [
13,
14,
15,
16,
17]; (2) the indirect measurement method [
18,
19,
20,
21,
22]; (3) the mechanical formula calculation method [
23,
24,
25,
26]. However, the shortcomings of these three methods are very obvious. Method (1) is mainly effective in the laboratory stage, but the actual usage environment is complex and difficult to put into production. Method (2) mainly relies on strain gauges and cable release hooks. Strain gauges are difficult to solve the stress on a single cable, and cable release hooks are difficult to modify in existing docks. Method (3) relies on too many environmental parameters and has low accuracy in numerical and analogue calculations. The application in real environments is not accurate and convenient enough.
Considering the limitations of existing methods in practical applications, an experimental study on the measurement of ship bollard force by the vibration frequency method is carried out with reference to the calculation method of measuring the cable force of a diagonal cable. We have built a large-scale tension structure test platform based on commonly used mooring cables and analysed the impact of using the vibration frequency method to measure the accuracy of ship cable tension under different data collection positions, excitation methods, excitation positions, temperatures, and rainfall environments. Moreover, we also analysed the comprehensive error results and added correction coefficients to improve accuracy. The results of this study can improve the accuracy of ship cable force monitoring, ensure ship mooring safety, and promote the efficient and safe operation of ports.
2. Methods
The types of mooring cables can be roughly divided into three types: steel wire ropes, high modulus synthetic fibre ropes (HMSF), and conventional fibre ropes. The assumptions that are usually made when deriving the formulae for diagonal cables with reference to the tensioned string model [
27] are as follows: (1) the cable is ideally flexible and cannot be compressed or bent; (2) the cable is not influenced by its own weight; (3) the cable is free to vibrate without damping after re-tensioning; (4) the cable vibrates with a very small amplitude; (5) the material of the cable obeys Hooke’s law and is a homogeneous isotropic body. Ship cables have less stiffness and density than zip lines, and the actual conditions during mooring operations are closer to the above assumptions. Therefore, the formula for measuring the bollard force by the vibration frequency method can be derived by analogy with the formula for the tension wire model.
Assuming that the cable vibrates along the vertical axis at any point, the microelement arc is taken to be analysed. When the cable vibrates with a small amplitude along the direction of speed, the deformation caused by bending is taken into account, the deformation caused by shearing is excluded, as is the influence of rotational inertia, and there are tensile forces, bending moments, and external disturbance forces acting on the microelements of the cable (taking into account the gravity of the cable). The forces acting on the cable microelement dx are shown in
Figure 1.
Based on the above assumptions, when the cable vibrates near the ideal line equilibrium, the angle
θ is very small, and the equation of motion of the cable at
t is the following equation of motion [
28]:
where
T is the bollard force,
Q is the shear force,
q is the distribution force acting on the cable,
u is the microelement segment of the cable, and
ρ is the linear density of the cable.
The moment balance equation at the point (
x + d
x) is as follows:
where
EI is the cable stiffness, and according to the assumption of the tendon model,
EI can be neglected, and finally, the formula for the bollard force is obtained:
In Equation (3), L is the length of the cable, fn is the thickness of the cable, n is the natural frequency of the cable, ρ is the linear density of the cable, and n is the order of the natural frequency.
By the harmonic properties of string vibration, the tensioned string free vibration will be analysed in addition to the fundamental frequency of other frequencies, and the fundamental frequency is an integer multiple of the relationship. According to Formula (3), the known first-order self-oscillation frequency
f1 (or fundamental frequency) can simplify the formula to find the cable force
F. That is,
3. Pilot Program
The sensor cannot be arranged in the ideal location for use in the dock. It can only be installed in the vicinity of the bollards, and the excitation position can only act in the vicinity of the bollards. Uninterrupted artificial excitation during actual operation is not realistic, and environmental excitation is not stable. The humidity and temperature of the port’s natural environment will change throughout the year. This paper simulates the actual application environment for experimental research by considering several factors, such as data acquisition position, excitation mode, excitation position, cable wetting, and different temperatures. The relative error rate between the results and the calculated values is analysed to prove the feasibility of the vibration frequency method for measuring the bollard force.
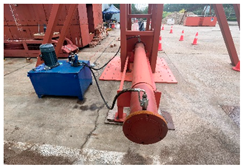
According to the special characteristics of marine cable materials, the following four principles should be observed when designing the tensioning device: (1) considering the large length expansion and contraction when the cable is under tension, the length of the whole structure can be adjusted, or the stroke that can be used for tensioning should be as large as possible; (2) the controllability of the tensioning process is good, and the stability is good; (3) the safety coefficient of the whole structure is high; (4) it is necessary to have enough tensioning force to satisfy the simulation of an actual tensioning situation.
Figure 2 shows the schematic diagram of the design model of the prestressing device.
Table 1 below shows the parameters of the tensioning device equipment and specifications.
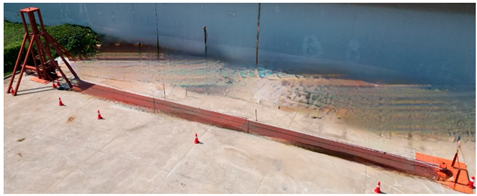
Given the loose structure of the new ship’s cable, a tensioning device was used to initially tension the cable prior to testing, and the cable was held for 12 h before being coiled and fixed to start the normal test process. Starting from the centre of the bollard, an acceleration sensor is placed every 3 m, and the excitation position is selected at 1 m from the acceleration sensor, the acceleration sensor and the excitation node close to the bollard are numbered 1, and the central position is numbered 5, and the test layout model is shown in
Figure 2.
The maximum loading force for the test,
Fmax, is determined by taking 55% of the maximum loading force of the loading force device, which is 750 kN. Therefore,
Fmax = 75% × 0.55 × 750 kN = 412.5 kN. The value displayed by the tensiometer should be recorded as the directly measured value. The value calculated using the vibration frequency method is denoted as
T. The absolute error of the test is recorded as Δ, where Δ =
T −
F. The relative error rate of the test is recorded as
μ. Formula (5) is the error rate formula, which analyses the size of the error rate to predict the accuracy of the vibration base frequency method for testing cable force.
where
μ represents the relative error rate of the test, ∆ represents the absolute error of the test,
F represents the measured value of the force transducer, and
T represents the calculated value of the cable tension.
4. Results and Discussion
4.1. Data Collection Location
Based on the theory of vibration, the maximum amplitude of the first vibration mode of a string is located at the centre of the string. As we move towards the end of the string, the amplitude decreases. Similarly, the maximum amplitude of the second vibration mode is located at 6/
l, 3
l/6, 5
l/6, etc. [
29]. In actual working conditions, it is often challenging to position the acceleration sensor at the cable’s centre. As a result, the measurement point is typically selected near the bollard. The dynamic stiffness of the cable increases as the measurement point moves closer to the cable’s ends, compared to the midpoint. The measured cable’s dynamic response is mainly influenced by its higher-order vibration mode, limiting the first-order vibration energy. As a result, the frequencies corresponding to the wave peaks in the spectrograms of the measured acceleration data processing results may not be the first-order fundamental frequency of the cable but rather one or more higher-order frequencies. The wave peaks do not satisfy the octave-frequency relation Equation: ∆
f =
f1 =
f2 −
f1 =
f3 −
f2 = …
This subsection presents an experimental study conducted at various data collection locations to compare the relative error rates of eight different node locations. The analysis results are shown in
Figure 3. For location 1 near the bollard and location 5 in the centre, the difference in error rates is minimal when the loading force is between 0 kN and 200 kN. However, the error rate at location 1 varies more when the loading force is between 200 kN and 400 kN. The error range at position 1 near the bollard is between −2.81% and 3.76%, while the error range at central position 5 is between −4.16% and 0.96%. It can be concluded that, when compared to position 5, the acceleration sensor is placed closer to the bollard at position 1. This results in a negligible increase in the range of error rate, which still meets practical application conditions.
4.2. Incentive Approach
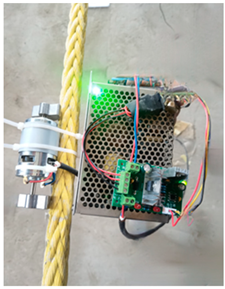
There are two conventional methods for measuring bollard force using the vibration frequency method: environmental excitation and manual excitation. The marine weather environment constantly transforms the cable’s dynamic force, making it less reliable than environmental excitation. However, acquiring enough vibration data points during the steady state value acquisition process of the bollard force can be challenging in practice. It is difficult to ensure that the data acquisition process is stable, and an acquisition time that is too long does not meet the real-time monitoring of the bollard force. Artificial excitation can produce an instantaneous impulse response. In the taut cable state, the signal can be collected through attenuation, and the final value of the bollard force can be analysed. This method can shorten the sampling time to achieve real-time monitoring. However, it is not always practical to use artificial excitation. In summary, this paper proposes an innovative eccentric device that can be installed on a ship’s cable to achieve pulse excitation through self-oscillation, known as device excitation.
Table 2 below summarizes the specific implementation of the three excitation methods and compares their effectiveness.
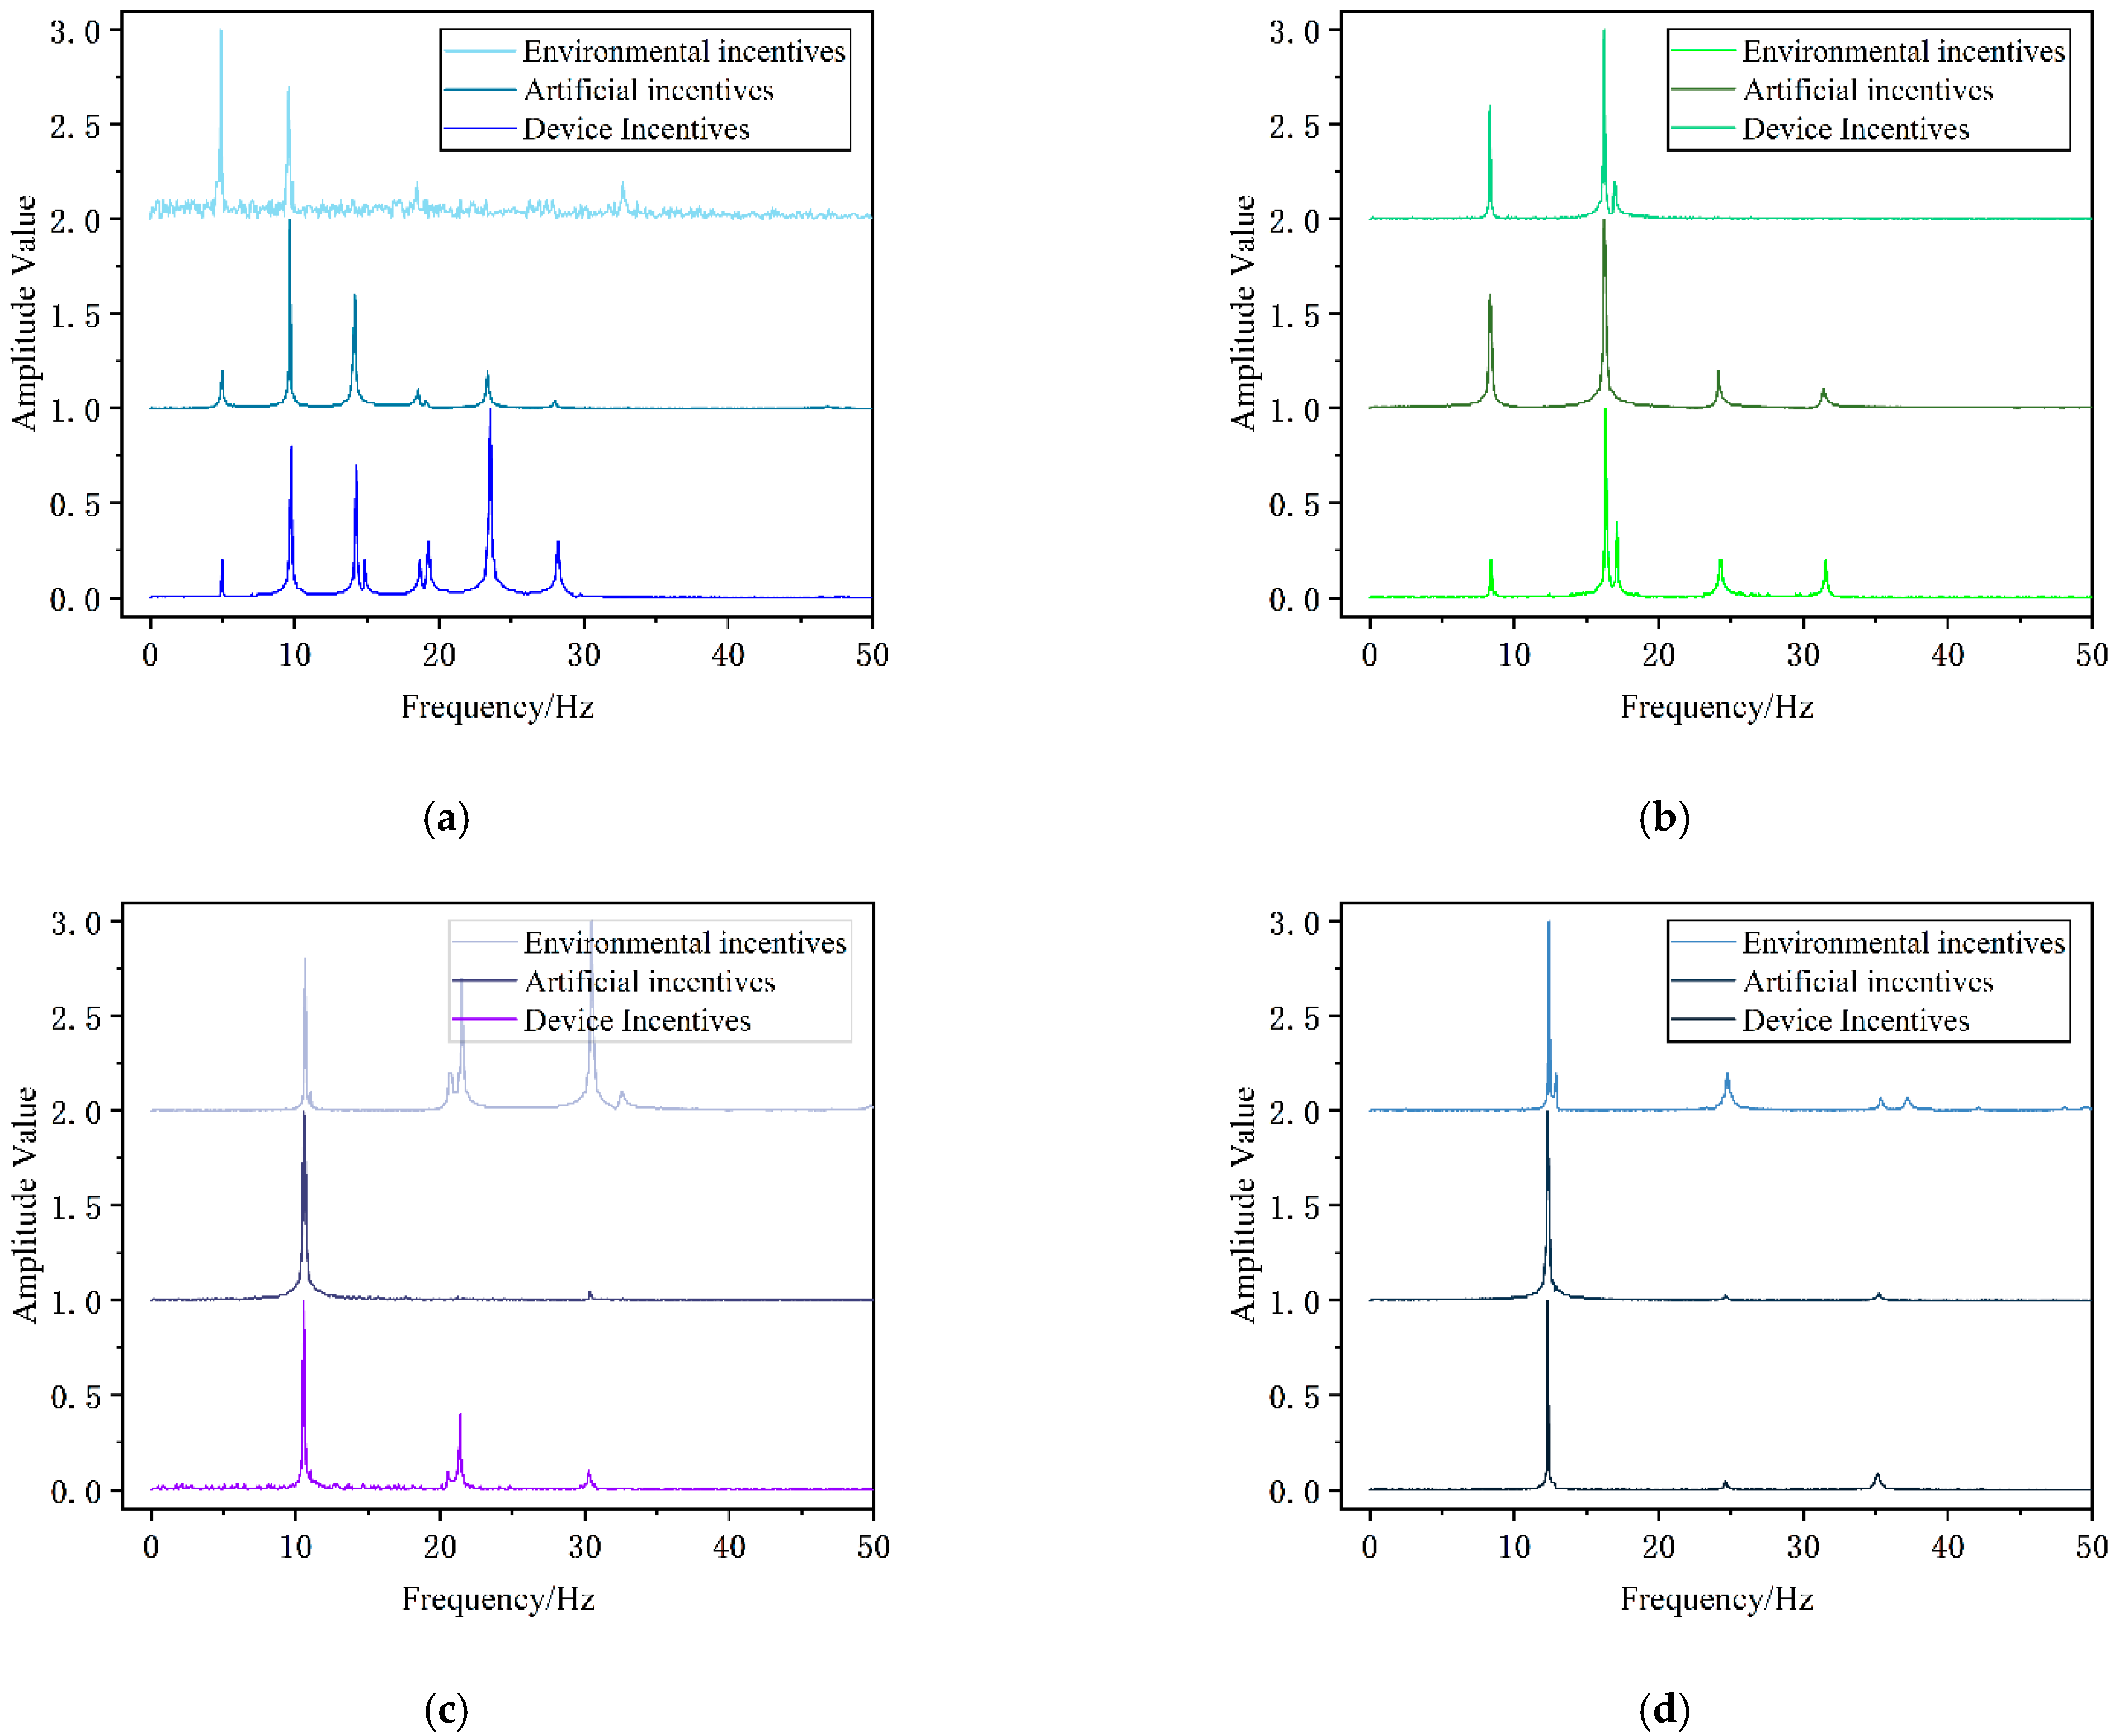
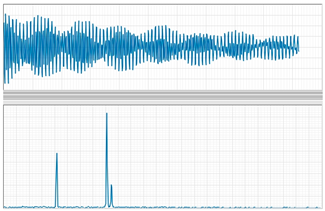
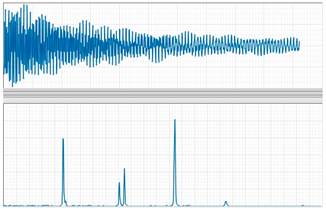
When comparing the excitation effects produced by the three methods, it is evident that device excitation produces a signal with greater energy and captures the complete decay signal during acquisition. The experimental comparison in
Figure 4 shows that, under the same sampling time and frequency, the signal under environmental excitation produces excessive noise near the resonance peak. This noise inevitably leads to errors in the process of identifying the fundamental frequency. The use of artificial excitation can result in cleaner main and resonance peaks, but it may also lead to differences in the order of resonance peak identification or skipping due to the instability of the strength and position of each excitation. In comparison to environmental and manual excitation, device excitation reduces noise near the main and resonance peaks without affecting the corresponding frequency values of each peak. In summary, the device’s excitation can achieve the same effect as the two excitation methods without affecting the calculated values. This is more in line with the actual conditions of use.
4.3. Stimulus Position
According to string vibration theory, the position of the string where the amplitude of the fundamental frequency is the largest is at string 1/2. Therefore, exciting the central position will identify the fundamental frequency more accurately. In ideal conditions, different excitation positions will not change the frequency value corresponding to the peak value of each vibration mode of the cable. However, under actual conditions, the tensioned cable may have varying stiffness at different locations. This can result in uneven distribution of line density, which in turn affects the accuracy of recognising the fundamental frequency of the cable. This subsection compares the difference and relative error rates between the spectral analysis at position 1 and position 5 for different excitation positions. The test method employed is the single-point response and multi-point excitation step-by-step point shift method. The acceleration sensor is positioned at node 1 to stimulate nodes 1–8 sequentially, in order to obtain data acquisition results at that position under eight different stimulation positions. Similarly, at position 5, analogous tests are conducted. It is important to note that the cable will exhibit different vibration characteristics under different tensions. Therefore, when comparing spectral analysis of the same data acquisition position under different excitation positions, the tension should be kept as consistent as possible.
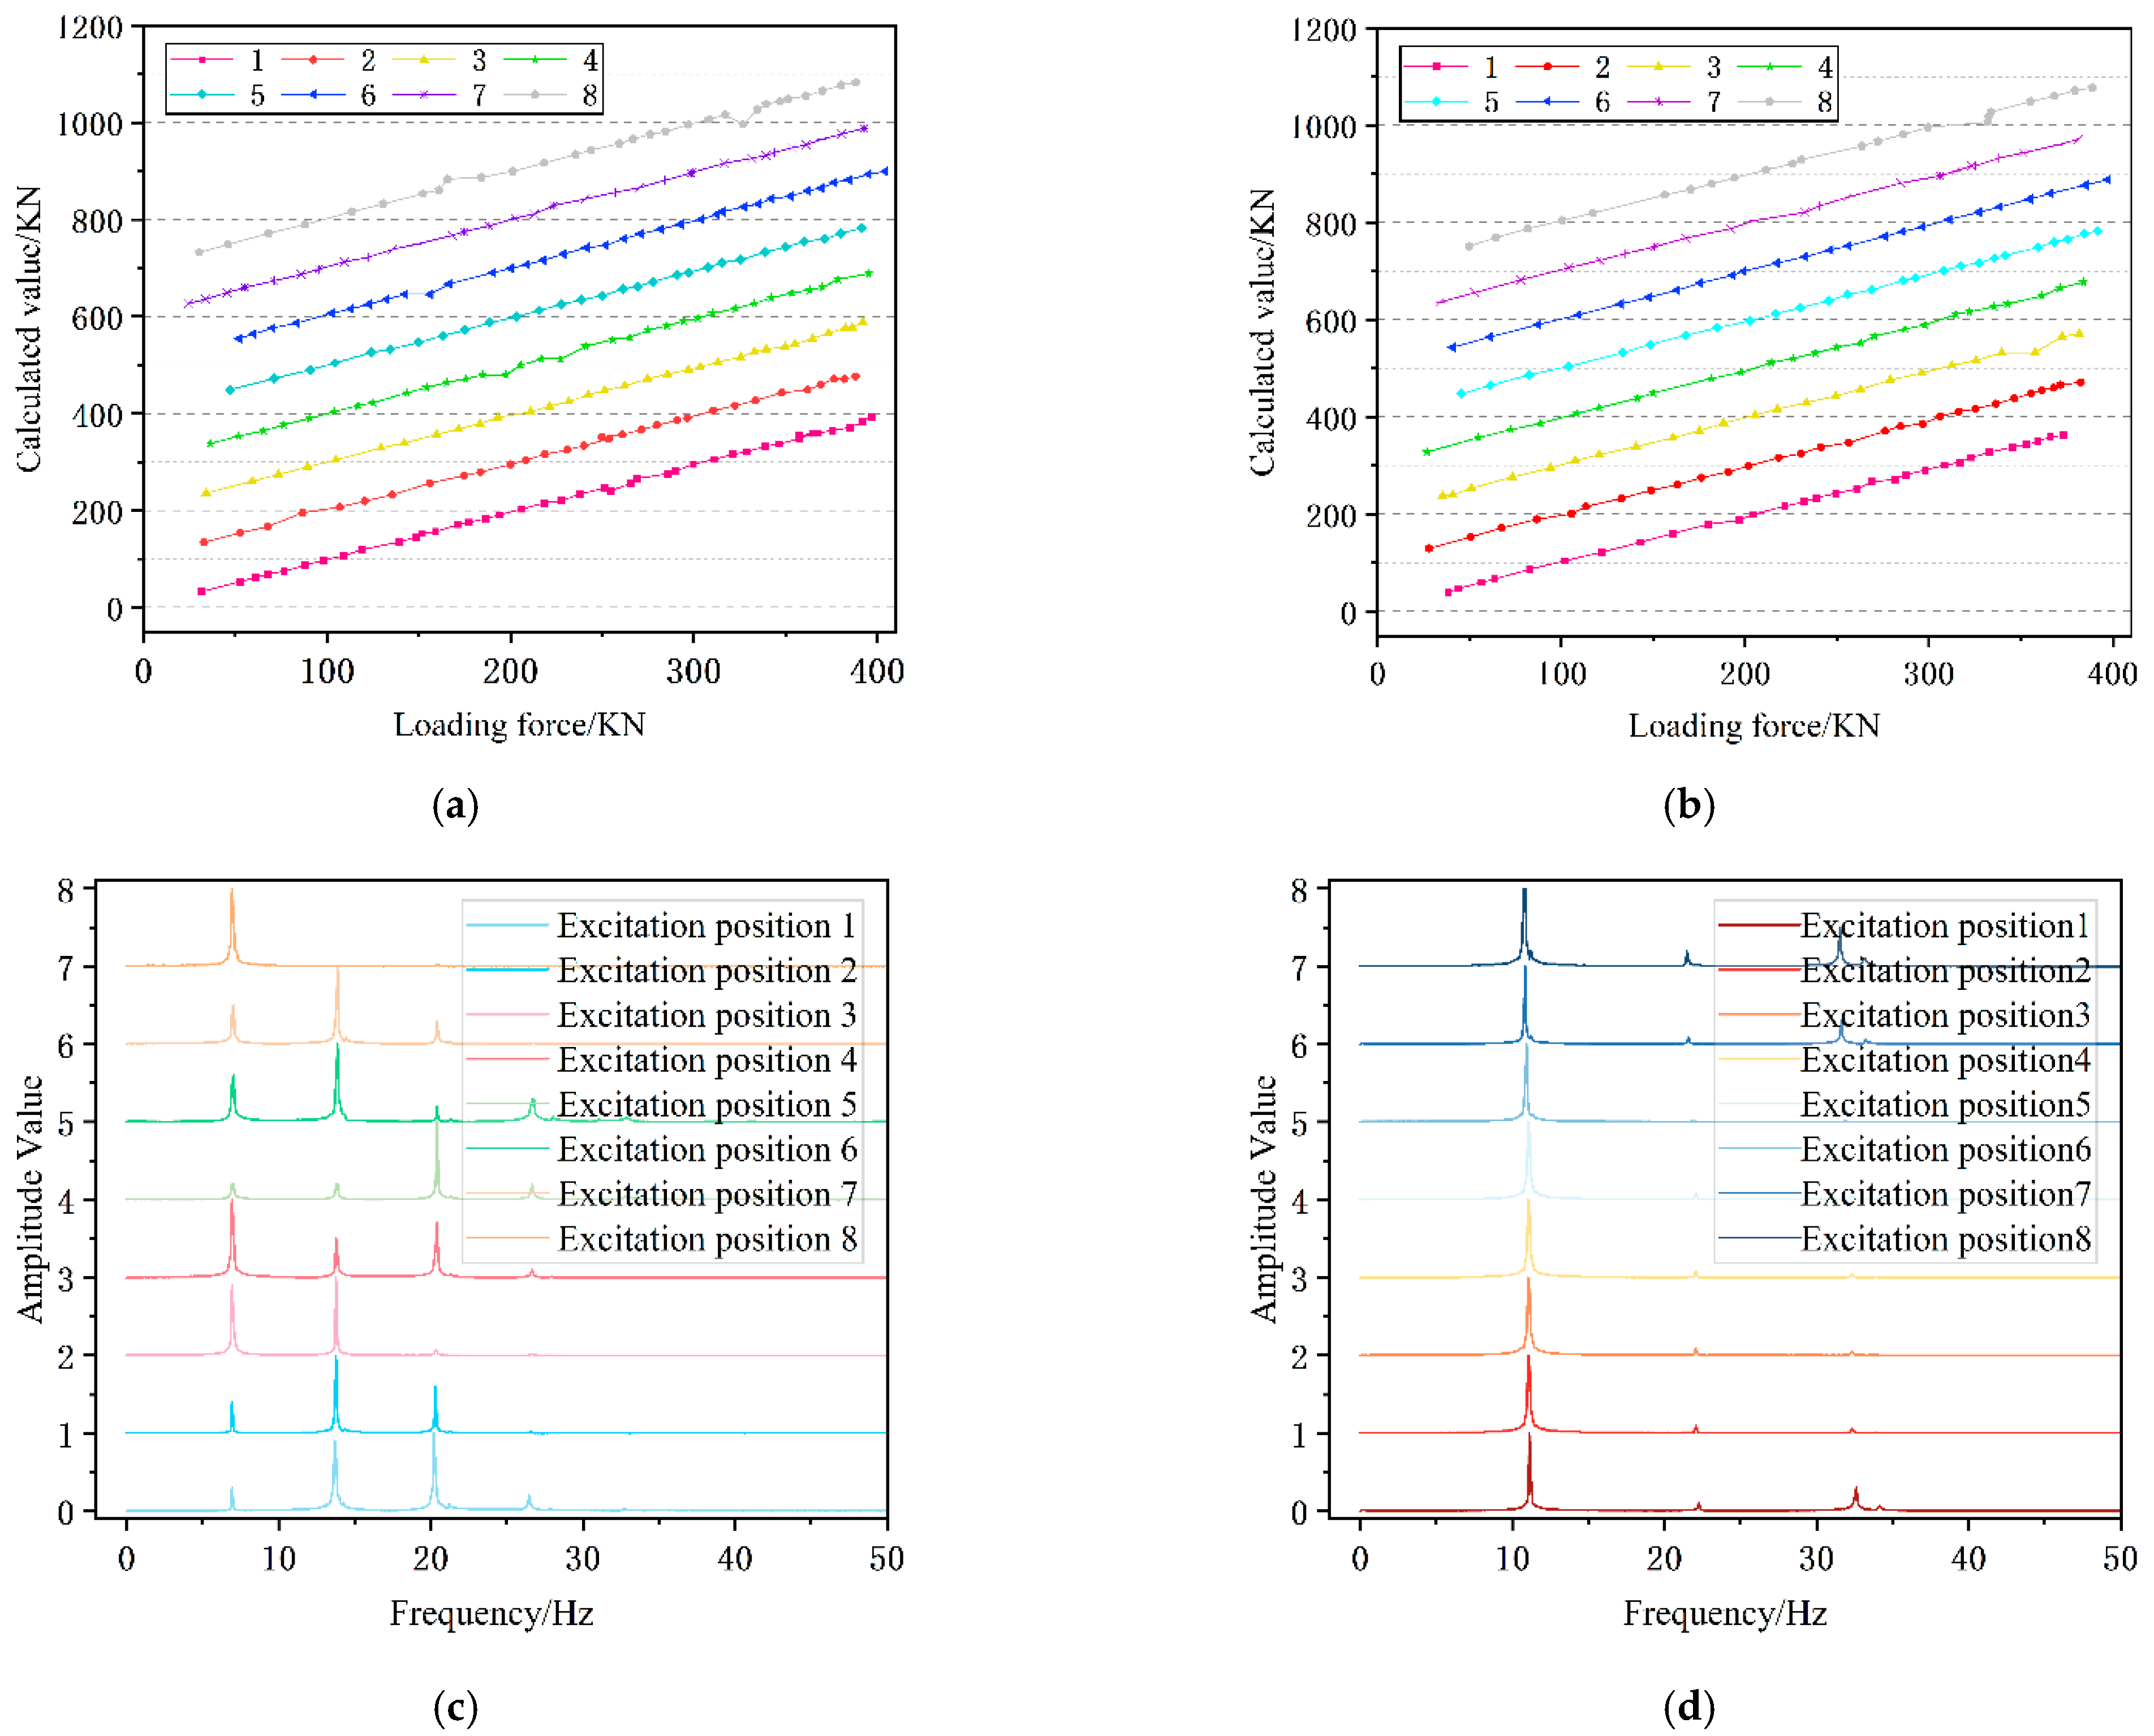
Figure 5 shows the results of the test analysis.
Figure 5a displays the test error analysis plot at position 1, while
Figure 5b shows the test error analysis plot at position 5.
Figure 5c illustrates the spectrum analysis plot at position 1, and
Figure 5d depicts the spectrum analysis plot at position 5.
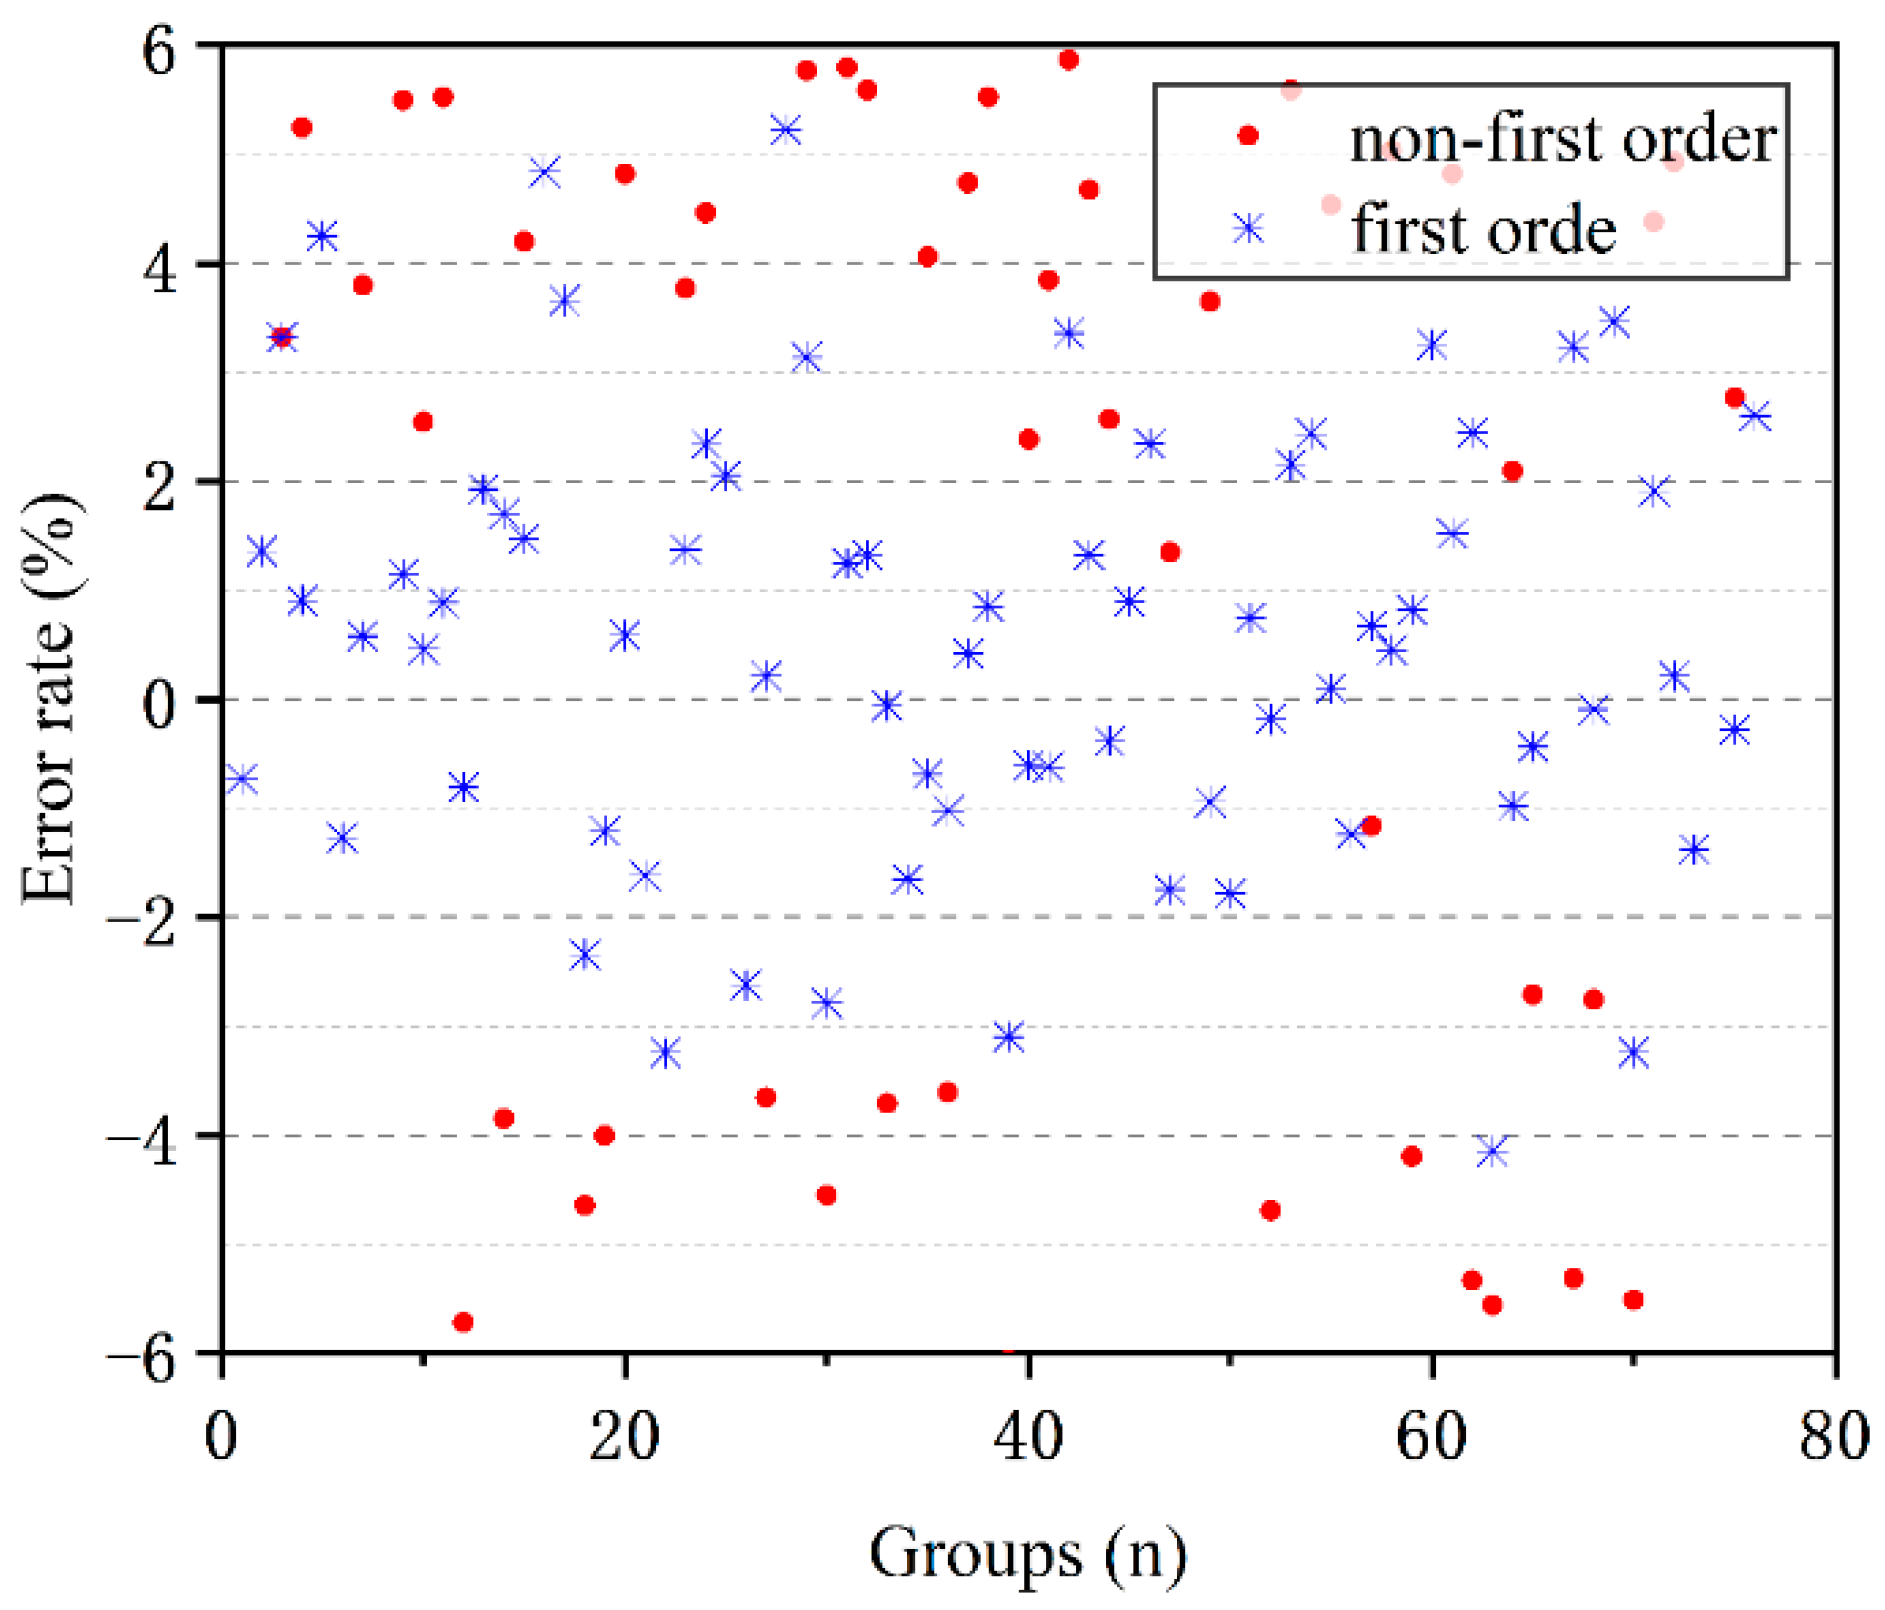
It is evident that the excitation position does not affect the spectral analysis results of each peak value corresponding to the frequency value under the same sheet pulling conditions. However, it does affect the corresponding main peak value and resonance peak value for each order. The calculation formula for bollard force takes into account the fundamental frequency, which is the main and resonance peak value. To ensure accuracy, a comparison analysis was conducted, and the error rate was calculated. The results are presented in
Figure 6. Technical abbreviations are explained upon first use. The language used is clear, objective, and value-neutral, with a formal register and precise word choice. The text is grammatically correct and free from errors. No changes in content were made. The bollard force can be measured by using the vibration frequency method to obtain a summary. The sensor should be placed near the bollard.
4.4. Wetted Cable Test
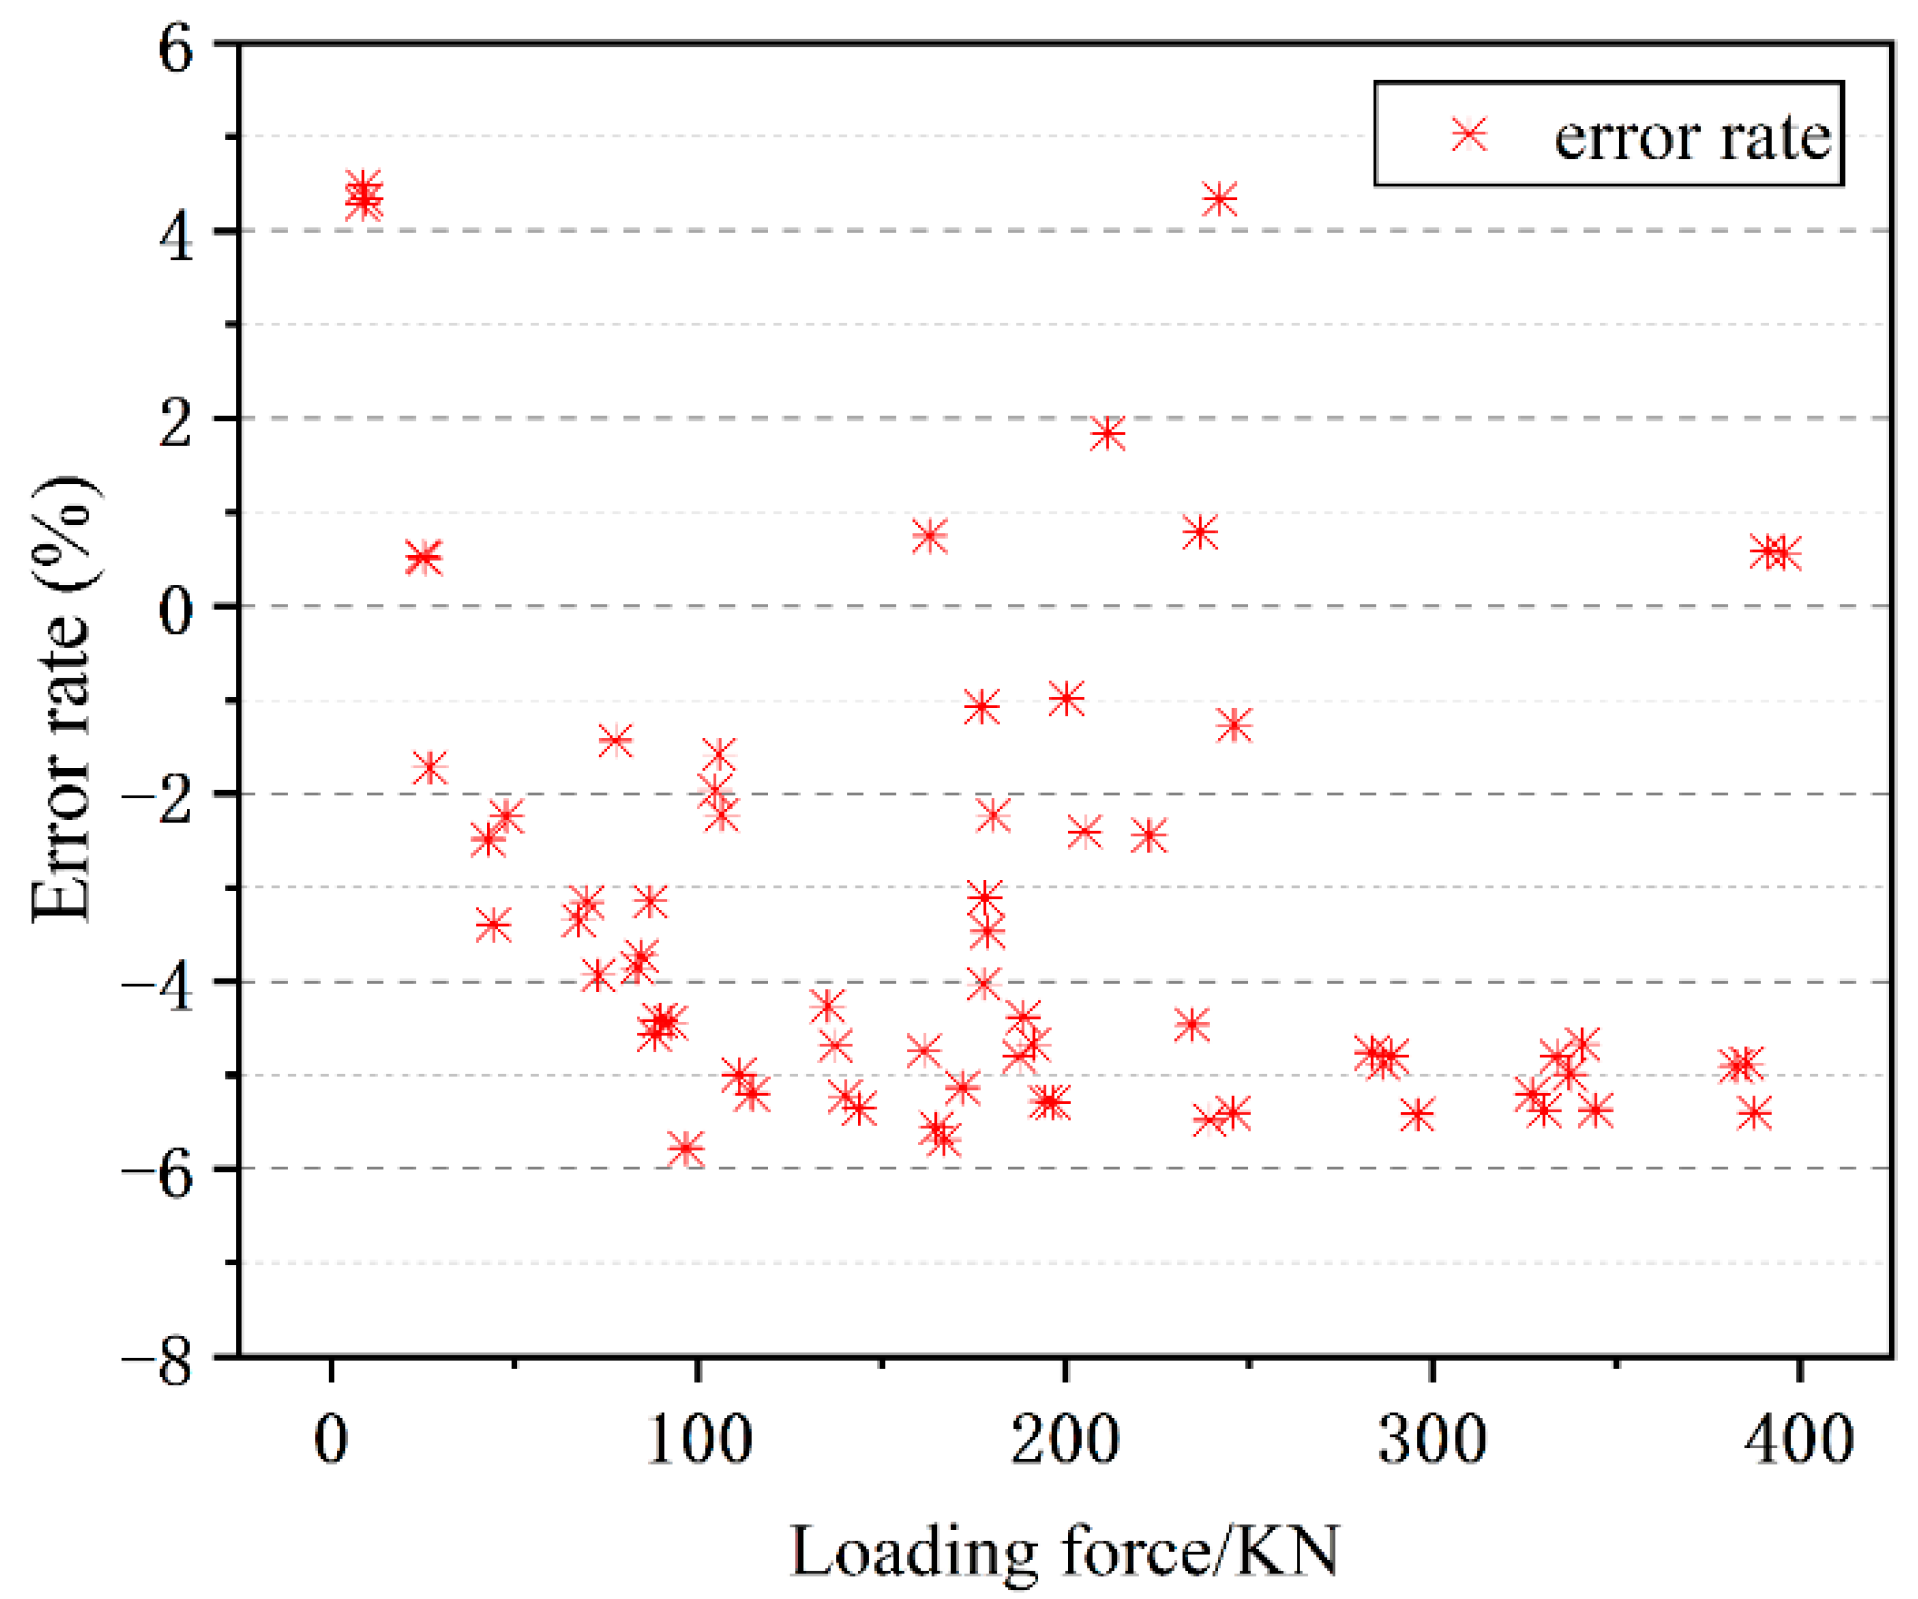
The humidity in the dock increases during rainy days. Theoretically, the cable’s line density value will increase when exposed to a wet environment for a prolonged period. However, it is not possible to measure the line density value during the actual use of the cable. Therefore, relying solely on the standard line density value may lead to relative errors. This section describes the cable immersion test. The cable is immersed in water for 12 h and then subjected to a loading force of 0 kN to 400 kN for a tensioning test. The test data are summarized and analysed in
Figure 7. The results show that the cable force value measured after immersion does not have a significant impact on the cable force value compared to the tension force value. The error range is from −6.543% to 4.34%.
The reason why humidity has a relatively small impact on the test results may be that the cable itself is made of ultra-high molecular weight polyethylene, which has strong water resistance. Moreover, after tensioning, the moisture present in the cable gaps is eliminated due to the shrinkage of the cable and ultimately has little impact on the overall linear density.
4.5. Temperature
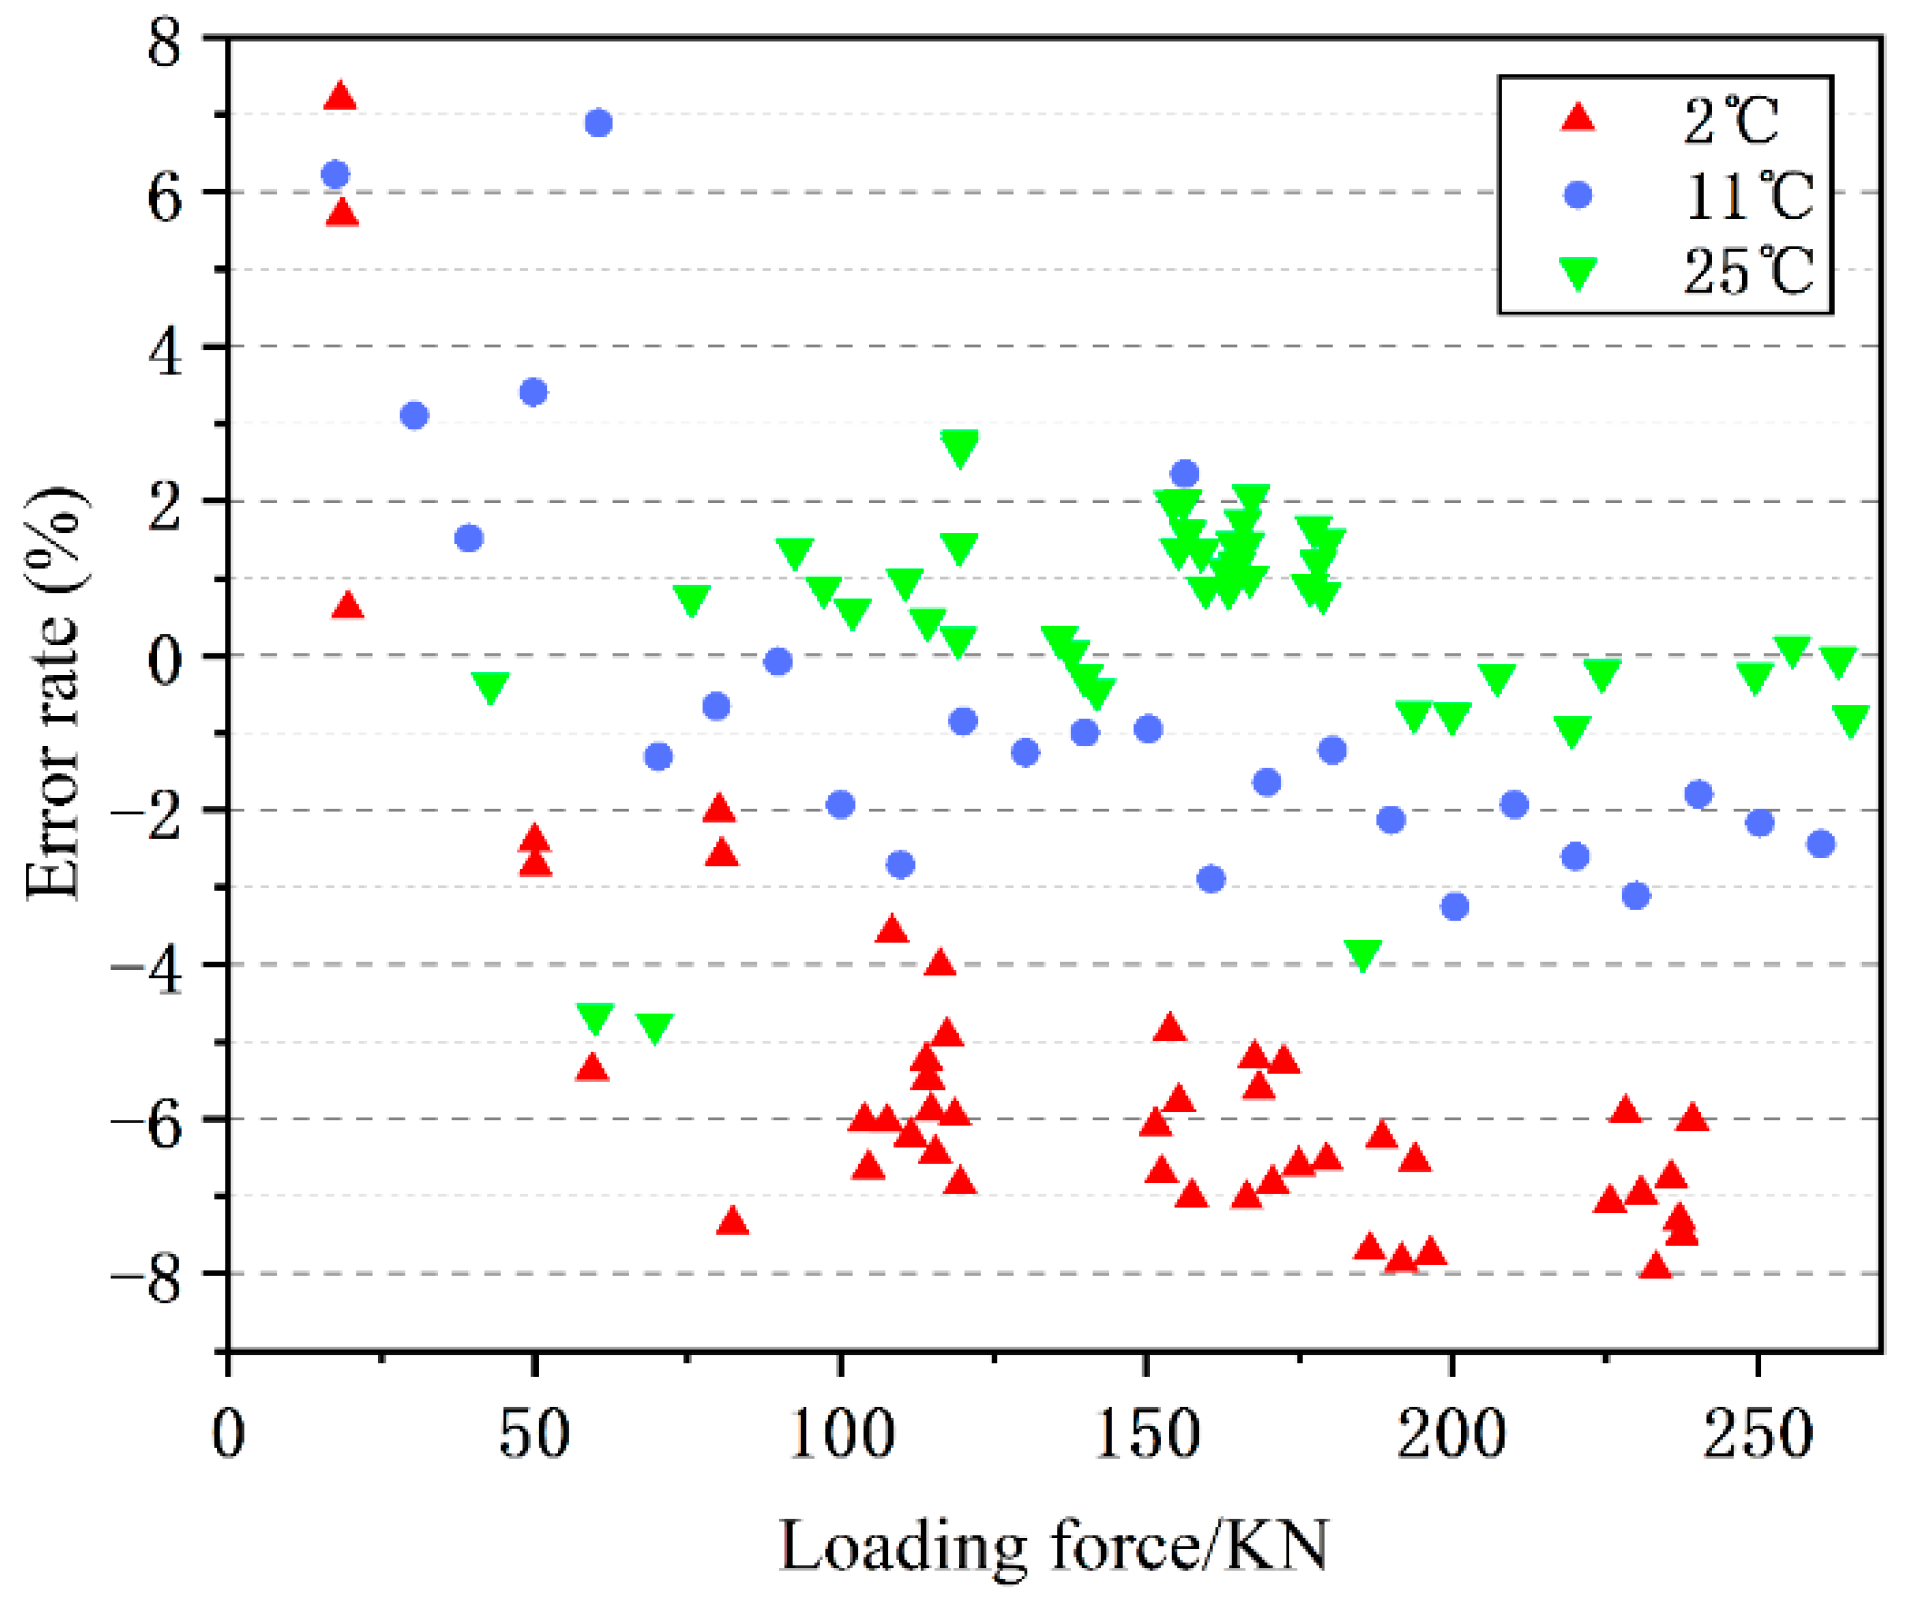
Figure 8 presents a comparative analysis of the error results of the 0 kN~250 kN tensioning test of the cable made of ultra-high molecular weight polyethylene, analysed at temperatures of 2 °C, 11 °C, and 25 °C. The results indicate that the accuracy of using the vibration frequency method to identify the bollard force decreases at lower temperatures. Specifically, at lower temperatures, the vibration frequency method is less accurate in identifying the bollard force. At a temperature of 2 °C, the error range is between −7.835% and 7.204%. At 11 °C, the error range is between −3.108% and 6.889%. At 25 °C, the error range is between −4.770% and 2.758%. However, the graph shows that most of the errors at 2 °C are distributed between −6% and −4%, while most of the errors at 11 °C are distributed between −4% and 0, and most of the errors at 25 °C are distributed between −1% and 2%. Low temperatures can lead to an increase in the error rate of about ±2%.
The accuracy of the bollard force calculation is affected by low temperatures. Low temperatures slow down the thermal movement of molecules, resulting in increased stiffness and strength of the cable. This reduces the cable’s bending performance and scalability. Additionally, the lower air humidity in northern winters compared to high temperatures in summer leads to a reduction in the cable’s line density. At the same tension, low-temperature cables are tauter and have faster vibration signal attenuation. This also increases the possibility of error in recognising the fundamental frequency.
4.6. Analysis of Experimental Error Rate
Based on the results of the experimental study, it is evident that the constraints of the actual usage environment have no significant impact on the error of measuring the bollard force by the vibration frequency method compared to ideal conditions. This subsection focuses on the analysis of the error rate of the bollard force measurement by the vibration frequency method under a fully simulated dockside usage environment. The acceleration sensor is positioned at the data acquisition point 1, while the excitation node 1 is selected as the excitation position. Three consecutive tensioning tests are conducted on the cable using the device excitation, ranging from 0 kN to 400 kN, and the error rate of the data for each test is recorded. Three consecutive tensioning tests are conducted on the cable using the device excitation, ranging from 0 kN to 400 kN, and the error rate of the data for each test is recorded.
Three consecutive tensioning tests are conducted on the cable using the device excitation, ranging from 0 kN to 400 kN, and the error rate of the data for each test is recorded. The test error rate distribution is analysed and presented in
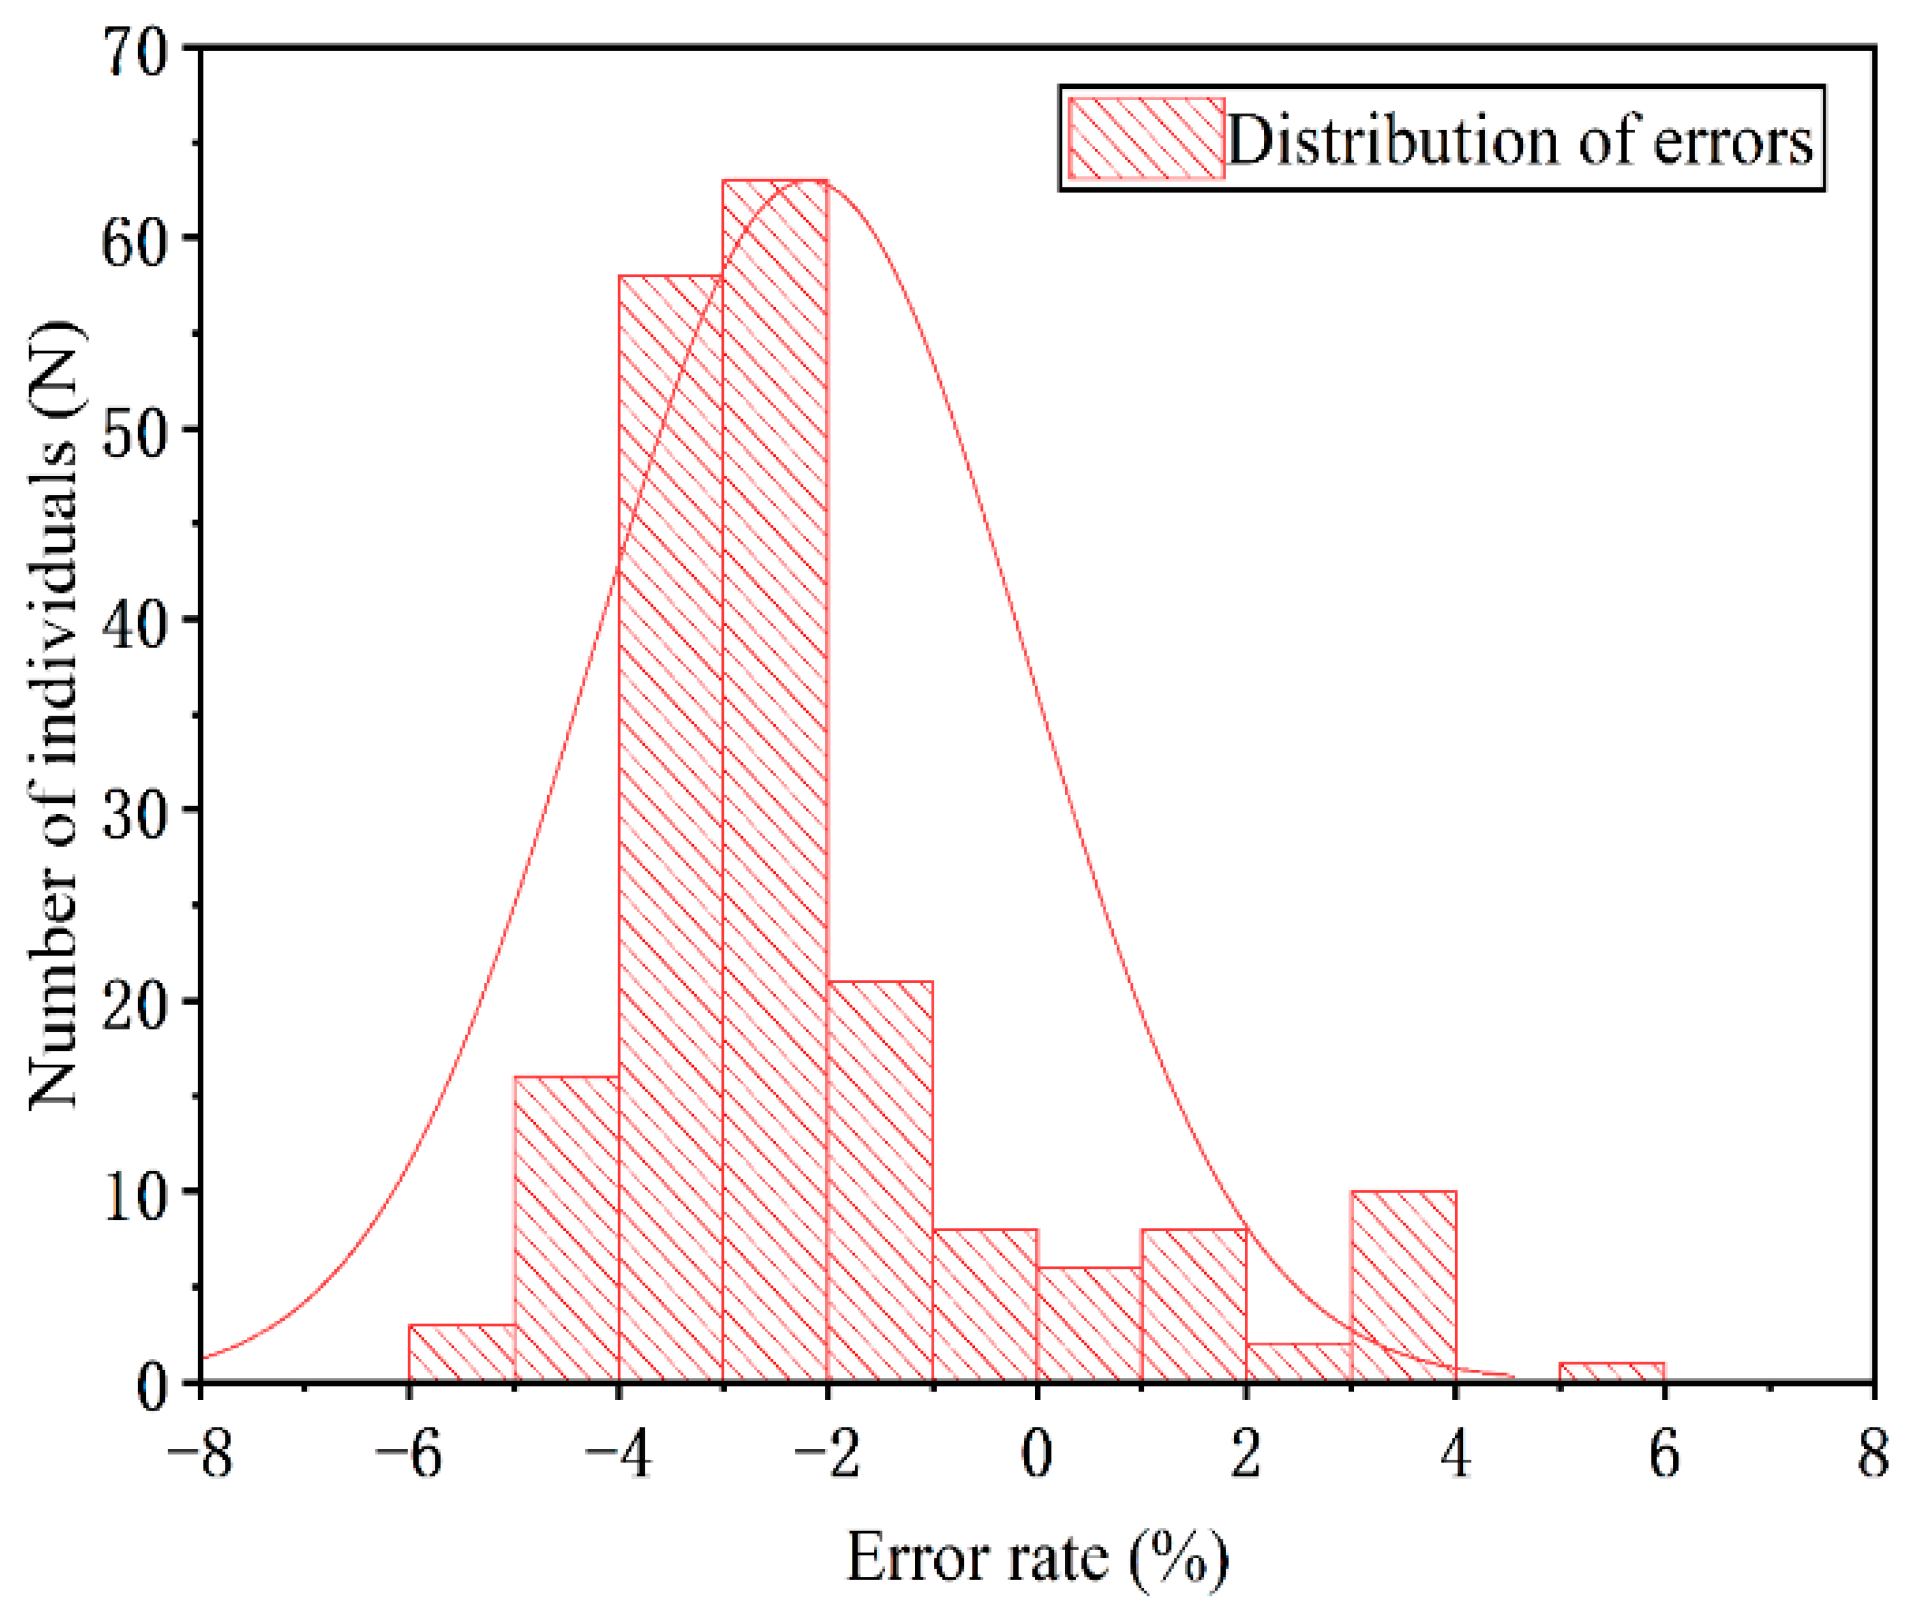
Figure 9 below. As the tension force increases, the concentration of the error rate distribution also increases. The overall error distribution ranges from −5% to 4%. When the tension value is small, positive errors are more likely to occur. As the force value increases, negative deviation becomes more prevalent. There are two reasons for this phenomenon. Firstly, as the tension increases, the cable tension decreases at a faster rate, resulting in an error in the calculation of the tension according to the standard target. Secondly, when measuring the bollard force using the vibration frequency method, the cable elongation increases with the tension. However, the actual measurement of the value uses the unchanged cable length.
The test results’ error rate is presented as a normal distribution in
Figure 10. When measuring the ship bollard force using the vibration frequency method under actual working conditions, the error rate cannot better satisfy the normal distribution.
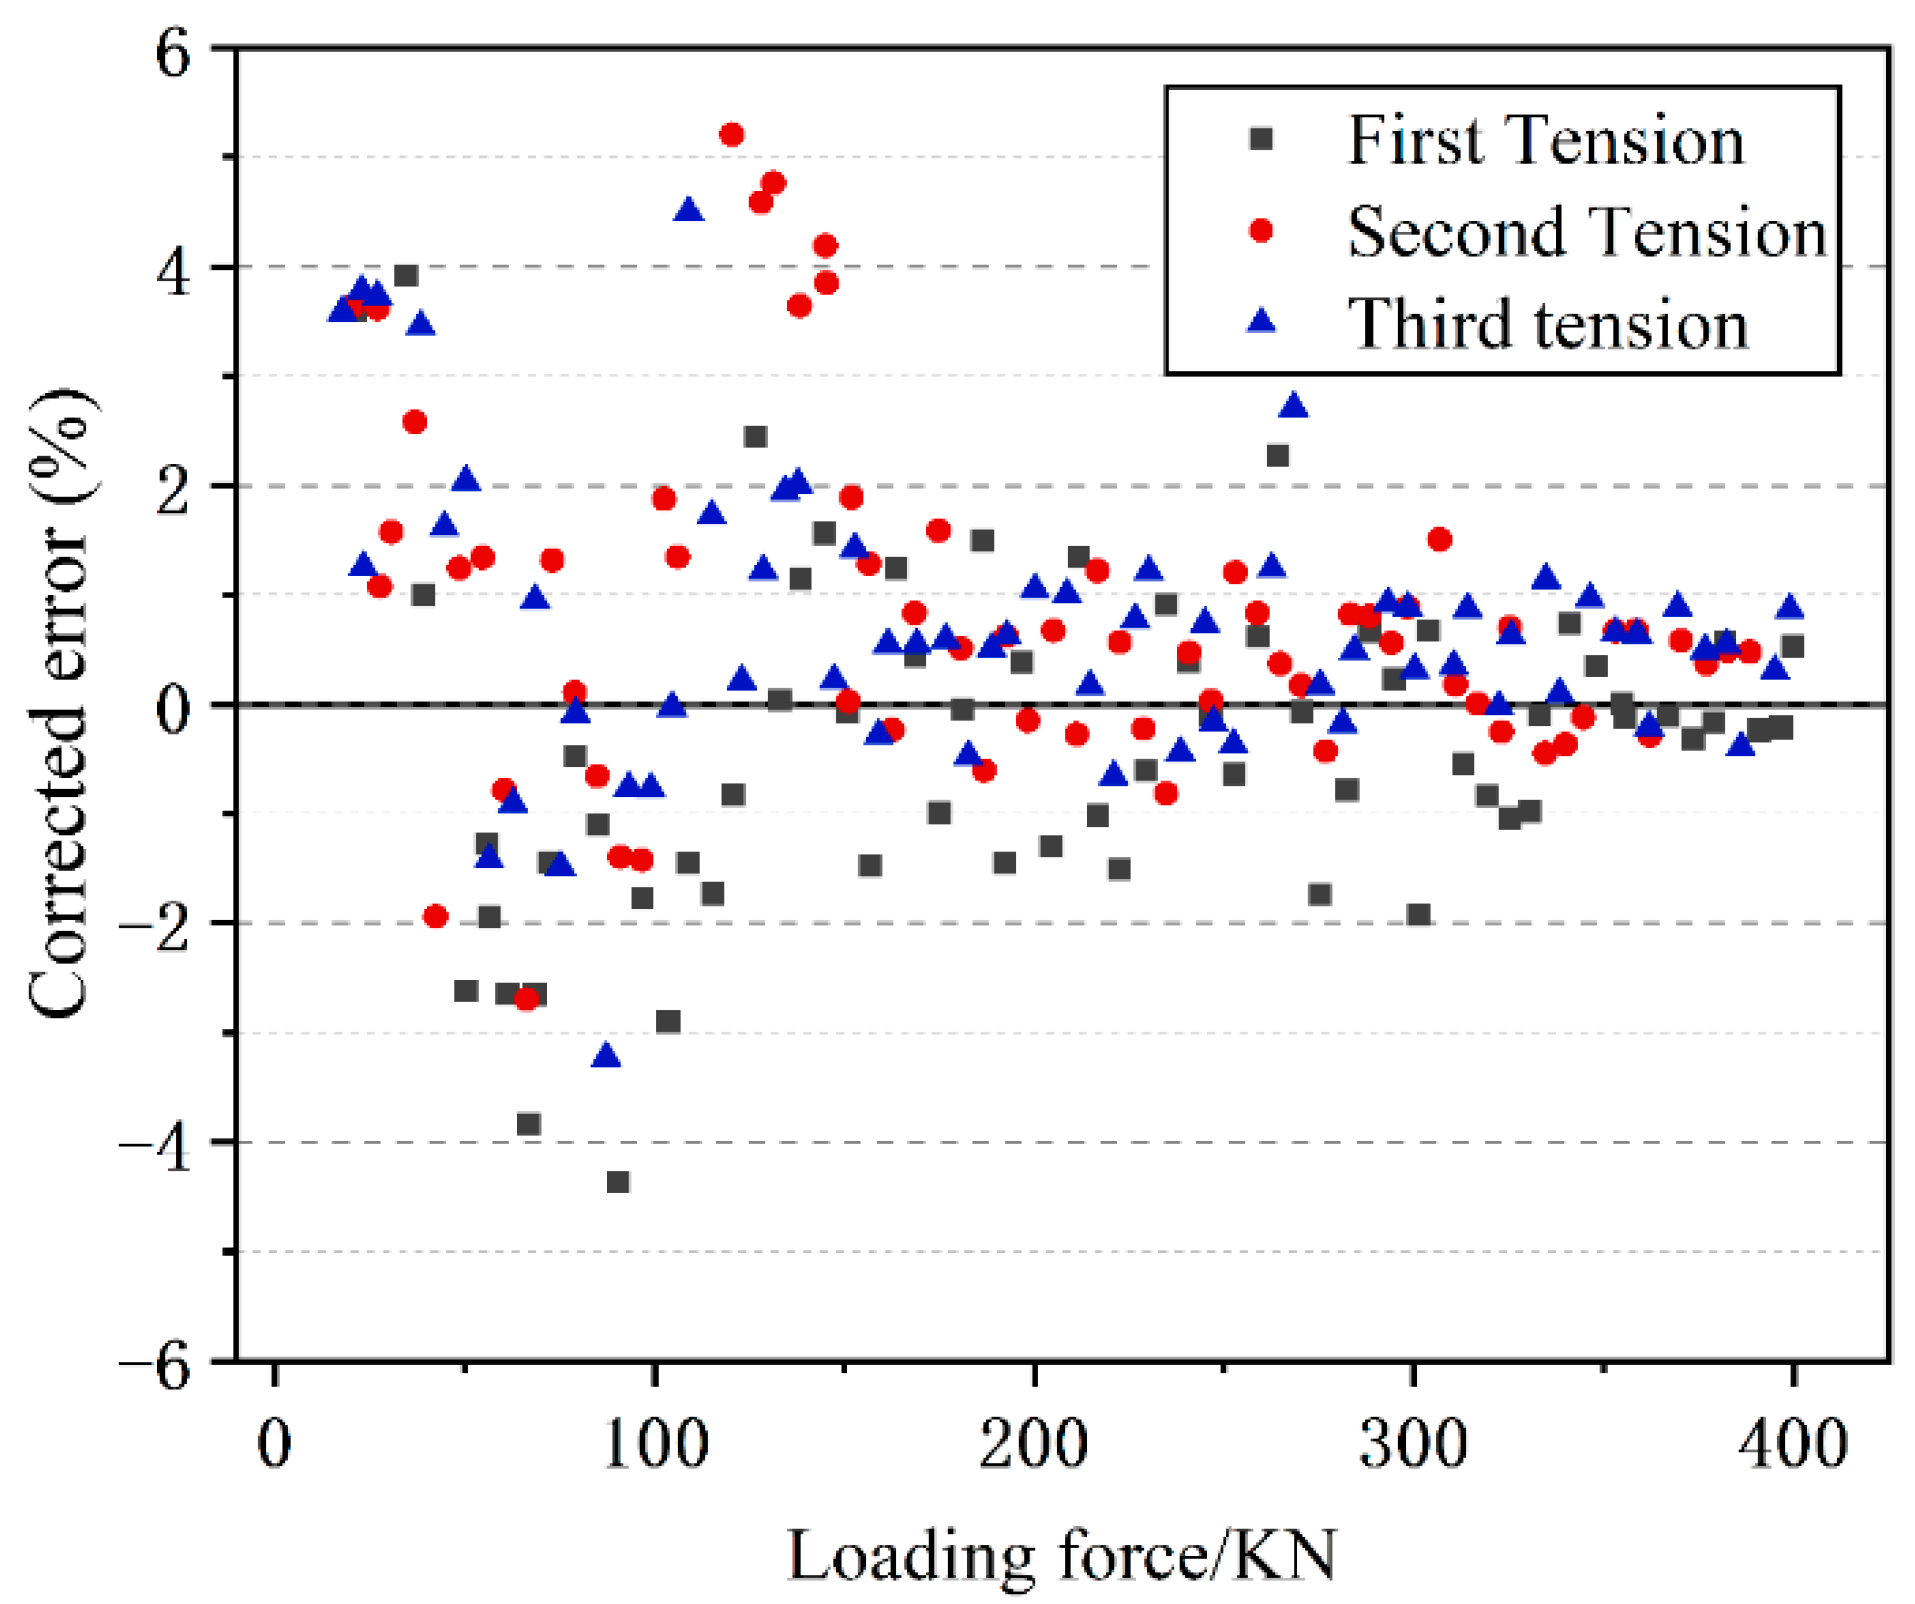
Figure 11 shows the statistics of the error analysis. The results indicate that there is tension of more than 100 kN after the test. However, the error results are mostly negative. The reason for this is that as the tension increases, the length of the cable also increases. However, the formula used still considers the initial length of the cable. Therefore, it is necessary to correct the length of the cable to reduce the error. The correction value will be obtained by taking the inverse of the error value and using the statistics of the average correction values (0.018387, 0.017095, 0.016673) from the three results. The correction factor k will be applied to the formula for calculating the bollard force.
The statistical results are presented in
Figure 11. As the tension force increases, the error gradually decreases and approaches the overall error range of ±1%. When the loading force exceeds 100 kN, the error reduction is ±4%.
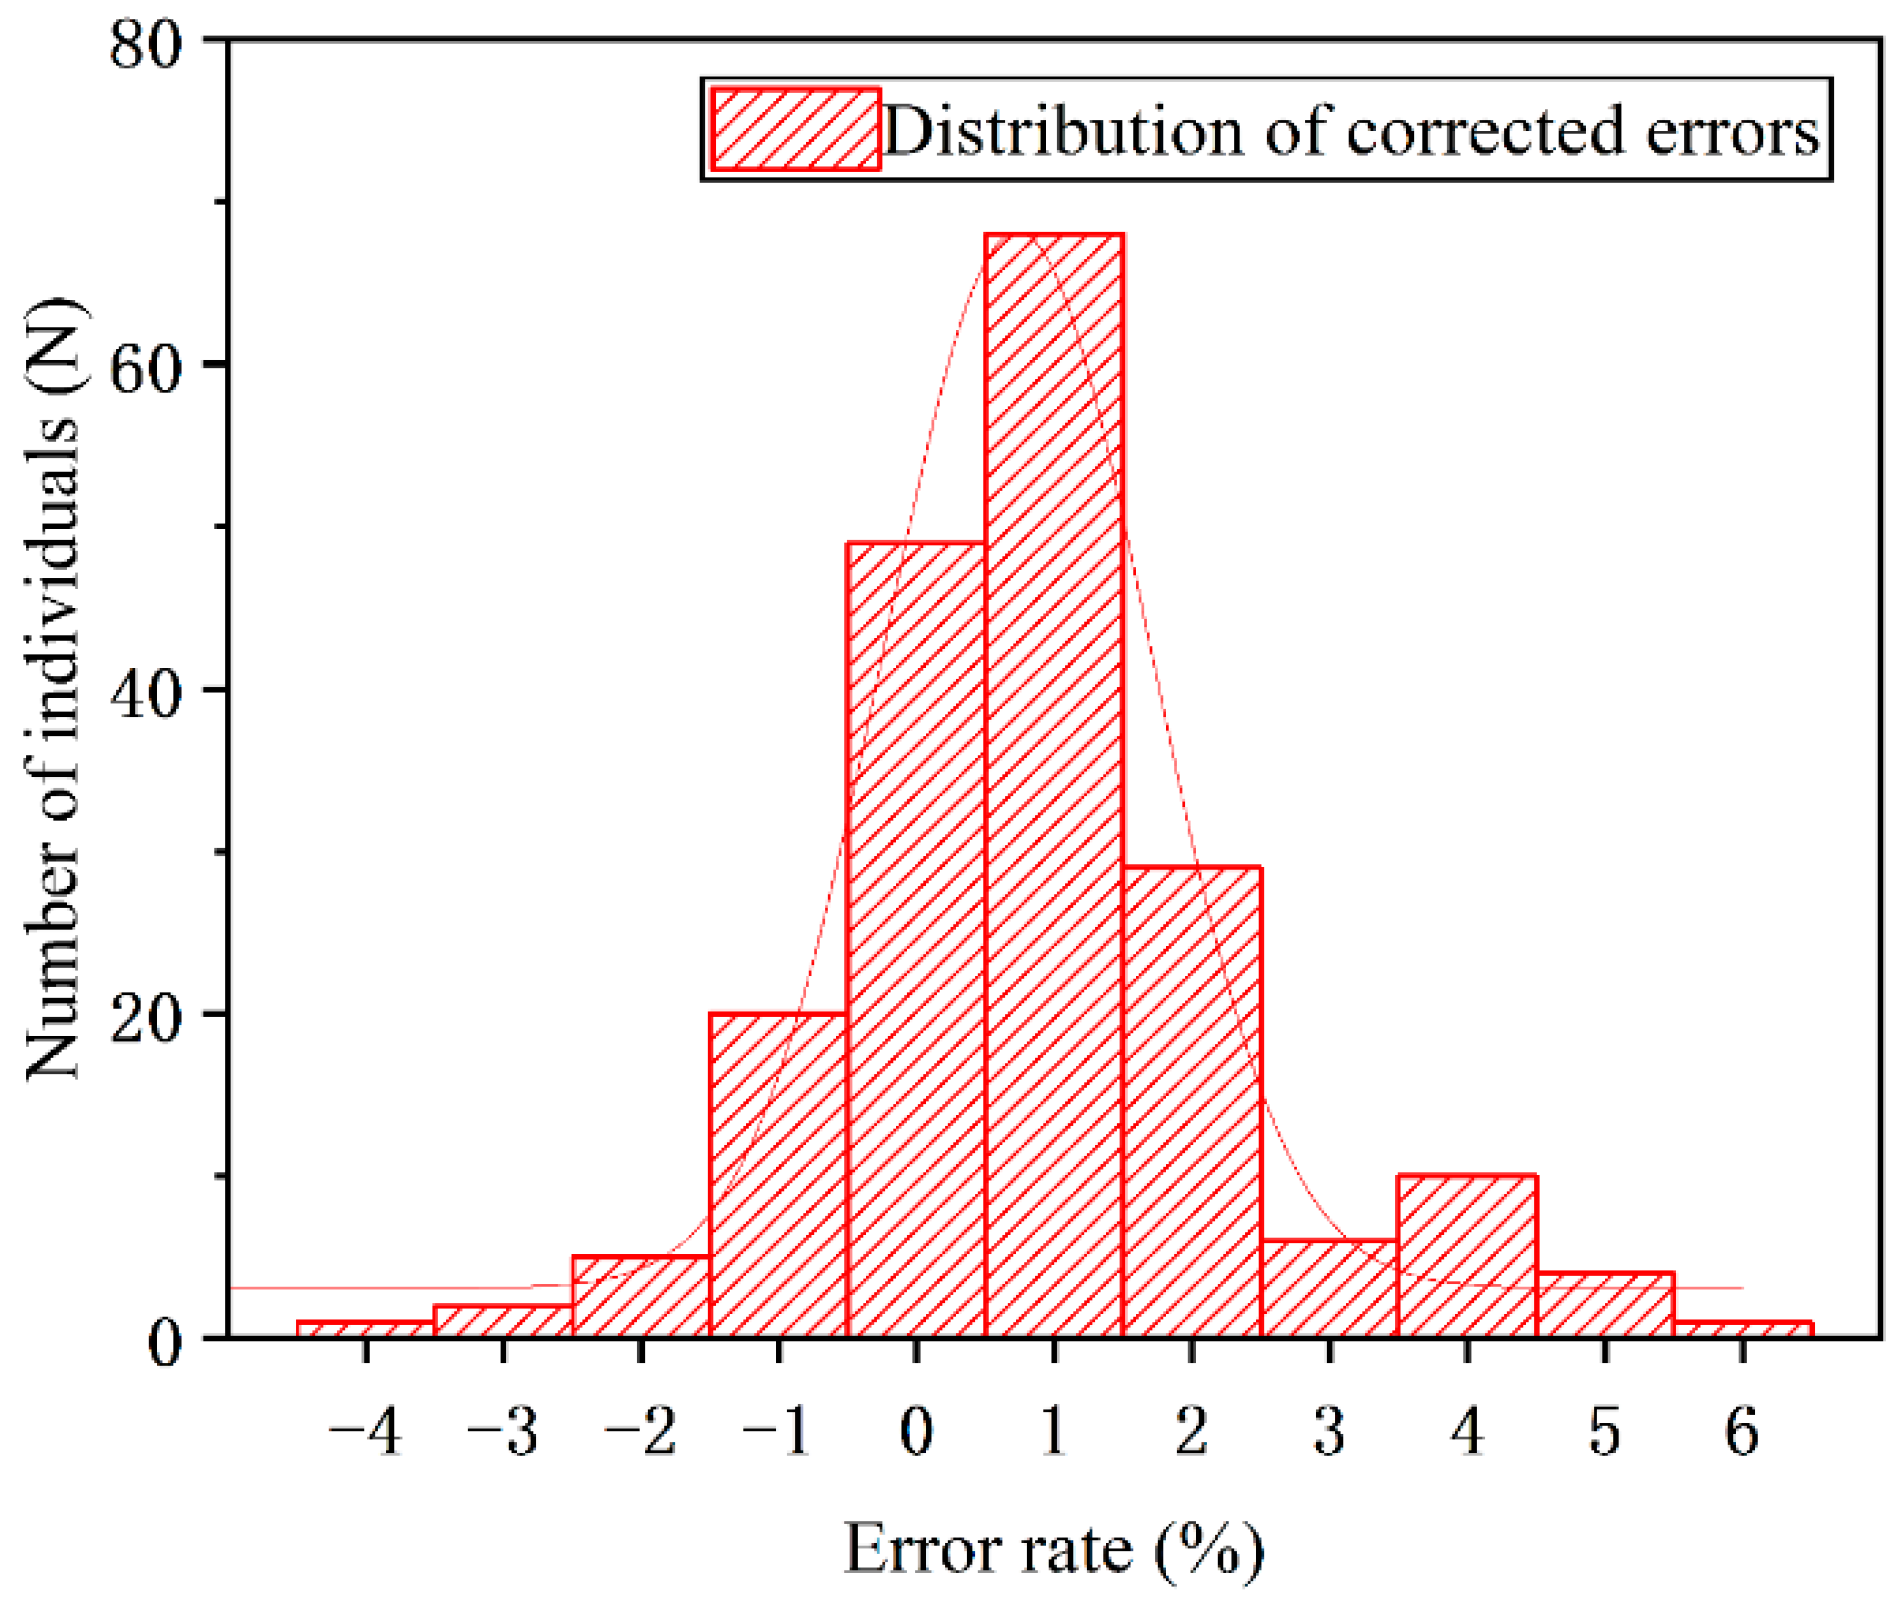
Figure 12 displays the distribution of errors in the corrected test results. The corrected error rate conforms more closely to the normal distribution curve, with a corrected variance of
σ′ = 2.412, compared to the variance before the correction of
σ = 4.284. Therefore, the error rate after correction is more suitable for practical application.
5. Conclusions
- (1)
Upon analysis of the test results, it is evident that the different data acquisition positions have a negligible effect on the results. The data acquisition position near the bollard yields results that are only about 1% larger than those relative to the central position. Similarly, different excitation positions only affect the analysis of the spectrogram and have minimal impact on the actual numerical results. Cable immersion increases the cable’s line density value, resulting in a 1.5% increase in error rate after bringing the standard line density value into comparison. At low temperatures, the error rate range is approximately ±2%.
- (2)
Compared with environmental and artificial incentives, device incentives have better incentive effects and are more suitable for future practical applications.
- (3)
The test results indicate that the vibration frequency method for measuring bollard force produces a normal distribution of error rates, with the majority of errors falling within the range of −5% to 4%. To improve measurement accuracy, a correction coefficient is added to the cable length, resulting in a corrected accuracy of ±4. Therefore, the vibration frequency method is a feasible approach for measuring bollard force, with minimal impact on error rates compared to ideal conditions.
Author Contributions
Conceptualization, H.L. and Z.Z.; methodology, Z.Z. and S.C.; software, S.C.; validation, Z.Z., S.C. and H.C.; formal analysis, P.Z.; investigation, P.Z.; resources, H.C.; data curation, Z.Z.; writing—original draft preparation, Z.Z.; writing—review and editing, H.L.; visualization, S.C.; supervision, H.C.; project administration, H.C.; funding acquisition, S.C., Z.Z. and Y.Z. All authors have read and agreed to the published version of the manuscript.
Funding
This research was funded by (1) China’s National Key R&D Program (No. 2022YFB3207400), (2) China’s National Key R&D Program (No. 2022YFE0113500); (3) the National Natural Science Foundation of China (No. 51861165102); (4) Research Funds for the Central Universities (No. TKS20230205); (5) Research Funds for the Central Universities (No. TKS20220301); (6) Research Funds for the Central Universities (No. TKS20220601); (7) Research Funds for the Central Universities (No. TKS20230103).
Data Availability Statement
Data are contained within the article.
Acknowledgments
We thank Mingyang Liu and Ruijia Jin from Tianjin Research Institute for Water Transport Engineering, Ministry of Transport for their assistance with paper writing.
Conflicts of Interest
Author Pu Zhang was employed by the company Shanghai Engineering Construction Consulting and Supervision Co., Ltd. The remaining authors declare that the research was conducted in the absence of any commercial or financial relationships that could be construed as a potential conflict of interest.
References
- Sreedevi, R.; Nallayarasu, S. Investigation on ship mooring forces including passing ship effects validated by experiments. Ocean Eng. 2023, 283, 115004. [Google Scholar] [CrossRef]
- Natarajan, R.; Ganapathy, C. Analysis of Moorings of a Berthed Ship. Mar. Struct. 1995, 8, 481–499. [Google Scholar] [CrossRef]
- Van Der Molen, W.; Monardez, P.; Van Dongeren, A.P. Numerical Simulation of Long-Period Waves and Ship Motions in Tomakomai Port, Japan. Coast. Eng. J. 2006, 48, 59–79. [Google Scholar] [CrossRef]
- Xie, C.; Niedzwecki, J.M.; Teigen, P. Hydrodynamic interaction in a coupled ship/barge system and its effects on the mooring line and fender forces. In Proceedings of the International Offshore and Polar Engineering Conference Proceedings, Vancouver, BC, Canada, 6–11 July 2008. [Google Scholar]
- Zucca, M.; Crespi, P.G.; Longarini, N. Seismic vulnerability assessment of an Italian historical masonry dry dock. Case Stud. Struct. Eng. 2017, 7, 1–23. [Google Scholar] [CrossRef]
- Duggal, B. Ocimf Mooring Equipment Guidelines, 4th ed.; Oil Companies International Marine Forum: London, UK, 2008. [Google Scholar]
- Lee, S.K.; Choi, H.; Surendran, S. Experimental Studies on the Slowly Varying Drift Motion of a Berthed Container Ship Model. Ocean Eng. 2006, 33, 2454–2465. [Google Scholar] [CrossRef]
- Rosa-Santos, P.; Taveira-Pinto, F.; Veloso-Gomes, F. Experimental Evaluation of the Tension Mooring Effect on the Response of Moored Ships. Coast. Eng. 2014, 85, 60–71. [Google Scholar] [CrossRef]
- Zhao, Y.; Liu, H. Numerical implementation of the installation/mooring line and application to analyzing comprehensive anchor behaviors. Appl. Ocean Res. 2016, 54, 101–114. [Google Scholar] [CrossRef]
- Wu, G.; Zhao, X.; Sun, Y.; Wang, L. Cooperative Maneuvering Mathematical Modeling for Multi-Tugs Towing a Ship in the Port Environment. J. Mar. Sci. Eng. 2021, 9, 384. [Google Scholar] [CrossRef]
- Villa-Caro, R.; Carral, J.C.; Fraguela, J.Á.; López, M.; Carral, L. A Review of Ship Mooring Systems. Brodogradnja 2018, 69, 123–149. [Google Scholar] [CrossRef]
- Guo, T. Mooring Arrangement in Ship Design Process. Ship Mater. Mark. 2022, 30, 56–58. [Google Scholar]
- Kim, Y.D.; Saito, K. The Prediction of Fluctuation Tension of Securing Rope by Oscillation. J. Packag. Sci. Technol. 2007, 16, 413–423. [Google Scholar]
- Xu, B.; Zhu, X.; Xu, M. A wireless monitoring system for cable tension. J. Tongji Univ. Nat. Sci. Ed. 2005, 33, 1509–1512. [Google Scholar]
- Zhang, H.; Ma, L.; Zhang, L.; Zhang, X.; Zhang, Y.; Lu, X. A Real-Time Device for Detecting Cable Tension Using Pulley Side Pressure. Patent CN204405242U, 17 June 2015. [Google Scholar]
- Li, L. A Tension Testing Device for Ship Cables. Patent CN107014697A, 11 October 2019. [Google Scholar]
- Zeng, Y. Pressure Sensing Mechanism for Detecting Cable Tension. Patent CN103017966A, 3 April 2013. [Google Scholar]
- Li, F.; Wei, S.; Wen, Y.; Wen, X. Wireless Monitoring and Early Warning System Design for Ship Bollard Force. Mar. Eng. 2013, 42, 196–199. [Google Scholar]
- Sun, X.; Fang, X.; Guan, L. Mechanics of Materials, 5th ed.; Higher Education Press: Beijing, China, 2009. [Google Scholar]
- Campbell, L.A.; Butler, J.A.; Donaldson, R.J. Mooring Line Failures: Considerations for the Installation of Barrier Protection; New Zealand Coastal Society: Christchurch, New Zealand, 2022; pp. 230–235. [Google Scholar]
- Zheng, J.; Xiao, Y.; Bai, X.; Chen, L.; Zhang, H. Measurement method for ship’s mooring load based on bollard surface stress. J. Shanghai Marit. Univ. 2013, 34, 1–4. [Google Scholar]
- Wu, J.; Shu, Y.; Zhou, S.; Bo, L.; Cao, S. Structure monitoring method and experiment of large-scale wharf bollards. Opt. Precis. Eng. 2021, 29, 1631–1639. [Google Scholar] [CrossRef]
- Xiang, Y.; Tan, J.; Yang, J.; Zhang, C. Mooring model experiment and mooring line force calculation. China Ocean Eng. 2001, 15, 25–36. [Google Scholar]
- Tang, J.; Han, W. Calculation of berth stability bollard force of 300,000 tonne oil terminal based on Optimoor. Water Transp. Eng. 2015, 6, 42–45. [Google Scholar]
- Zhou, B.; Liang, B.; Tian, Z. Analysis of LNG carrier mooring arithmetic cases based on OPTIMOOR software. Mar. Eng. 2017, 46, 79–81. [Google Scholar]
- Bomze, H. Analytical determination of ship motions and mooring forces. In Proceedings of the Offshore Technology Conference, Houston, TX, USA, 6–8 May 1974. OTC-2072-MS. [Google Scholar]
- Sun, J. Measurement of Cable Force of Inclined Cable Based on Frequency Method. Master’s Thesis, Beijing Forestry University, Beijing, China, 2012. [Google Scholar]
- Zhang, J. Study on Load and Fatigue Failure Behaviour of Propper in High-Speed Catenary. Ph.D. Thesis, Southwest Jiaotong University, Chengdu, China, 2021. [Google Scholar]
- Chen, Z.; Feng, Z. A base-frequency hybrid identification method for cable-stayed bridge cable-stayed force detection. Microcomput. Appl. 2011, 30, 73–76. [Google Scholar]
| Disclaimer/Publisher’s Note: The statements, opinions and data contained in all publications are solely those of the individual author(s) and contributor(s) and not of MDPI and/or the editor(s). MDPI and/or the editor(s) disclaim responsibility for any injury to people or property resulting from any ideas, methods, instructions or products referred to in the content. |
© 2024 by the authors. Licensee MDPI, Basel, Switzerland. This article is an open access article distributed under the terms and conditions of the Creative Commons Attribution (CC BY) license (https://creativecommons.org/licenses/by/4.0/).


