Article

Seepage–Deformation Coupling Analysis of a Core Wall Rockfill Dam Subject to Rapid Fluctuations in the Reservoir Water Level

1
Pumped-Storage Technological & Economic Research Institute, State Grid Xinyuan Company Ltd., Beijing 100761, China
2
College of Water Conservancy and Hydropower Engineering, Hohai University, Nanjing 210098, China
*
Author to whom correspondence should be addressed.
Water 2024, 16(11), 1621; https://doi.org/10.3390/w16111621
Submission received: 18 April 2024 / Revised: 26 May 2024 / Accepted: 29 May 2024 / Published: 5 June 2024

Abstract

:
Core wall rockfill dams are susceptible to cracking at the dam’s crest, as well as collapse and settlement of the rockfill during storage and operation periods, particularly due to rapid fluctuations in the water level in pumped storage power stations. Most studies on the impact of fluctuations in the reservoir’s water level on dam deformation have considered fluctuations of less than 5 m/d, while pumped storage power stations experience much larger fluctuations. Additionally, the seepage and stress fields within the dam’s rock and soil interact and influence each other. Few studies have used the coupling theory of seepage and stress to analyze seepage and deformation in core wall rockfill dams. To address these issues, a finite element model using seepage–stress coupling theory was utilized to investigate the variations in the phreatic line, earth pressure, and deformation of a core wall rockfill dam due to rapid fluctuations in the reservoir’s water level. Additionally, the results of the finite element simulation were compared with and analyzed alongside safety monitoring data. The results indicated that, upon a sudden decrease in the reservoir’s water level, there was a lag in the decline of the phreatic line in Rockfill I, which created a large hydraulic gradient, resulting in a reverse seepage field on the dam’s slope surface and generating a drag force directed upstream. Consequently, a significant concentration of stress occurred on one-third of the upstream slope surface of the dam and the seepage curtain, and the increase in horizontal displacement was substantially greater than the increase in settlement from one-third of the rockfill’s height to the dam’s foundation. The deformation was more sensitive to the lowest water level of the reservoir rather than to the fastest rate of decline. Sudden rises in the reservoir’s water level result in decreased horizontal displacements and settlement of the dam. Amid rapid fluctuations of the reservoir’s water level, changes in the vertical earth pressure were more pronounced at the bottom of the core wall than in its midsection. Compared with the core wall, variations in the vertical earth pressure in the upstream and downstream filter layers were minor at similar elevations. A peak horizontal displacement of 6.5 mm was noted at one-third the height of Rockfill I, with the greatest increase in settlement of 3.5 mm at the dam’s crest. To ensure a project’s safety, it is crucial to control the elevation of the lowest point during a sudden drop in the reservoir’s level and to carefully monitor for cracks or voids within approximately one-third of the dam’s height in Rockfill I and at the dam crest. This study’s results provide a scientific basis for assessing core wall rockfill dams’ health and securing long-term safety at pumped storage power facilities.

1. Introduction

Core wall rockfill dams (CWRDs) are distinguished by numerous advantages, including the use of materials sourced from local environments, streamlined construction processes, remarkable adaptability to different foundation types, and superior performance in seismic conditions [1,2,3]. However, during storage and operation, many CWRDs develop cracks [4,5], experience collapse and settlement of the rockfill [6,7,8,9], and settlement of the dam’s crest [10,11,12,13]. In the case of the Guanyinyan Dam in China, distinguished by its CWRD adjoining a gravity dam via a 75 m high joint. Six cracks were identified at the junction as the reservoir’s water level ascended to 1117.00 m on 26 November 2014. The most extensive of these cracks measured 25 m in length, with the greatest width and depth observed at 5 cm and roughly 5.5 m, respectively [14,15,16]. During the initial filling of the Cherry Valley Dam’s reservoir in the United States, the settlement observed in the upstream rockfill was four times greater than that of the core wall. This discrepancy led to the formation of longitudinal cracks at the interface between the rockfill and the core wall along the dam’s crest [17].
The roles of pumped storage power stations (PSPSs) in peak shaving, valley filling, emergency backup, frequency modulation, and phase adjustment within the electric grid are globally recognized [18,19]. This recognition has spurred the rapid construction of numerous PSPSs in China [20,21]. Conventional power station reservoirs, with their larger capacities, experience slower rates of decline in the water level. By contrast, the reservoir capacities of PSPSs are significantly smaller than those of conventional stations. Moreover, the substantial flow required for electricity generation or pumping within a few hours leads to significant and frequent fluctuations in the reservoir’s water level. Concrete dams and concrete–faced rockfill dams generally adapt more easily to rapid changes in the reservoir’s water level [22]. However, sudden changes in the reservoir’s water level can exacerbate the uncoordinated deformation and arch effect of the CWRDs, leading to the dam’s failure. Therefore, it is of great significance to study the influence of rapid fluctuations in reservoir’s water level on the seepage and deformation characteristics of CWRDs.
The seepage characteristics of the core wall are an important aspect of monitoring the safety of CWRDs. Many scholars have studied the seepage characteristics and safety of CWRDs during storage and operation. Larese et al. [23] combined traditional finite element methods with more recent particulate analysis techniques to simulate the influence of overflow of the dam’s crest on the rockfill and analyze the formation and evolution of cracks. Mohammad Rashidi et al. [24] found that after the initial water storage, the pore water pressure of the downstream core decreased, and the moisture content of some clay layers exceeded their optimal level. This resulted in an increase in pore water pressure in these areas. Xu et al. [25] established a seepage stability equation to evaluate the safety state of seepage in high CWRDs based on the critical hydraulic gradient safety index within the framework of the noninvasive finite element method. Wu et al. [26] proposed a method of assessing the probability of a percolation failure, combined with Bayesian parameter-based probability estimation method, to study the safety of seepage in a CWRD during sudden drops in the reservoir’s water levels.
For decades, many researchers have used finite element software to simulate the deformation of CWRDs under fluctuations in the reservoir’s water level. Reza et al. [27] improved the constitutive model for simulating the nonlinear characteristics of rockfill and proposed a method to simulate the collapse and settlement of rockfill dams during the initial filling. They concluded that low water content or poor compactness were the main causes of the collapse and settlement of the rockfill, and that the water storage of rockfill dams should be graded to ensure dam safety. Akhtarpour et al. [28] used a constitutive model of strain hardening to simulate the deformation experienced by the Masjed-e-Soleyman dam during its construction and impoundment phases. They attributed the slow dissipation of the internal excess pressure of pore water, plastic shear deformation, and significant settlement of the upstream body of the dam as the primary factors leading to cracks in the dam’s crest. Qiu et al. [29] simulated the deformation of the asphalt core wall during the construction and operation of Quxue Dam using a three-dimensional nonlinear finite element method. Zhou et al. [30] performed an intricate mesh segmentation of a finite element model of a high CWRD. They suggested that a refined mesh facilitates a more accurate analysis of cracks in a dam. Additionally, Zhou et al. [31] observed that during the reservoir’s storage process, the horizontal displacement and settlement increment of the dam’s crest occur at comparable magnitudes. Liu et al. [32] used the hhu-SH-breakage constitutive model of rockfill to simulate the deformation characteristics of an ultra-high CWRD and found that the crushing settlement of the rockfill could not be ignored. Pan et al. [33] utilized the Ew-–vw wetting model, and using the initial stress and strain methods, simulated the construction and impoundment processes of the Guanyinyan Dam. They concluded that the wetting deformation of the upstream shell materials upon the rise in water level created tensile stress zones at the dam’s crest, and identified wetting deformation as the direct cause of cracks in the crest. Furthermore, Pan et al. [34] used a BP neural network to invert the constitutive model parameters of the rockfill and inputted these parameters into a finite element calculation model, improving the accuracy of the results of finite element simulation. Ai et al. [35] proposed an innovative method for updating deformation analysis models using multi-source monitoring data filtering and identification of the model’s parameters. This method reduced the redundancy of the information and ensured that the finite element analysis model of the rockfill dam better reflected actual deformation.
Due to the effects of the reservoir’s water level, a differential head exists between the upstream and downstream sides of a dam. This difference causes water to flow through the dam’s material pores, generating dynamic hydraulic pressure, also known as seepage volume force. The long-term effects of seepage volume force alter the dam’s internal stress field, inducing the displacement of soil particles and changes in the porosity and permeability, ultimately modifying the dam’s internal seepage field [36,37]. Consequently, the seepage and stress fields within a dam’s rock–soil mass interact and influence each other, underscoring the significance of studying their coupled effects on the dam’s deformation [38,39]. Chen et al. [40] developed a finite element seepage–stress coupled model for CWRD, investigating a dam’s deformation and stress under normal and rapidly declining water levels in the reservoir to dead storage levels. Ri et al. [41] utilized seepage–stress coupling and the strength reduction method to analyze the stability of various earth–rock dams at rates of decline in the reservoir’s water level of 0.1 m/d, 0.5 m/d, and 1 m/d. They concluded that core wall dams are safer compared with homogeneous and inclined-core earth dams.
A certain PSPS, operating as a daily regulation facility, experiences significant and frequent daily fluctuations in the reservoir’s water levels, with both the maximum daily rise and fall exceeding 15 m/d. Most previous studies on the influence of fluctuations in the reservoir’s water level on the dam’s deformation characteristics have focused on fluctuations of less than 5 m per day. Additionally, the interaction between the seepage field and the stress field has rarely been considered in seepage and deformation analyses of earth–rock dams. The increased range of fluctuation in the reservoir’s water levels leads to greater complexity and changes in the internal stress state of the dam’s body, significantly affecting the seepage field. Ignoring the interaction between the seepage field and the stress field will inevitably lead to discrepancies between the results of finite element calculation and the actual results. Moreover, the increased range of fluctuation in the reservoir’s water levels will exacerbate the collapse and settlement of the rockfill, the generation of cracks on the dam’s crest, and the arch effect of the core wall. The 15-day deformation monitoring cycle for the CWRD of a certain PSPS’s lower reservoir is insufficient for accurately understanding the dam’s deformation response to rapid fluctuations in the reservoir’s water level. In response to these issues, finite element software was used in this study to analyze changes in the seepage, stress, and displacement fields of a CWRD due to rapid fluctuations in the water level. The results of finite element calculation were then compared with monitored data on seepage pressure, vertical earth pressure, and displacement. The research results provide a scientific basis for evaluating the health of CWRDs and ensuring the long-term operational safety of PSPSs.

2. Methodology

2.1. Unsaturated Soil Seepage Equation

The height of the dam’s crest exceeds the phreatic line and it comprises unsaturated soil. Since the deformation of the dam’s crest area is a critical concern, both saturated and unsaturated seepage flows should be used to simulate the overall deformation of the dam. Initially, Darcy’s law was applied exclusively to the seepage analysis of saturated soil. However, Richards’ 1931 study demonstrated that Darcy’s law is also applicable to unsaturated soil. The primary distinction is that the permeability coefficient of saturated soil remains constant, whereas that of unsaturated soil varies with changes in the water content. According to the principle of mass conservation, the seepage equation for unsaturated soil is as follows
x k x H x + y k y H y + Q = m w γ w H t
where H is the total head, k x and k y are the hydraulic conductivity in the x and y directions, respectively, Q is the applied boundary flux, m w is the slope of the storage curve, γ w is the unit weight of water, and t is the time.
The definite solution conditions of unsteady seepage analysis are as follows.
(1)
Initial condition
H ( x , y , 0 ) = H 0 ; ( x , y ) Ω
where H 0 is the initial total head, and Ω is the calculation area of the model.
(2)
Boundary condition
In the finite element software used in this study, the water head’s boundary condition was defined as the first type or Dirichlet boundary condition. This condition was used to simulate the effect of the reservoir’s water level. The governing equation is expressed as follows
H ( x , y , t ) = H t ; ( x , y ) S 1
where S 1 is the head boundary conditions, and H t is a node head that changes over time.

2.2. Constitutive Equation of Unsaturated Soil

Frelund and Rahardjo extended Terzaghi’s effective stress principle by incorporating the gas phase, resulting in the constitutive equation for unsaturated soil as follows
Δ σ = D Δ ε D m H u a u w + Δ u a
m H = 1 H , 1 H , 1 H , 0
where {Δσ} is the stress increment matrix, [D] is the soil constitutive matrix, {Δε} is the strain increment matrix, H is the unsaturated soil modulus for soil structure with respect to matrix suction, ua is pore gas pressure, uw is pore water pressure, and {Δua} is the pore gas pressure increment.

2.3. Seepage and Stress Coupling Governing Equation

In seepage-stress coupling calculations, the soil equilibrium equation and the seepage control equation are solved simultaneously. The stress field calculation involves solving for the increments in displacement at the nodes, while the seepage field calculation involves solving for the values of the water head at the nodes. That is, in coupled calculations, the simultaneous solution of Equations (6) and (7) yields the increments in displacement {Δδ} and increments in the pore water pressure {Δuw}, which serve as the fundamental variables for the stress field and the seepage field, respectively.
K Δ δ + L d Δ u w = Δ F
β [ L f ] { Δ δ } ( Δ t γ w [ K f ] + ω [ M N ] ) { Δ u w } = Δ t ( { Q } | t + Δ t + 1 γ w [ K f ] { u w } | t )
K = B T [ D ] [ B ] L d = B T [ D ] m H N K f = B T K w B M N = N T N L f = N T { m } [ B ]
where [K] is the stiffness matrix, [B] is the strain matrix, [Ld] is the coupling matrix, N is the row vector of the shape function, [ΔF] is the increase in the nodal external load, β is the volumetric strain coefficient, [Lf] is the fluid coupling matrix, [Kf] is the element stiffness matrix, [Kw] is the permeability coefficient matrix, ω is the coefficient of the pore water pressure, and [MN] is the mass matrix.

3. Numerical Model of a CWRD

3.1. Summary of the Project

A PSPS functions as a daily regulation facility. The power station comprises four units with a total installed capacity of 1000 MW, including the upper and lower reservoirs, a water transmission system, an underground plant, a ground switching station, a central control building, and additional facilities. This research selected the CWRD of the lower reservoir as the research object. The dam section is mainly divided into Rockfill I, the transition layer, the filter layer, the clay core wall, Rockfill II, and the dam’s foundation. The reservoir has a capacity of 5.728 million m³, with a normal storage level of 78.90 m, a maximum storage level of 80.60 m, a normal operational water subsidence level for power generation of 58.00 m, and a dead water level of 57.00 m. The crest of the dam stands at an elevation of 83.40 m, with a maximum height of 50.4 m, a span of 485.8 m, and a width of 8.0 m. The upstream slope is designed with a ratio of 1:2.0, and the downstream slope has a ratio of 1:2.5, as illustrated in Figure 1.
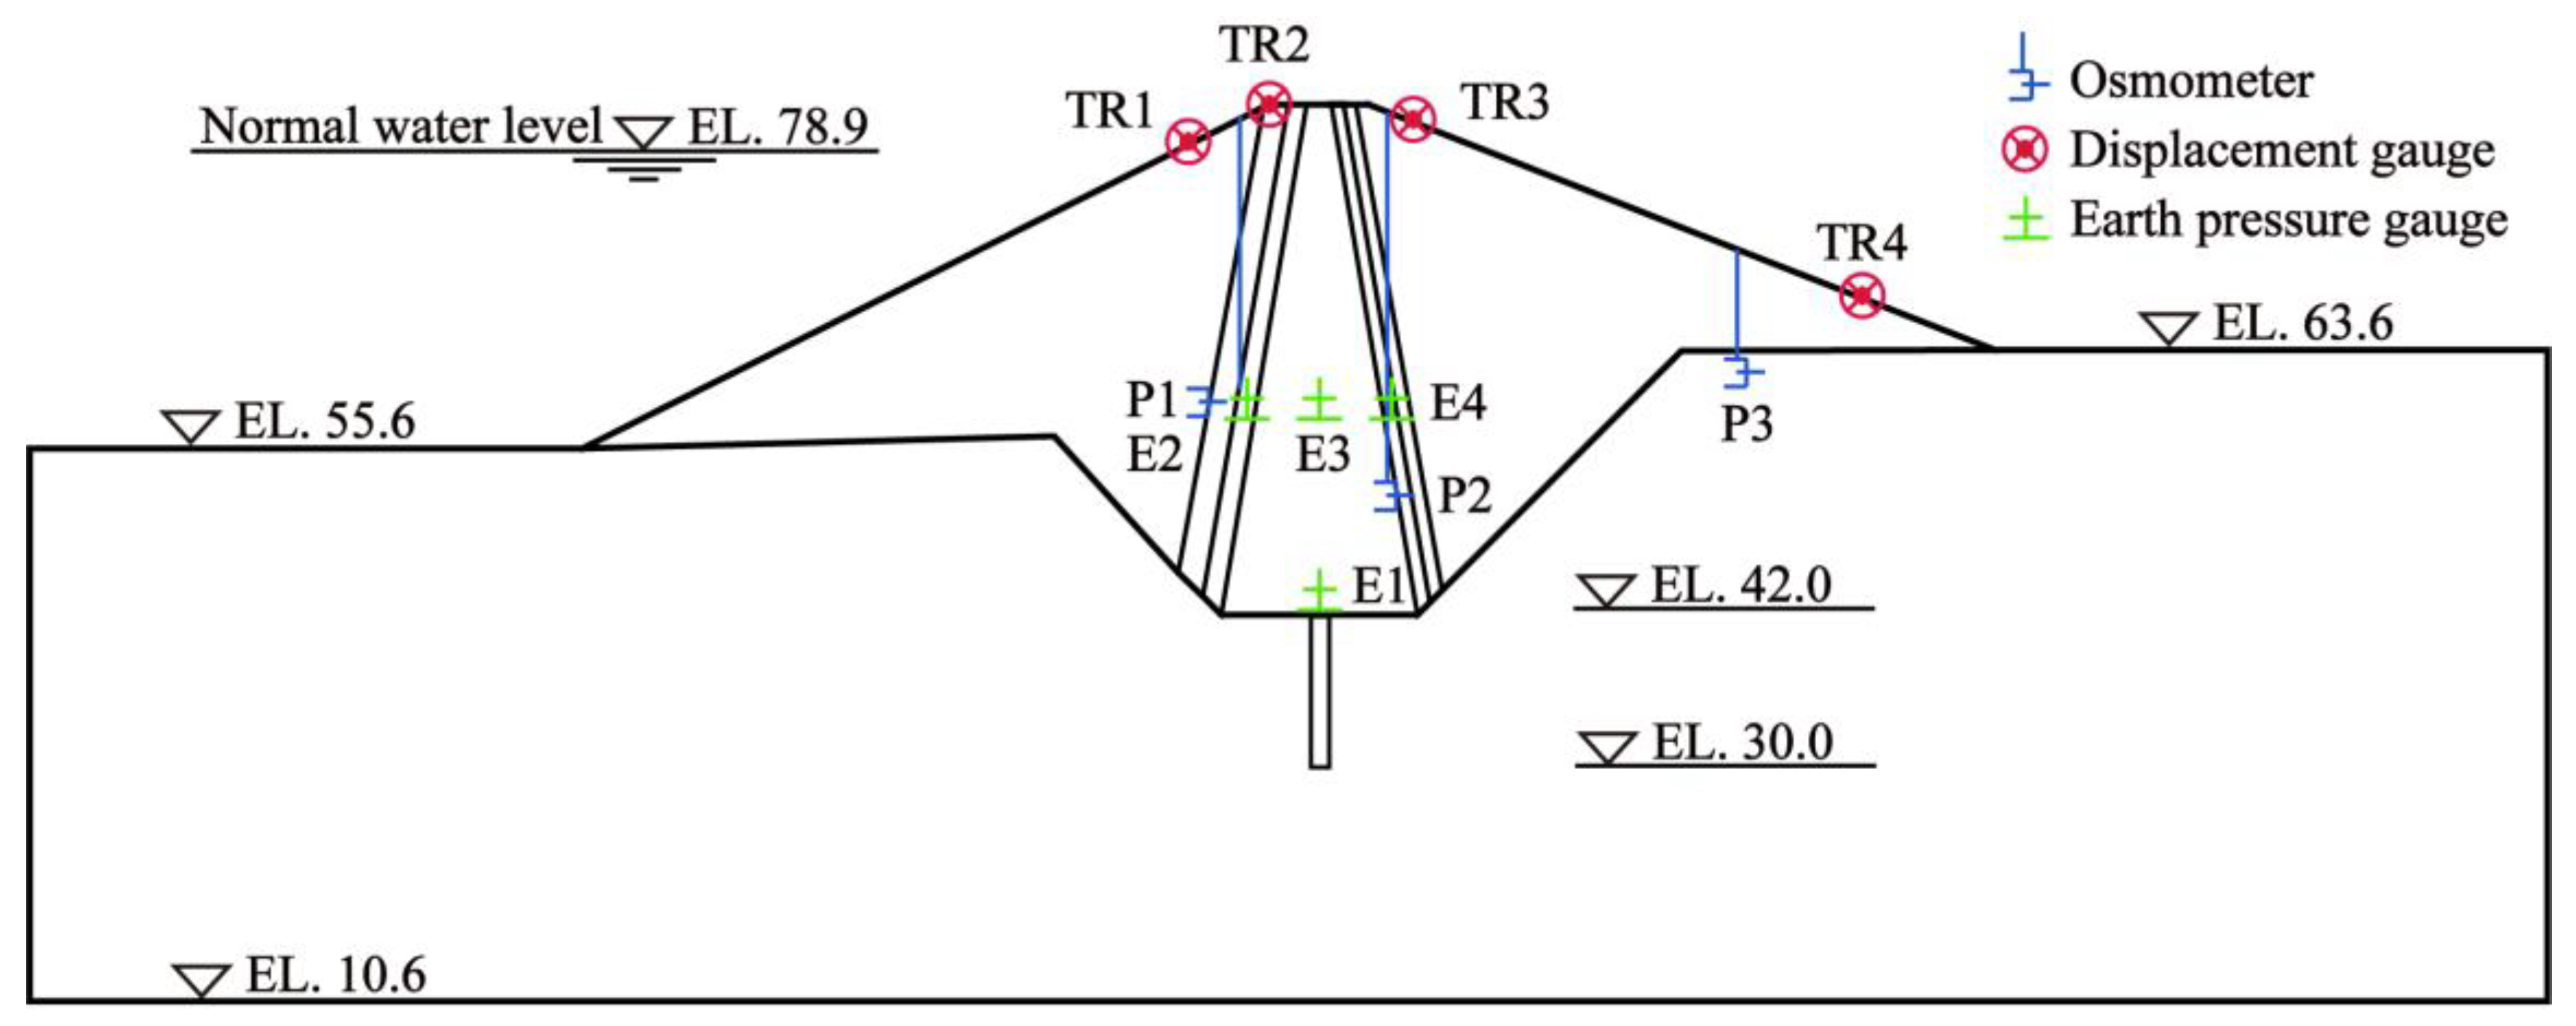
In order to facilitate monitoring of the safety of the CWRD, a seepage and deformation monitoring control network encompassing the entire project’s scope has been established. The monitored data include surface deformation, vertical earth stress, and seepage within both the dam’s body and its foundation. This study focused on a typical section for analysis, equipped with three seepage piezometers, four displacement gauges for surface deformation, and four earth pressure gauges, as depicted in Figure 2.

3.2. Material Parameters and Boundary Conditions

The stress–strain relationships of Rockfill I, the transition layer, the filter layer, the clay core wall, Rockfill II, and the dam’s foundation were characterized using the Duncan–Chang E-B model. The materials’ physico–mechanical parameters were derived from triaxial compression tests and are detailed in Table 1. The curtain grouting was represented by a linear elastic model, with a bulk density of 24 kN/m³, an elastic modulus of 28 GPa, and a Poisson’s ratio of 0.167.
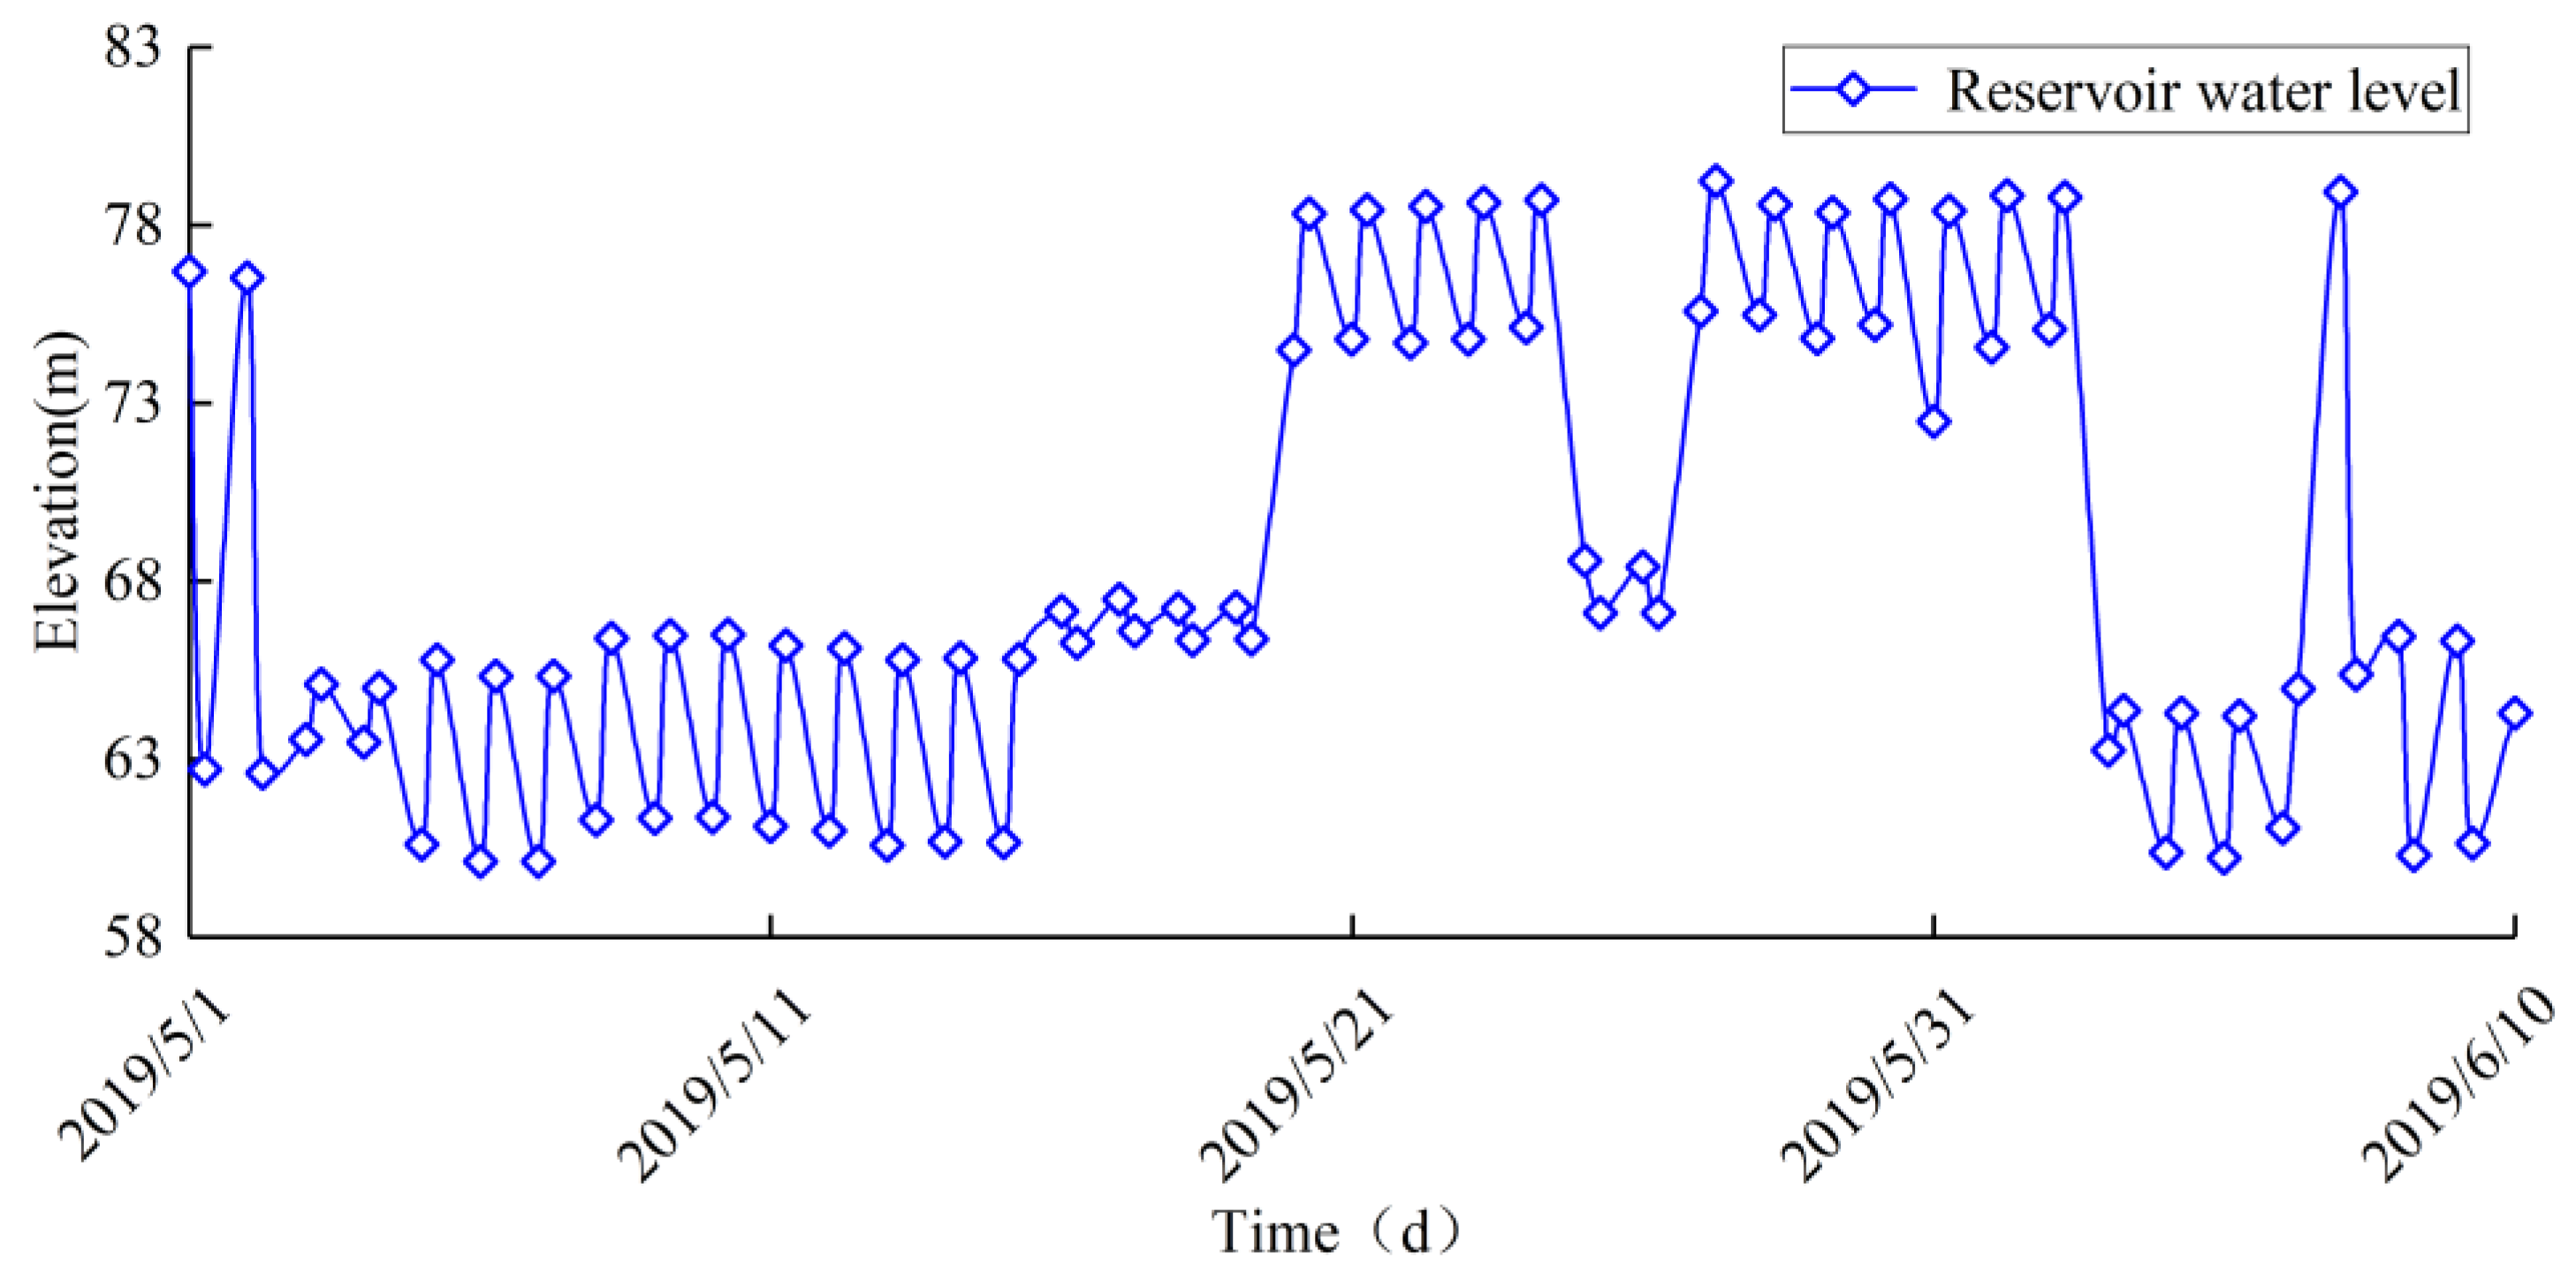
The time period exhibiting the most significant fluctuation in the reservoir’s water level was chosen as the condition for calculation. Consequently, the recorded water levels from 1 May to 10 June 2019 served as the boundary condition for the upstream slope of the dam in the finite element model, with the temporal variation depicted in Figure 3. Analysis of the figure revealed that on 1 May 2019, the reservoir’s water level stood at 76.70 m; by 6 May, it had dropped to a minimum of 60.13 m; and by 27 May, it had increased to a maximum of 79.25 m. The sharpest decline in the water level was observed on 2 June, with a rate of 15.53 m/d, reaching a water level of 63.26 m. The most rapid increase occurred on 7 June, at a rate of 17.87 m/d, reaching a water level of 78.93 m.

3.3. Process of Numerical Simulation

Numerical analyses of the seepage, stress, and displacement fields within the CWRD were executed through the SEEP/W and SIGMA/W modules of finite element modeling software. The numerical simulation process entailed, first, inputting the seepage parameters for each zone of the dam into the SEEP/W module, and incorporating the hydraulic boundary of the reservoir’s water level for steady-state seepage analysis to determine the initial seepage field. Second, it involved importing the initial seepage field from the previous step into the SIGMA/W module, inputting the stress parameters for each zone of the dam, and adding the stress boundary of the reservoir’s water level for in-situ stress analysis. Third, it involved selecting consolidation within the SIGMA/W module as a subcategory of the initial stress field, adding both hydraulic and stress boundary conditions for the reservoir’s water level based on operational scenarios, and conducting seepage–stress coupling analysis to acquire the transient seepage and stress fields. Finally, the process involved plotting cloud diagrams of the pore water pressure, displacement, and vertical soil pressure in the results.

4. Results of Numerical Simulation and Analysis of Monitoring Data

4.1. Analysis of the Seepage Field

4.1.1. Analysis of the Results of Simulating Pore Water Pressure

Figure 4 displays the cloud diagrams of pore water pressure at various typical moments. From Figure 4a, it can be observed that at the initial moment with the reservoir’s water level at 76.70 m, the pore water pressure exhibited a uniform stratified distribution. The infiltration line in the core wall decreased significantly, aligning with the general principles of seepage. From Figure 4b, it can be noted that the decrease in the infiltration line within the core wall is reduced, and a transient saturated zone formed above the infiltration line in Rockfill I when the reservoir’s water level abruptly dropped on 6 May. A hysteresis occurred in the infiltration line’s decline within Rockfill I, generating a significant hydraulic gradient in Rockfill I. The reduction in the static water pressure on the dam’s slope led to an increase in excess pore water pressure and seepage force, which was directed outward from the slope. This resulted in a reverse seepage field on the surface of the dam’s slope, exerting an outward dragging force, thereby amplifying the down-sliding force on the dam’s slope and adversely affecting its stability. From Figure 4c, it is evident that a transient saturated zone emerged above the infiltration line in Rockfill II following an abrupt rise in the reservoir’s water level. This occurred as rock piles possess inherent porosity and permeability, allowing water to flow through their interstices. An abrupt increase in the reservoir’s water level elevated the water pressure, forcing water into the rock piles’ interiors and filling the pore spaces, culminating in the transient saturation of the rockfill.

4.1.2. Analysis of the Monitoring Data of Seepage Pressure

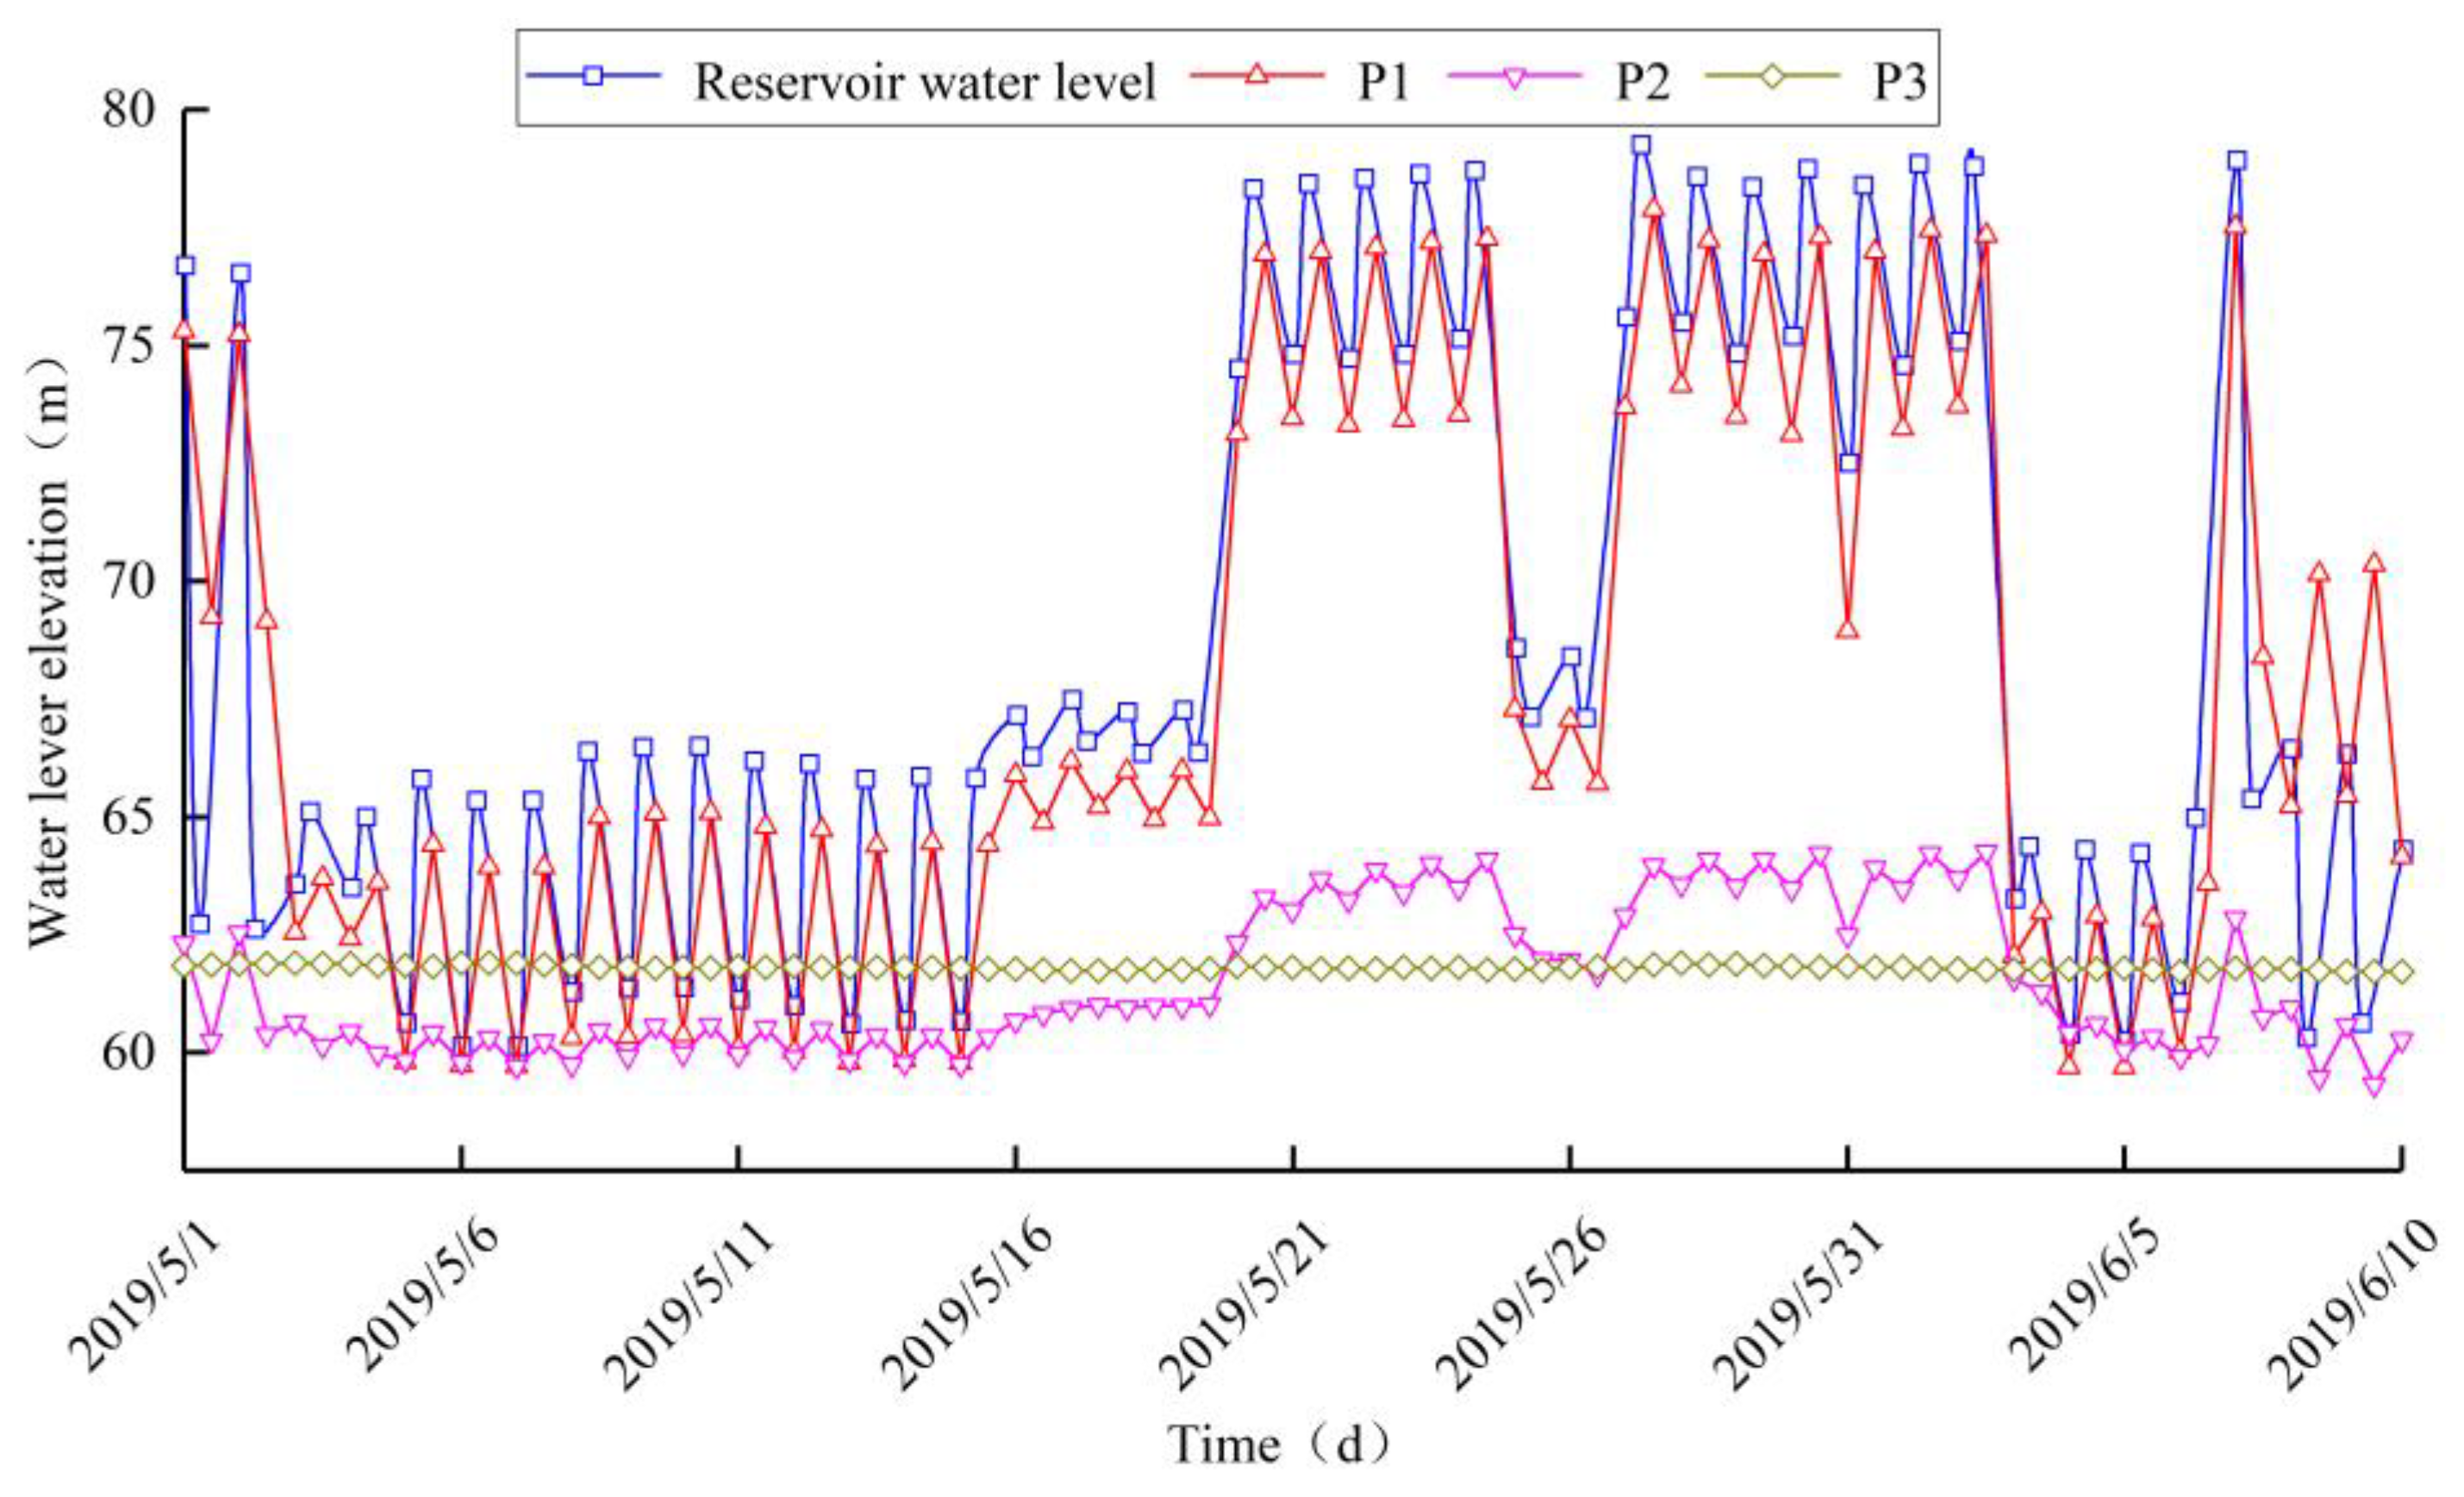
On the upstream side of the dam, one osmometer was installed, while two osmometers were positioned on the downstream side, as detailed in Figure 2, while Figure 5 displays the measured water level of these osmometers. In Figure 5, it is evident that the changes in the water level in the P1 osmometer and the reservoir are positively correlated, with the water level in the P1 osmometer exhibiting only a minor decline. Due to hysteresis in the infiltration line following a drop in the reservoir’s water level, on 2 May, the reservoir’s water level decreased to 62.61 m, resulting in the P1 osmometer’s water level being higher than that of the reservoir. After the reservoir’s water level rose to 65.10 m on 3 May, the water level measured by the P1 osmometer was lower than that of the reservoir, subsequently fluctuating in accordance with the changes in the reservoir’s water level. The P2 osmometer’s water level showed a significant drop compared with the reservoir’s water level, with a potential decline of approximately 87%. The correlation between the changes in the P2 osmometer and fluctuations in the reservoir’s water level was generally weak. The water level of the P3 osmometer was largely unaffected by the reservoir’s water level, primarily due to the anti-seepage effect of the core wall. Given that the P2 osmometer’s water level fluctuated with the sudden changes in the reservoir’s water level, the P3 osmometer’s water level was occasionally higher than that of P2, despite P3 being positioned downstream relative to the reservoir’s water level. The head drop was concentrated within the core wall, with a maximum decrease of 14.65 m. The head drop within the upstream and downstream rockfills was only 0.47 to 2.26 m, indicating that the upstream and downstream rockfills have a minimal impact on the head drop.
Table 2 presents a comparison between the osmometers’ measured water level and the finite element model’s calculation of the phreatic line. It can be observed that the discrepancies between monitored values at various moments and the model’s calculations of the phreatic line were less than 0.5 m, indicating the high accuracy of the finite element model.

4.2. Analysis of the Stress Field

4.2.1. Analysis of the Results of Simulating Vertical Soil Pressure

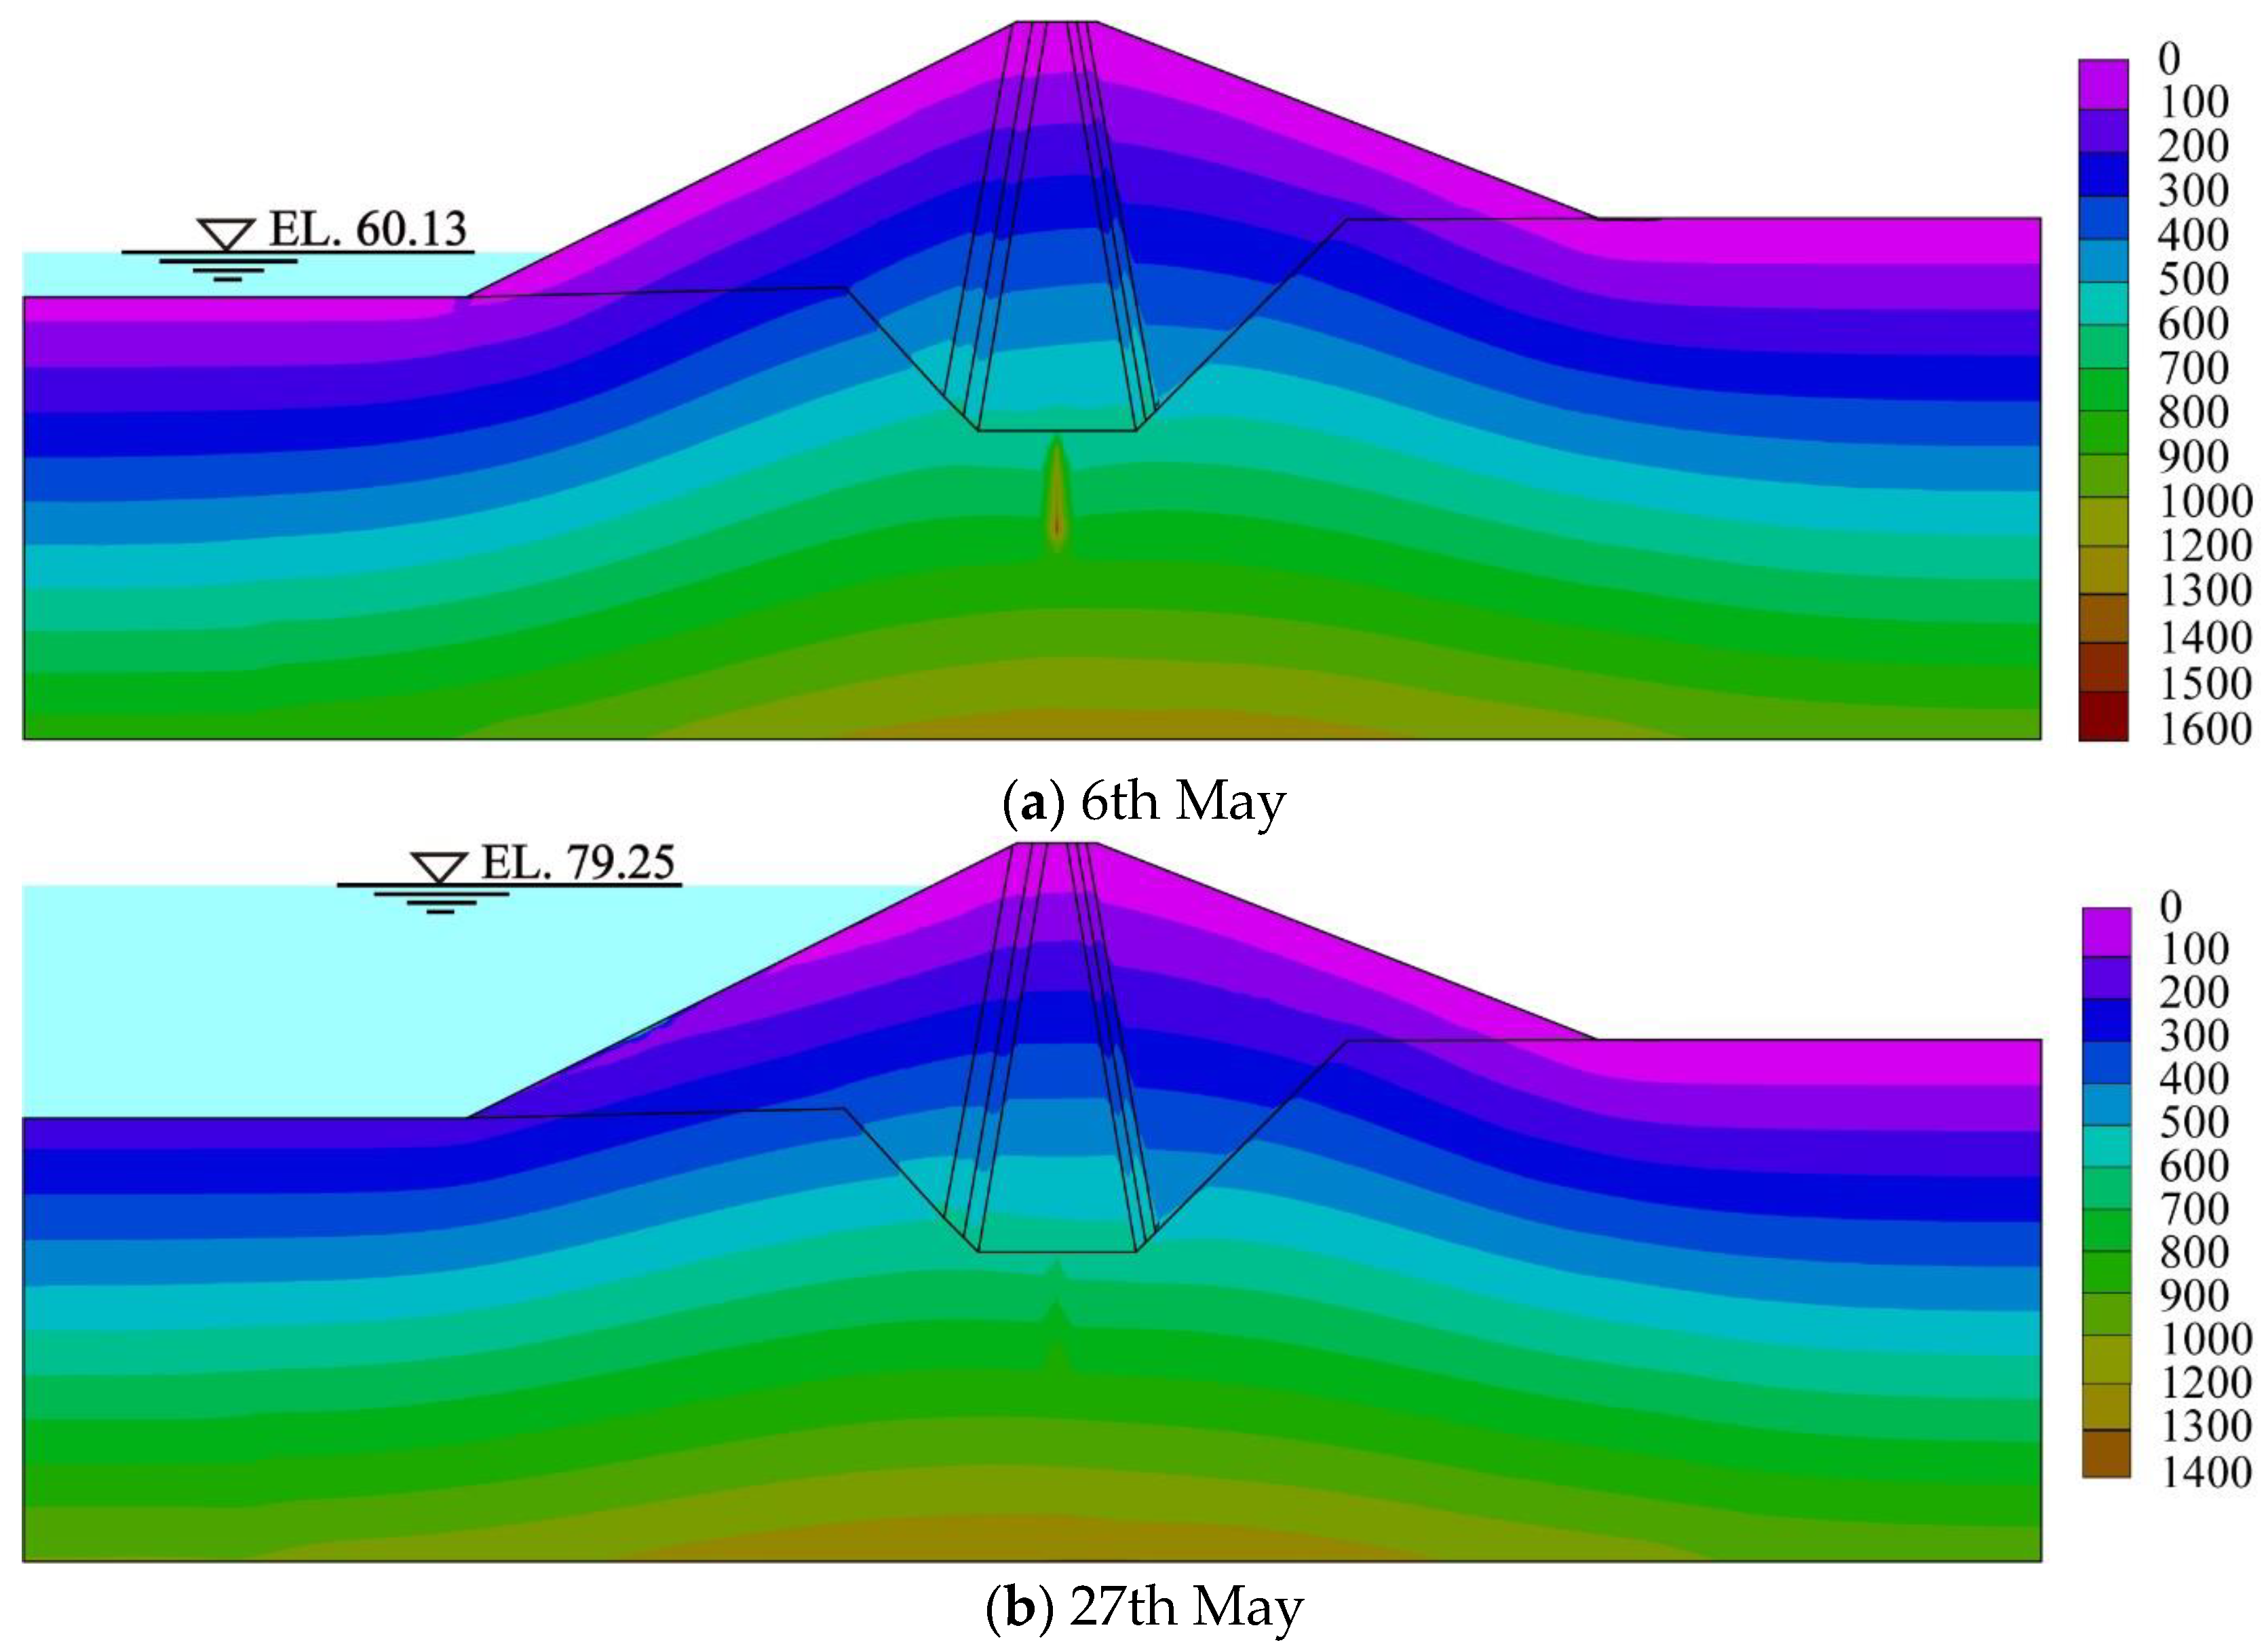
Figure 6 shows the cloud maps of vertical soil pressure at different typical moments. It can be seen from Figure 6a that when the reservoir’s water level plummeted, the vertical stress of the curtain grouting experienced a significant concentration of stress, with a maximum value of 1.6 MPa, an increase of about 0.8 MPa compared with the initial moment. This was mainly because the curtain grouting, which originally bore substantial water pressure at a high water level, experienced a rapid reduction in pressure. This led to the redistribution of stress between the curtain and the surrounding body of the dam, resulting in the concentration of stress. The arch effect in the core wall was apparent, a crucial characteristic of the distribution of stress in CWRDs. Because the deformation modulus of the core wall’s material was lower than that of the upstream and downstream rockfills, the core wall deformed more, whereas the upstream and downstream rockfills deformed less. This deformation mismatch can lead to a redistribution of stress. The stress of the core wall transferred to the two sides of the rockfill, resulting in the vertical stress of the core wall being lower than the dead weight stress, while the vertical stress of the rockfill on both sides of the core wall was higher than the dead weight stress. The arch effect of the core wall can significantly reduce the compressive stress within the core wall, which is a primary reason for the hydraulic splitting of the core wall. It is evident from Figure 6b that when the reservoir’s water level rose abruptly, a significant concentration of stress occurred at approximately one-third the height of the upstream slope of the dam, with a maximum value of 0.9 MPa, an increase of about 0.8 MPa. This concentration of stress continued to increase with repeated sudden rises and drops in the reservoir’s water level. The concentration of stress in the curtain grouting disappeared, and the vertical earth pressure decreased from 1.6 MPa to 0.8 MPa.

4.2.2. Analysis of the Monitoring Data of Vertical Soil Pressure

At the bottom of the core wall (elevation: 42.00 m), the middle of the core wall, the upstream filter layer, and the downstream filter layer (all at an elevation of 61.00 m), earth pressure gauges were installed to monitor the vertical earth pressure of the dam, as depicted in Figure 2. Figure 7 compares the simulated values of vertical earth pressure with the monitored values. The figure indicates that the values of vertical earth pressure simulated by the finite element model followed the same trend as those measured by the earth pressure gauges, with negligible differences. Moreover, the gauges’ measured vertical earth pressure at various locations were positively correlated with changes in the reservoir’s water level. Comparing the earth pressure gauges (E1, E3) at different elevations showed that the pressure at the core wall’s bottom (E1) exceeded that midway up (E3), influenced by rapid fluctuations in the reservoir’s water level. The main reason was that the soil at the bottom of the core wall exhibited a higher initial density and smaller porosity due to the influence of gravity and pressure from the overlying soil, and its permeability was lower than that in the middle of the core wall. As a result, when the water level changed, the adjustment speed of pore water pressure in the soil at the bottom of the core wall was slower than in the middle of the core wall, resulting in more significant changes in soil pressure at the bottom of the core wall. At the same elevation, the earth pressure gauges (E2, E4) situated in the upstream and downstream filter layer registered lower measurements compared with the gauge (E3) within the core wall, attributable to the arching effect produced by the lateral compression of the rockfill against the core wall. The fluctuation in earth pressure was most pronounced at gauge E2 and least at gauge E4, indicating that the impact of changes in the reservoir’s water level on the dam’s vertical earth pressure diminished from upstream to downstream.

4.3. Analysis of the Displacement Field

4.3.1. Analysis of the Results of Simulating Horizontal Displacement and Settlement

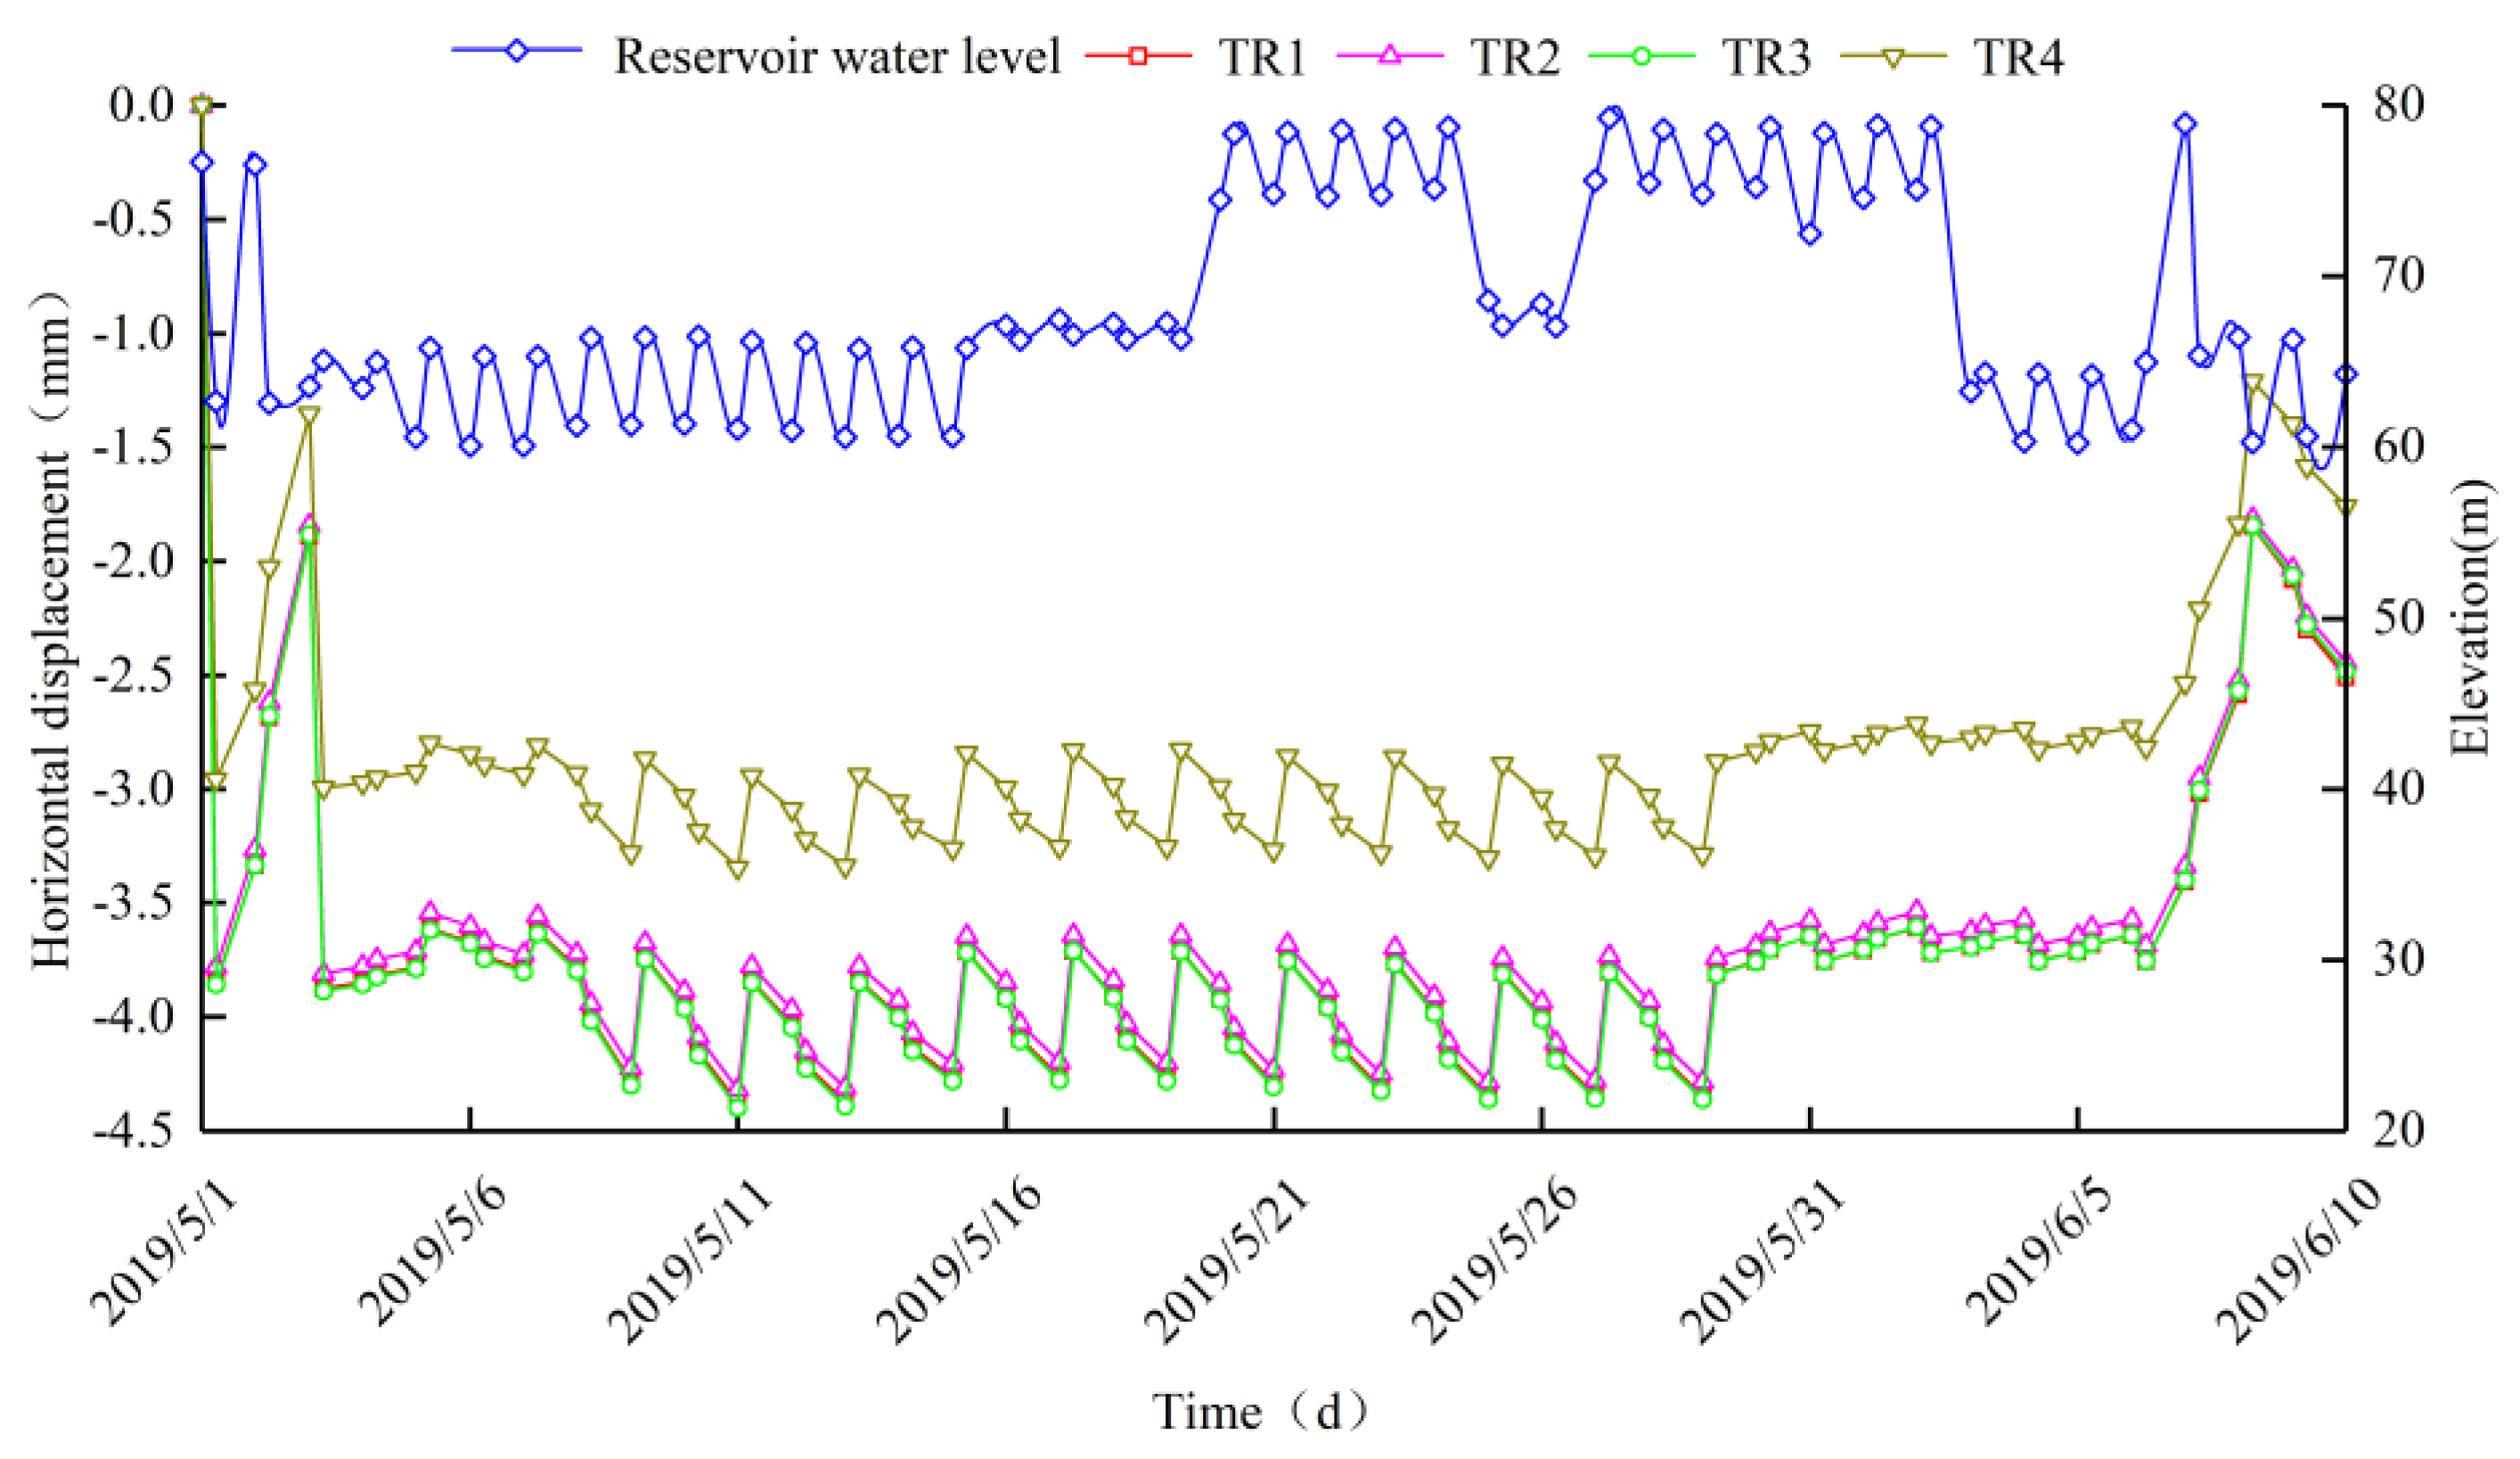
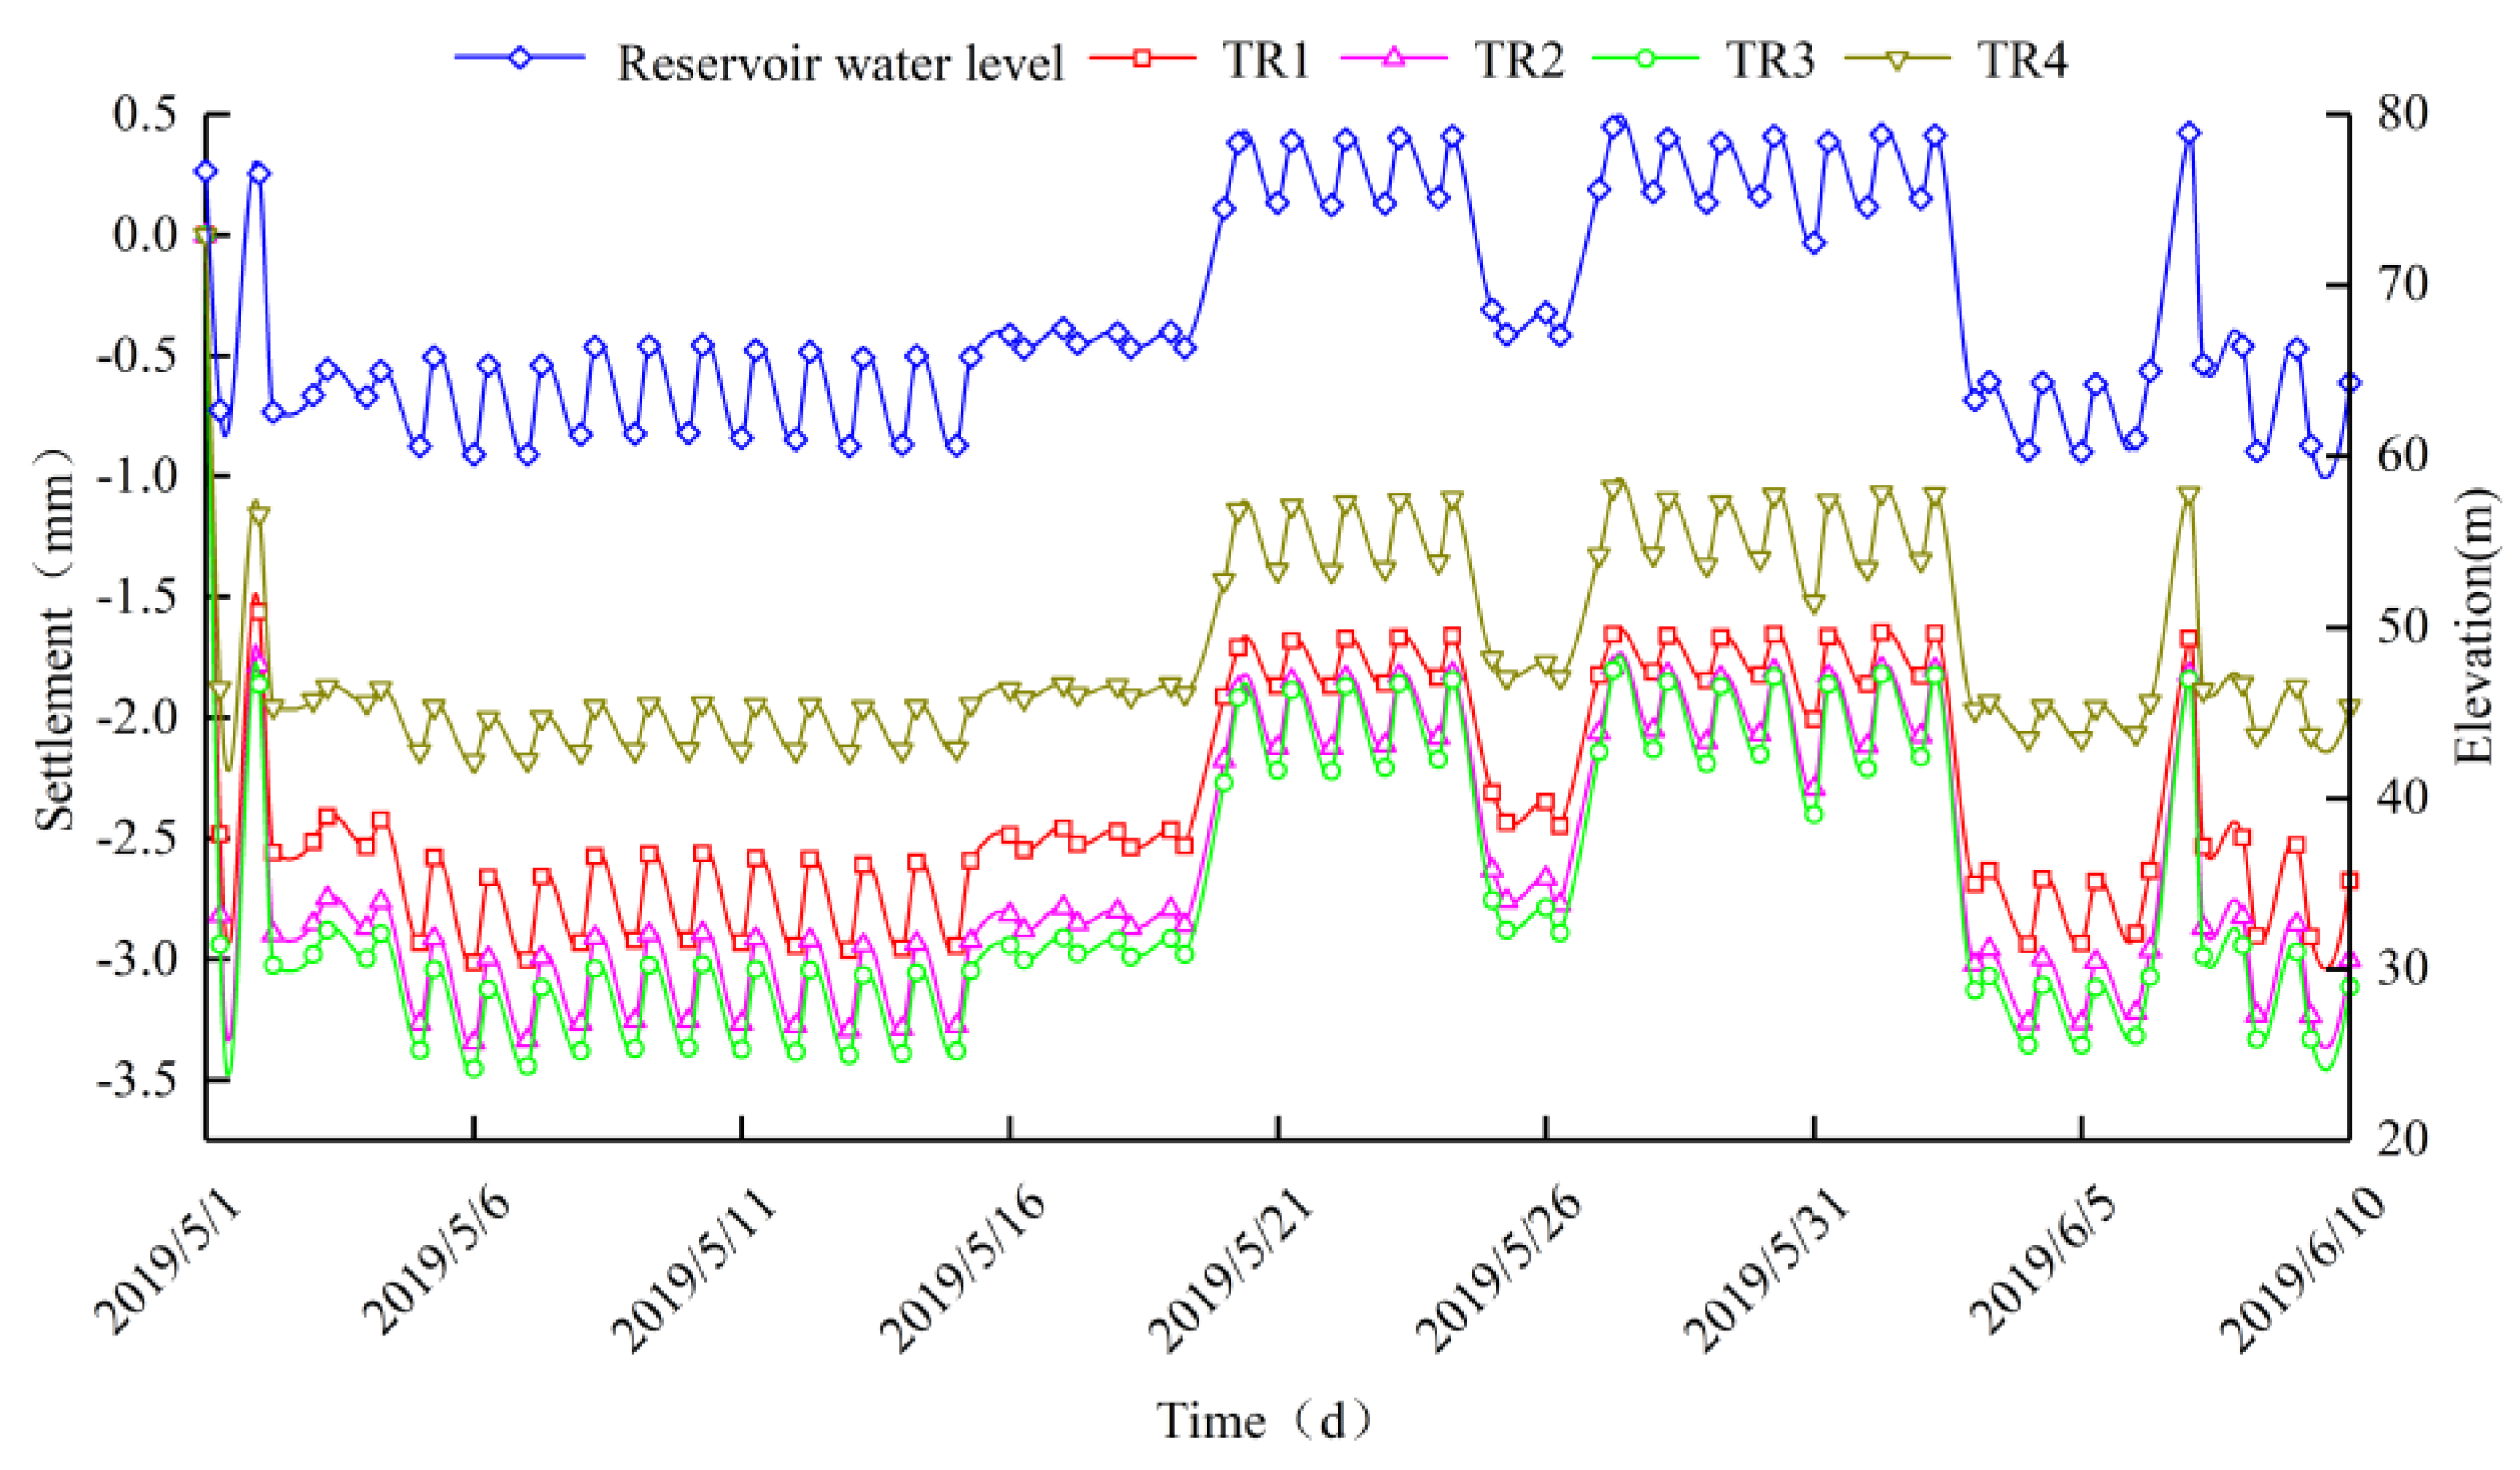
Calculations of the dam’s deformation were performed, based on the principle of seepage–stress coupling, identifying feature points on the finite element model that corresponded to the locations of measurement points TR1, TR2, TR3, and TR4. Figure 8 displays the time variation of the increases in horizontal displacement, while Figure 9 presents the time variation of increases in settlement. The figures illustrate that the impact of fluctuations in the reservoir’s water level on the dam’s horizontal displacement followed a descending order of TR3 ≥ TR1 > TR2 > TR4, while the effect on the dam’s settlement was ranked as TR3 > TR2 > TR1 > TR4. The horizontal displacement and settlement of the dam’s surface were significantly affected by the reservoir’s water level, and there was a lag phenomenon. Depending on the axis of the dam, the dam moves downstream (upstream) as the water level rises (falls). The faster the reservoir’s water level fluctuates, the greater the variation in both upstream and downstream sides’ horizontal displacement and settlement. Rapid fluctuations in the water level exerted a more pronounced effect on the deformation of the dam’s crest. Therefore, the safety inspection should concentrate on identifying and assessing cracks and voids at the dam’s crest.
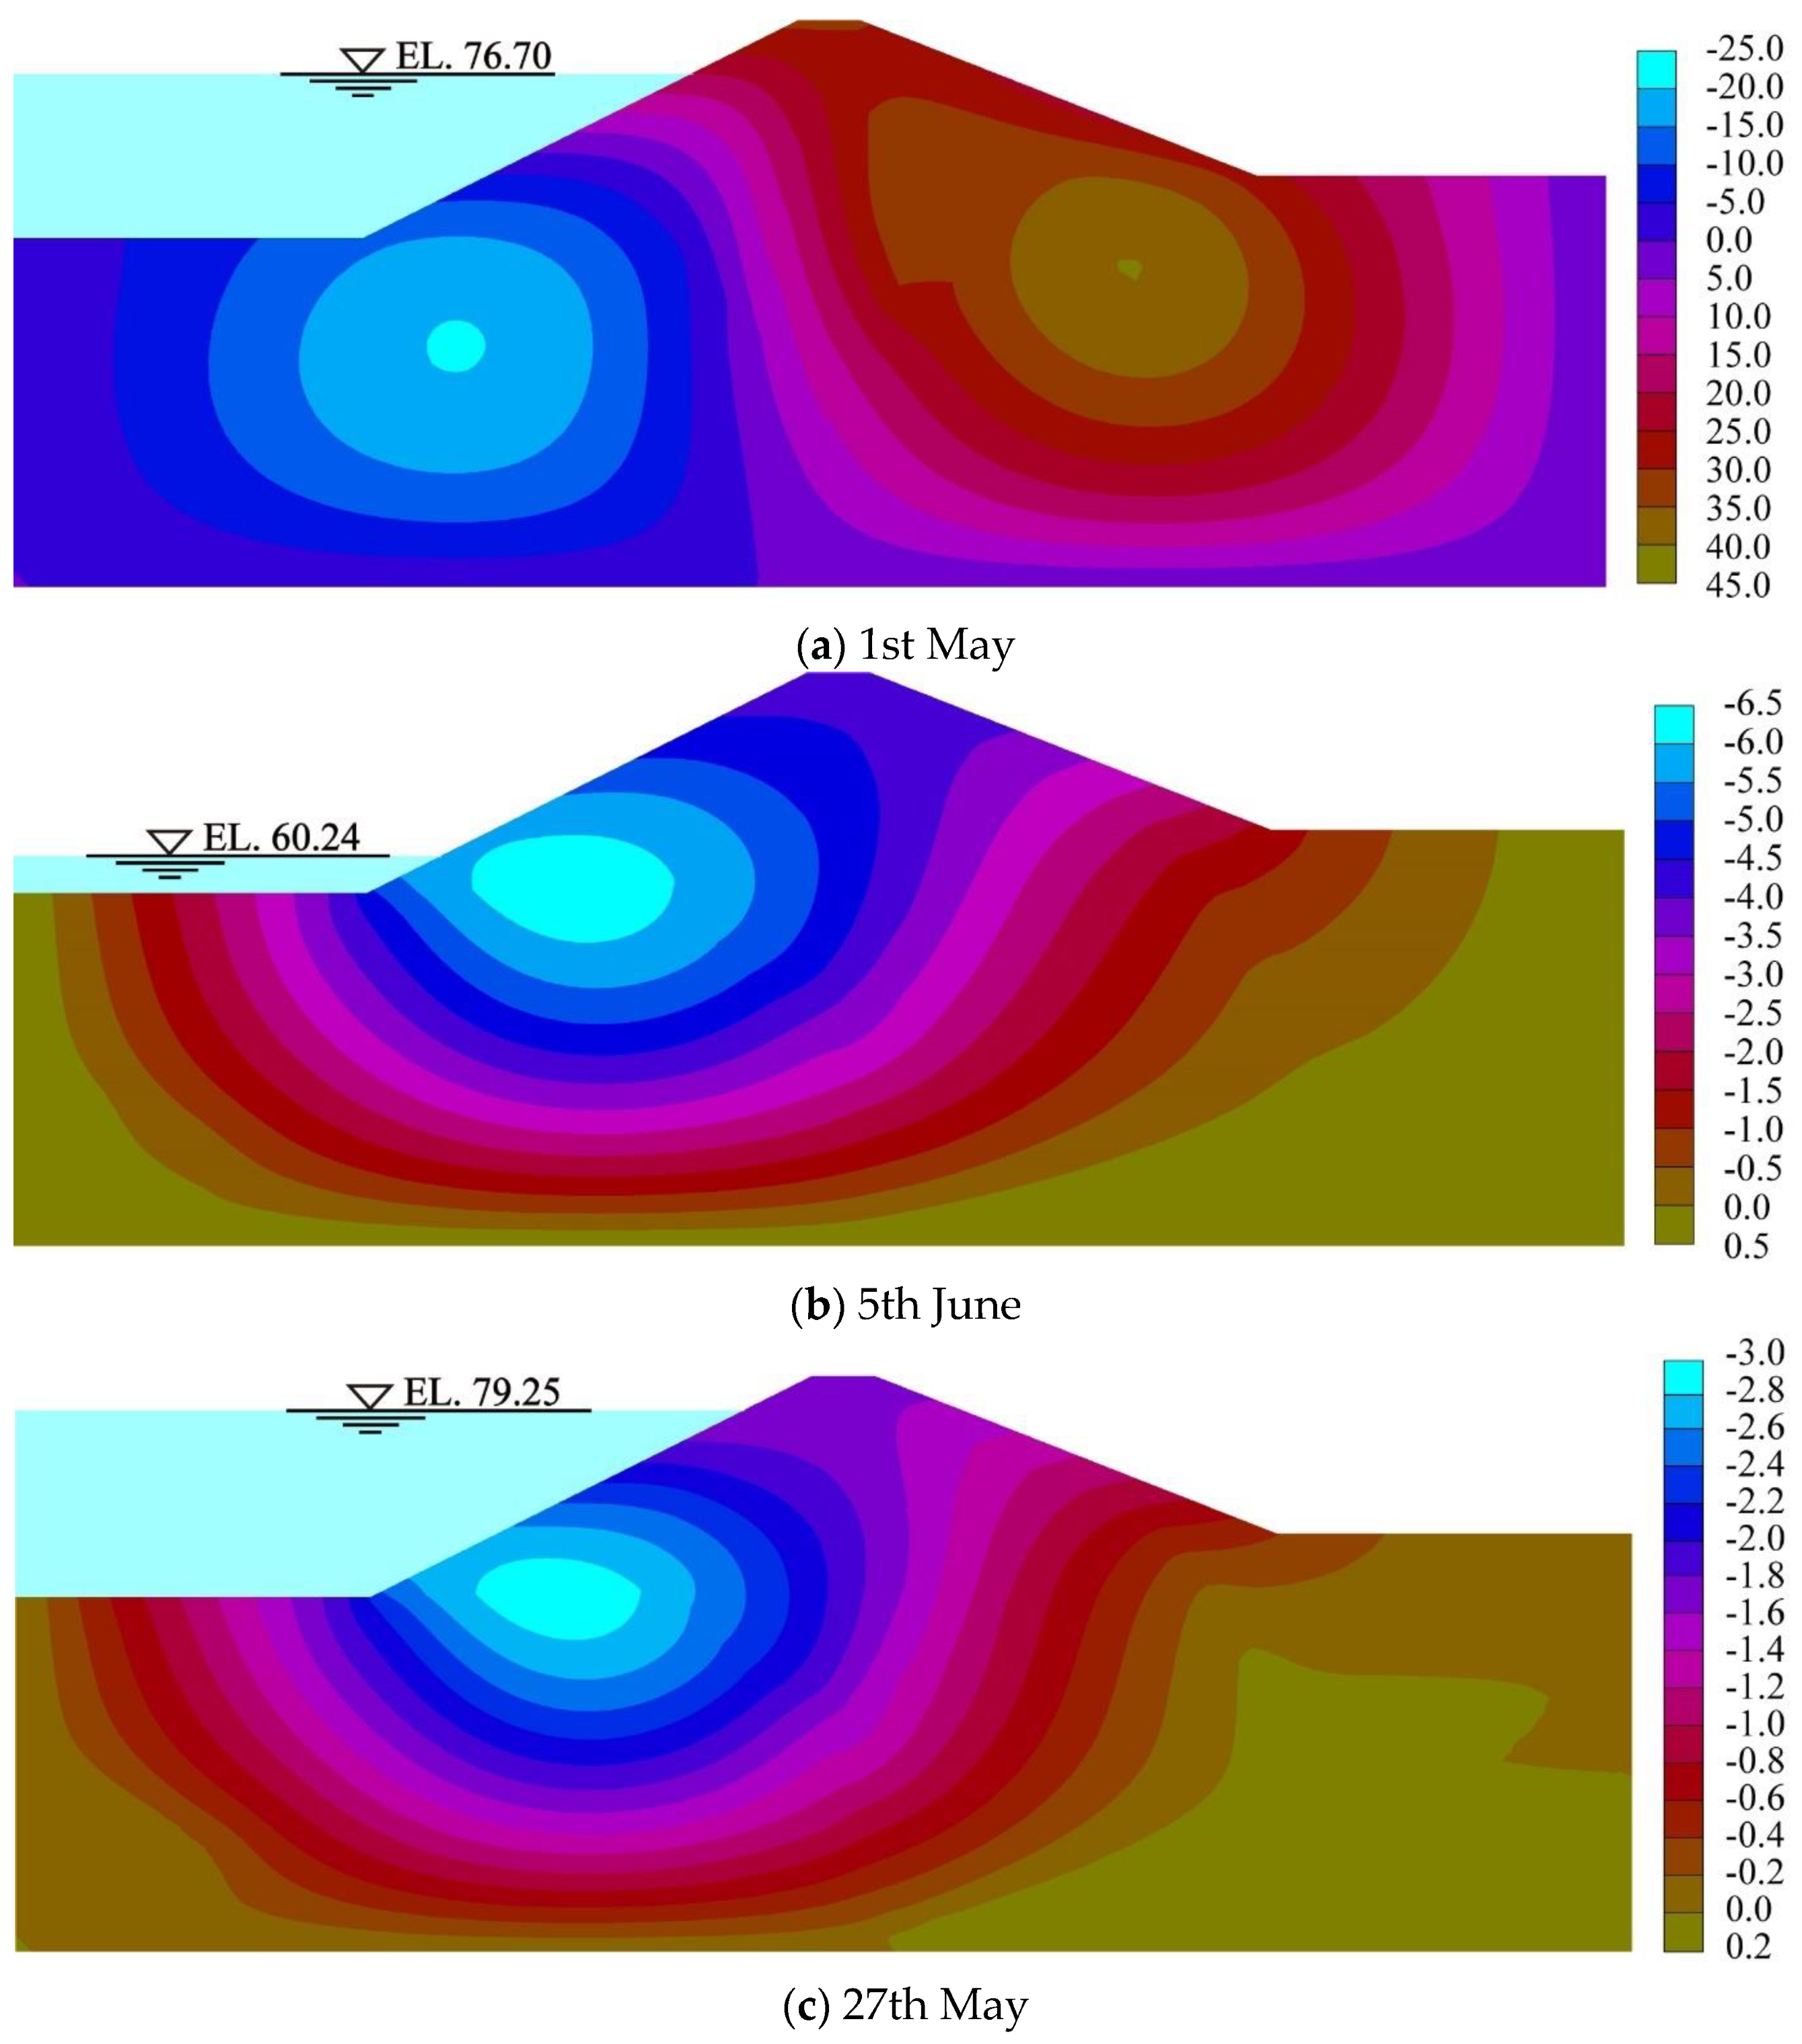
Figure 10 presents the cloud diagrams of the dam’s horizontal displacement at different typical moments. Figure 10a provides the cloud diagram illustrating the horizontal displacement of the dam when the reservoir water level initially stood at 76.70 m on 1 May. The figure reveals that the horizontal displacement of the dam was symmetrically distributed across the core wall. The maximum horizontal displacement observed on the upstream side of the dam was 25.0 mm, directed upstream, while on the downstream side, the maximum displacement was observed to be 45.0 mm in the downstream direction. The horizontal displacement of Rockfill I was less than that of Rockfill II, due to Rockfill II comprising a greater proportion of soft rock materials. Figure 10b presents the cloud diagram for the increases in the horizontal displacement of the dam when the reservoir’s water level was at 60.24 m on 5 June. The figure reveals that the contour of the increase in horizontal displacement formed a closed loop in the body of the upstream rockfill, with the largest horizontal displacement occurring within this loop, and it decreased progressively downstream. The rapid decline in the reservoir’s water level caused the entire dam’s horizontal displacement to orient upstream, with a maximum displacement of 6.5 mm located approximately one-third up the height of the dam in Rockfill I. The elevation at which maximum displacement occurred was nearly equivalent to the reservoir’s water level, located approximately 10 m from the upstream slope of the dam. Figure 10c displays the cloud diagram for the increase in horizontal displacement of the dam when the reservoir’s water level reached 79.25 m on 27 May. The figure reveals that the horizontal displacement toward the upstream on the upstream side of the dam diminished following the sudden increase in the reservoir’s water level, with the maximum displacement reducing to 3.0 mm.
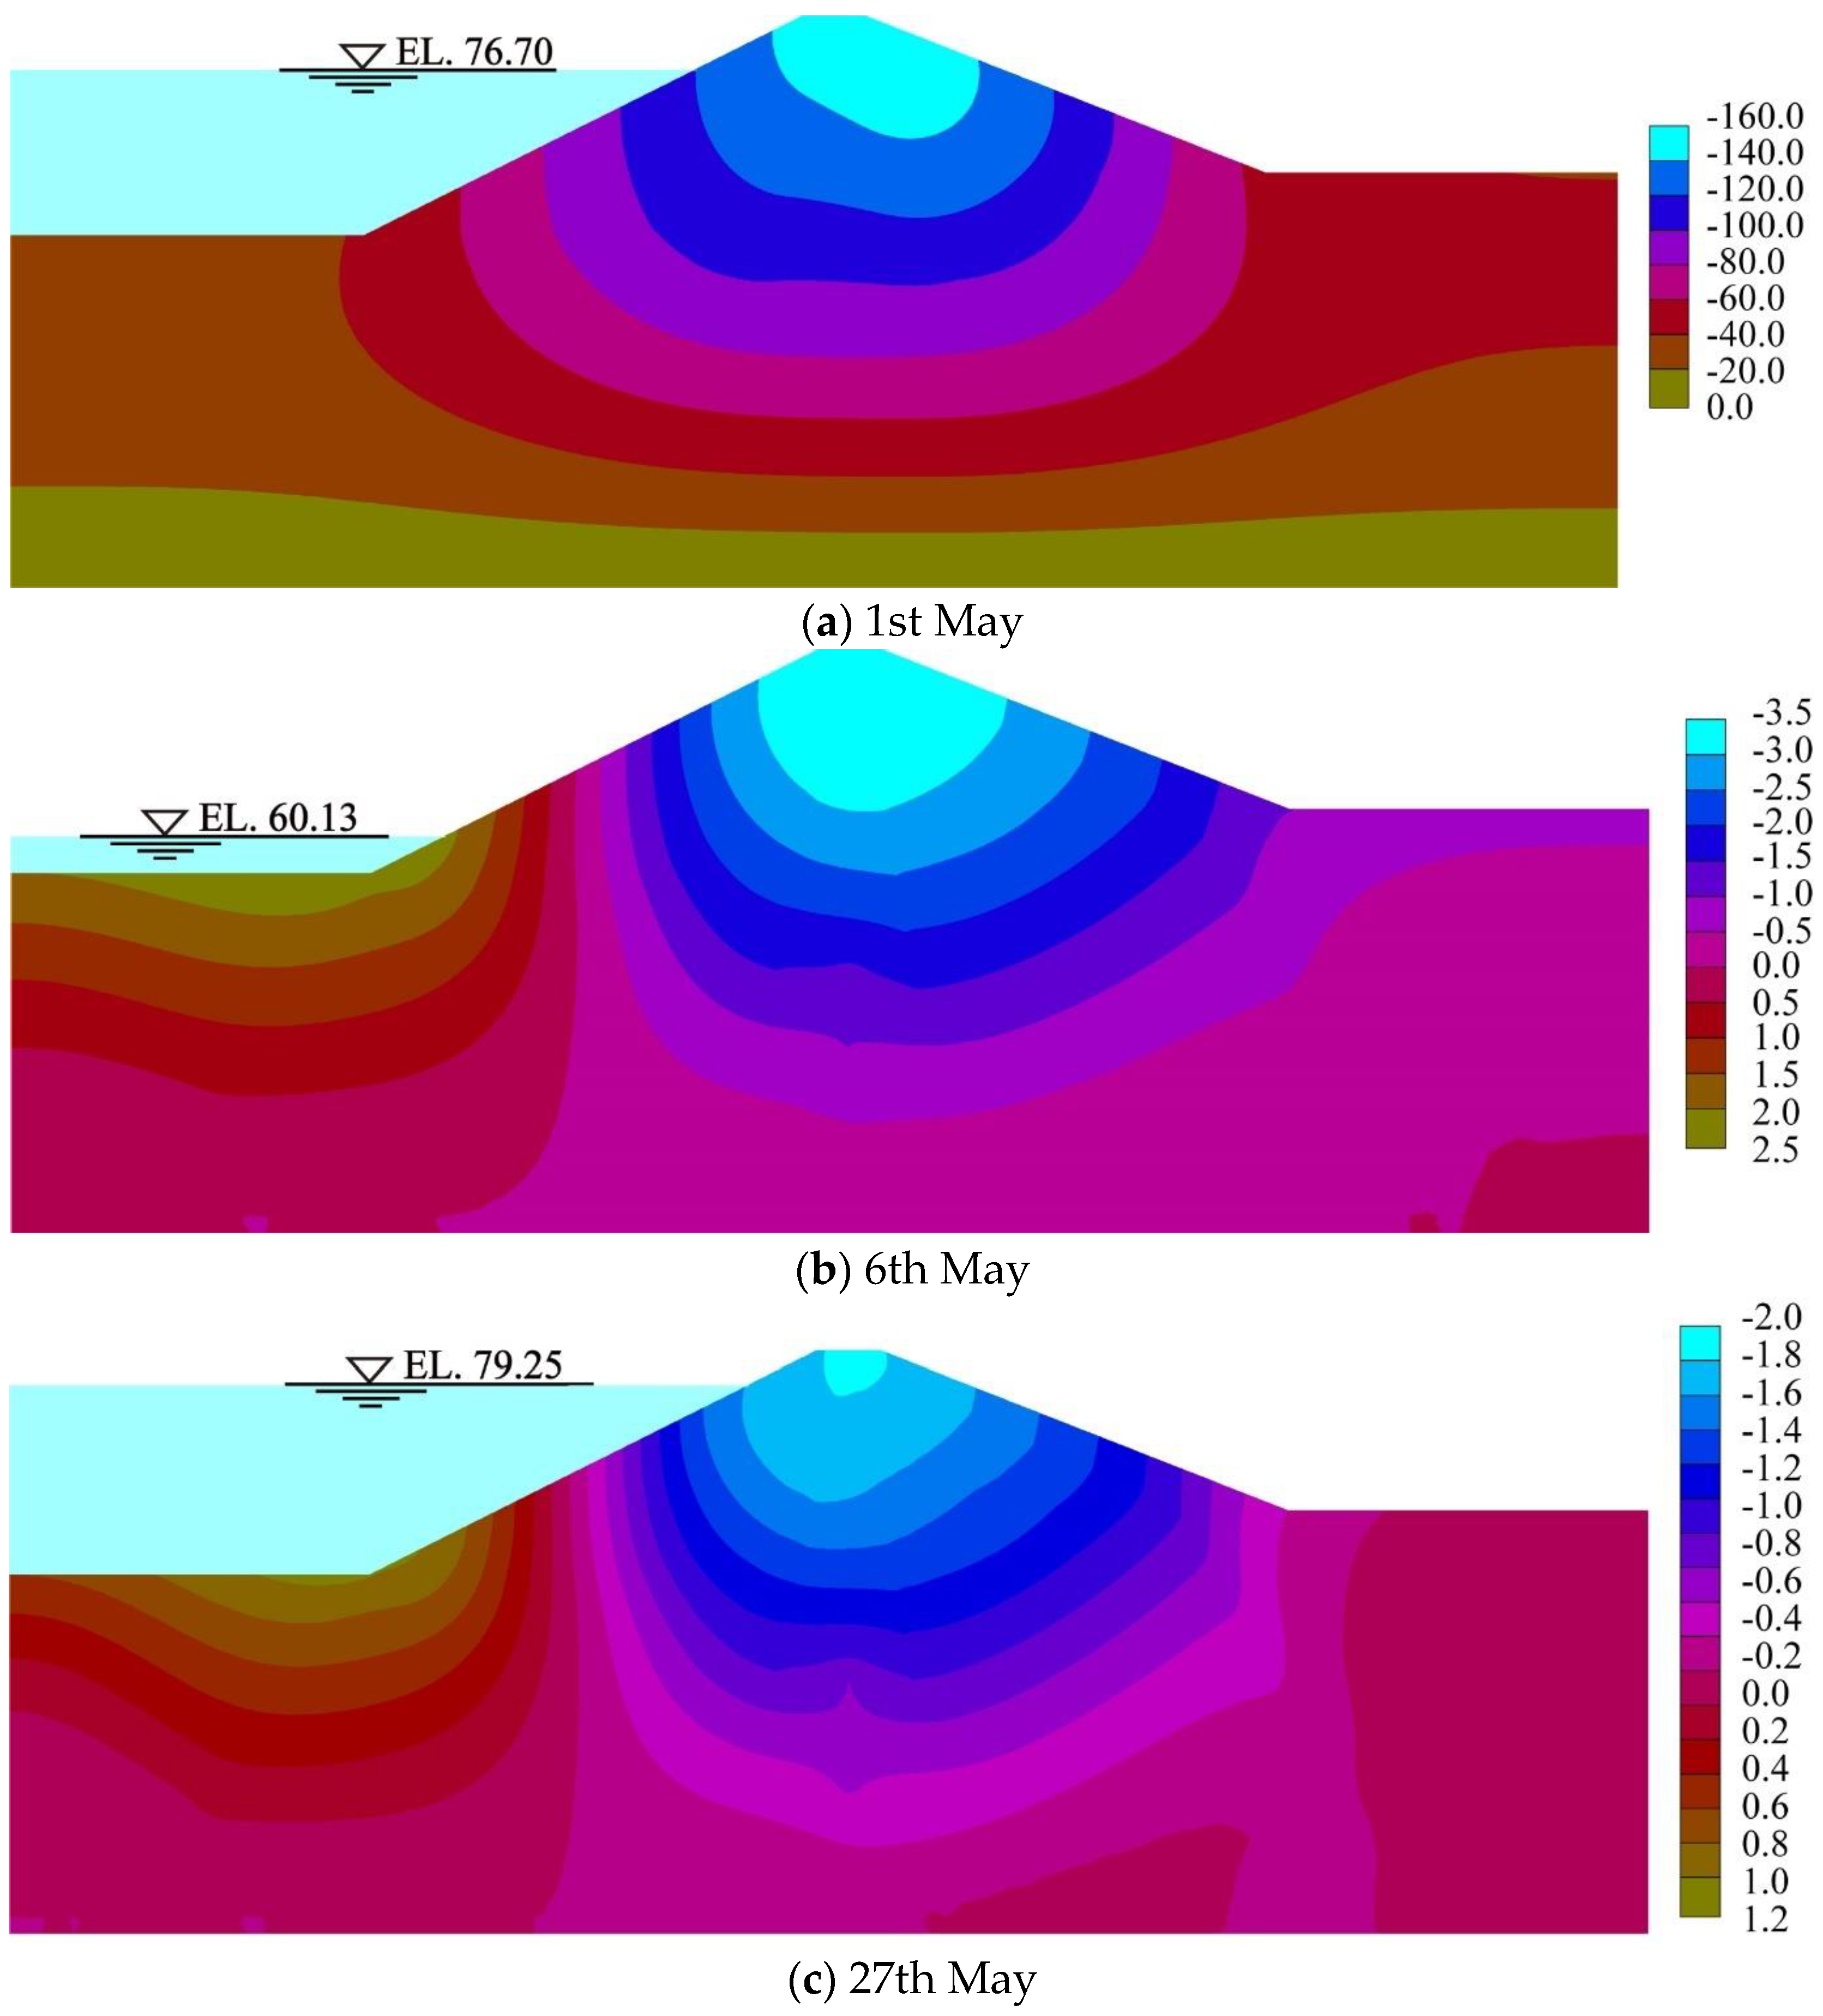
Figure 11 presents the cloud diagrams of the dam’s settlement at different typical moments. From Figure 11a, it can be observed that the influence of fluctuations in the reservoir’s water level on the dam’s settlement was less than that of horizontal displacement. The contour for the distribution of settlement formed a “U” shape and was approximately symmetrical along the core’s wall. A closed loop appeared near the dam’s top. The displacement gradient of the upstream slope of the dam was larger than that of the downstream slope of the dam, and the settlement gradually decreased from the dam’s crest to the dam’s foundation. The maximum settlement occurred at the dam’s crest, reaching 160 mm, with the ratio of maximum settlement to the dam’s height being less than 0.5%. Figure 11b displays the cloud diagram for the increase in the settlement of the dam on 6 May, when the reservoir’s water level was at 60.13 m. The diagram illustrates that the rapid decrease in the reservoir’s water level contributed to an ongoing increase in the settlement of the dam’s crest, reaching a maximum increase in settlement of 3.5 mm, while the upstream foundation of the dam experienced a lift, peaking at 2.5 mm. From Figure 11c, it is evident that the abrupt rise in the reservoir’s water level resulted in a decrease in the maximum incremental settlement at the dam’s crest to 2.0 mm, and the maximum lift at the upstream foundation of the dam also reduced to 1.2 mm.
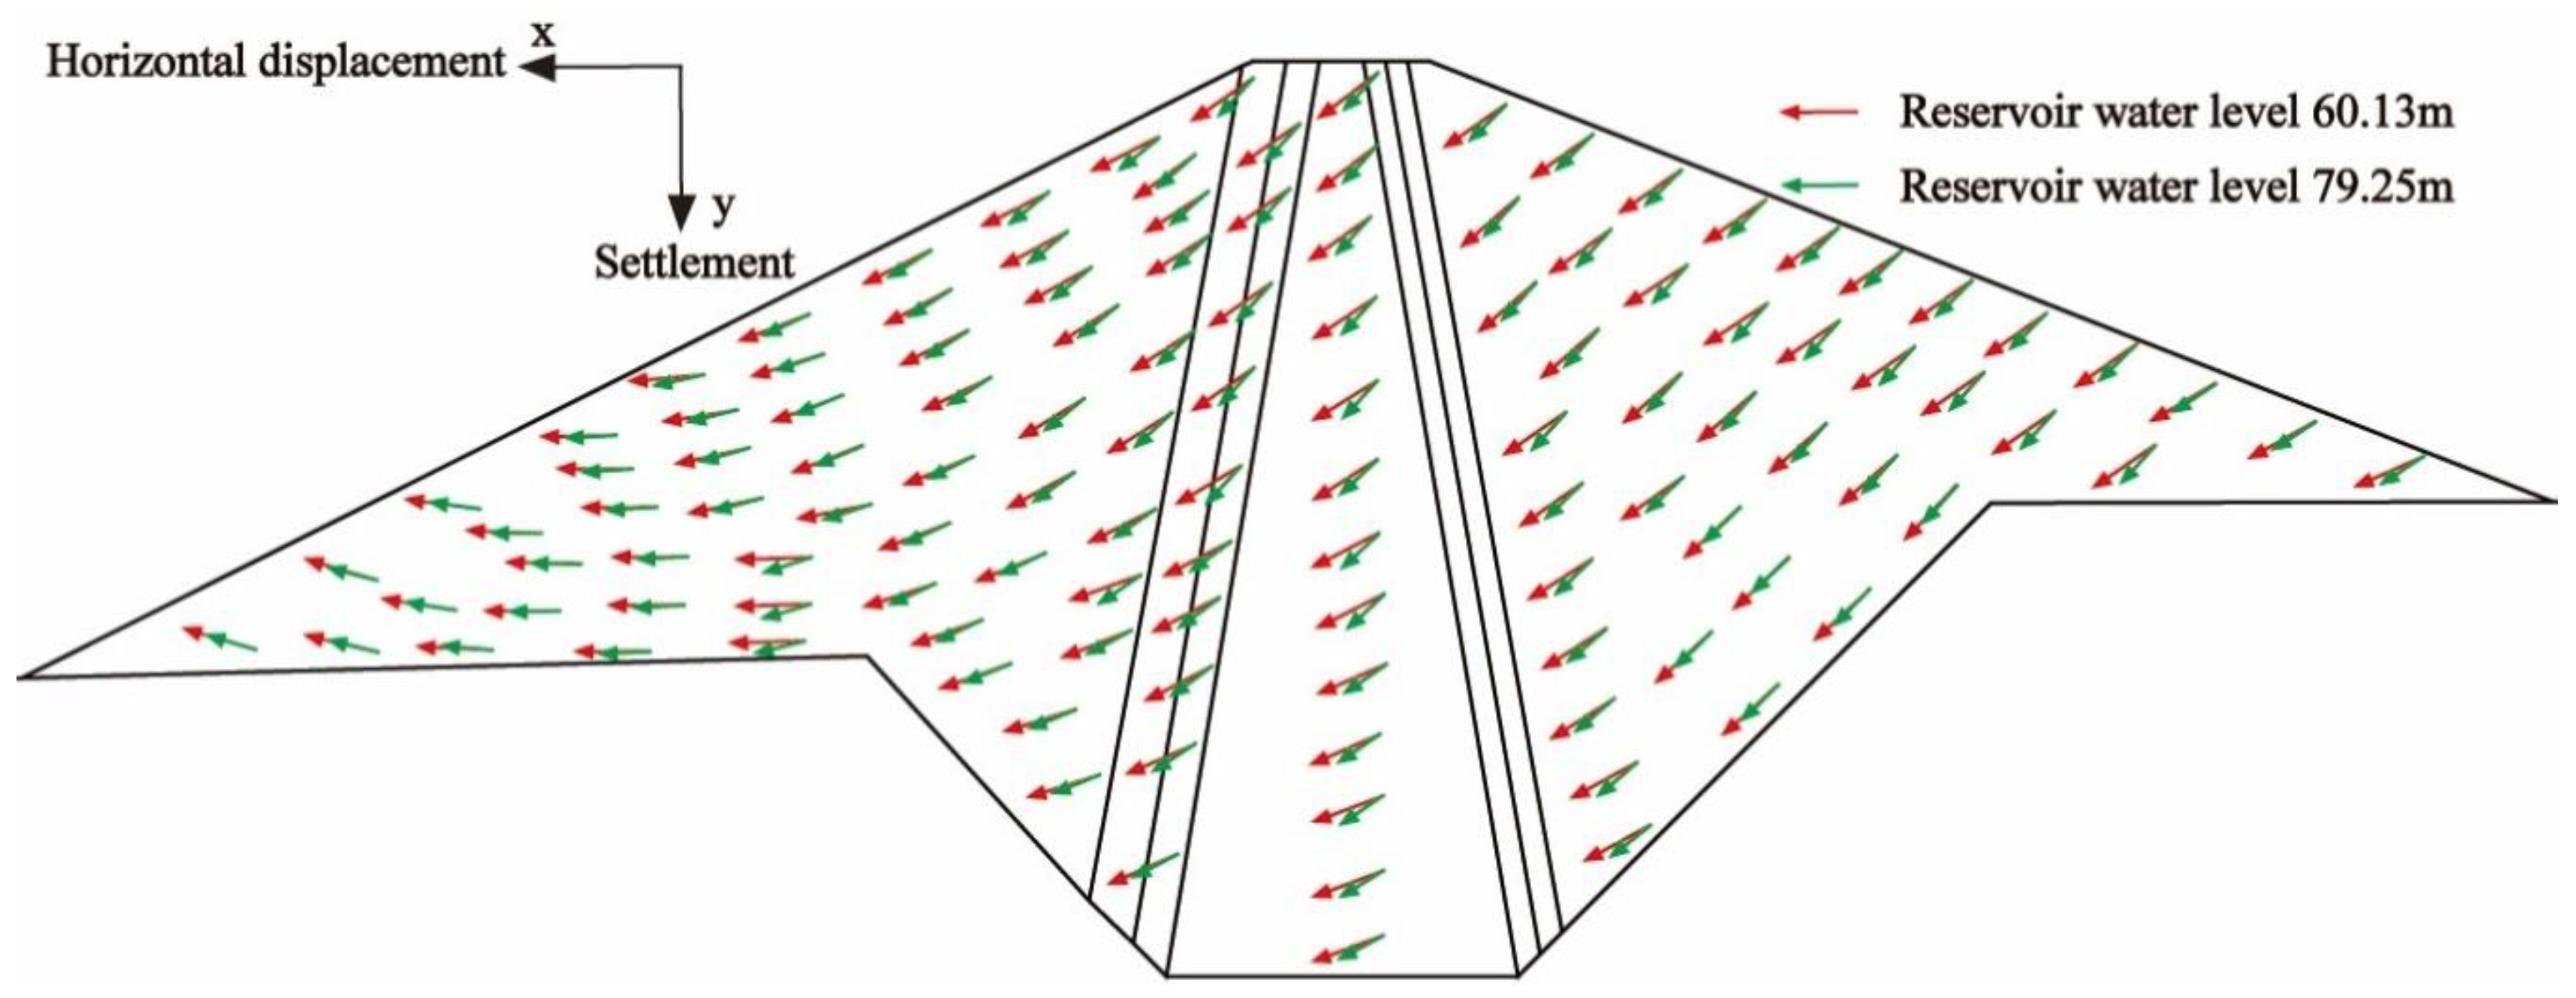
To analyze the dam’s deformation trends during fluctuations in the reservoir’s water level, Figure 12 illustrates the vector diagram of the dam’s deformation. The red arrows depicts the vector of the increase in deformation when the reservoir’s water level dropped sharply to 60.13 m on 6 May. From the diagram, it is evident that the angle between the vector of the increase in deformation and the y-axis increased as the elevation decreased. In the area extending from below one-third of the dam’s height in Rockfill I to the dam’s foundation, the vector was nearly parallel to the x-axis, indicating that the increase in horizontal deformation significantly exceeds the increase in settlement. If the nonuniform deformation is substantial, it can cause horizontal cracks in the core wall and potentially result in longitudinal cracks separating the core wall from the rockfill. This also significantly affects the stability of the rockfill. Furthermore, the angle between the vector of the increase in deformation and the y-axis in Rockfill II is smaller compared with Rockfill I. The green arrows show the vector of the increase in deformation for the sudden rise in the reservoir’s water level to 79.25 m on 27 May. It was observed that the deformation significantly decreased compared with the sudden fall to 60.13 m on 6 May. The angle between the deformation vector and the y-axis reduced, with the angle for Rockfill II being less than 45°. This suggests a diminished tendency towards the upstream movement of the dam’s body as the reservoir’s water level increases.
Table 3 displays the summary of the deformation statistics. According to the table, the maximum values of horizontal displacement and the increase in settlement occurred when the reservoir’s water level was at its lowest elevation (5 June and 6 May), rather than at the moment of the fastest decline in the reservoir’s water level (2 June). This suggests that the displacement of the CWRD is highly sensitive to the elevation of its lowest point during declines in the reservoir’s water level.

4.3.2. Analysis of the Monitoring Data of Displacement

One surface displacement gauge was installed on the upstream side and on the crest of the dam, while two were positioned on the downstream side, as detailed in Figure 2. During the period of working conditions, measurements from the displacement gauges were taken on 1 May, 15 May, and 30 May 2015. Readings from the TR2 and TR3 displacement gauges have been selected for comparison to the simulated values at the corresponding locations within the finite element model, as documented in Table 4. According to the table, the distribution of the simulated values from the finite element model aligned with the monitored values from the displacement gauges at various times. Furthermore, the ratio of the cumulative maximum settlement to the height of the core wall and rockfill was below 0.5%, conforming to the typical deformation pattern observed in dams.

5. Conclusions and Prospects

5.1. Conclusions

This study utilized finite element software to investigate the impact of rapid fluctuations in the water level on the seepage, stress, and displacement fields of a PSPS’s CWRD. Moreover, comparative analyses were conducted between the results of finite simulation and the integration of monitored data from the dam’s osmometers, earth pressure gauges, and displacement gauges. From the analysis, the following conclusions can be inferred.
(1)
When the reservoir’s water level dropped sharply, the decline in the phreatic line in the rockfill lagged, creating a large hydraulic gradient and a reverse seepage field on the surface of the dam’s slope. This resulted in a dragging force directed upstream, with a noticeable deformation trend of the lower core wall and rockfill towards the upstream. One-third of the surface of the upstream slope of the dam and the curtain grouting experienced significant concentrations of stress. Consequently, bending of the core wall could easily produce horizontal cracks, and there was a risk of longitudinal cracks separating from the rockfill, greatly affecting the stability of the rockfill on the upstream slope of the dam.
(2)
Upon a sudden decrease in the reservoir’s water level, the dam’s deformation showed increased sensitivity to the lowest elevation point, compared with the peak rate of decline in the water level. The peak increase in horizontal displacement of 6.5 mm occurred one-third up Rockfill I, while the maximum increase in settlement at the dam’s crest was 3.5 mm. Hence, close scrutiny is warranted for cracks or voids at the dam’s crest and near one-third of the dam’s height within Rockfill I.
(3)
A sudden increase in the reservoir’s water level led to a reduction in both the upstream and downstream horizontal displacement, as well as decreased in settlement. For both the core wall and the rockfill, the ratio of cumulative maximum settlement to the dam’s height was less than 0.5%. Furthermore, the absence of tensile stress zones or cracks at the dam’s crest aligned with the established deformation principles of CWRDs.
(4)
Under the influence of rapid fluctuations in the reservoir’s water level, the variation in vertical earth pressure at the bottom of the core wall was more pronounced than at its midsection. This was because the soil at the bottom of the core wall had a higher initial density, smaller porosity, and lower permeability due to greater gravity and pressure from the overlying soil. Consequently, when the reservoir’s water level changed, the pore water pressure in the bottom soil adjusted more slowly than in the middle, resulting in more significant changes in soil pressure at the bottom.
(5)
The safety monitoring data for dam seepage pressure, earth pressure, and displacement aligned closely with the finite element model’s simulated values for the infiltration line, earth pressure, and deformation. This concordance verified the finite element model’s accuracy.

5.2. Prospects

(1)
The deformation characteristics of a PSPS’s CWRD under earthquake conditions when the reservoir’s water level fluctuates during the service period were not discussed in this study. This aspect should be further investigated in future studies.
(2)
Due to the lack of detailed 3D geological data, a two-dimensional finite element model was used in this study. This model could not fully capture the distribution of stress and deformation in the dam’s three-dimensional space, and should be improved in future research.
(3)
This study used the Duncan–Chang E-B model for the stress–strain relationship of rockfill, which could not accurately describe particle breakage and other characteristics of rockfill. Future research should propose a constitutive model that accounts for all the characteristics of rockfill to enhance the accuracy of finite element calculations.

Author Contributions

Conceptualization, X.Z. and Y.F.; methodology, X.Z., B.Y., W.W., K.D. and Y.F.; software, Y.F.; formal analysis X.Z. and Y.F.; investigation, X.Z. and Y.F.; data curation, B.Y., W.W. and K.D.; writing—original draft preparation, X.Z. and Y.F.; writing—review and editing, B.Y., W.W. and K.D. All authors have read and agreed to the published version of the manuscript.

Funding

This research was funded by the National Natural Science Foundation of China (U2243223), the Fundamental Research Funds for the Central Universities of China (B230201011), the Water Conservancy Science and Technology Project of Jiangsu (2022024), and the State Grid Xinyuan (Holding) Company Ltd. Science and Technology Project (SGXYKJ-2023-059).

Data Availability Statement

Data are contained within the article.

Acknowledgments

The authors would like to extend their gratitude to all those who supported this work.

Conflicts of Interest

Authors X.Z., B.Y., W.W. and K.D. were employed by the Pumped-Storage Technological & Economic Research Institute, State Grid Xinyuan Company Ltd. The remaining author declared that the research was conducted in the absence of any commercial or financial relationships that could be construed as a potential conflict of interest.

References

  1. Ma, H.; Chi, F. Major Technologies for Safe Construction of High Earth-Rockfill Dams. Engineering 2016, 2, 498–509. [Google Scholar] [CrossRef]
  2. Wang, X. Discussion on Some Problems Observed in High Earth-Rockfill Dams. Chin. J. Geotech. Eng. 2018, 40, 203–222. [Google Scholar] [CrossRef]
  3. Rahmani, H.; Panah, A. Effect of Particle Size and Saturation Conditions on the Breakage Factor of Weak Rockfill Materials Under One-Dimensional Compression Testing. Geomech. Eng. 2020, 4, 315–326. [Google Scholar] [CrossRef]
  4. Wang, Y.; Li, J.; Wu, Z.; Chen, J.; Yin, C.; Bian, K. Dynamic Risk Evaluation and Early Warning of Crest Cracking for High Earth-Rockfill Dams through Bayesian Parameter Updating. Appl. Sci. 2020, 10, 7627. [Google Scholar] [CrossRef]
  5. Zhang, H.; Jing, Y.; Chen, J.; Gao, Z.; Xu, Y. Characteristics and Causes of Crest Cracking on A High Core-Wall Rockfill Dam: A Case Study. Eng. Geol. 2022, 297, 106488. [Google Scholar] [CrossRef]
  6. Naylor, D.; Maranha das Neves, E.; Mattar, J.; Veiga Pinto, A. Prediction of Construction Performance of Beliche Dam. Geotechnique 1986, 36, 359–376. [Google Scholar] [CrossRef]
  7. Naylor, D.; Maranha, J.; Maranha das Neves, E.; Veiga Pinto, A. A Back-Analysis of Beliche Dam. Geotechnique 1997, 47, 221–233. [Google Scholar] [CrossRef]
  8. Maranha das Neves, E.; Veiga Pinto, A. Modeling Collapse on Rockfill Dams. Comput. Geotech. 1988, 6, 131–153. [Google Scholar] [CrossRef]
  9. Alonso, E.; Olivella, S.; Pinyol, N. A Review of Beliche Dam. Geotechnique 2005, 55, 267–285. [Google Scholar] [CrossRef]
  10. Cetin, H.; Laman, M.; Ertunc, A. Settlement and Slaking Problems in the World’s Fourth Largest Rock-Fill Dam, the Ataturk Dam in Turkey. Eng. Geol. 2000, 56, 225–242. [Google Scholar] [CrossRef]
  11. Kartal, M.; Çavusli, M.; Genis, M. 3D Nonlinear Analysis of Atatürk Clay Core Rockfill Dam Considering Settlement Monitoring. Int. J. Geomech. 2019, 19, 04019034. [Google Scholar] [CrossRef]
  12. Leonards, G.; Davidson, L. Reconsideration of Failure Initiating Mechanisms for Teton Dam. Int. J. Rock. Mech. Min. Sci. Geomech. Abstr. 1986, 23, A27. [Google Scholar] [CrossRef]
  13. Zhang, X.; Wang, C.; Wong, H.; Jiang, T.; Dong, J. Modeling Dam Deformation in the Early Stage of Internal Seepage Erosion—Application to the Teton Dam, Idaho, Before the 1976 Incident. J. Hydrol. 2022, 605, 127378. [Google Scholar] [CrossRef]
  14. Jia, Y.; Xu, B.; Chi, S.; Xiang, B.; Xiao, D.; Zhou, Y. Joint Back Analysis of the Creep Deformation and Wetting Deformation Parameters of Soil Used in the Guanyinyan Composite Dam. Comput. Geotech. 2018, 96, 167–177. [Google Scholar] [CrossRef]
  15. Zhou, X.; Chi, S.; Jia, Y.; Shao, X. A New Wetting Deformation Simulation Method Based on Changes in Mechanical Properties. Comput. Geotech. 2020, 117, 103261. [Google Scholar] [CrossRef]
  16. Zhou, X.; Chi, S.; Wang, M.; Jia, Y. Study on Wetting Deformation Characteristics of Coarse Granular Materials and Its Simulation in Core-Wall Rockfill Dams. Int. J. Numer. Anal. Methods Geomech. 2020, 44, 851–873. [Google Scholar] [CrossRef]
  17. Squier, L. Load Transfer in Earth and Rockfill Dams. J. Soil Mech. Found. 1970, 96, 213–233. [Google Scholar] [CrossRef]
  18. Ding, N.; Duan, J.; Xue, S.; Zeng, M.; Shen, J. Overall Review of Peaking Power in China: Status Quo, Barriers and Solutions. Renew. Sustain. Energy Rev. 2015, 42, 503–516. [Google Scholar] [CrossRef]
  19. Kong, Y.; Kong, Z.; Liu, Z.; Wei, C.; Zhang, J.; An, G. Pumped Storage Power Stations in China: The Past, the Present, and the Future. Renew. Sustain. Energy Rev. 2017, 71, 720–731. [Google Scholar] [CrossRef]
  20. Jia, J. A Technical Review of Hydro-Project Development in China. Engineering 2016, 2, 302–312. [Google Scholar] [CrossRef]
  21. Xu, Z.; Cao, C.; Li, K.; Cai, J.; Xiong, W.; Zhao, J.; Qin, R. Simulation of Drainage Hole Arrays and Seepage Control Analysis of the Qingyuan Pumped Storage Power Station in China: A Case Study. Bull. Eng. Geol. Environ. 2019, 78, 6335–6346. [Google Scholar] [CrossRef]
  22. Feng, W.; Chi, S.; Jia, Y. Random Finite Element Analysis of A Clay-Core-Wall Rockfill Dam Considering Three-Dimensional Conditional Random Fields of Soil Parameters. Comput. Geotech. 2023, 159, 105437. [Google Scholar] [CrossRef]
  23. Larese, A.; Rossi, R.; Oñate, E.; Toledo, M.; Morán, R.; Campos, H. Numerical and Experimental Study of Overtopping and Failure of Rockfill Dams. Int. J. Geomech. 2015, 15, 04014060. [Google Scholar] [CrossRef]
  24. Mohammad Rashidi, S.; Mohsen, H. Evaluation of Behaviors of Earth and Rockfill Dams During Construction and Initial Impounding Using Instrumentation Data and Numerical Modeling. J. Rock. Mech. Geotech. Eng. 2017, 9, 709–725. [Google Scholar] [CrossRef]
  25. Xu, M.; Pang, R.; Zhou, Y.; Xu, B. Seepage Safety Evaluation of High Earth-Rockfill Dams Considering Spatial Variability of Hydraulic Parameters Via Subset Simulation. J. Hydrol. 2023, 626, 130261. [Google Scholar] [CrossRef]
  26. Wu, Z.; Chen, C.; Zheng, Y.; Chen, J.; Bian, K.; Li, J. Analysis of Seepage Failure Probability for High Core Rockfill Dams During Rapid Drawdown of Reservoir Water level. J. Hydrol. 2024, 633, 131046. [Google Scholar] [CrossRef]
  27. Reza, M.; Ali, A.; Behrouz, G. Simulation of Collapse Settlement of First Filling in a High Rockfill Dam. Eng. Geol. 2015, 187, 32–44. [Google Scholar] [CrossRef]
  28. Akhtarpour, A.; Salari, M. The Deformation Mechanism of A High Rockfill Dam During the Construction and First Impounding. Sci. Iran. 2020, 27, 566–587. [Google Scholar] [CrossRef]
  29. Qiu, T.; Wang, W.; Höeg, K.; Feng, S.; Zhao, R. 3D Analysis of the 174-m High Quxue Asphalt-Core Rockfill Dam in A Narrow Canyon. Soils Found. 2021, 61, 1645–1659. [Google Scholar] [CrossRef]
  30. Zhou, X.; Wu, B.; Li, L. Study on Influence of Numerical Simulation Accuracy on High Core Wall Rockfill Dam Deformation and Crack Analysis. Buildings 2022, 12, 1494. [Google Scholar] [CrossRef]
  31. Zhou, X.; He, J.; Chi, S.; Wang, J. Study on Collapse Settlement and Cracks of Core Wall Rockfill Dams Under Wetting Deformation. Int. J. Numer. Anal. Methods Geomech. 2023, 47, 106–128. [Google Scholar] [CrossRef]
  32. Liu, S.; He, W.; Sun, Y.; Shen, C.; Wang, L. Analysis of the Behavior of A High Earth-Core Rockfill Dam Considering Particle Breakage. Comput. Geotech. 2023, 157, 105320. [Google Scholar] [CrossRef]
  33. Pan, L.; Fan, Z.; Wang, D.; Zhou, X. The Wetting Deformation Model of Rockfill and Its Two Methods for Simulating Rock-fill Dam Collapse Settlement. Sci. World J. 2023, 2023, 5593636. [Google Scholar] [CrossRef] [PubMed]
  34. Pan, L.; Wu, B.; Wang, D.; Zhou, X.; Wang, L.; Zhang, Y. Study on Impoundment Deformation Characteristics and Crack of High Core Rockfill Dam Based on Inversion Parameters. Water 2024, 16, 188. [Google Scholar] [CrossRef]
  35. Ai, Z.; Ma, G.; Zhang, G.; Liu, R.; Deng, S.; Chang, X.; Zhou, W. Multi-Source Monitoring Data Filtering Assisted Deformation Analysis Model Updating of Ultra-High Rockfill Dam. Comput. Geotech. 2024, 171, 106323. [Google Scholar] [CrossRef]
  36. Wu, Y.; Zhang, B.; Yu, Y.; Zhang, Z. Consolidation Analysis of Nuozhadu High Earth-Rockfill Dam Based on the Coupling of Seepage and Stress-Deformation Physical State. Int. J. Geomech. 2016, 16, 04015085. [Google Scholar] [CrossRef]
  37. Dong, Y.; Xing, H.; Liu, J. With FLAC3D Simulating Analysis the Rock Stability by Stretching Anchor Cables Reinforce on the Reservoir Dam Abutment. Appl. Mech. Mater. 2011, 90–93, 2670–2676. [Google Scholar] [CrossRef]
  38. Li, M.; Xue, B.; Fang, H.; Zhang, S.; Wang, F. Parameter Sensitivity Analysis of Polyurethane Cutoff Walls for Earth Dams under Multifield Coupling. Int. J. Geomech. 2023, 23, 04023206. [Google Scholar] [CrossRef]
  39. Liu, S.; Wang, L.; Wang, Z.; Bauer, E. Numerical Stress-Deformation Analysis of Cut-Off Wall in Clay-Core Rockfill Dam on Thick Overburden. Water Sci. Eng. 2016, 9, 219–226. [Google Scholar] [CrossRef]
  40. Chen, Y.; Lin, G.; Lu, Y. Deformation and Stability Analysis of a Core Rockfill Dam with Leakage. Shock. Vib. 2022, 2022, 6944442. [Google Scholar] [CrossRef]
  41. Ri, Y.; Han, U.; Jang, U.; Jong, D.; Kim, C. Study on Stability Reduction Characteristics of Earth and Rockfill Dams under Rapid Drawdown Using Fully Coupled Seepage-Stress Analysis. Adv. Civil. Eng. 2022, 2022, 7954991. [Google Scholar] [CrossRef]
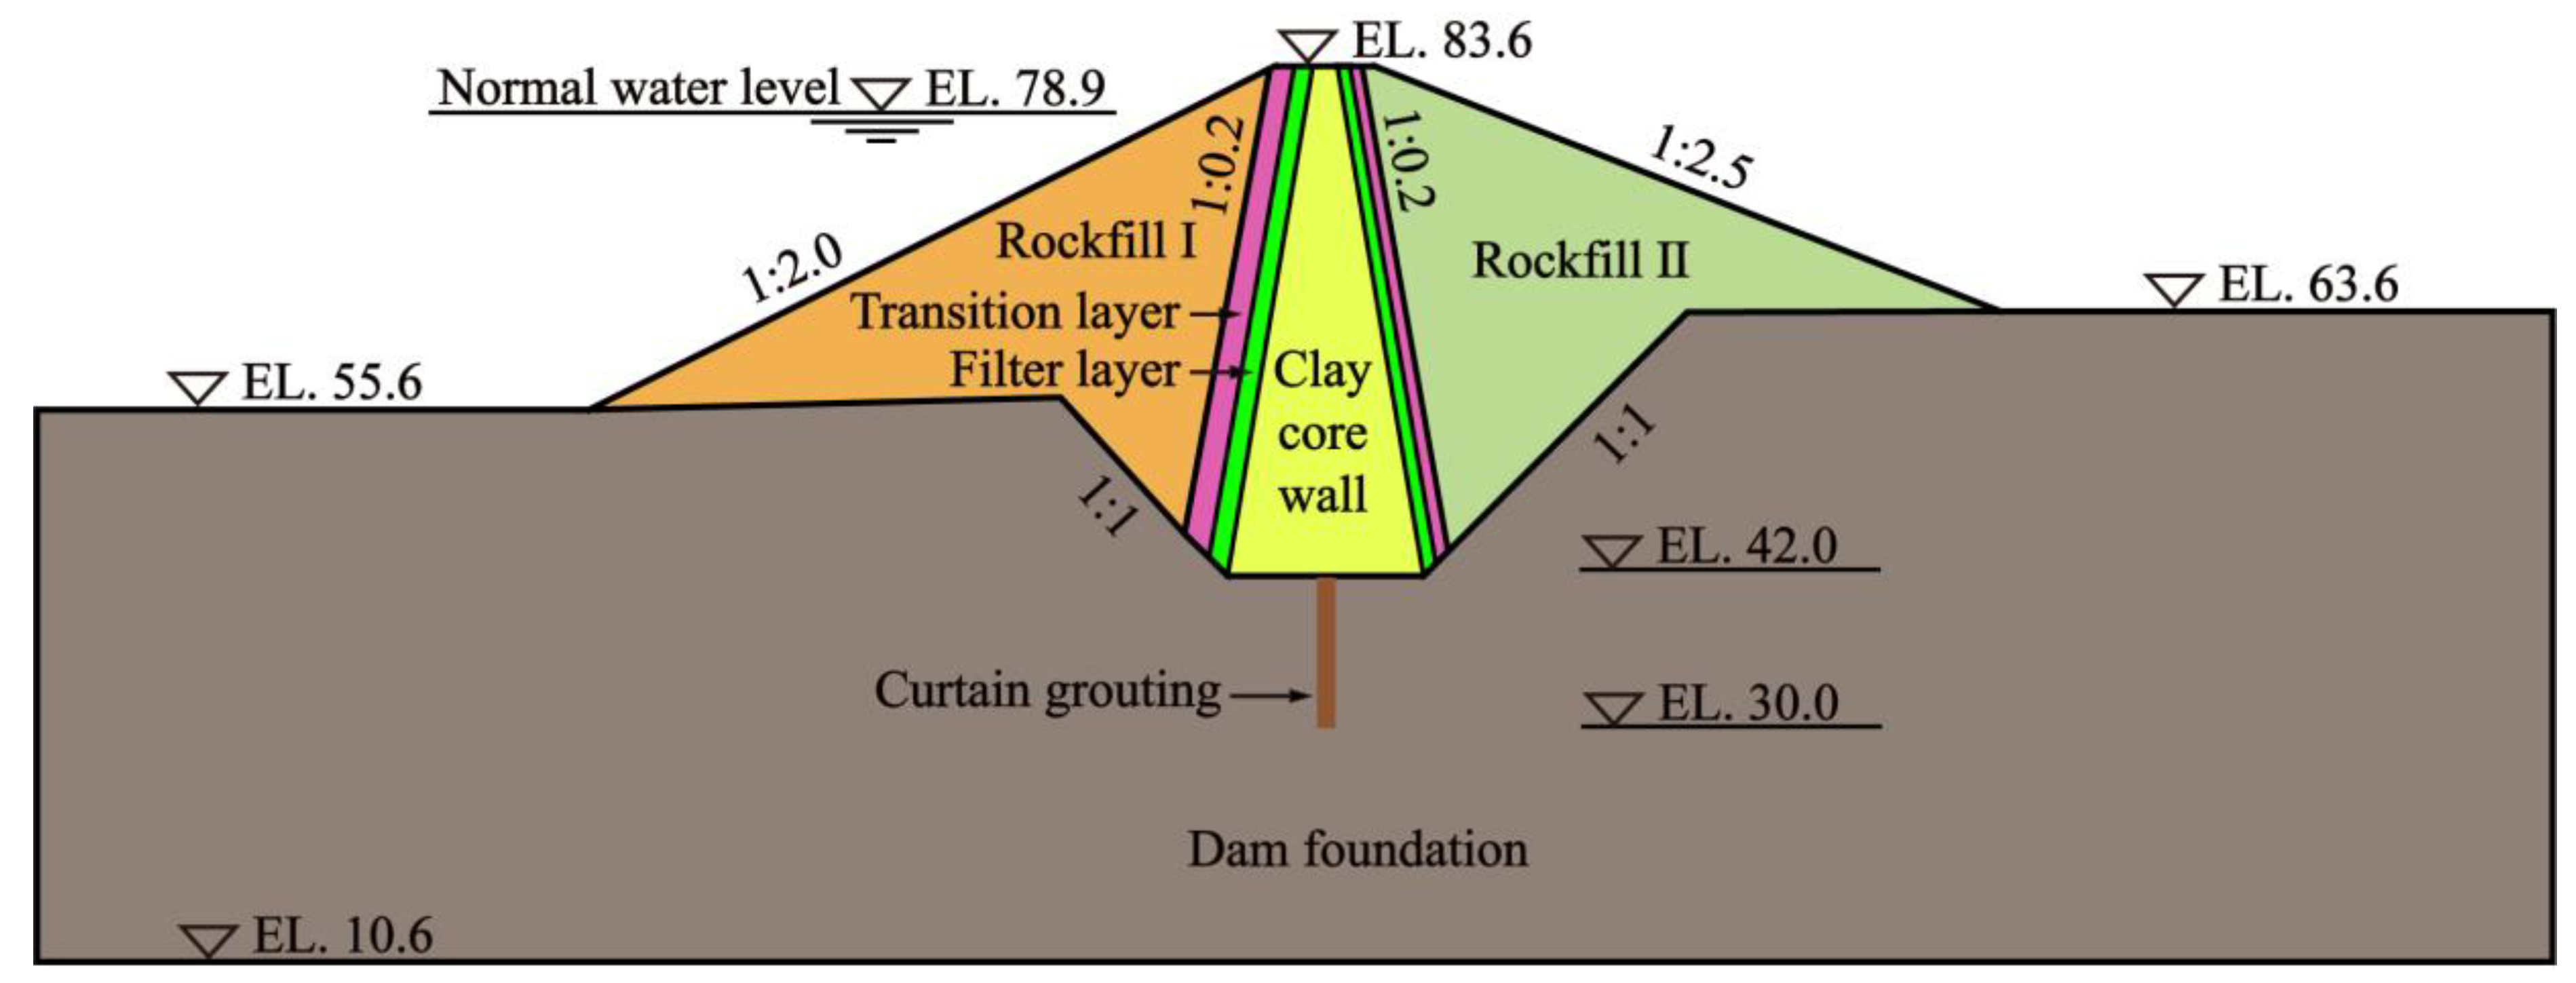
Figure 1. A typical section of the dam.
Water 16 01621 g001
Figure 2. Layout of measurement points on a typical section of the dam.
Water 16 01621 g002
Figure 3. Hydrograph of the reservoir’s water level, exhibiting temporal variations.
Water 16 01621 g003
Figure 4. Cloud maps of pore water pressure at different typical moments (unit: kPa).
Water 16 01621 g004
Figure 5. Monitoring data of the seepage pressure.
Water 16 01621 g005
Figure 6. Cloud maps of vertical soil pressure at different typical moments (unit: kPa).
Water 16 01621 g006
Figure 7. Comparison between the simulated and monitored values of vertical soil pressure.
Water 16 01621 g007
Figure 8. Chart illustrating the time variation of increments in horizontal displacement.
Water 16 01621 g008
Figure 9. Chart illustrating the time variation of increments in settlement.
Water 16 01621 g009
Figure 10. Cloud maps of horizontal displacement at different typical moments (unit: mm).
Water 16 01621 g010
Figure 11. Cloud maps of settlement at different typical moments (unit: mm).
Water 16 01621 g011
Figure 12. Vector diagram of the dam’s deformation.
Water 16 01621 g012
Table 1. Constitutive parameters of the model.
Dam
Materials
γ d , kN•m−3c, kPa φ Δ φ KnRfKbmKur
Rockfill I22.1039.810.59600.490.744900.422K
Transition layer22.512040.27.77800.470.754750.372K
Filter layer18.113343.78.58400.420.804500.432K
Clay core wall16.2154447.85000.350.772400.352K
Rockfill II21.8043.99.66600.490.702580.282K
Dam’s foundation21.85543.99.66600.490.702580.282K
Table 2. Comparison between the simulated and monitored values of the phreatic line.
TimeReservoir’s Water Level, mP1P2P3
Simulated Value, mMonitored Value, mSimulated Value, mMonitored Value, mSimulated Value, mMonitored Value, m
5/176.7075.4075.3162.6062.3361.8761.85
5/660.1373.6073.3962.8062.3161.7661.90
5/2779.2577.3877.8764.4463.9761.9461.86
Table 3. Summary of the deformation statistics.
TimeReservoir’s Water Level, mRate of Decline in the Reservoir’s Water Level, (m•d−1)Maximum Increase in Horizontal Displacement, mmMaximum Increase in Settlement, mm
Upstream PointDownstream PointUpstream PointDownstream Point
6/560.244.066.50.5//
5/660.134.38//2.53.5
6/263.2615.535.50.52.03.0
Table 4. Comparison table between the monitored values of the displacement gauges and the simulated values of the finite element model.
TimeTR2 Horizontal Displacement, mmTR2 Settlement, mmTR3 Horizontal Displacement, mmTR3 Settlement, mm
Simulated Value, mMonitored Value, mSimulated Value, mMonitored Value, mSimulated Value, mMonitored Value, mSimulated Value, mMonitored Value, m
5/124.8823.65154.78150.7325.0424.13156.35151.67
5/1520.6018.95151.84148.3220.6819.74154.47149.23
5/3022.8721.63152.38149.3023.0122.60154.83149.96
Disclaimer/Publisher’s Note: The statements, opinions and data contained in all publications are solely those of the individual author(s) and contributor(s) and not of MDPI and/or the editor(s). MDPI and/or the editor(s) disclaim responsibility for any injury to people or property resulting from any ideas, methods, instructions or products referred to in the content.