1. Introduction
In recent decades, water scarcity has affected the development of irrigated agriculture in arid and semi-arid regions, where agriculture consumes more than 90% of the total available water [
1]. Traditional flood irrigation is the main irrigation method in northwest China, which requires more water than other irrigation methods [
2]. The conflict between irrigation water and environmental needs has become a new challenge, making future water resource management more difficult.
Maize is the main crop farmed in the Yinchuan Plain and has a high irrigation demand [
3]. Owing to the study area being located in the Yellow River diversion irrigation area, the low average annual precipitation, crops depending on the irrigation mode of the Yellow River diversion irrigation area, and high evapotranspiration and control in the Yellow River diversion irrigation area, water supply in this area is dependent on irrigation [
4,
5]. The average daily evapotranspiration of maize during the milking period exceeds 10 mm/d [
6], and approximately 43% of the flood irrigation of maize fields is lost by deep percolation [
7]. Therefore, increasing irrigation is one of the easiest ways to maintain high and stable yields [
8]. Previous field studies have focused on soil–water balance under different field conditions, evapotranspiration under different irrigation methods, irrigation plans, and simulation results to determine deep percolation after irrigation [
9,
10]. However, most of these studies were time-consuming and labor-intensive. In addition, regional hydrological processes are complicated due to spatial variability in soils, crops, weather, groundwater, irrigation, and management practices.
Groundwater recharge is an important part of the hydrological cycle and refers to the process by which an aquifer or aquifer system obtains water from above ground. Since the 1880s, many scholars worldwide have researched groundwater recharge, and the sources of groundwater recharge have been attributed to atmospheric rainfall infiltration, surface water, irrigation, aquifer leakage, and artificial recharge. Callahan [
11] and Zhou [
12] used the Darcy method to estimate the recharge of shallow aquifers, which provided a basis for groundwater resource assessment and numerical modeling. Sophocleous [
13] and Li [
14] conducted in-depth research on the dynamic groundwater level method based on the influencing factors of groundwater level. The dynamic groundwater level method was improved and widely applied. Theis [
15] suggested that the groundwater recharge in a basin can be calculated based on the groundwater increase and specific water yield. Huang [
16] and Ma et al. [
17] studied the variation in chloride ion content in soil water in Badain Jaran Desert. Stable hydrogen and oxygen isotope techniques have also become an effective means to study groundwater recharge and water movement in the vadose zone. Li [
18] and Fan et al. [
19] studied the impact on groundwater recharge of rainfall in the Yinchuan Plain by analyzing the isotopic characteristics and hydrochemical distributions of soil water and regional groundwater. They found that groundwater was recharged by rainfall, the Yellow River, and irrigation. Yin [
20] used the resistivity sounding method to explore the groundwater recharge conditions at a depth of 300 m in the Yinchuan Plain based on hydrogeological survey results from previous studies. The results showed that the source of groundwater recharge of the proluvial fan in the Helan Mountains is atmospheric precipitation and bedrock fissure water.
Irrigation is an important source of water for crop growth in arid and semi-arid areas. To date, many studies have been conducted on the impact of irrigation methods on groundwater recharge. Li et al. [
21] simulated the effects of soil texture, unit weight, and initial soil moisture on the irrigation infiltration process under drip irrigation with membrane holes using the SWMS-2D software. The results showed that initial soil moisture and irrigation depth had the weakest effect on cumulative infiltration. Duncan et al. [
22] studied the irrigation infiltration recharge in dairy farms in New Zealand. The measured recharge in dry land was compared using a lysimeter. The results indicated that irrigation in arid areas leads to more groundwater recharge. Troiano et al. [
23] analyzed the extent of the effect of different irrigation methods on the seepage of the vadose zone using tracers. The results showed that when the total amount of irrigation was the same, the seepage at the bottom of the vadose zone under the sprinkler irrigation was the lowest, and the seepage under furrow irrigation was the highest. Cheng [
24] constructed water and salt movement models for two irrigation methods in Hydrus-3D. The results showed that furrow irrigation could be used during early stages of the crop growth period, and border irrigation could be used at later stages to save water and control salt levels. Yu et al. [
25] conducted field experiments in Hetao Irrigation District and established a numerical model to simulate water and salt movement in soil under different irrigation modes to provide the basis for determining the reasonable irrigation method for water conservation and salt control. Ren [
26] chose the experimental forest in Aksu Prefecture as the study area. Based on the experiment, Hydrus was used to simulate the seepage of soil water in jujube orchards and the groundwater recharge by irrigation. The results showed that the most suitable micro-irrigation method for adult jujube trees in the study area was micro-sprinkler irrigation. Lai et al. [
27] simulated the infiltration and recharge process of groundwater under irrigation conditions in different areas based on field observations using the Hydrus software to provide the scientific basis for the development of effective schemes for agricultural irrigation in the study area.
Currently, there are few studies on water movement mechanisms under different irrigation methods in the Yinchuan Plain. Thus, analyzing the impact of soil water budgets in the field and different irrigation schedules on agricultural practices is crucial. The aim of this study was to analyze the water movement patterns in soil under different irrigation methods and their impact on groundwater recharge.
3. Simulation of Water Movement in the Vadose Zone under Different Irrigation Conditions
3.1. Hydrogeological Conceptual Model of the Vadose Zone
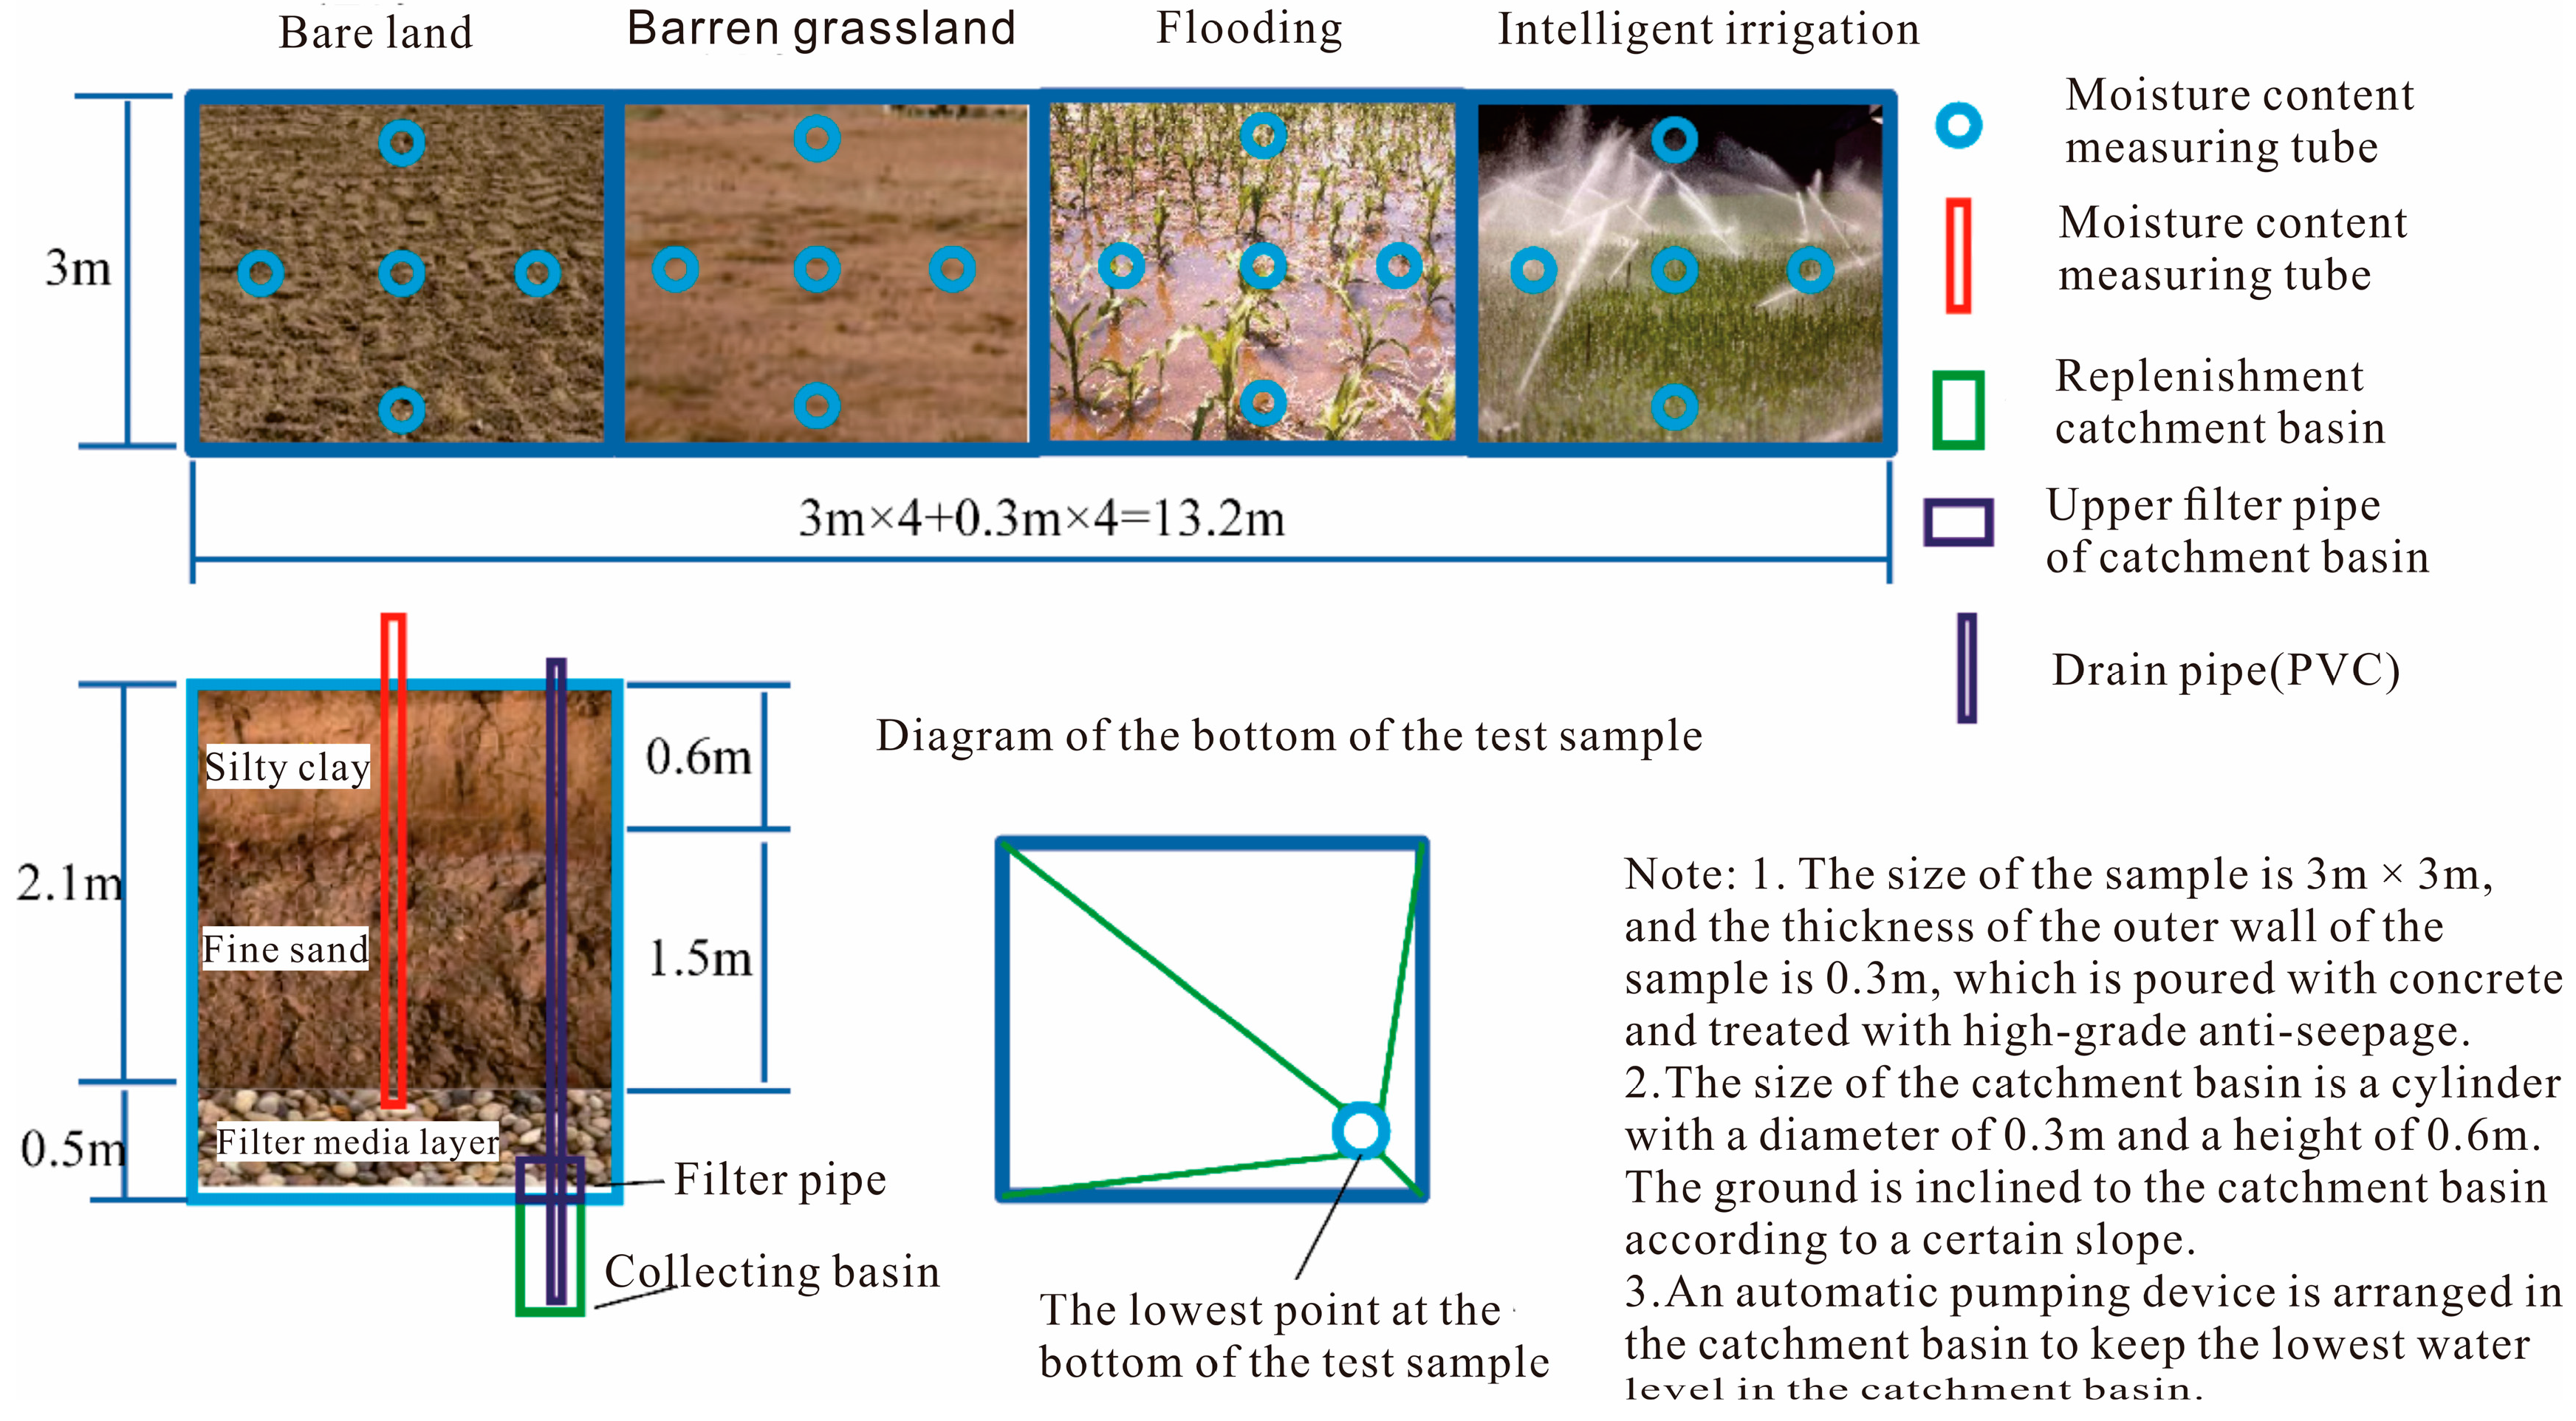
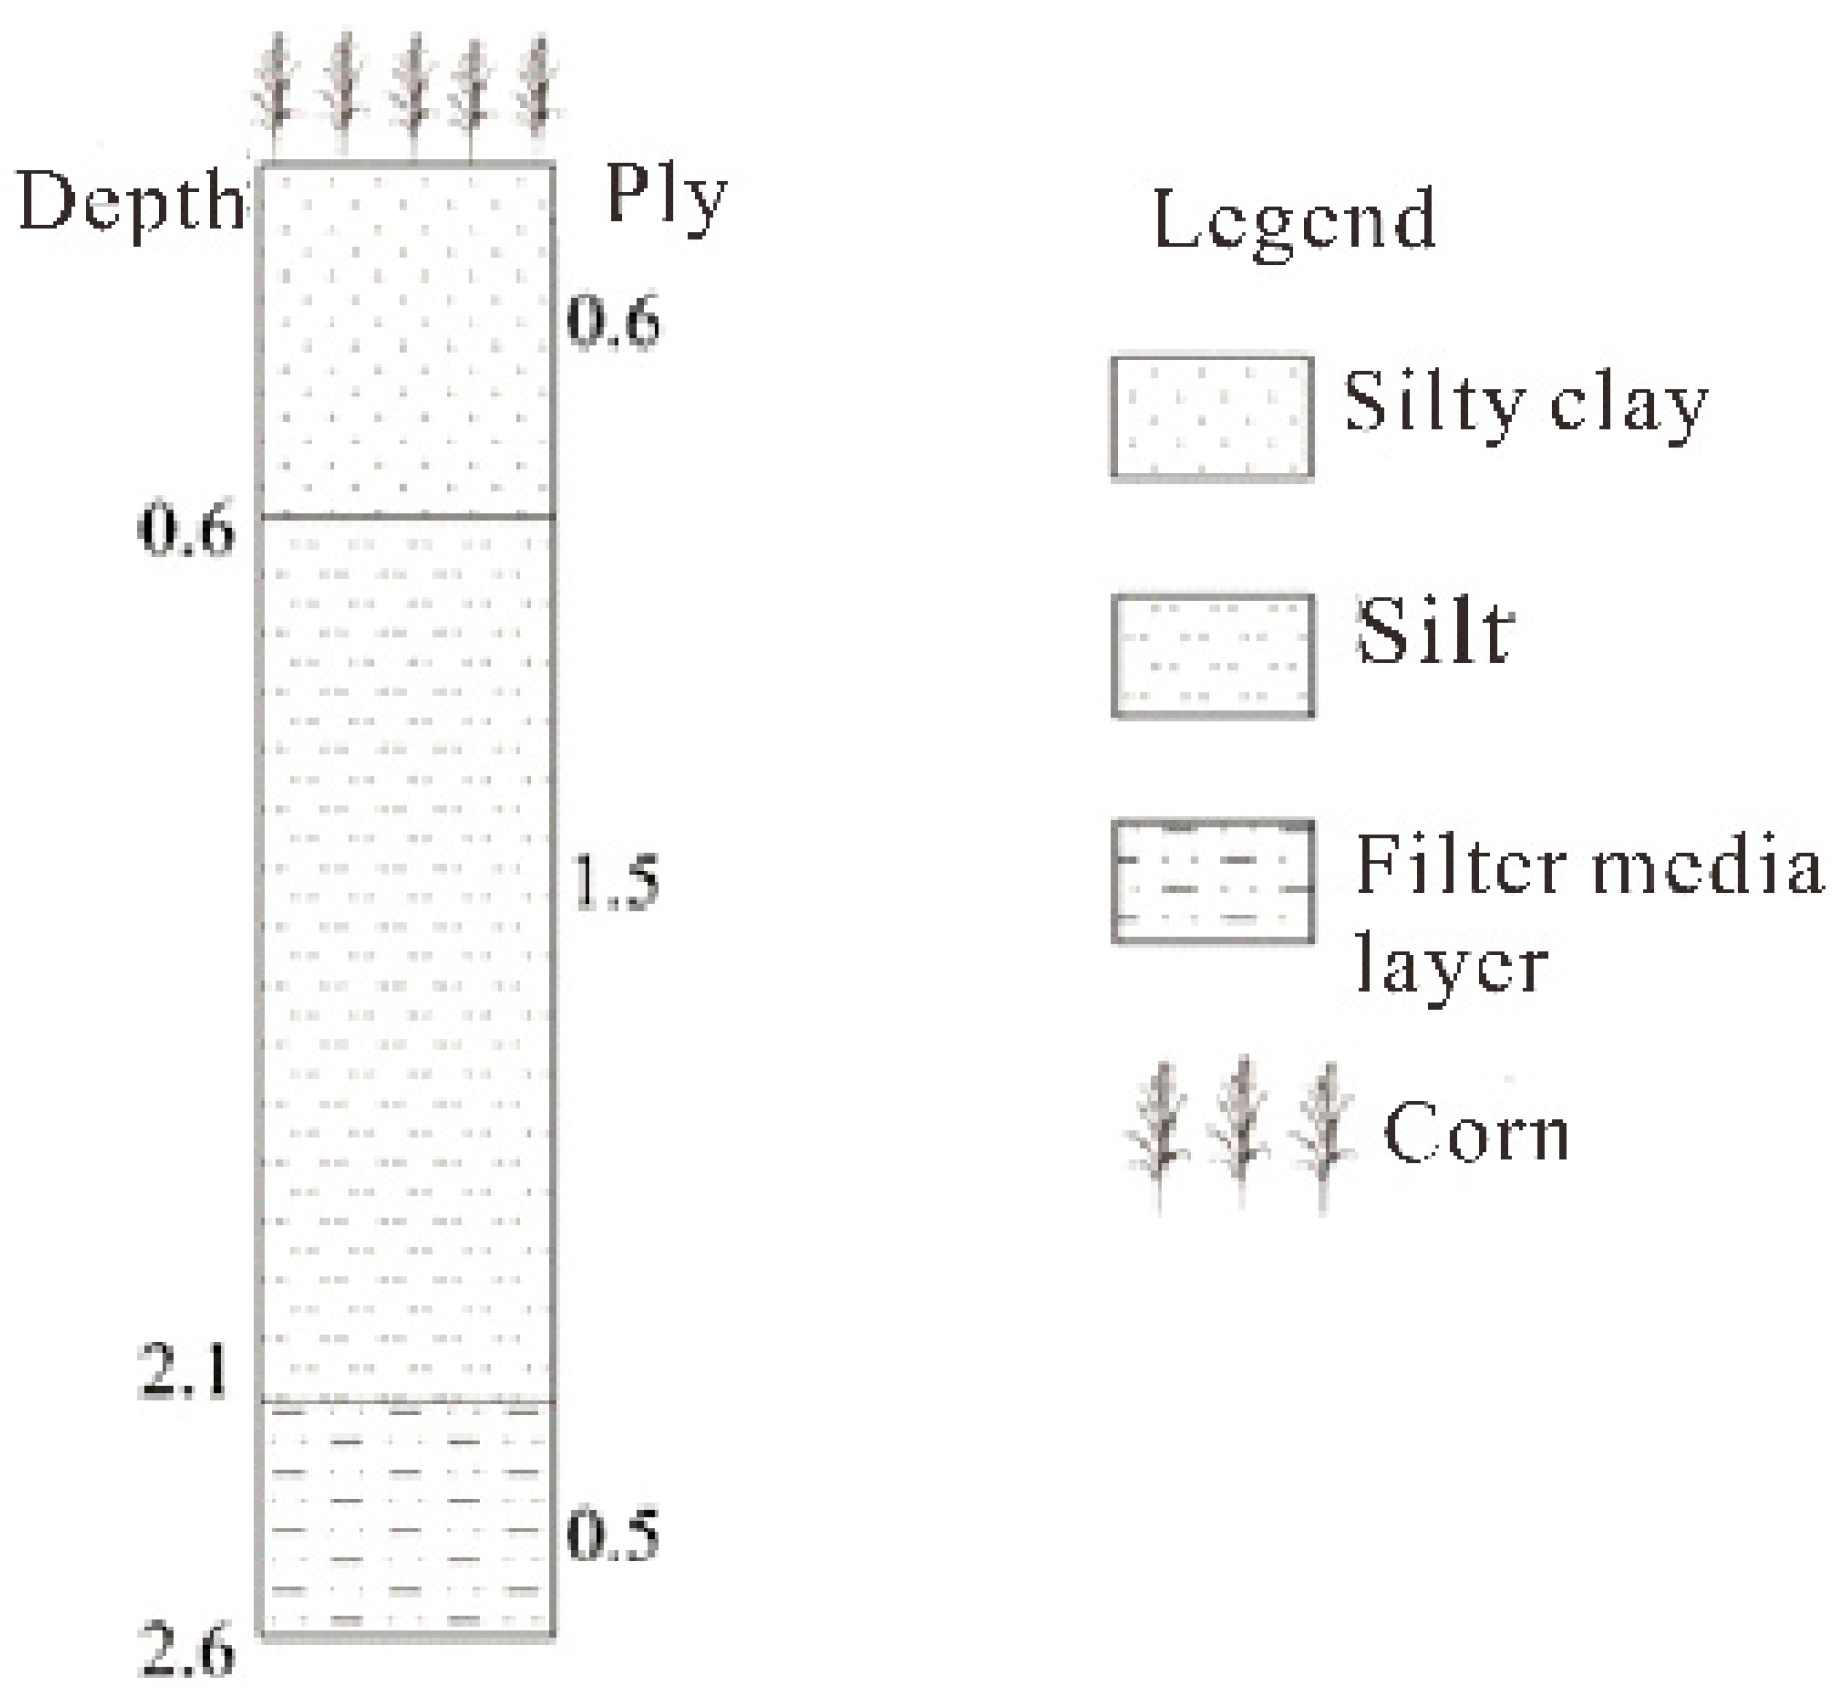
Based on the measured data from in situ analyses, the model was generalized to a 1D vertical unsaturated flow model to simulate the water movement process and groundwater recharge under different irrigation methods in Yinchuan Plain, while considering the effect of water uptake by the root system of typical local cash crops. The following two models were constructed according to the actual situation of the irrigation quadrats, and the generalized profiles of the models are shown below (
Figure 6). The models were identified and analyzed in terms of accuracy. In addition, the models were used to simulate the vertical infiltration and recharge patterns of groundwater under the different irrigation methods.
3.1.1. Mathematical Model
The Richards [
30] equation describes the vertical movement of soil moisture. With the surface as the reference and the
z-axis positively orientated downwards, the basic equation for 1D saturated–unsaturated water flow is as follows:
where
θ is the volumetric soil water content (%),
t is the time variable (d);
h is the negative soil pressure (cm);
z is the soil depth (cm);
K(
θ) is the unsaturated permeability (m/d).
h > 0 is the saturated zone and
h < 0 is the unsaturated zone; S(
z,
t) is the water uptake duration of the vegetation root system (d
−1).
3.1.2. Modelling of Water Uptake by Vegetation Roots
The water uptake duration of vegetation roots is defined as the volume of water lost by the roots per unit time due to water uptake. Feddes [
30] defined
S as
where
S(
h) is the actual root water absorption at depth
h (cm
−2), α(
h,
z) is the water stress equation,
β(
z) is the water uptake distribution function of vegetation roots (cm
−1), and
Tp is the potential transpiration rate of vegetation (cm
−1).
The water stress effect of solutes was not considered. The source and sink terms considered water uptake by vegetation roots. The depth of distribution of the maize roots was mainly in the range of 0–30 cm.
3.2. Determination of Soil Parameters
Initial soil water parameters were fitted and determined using the RETC software based on the Van Genuchten [
25] equation (
Table 1), which can be expressed using the following equations:
where
θ(
h) is the characteristic curve of the soil,
θ (%) is the volumetric water content,
θr (%) is the residual water content,
θs (%) is the saturated water content,
h is the pressure head,
K(
θ) (%) is the hydraulic conductivity under pressure head,
Ks (%) is the saturated hydraulic conductivity, and
Se is the effective saturation. α,
n, and
m are dimensionless empirical parameters of the Van Genuchten model, where
m = 1 − 1/
n.
The soil physical parameters obtained by fitting the RETC software and Van Genuchten equation were used as the initial soil physical parameters of the model, and the inverse solution module provided by the Hydrus-1D software was used to optimize the parameters during the operation of the model. The simulated water content is compared with the measured water content and the parameters are constantly modified to minimize the error and achieve the best model fitting effect. The physical parameters of the soil layers identified in this paper after optimized inverse solution and validation are shown in
Table 1.
3.3. Boundary and Initial Conditions
- (1)
Upper and lower boundary conditions
In this study, the upper boundary condition was an atmospheric boundary and the irrigation volume was converted to rainfall. The lower boundary was a free drainage boundary.
- (2)
Initial conditions
The initial conditions were the actual observation data at t = 0. The water contents at 10, 20, 30, 50, 80, 100, and 150 cm of each quadrat measured in the field were put in the model as the initial conditions, and the water contents at other depths were obtained by automatic linear interpolation of the model.
3.4. Spatial Partitioning and Temporal Discretization
The irrigation quadrats were partitioned into 210 layers and observation points were set at 10, 20, 30, 50, 80, 100, and 150 cm. According to the filling situation of the irrigation sample and the indoor particle analysis results, the simulation area was divided into two layers: 0–60 cm and 60–210 cm. The model identification period was 20 May to 15 July 2021. The model validation period was 10 August to 31 October 2021. The simulation unit was days; the initial time step of the iterative operation, minimum time step, and maximum time step were 0.01 d, 0.001 d, and 1 d, respectively.
3.5. Model Identification and Validation
The model was identified and validated based on the measured water content, lithological structure, and meteorological elements of the quadrat. The measured and simulated water contents of each test quadrat during the identification period were compared. The overall trends in the measured and simulated water contents were analyzed. The impact of water content on the irrigation process was simulated. Furthermore, the vertical distribution characteristics of the simulated and measured water contents in the vadose zone were compared. In addition, the vertical water content changes during the identification and validation periods were determined.
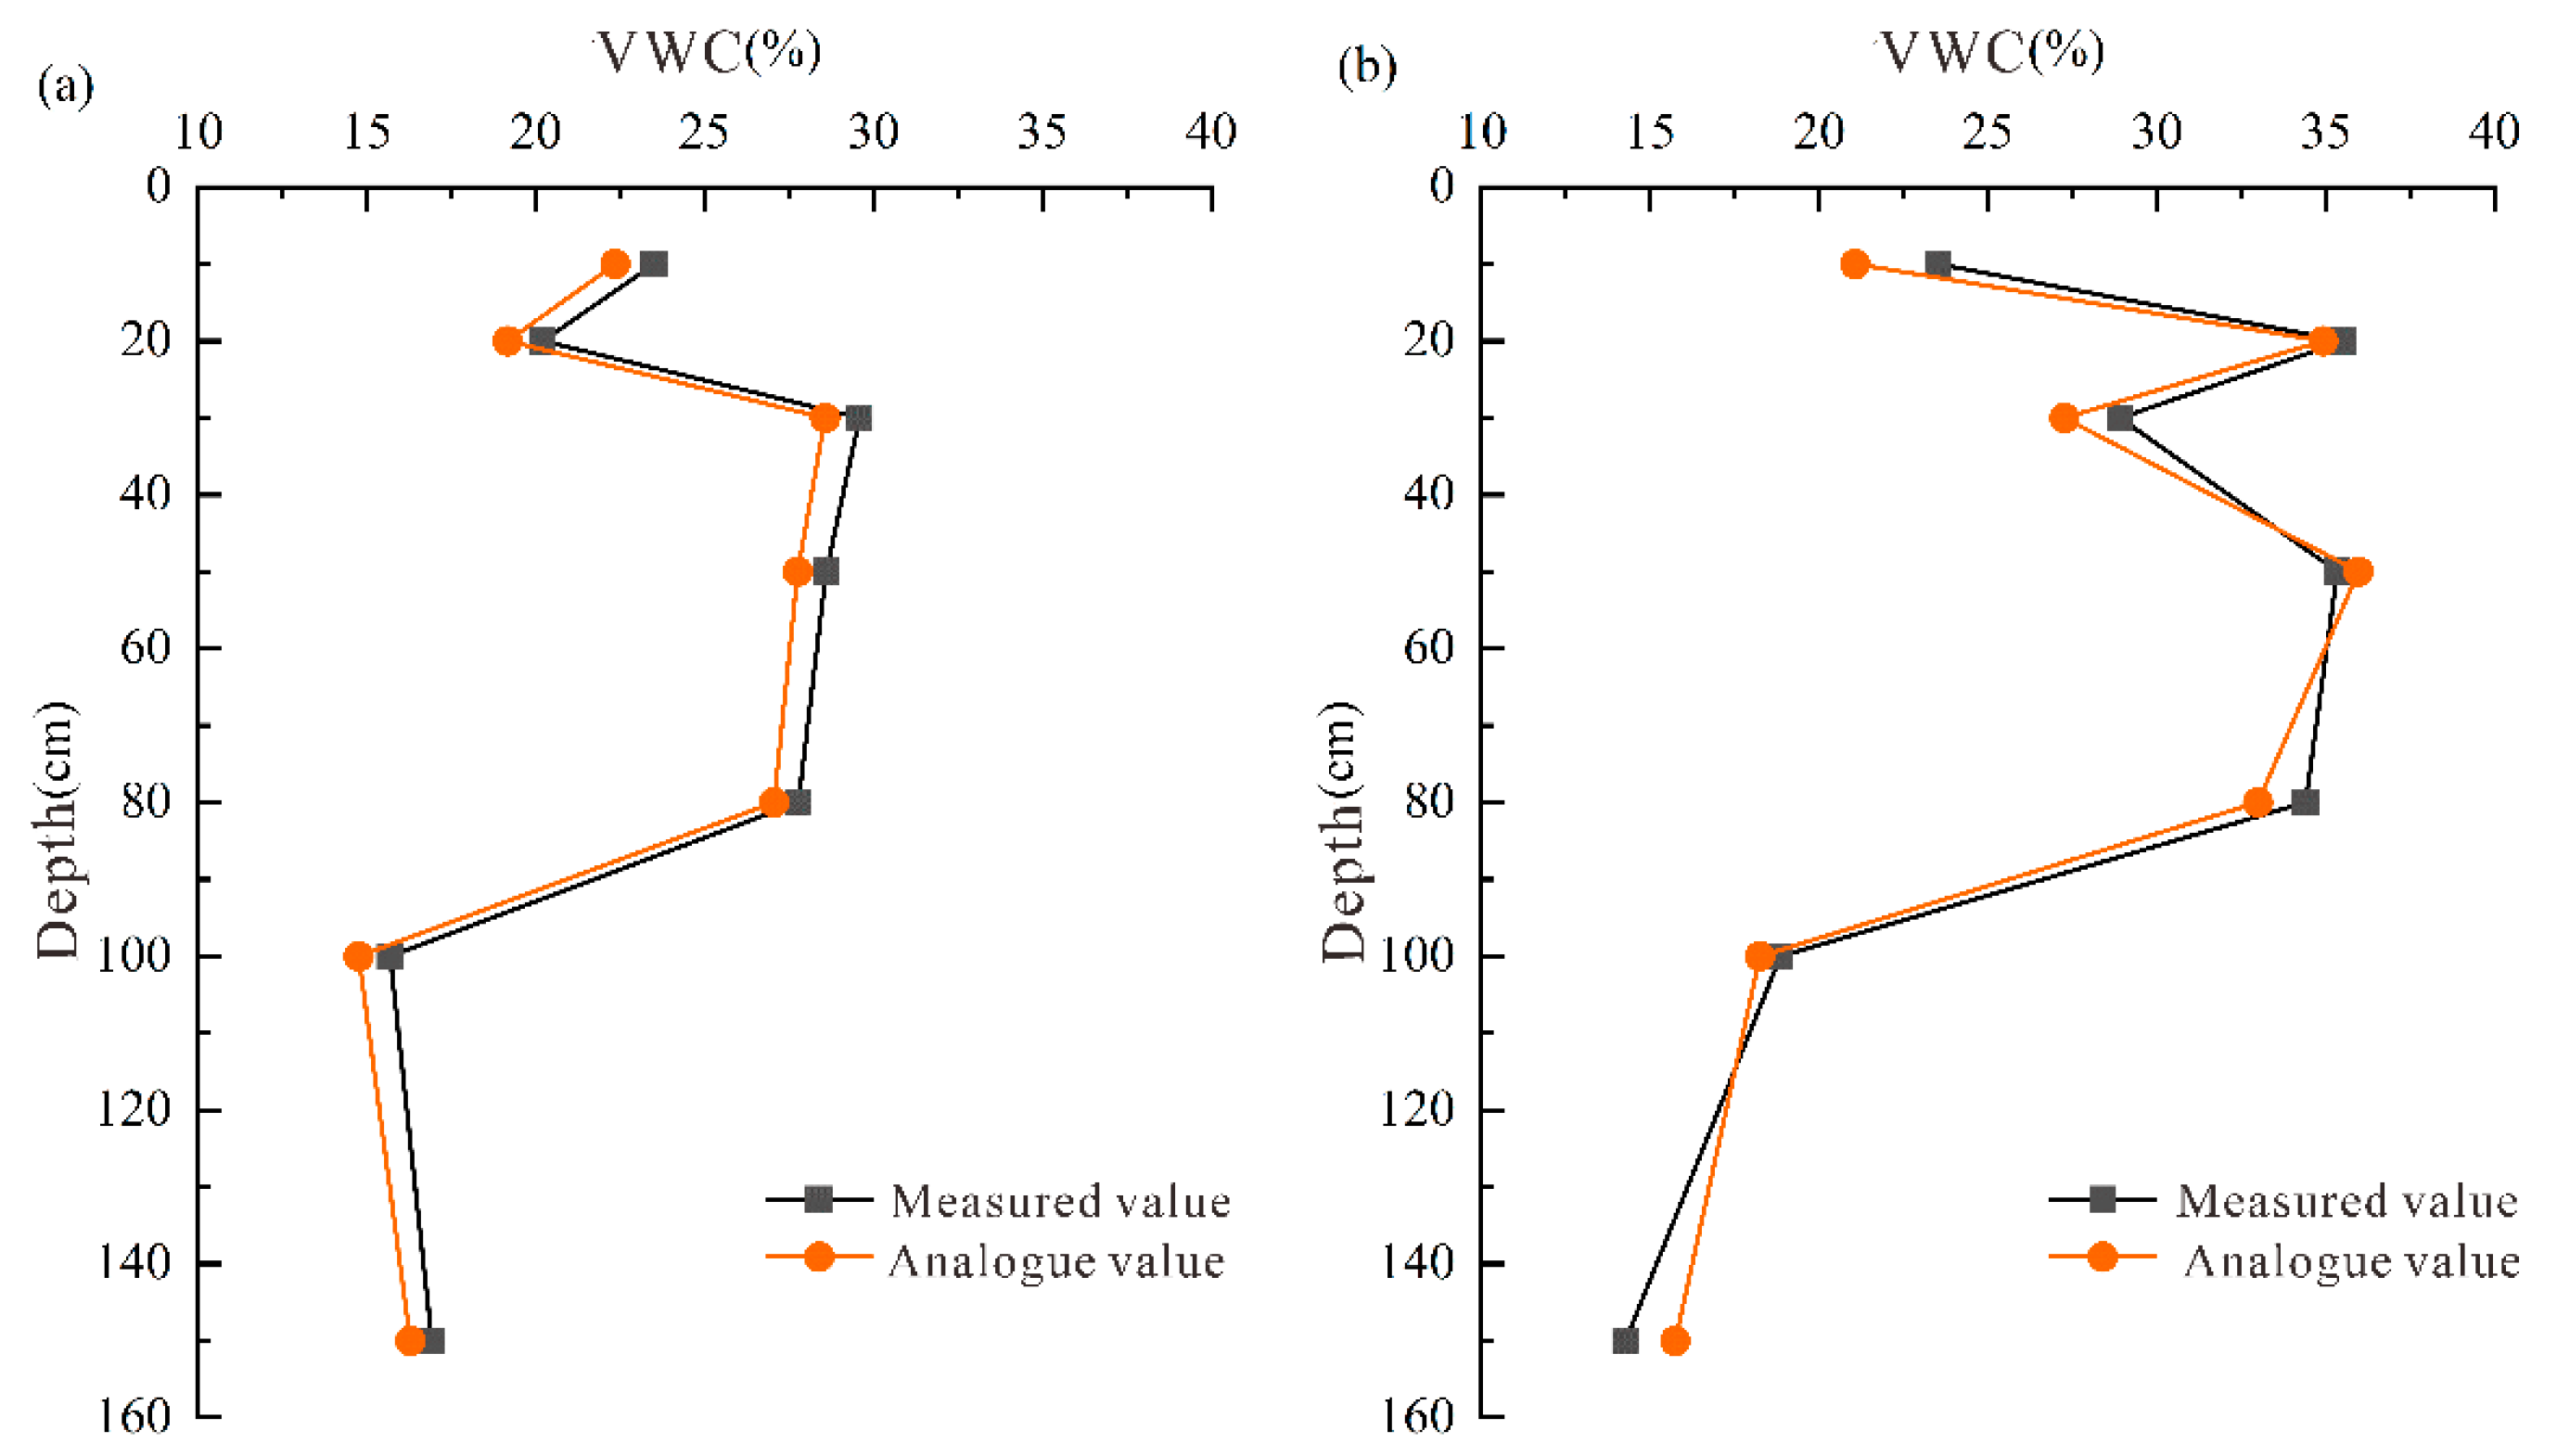
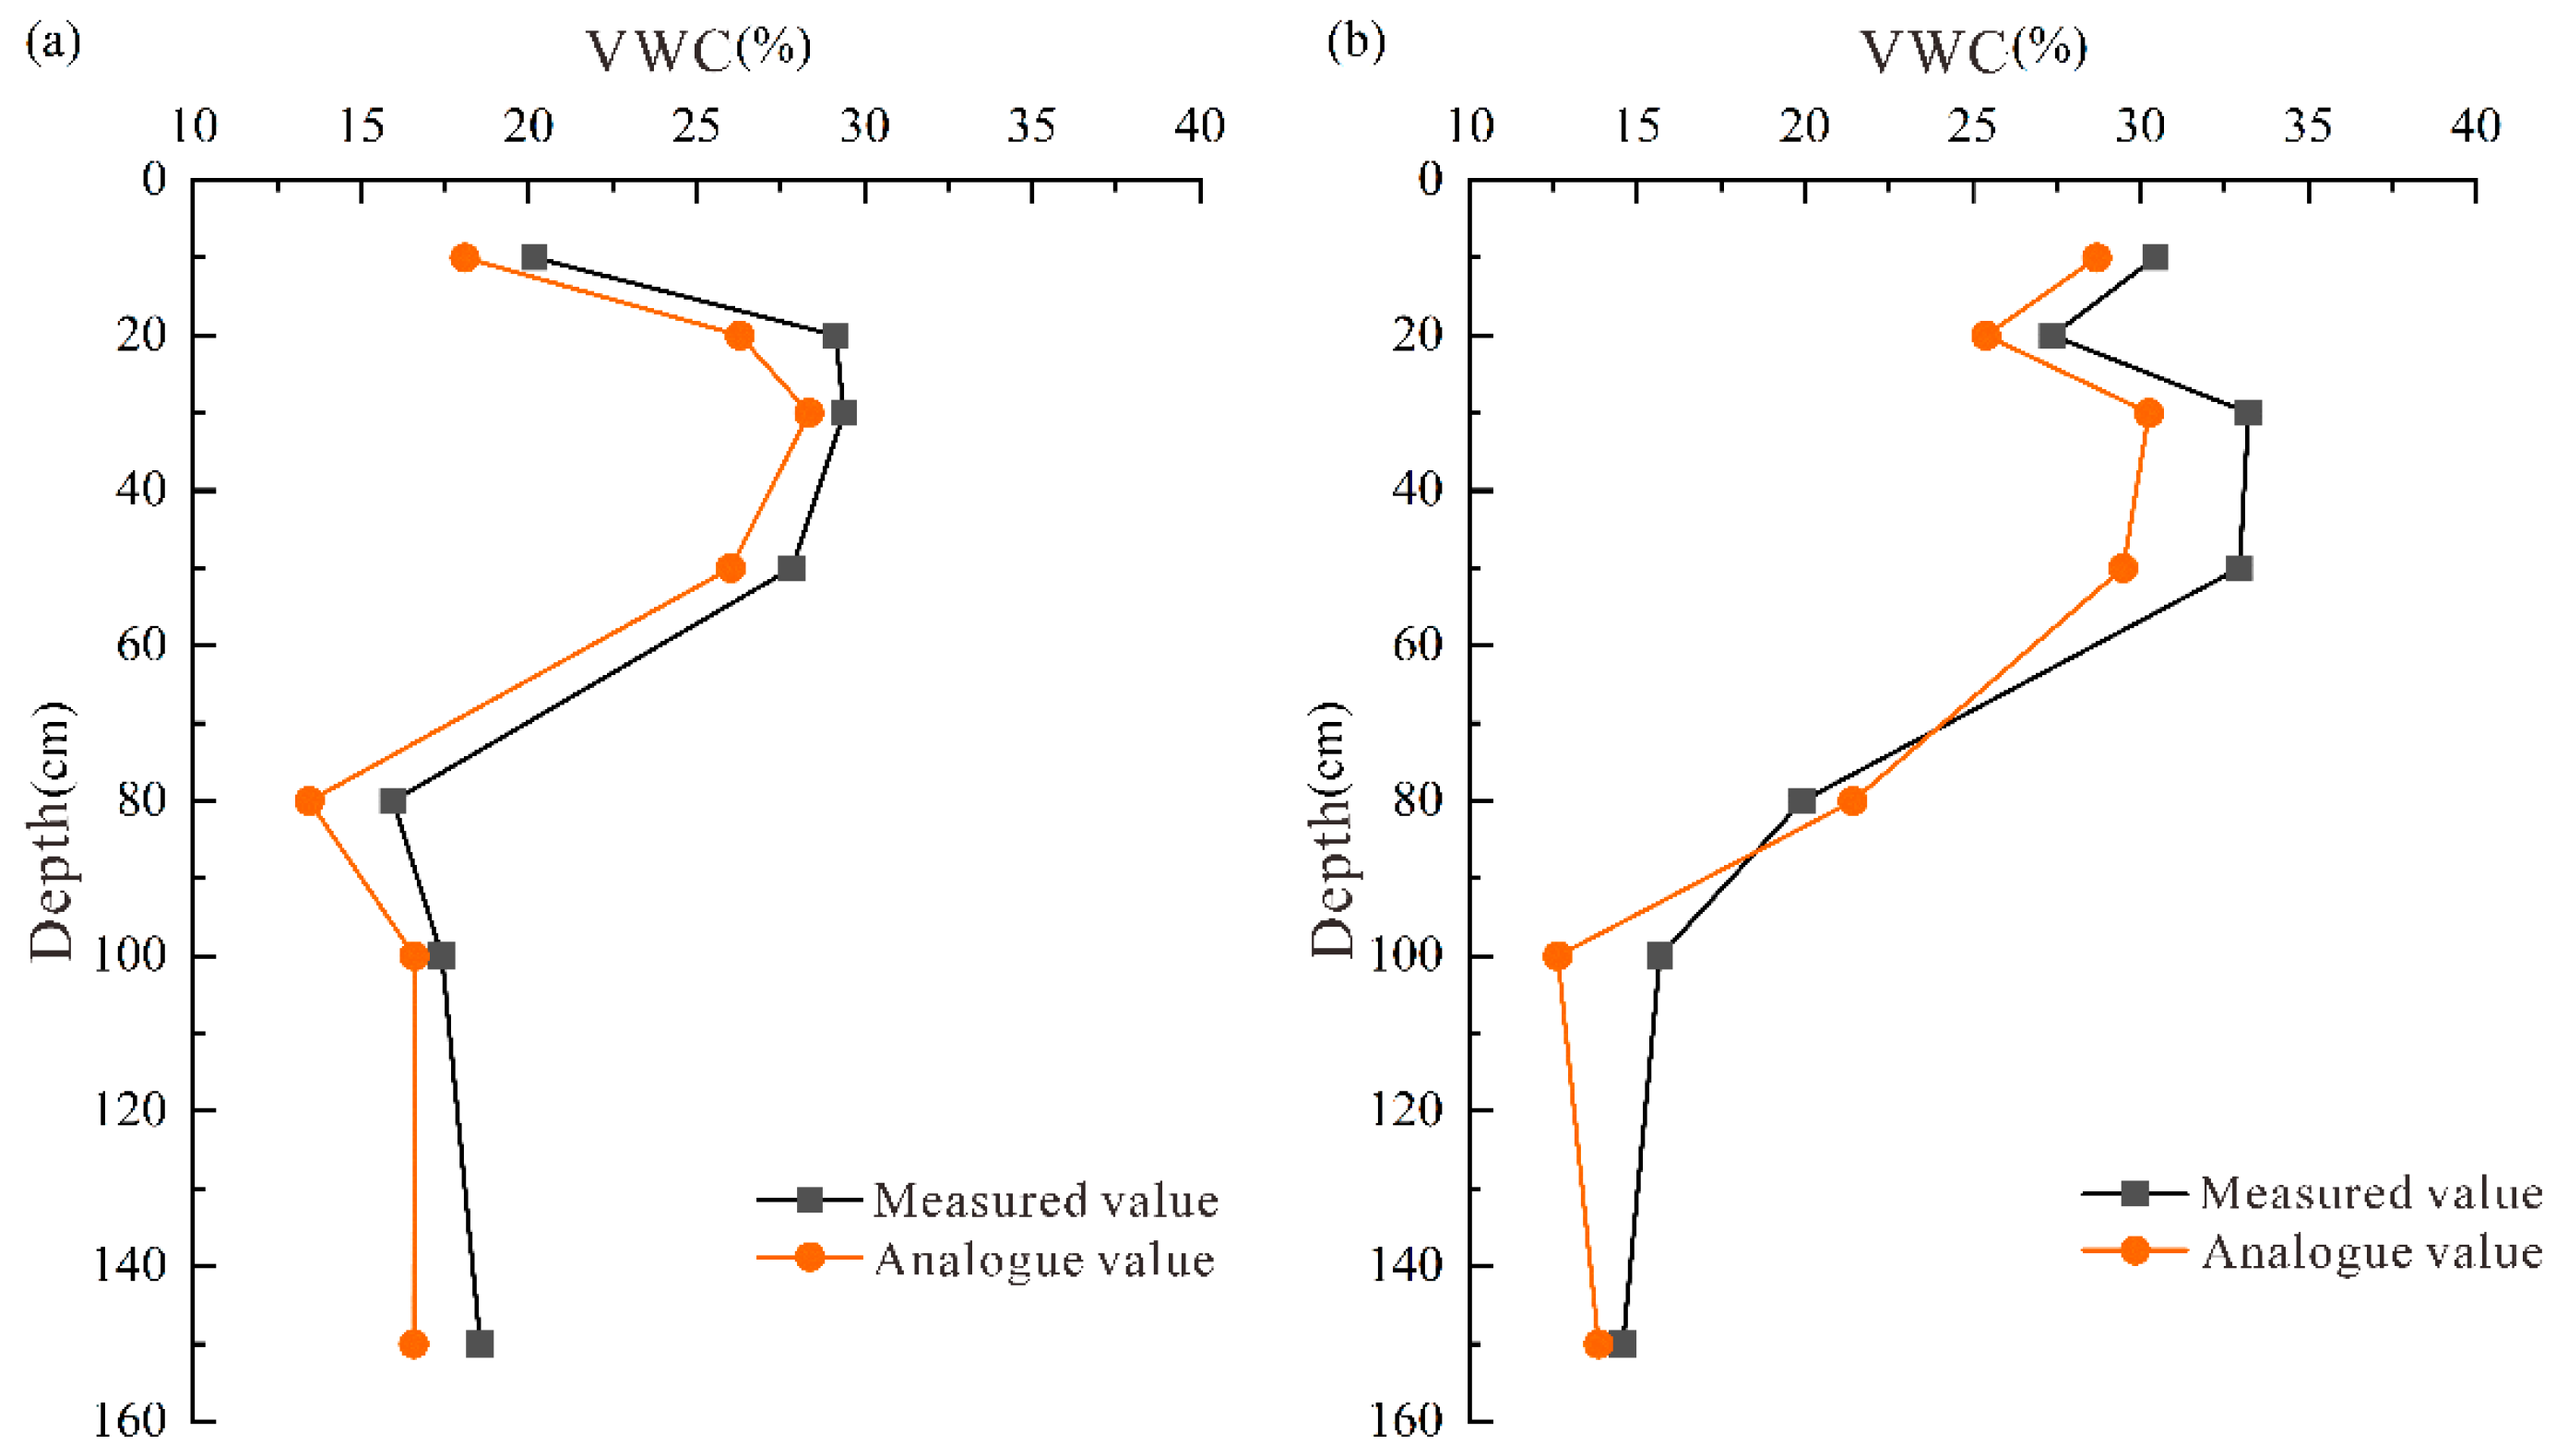
The Hydrus-1D model with optimized soil hydraulic parameters was used to simulate the water movement under different irrigation methods in the Yinchuan Plain. The overall simulation error was small. The overall trend in measured and simulated water contents were consistent. The simulated water content showed clear response characteristics to the irrigation process, indicating that the overall fitting effect of the model was good. Changes in the vertical water content during the identification and validation periods are shown in the
Figure 7 and
Figure 8.
From the vertical distribution of the water content, the overall variation trends in the simulated and measured values are consistent (
Figure 7 and
Figure 8). The fluctuation in soil water content in the intelligent irrigation quadrat within the range of 20–60 cm was greater than that at 100 and 150 cm, while the fluctuation in soil water content within the range of 20–60 cm of the flood irrigation quadrat was less than that at 100 and 150 cm. This indicates that under different irrigation methods, the response of soil water content at different depths to irrigation was different. In addition, most of the measured values of water content were greater than the simulated values. This may be because the model was generalized as 1D vertical flow. However, soil heterogeneity caused large pores in the soil, leading to the rapid downward migration of water and solutes around the soil matrix during the transport process in the vadose zone (known as preferential flow).
To quantitatively analyze the fitting effect between the simulated values of the model and the measured values of the in situ analyses, the coefficient of determination (R2), the Nash–Sutcliffe efficiency coefficient (NSE), the relative error (RE), and the root mean square error (RMSE) were selected as evaluation indices to comprehensively determine the accuracy of the model.
The errors and accuracy of the simulated values of the model during the identification and validation periods compared to the measured values of the in situ analyses are shown in
Table 2. The R
2 values between the measured and simulated values of soil water content of the two test quadrats were all >0.7, the absolute values of the RE were all <15%, and the RMSE values were all close to zero. This indicates that the model had small computational errors, and the simulated results were well-fitted with the measured values. Thus, the model precision can meet the requirements and reflect the trend in soil water content to a certain extent under the complex field conditions.
Intelligent and flood irrigation quadrats were affected by vegetation and irrigation. The exchange of soil water in the vadose zone was frequent. The response of water in the shallow vadose zone to vegetation root water uptake and irrigation activities was more obvious and rapid; thus, the simulated values were prone to large deviations from the measured values.
4. Results
4.1. Soil Water Dynamics in the Vadose Zone with Different Irrigation Methods
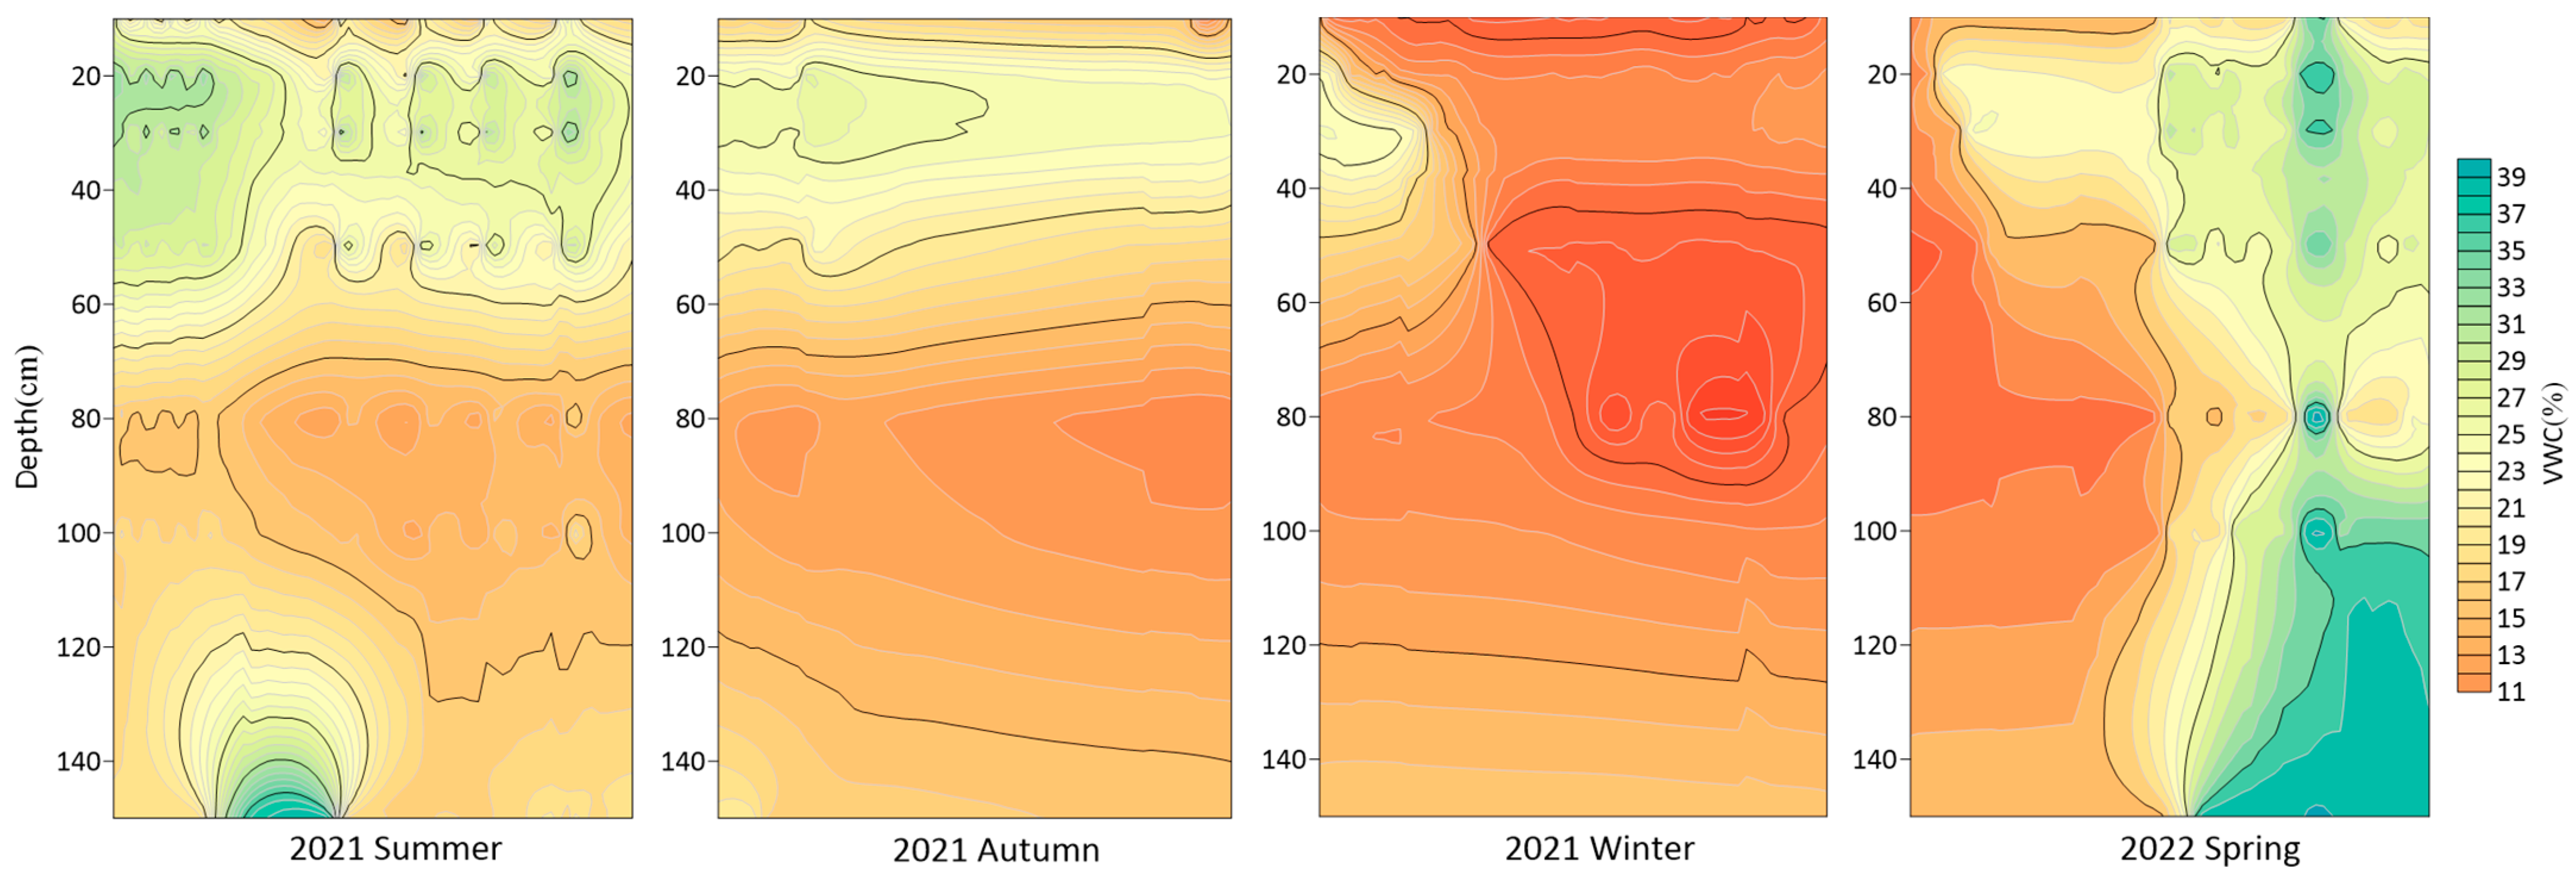
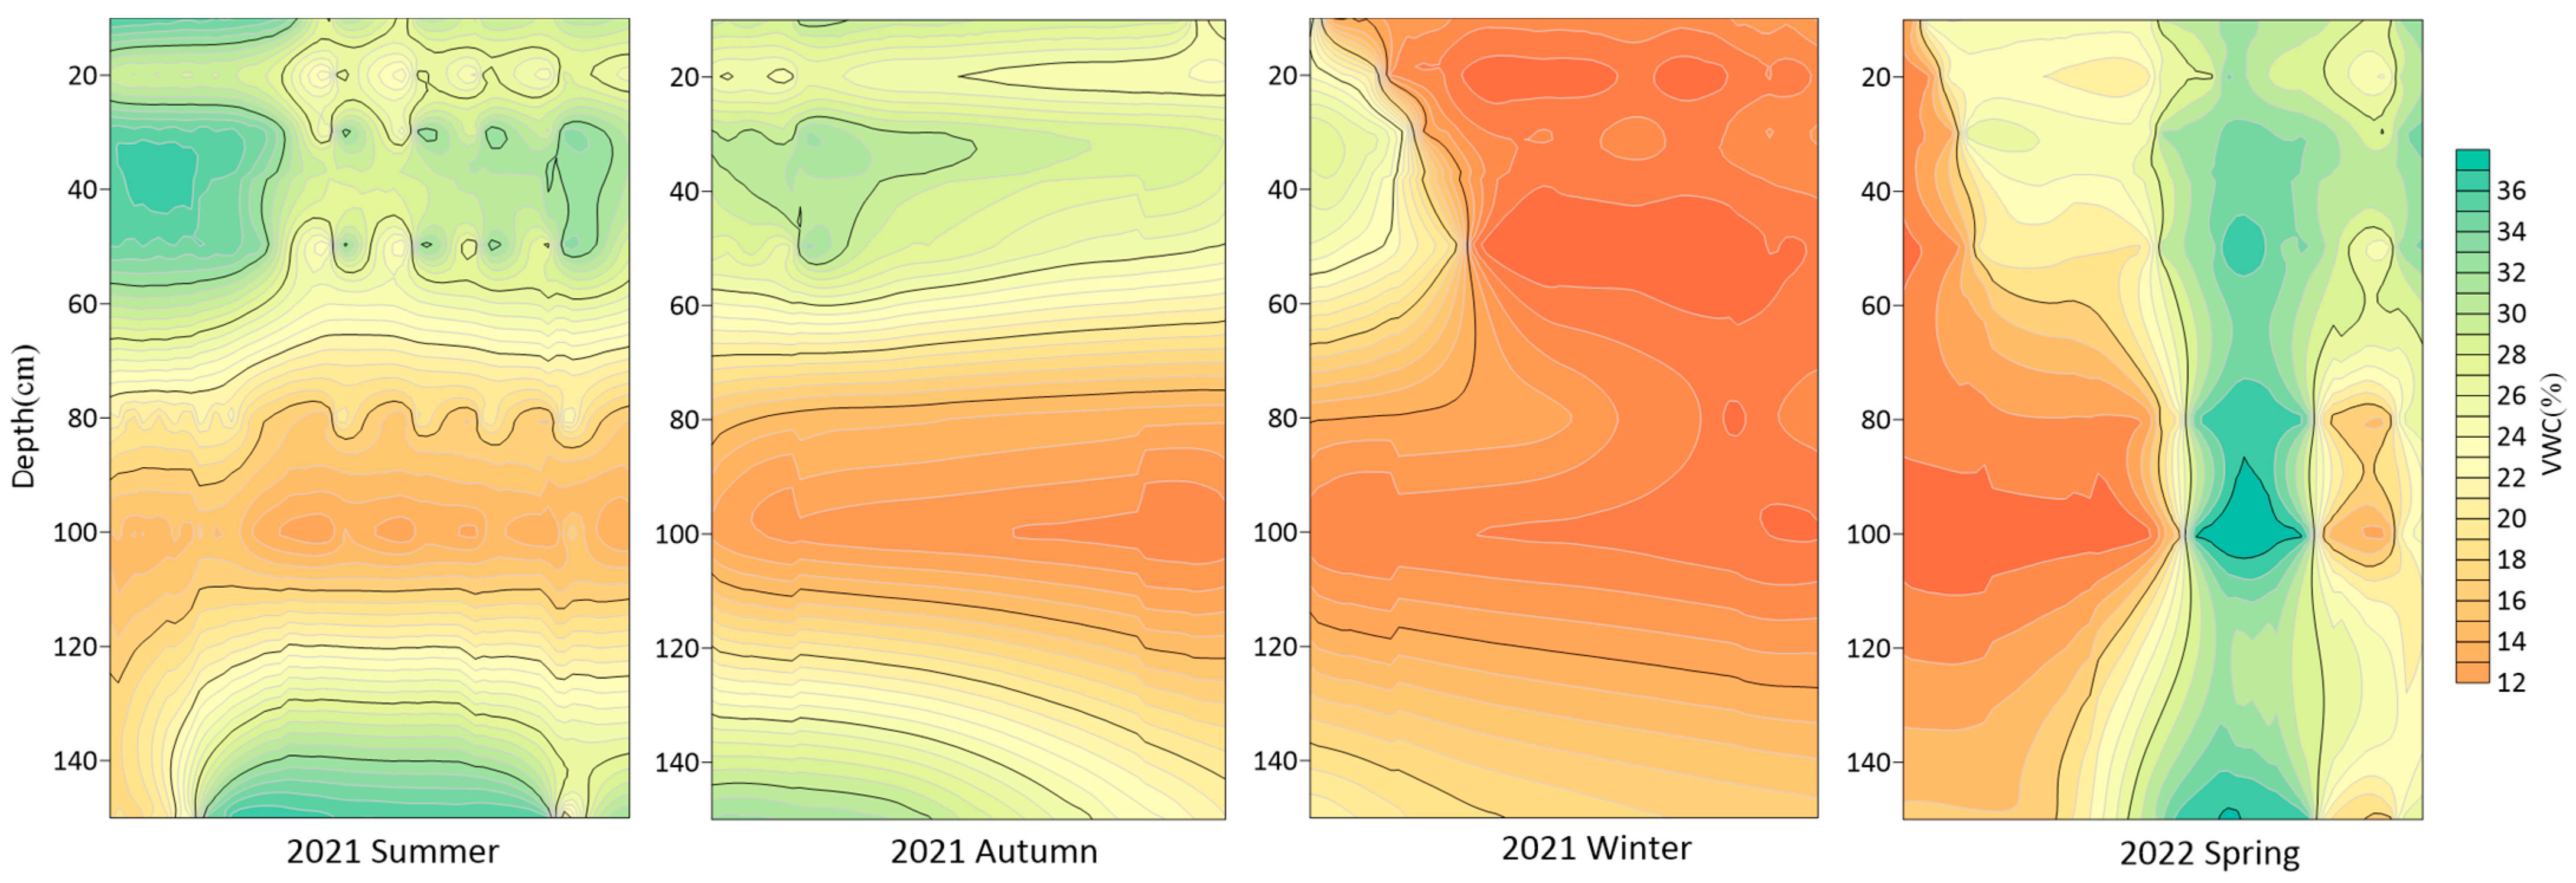
To analyze the seasonal water movement patterns in the vadose zone, contour maps of water content in the smart and irrigated quadrats were drawn (
Figure 9 and
Figure 10).
The analysis showed that the water contents of both the intelligent and flood irrigation quadrats in the spring and summer of 2021 were mainly concentrated in the range of 20–70 cm. There was a clear enrichment phenomenon in the flood irrigation quadrat in the range of 120–150 cm. The change in the water content in the winter of 2021 was more balanced (approximately 11–15%). In the spring of 2022, the water content in the early stage was relatively low, and the water content in the middle and late stages gradually increased. The water content was distributed in all layers. The water content in the intelligent irrigation quadrat was approximately 39% at 100–150 cm (
Figure 9 and
Figure 10).
The main reason was the infiltration of irrigation water from May to August, resulting in a significant change in water content. Irrigation was stopped after August, and there was less rainfall in summer; therefore, the water content decreased due to evaporation. The upper soil water content showed a significantly lower value in winter. In spring, as temperatures gradually rose and the top layer of permafrost began to thaw, the water content increased linearly with no apparent regularity. Due to the absence of crop roots below 80 cm, and lower impact from rainfall and irrigation, the overall water content was low and relatively stable. Only when regular irrigation activities were conducted in the early stage, did the vadose zone have small fluctuations in water content due to the influence of upper irrigation water and lower capillary water. In the intelligent irrigation quadrat, the fluctuation in the high-water-content area was maintained between 24% and 32%. This indicates that the intelligent irrigation system can automatically irrigate the soil according to the soil water content, ensuring that it is maintained only within the range required for crop growth, whereas the flood irrigation quadrat had a large amount of irrigation, forming a high-water-content layer at 20–60 cm, with a maximum water content of 38%. The portion of the water that exceeded the demand for plant growth tended to move downwards.
Based on the fluctuating state of soil water content at different depths, soil layers can be classified into active, transitional, and relatively stable layers. The intelligent irrigation quadrat was divided into the shallow active (0–100 cm) and deep transitional stable (100–150 cm) layers, whereas the flood irrigation quadrat had weak variability above 20 cm. It was divided into the shallow transitional (0–20 cm), middle active (20–100 cm), and deep stable (100–150 cm) layers.
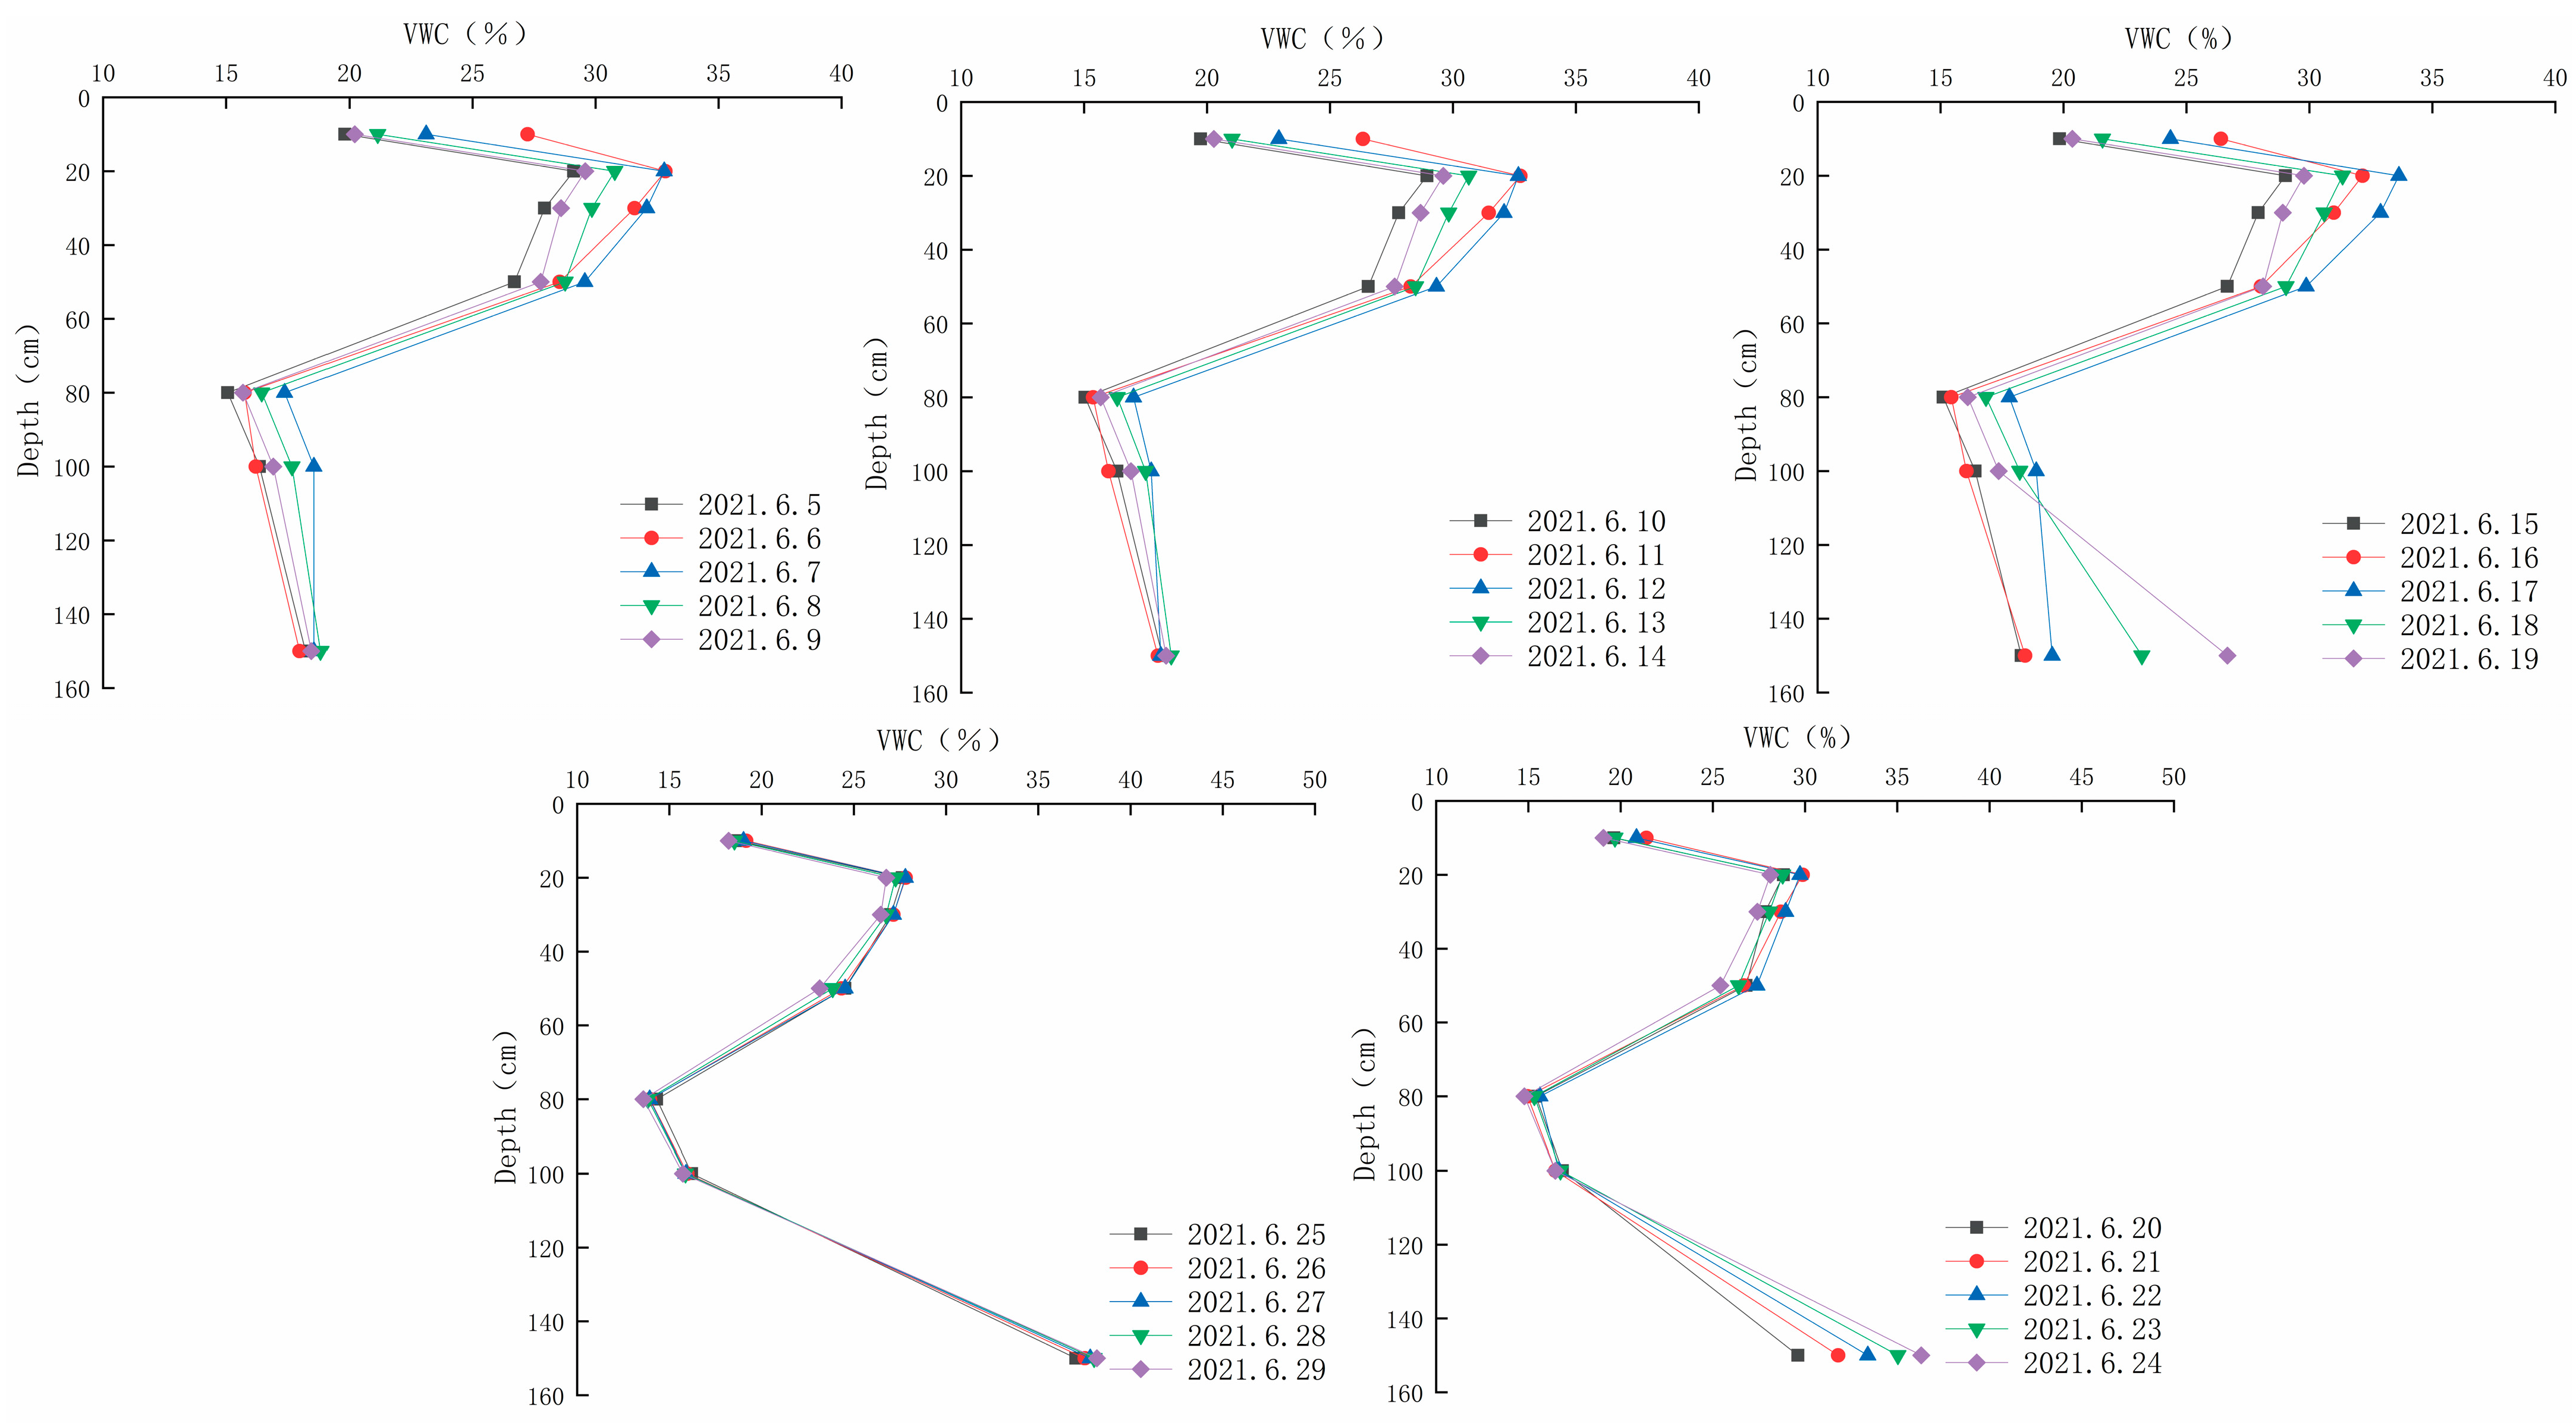
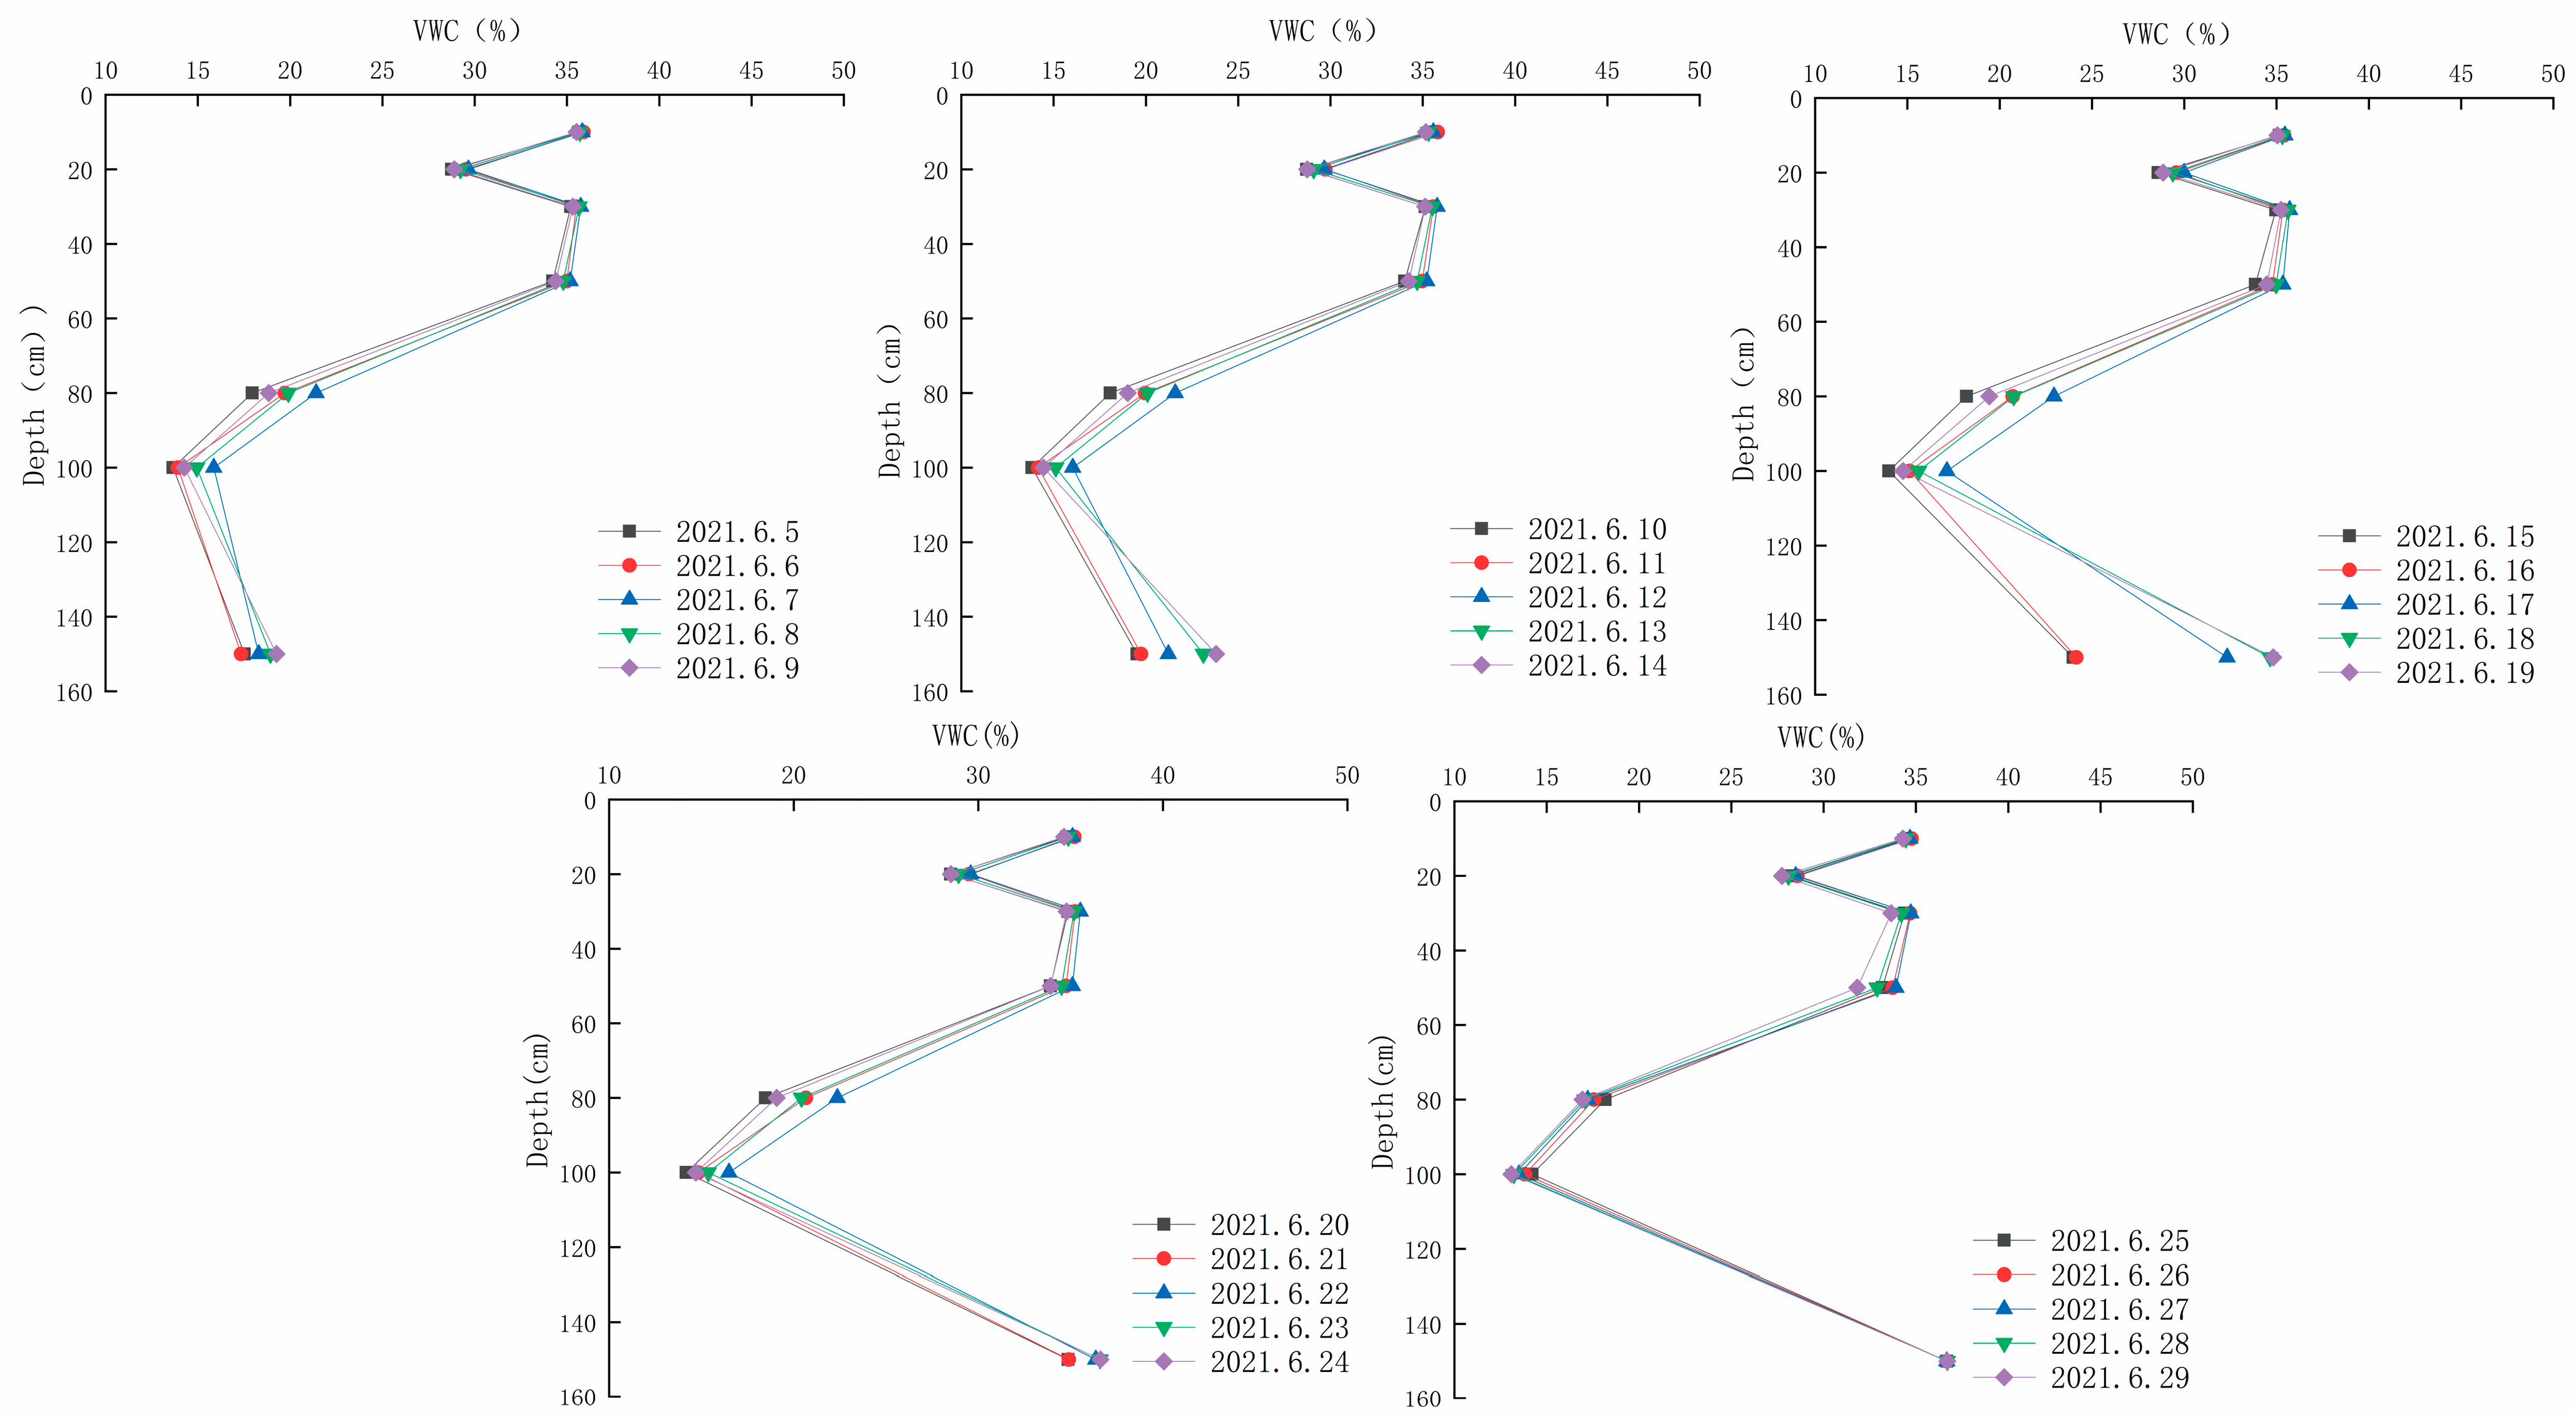
According to the irrigation data of the experimental field, the intelligent and the flood irrigation quadrats were recharged with water once every 5 d in June 2021. A total of five irrigations were conducted, which resulted in changes in the water content of each layer from 10 to 150 cm.
Figure 11 shows that after recharging the water five times, the soil water content of the intelligent irrigation quadrat had an inverted “S-shape” variation, first increasing, then decreasing, and finally increasing with soil depth over time. The water content of the surface layer (10–50 cm) showed an overall decreasing trend, the water content of the middle layer (80–100 cm) remained stable, and the water content of the bottom layer (150 cm) showed a significant increasing trend. After recharging the water five times in the flood irrigation quadrat, the overall water content showed a decreasing–increasing–decreasing–increasing trend, which formed a “W-shaped” pattern with increasing soil depth over time (
Figure 12). The overall water content of the surface layer (10–50 cm) was relatively stable, showing a slight decrease. The water content of the middle layer (80–100 cm) was stable. The water content of the bottom layer (150 cm) also showed a significant increasing trend.
The water in the vadose zone responded significantly to the irrigation process. A single irrigation could increase the water content of the vadose zone rapidly, but the influence depth of irrigation infiltration was limited. The water content of intelligent irrigation was concentrated at 30–50 cm, weakly impacting groundwater. The high-water-content area of the flood irrigation quadrat was at 50–80 cm, and the influence was stronger in the vertical direction. A certain amount of irrigation infiltration recharged groundwater. The water content increased significantly after irrigation. The flood irrigation method had a greater effect on the water content in the deep vadose zone.
4.2. Soil Water Response to Irrigation and Groundwater Recharge
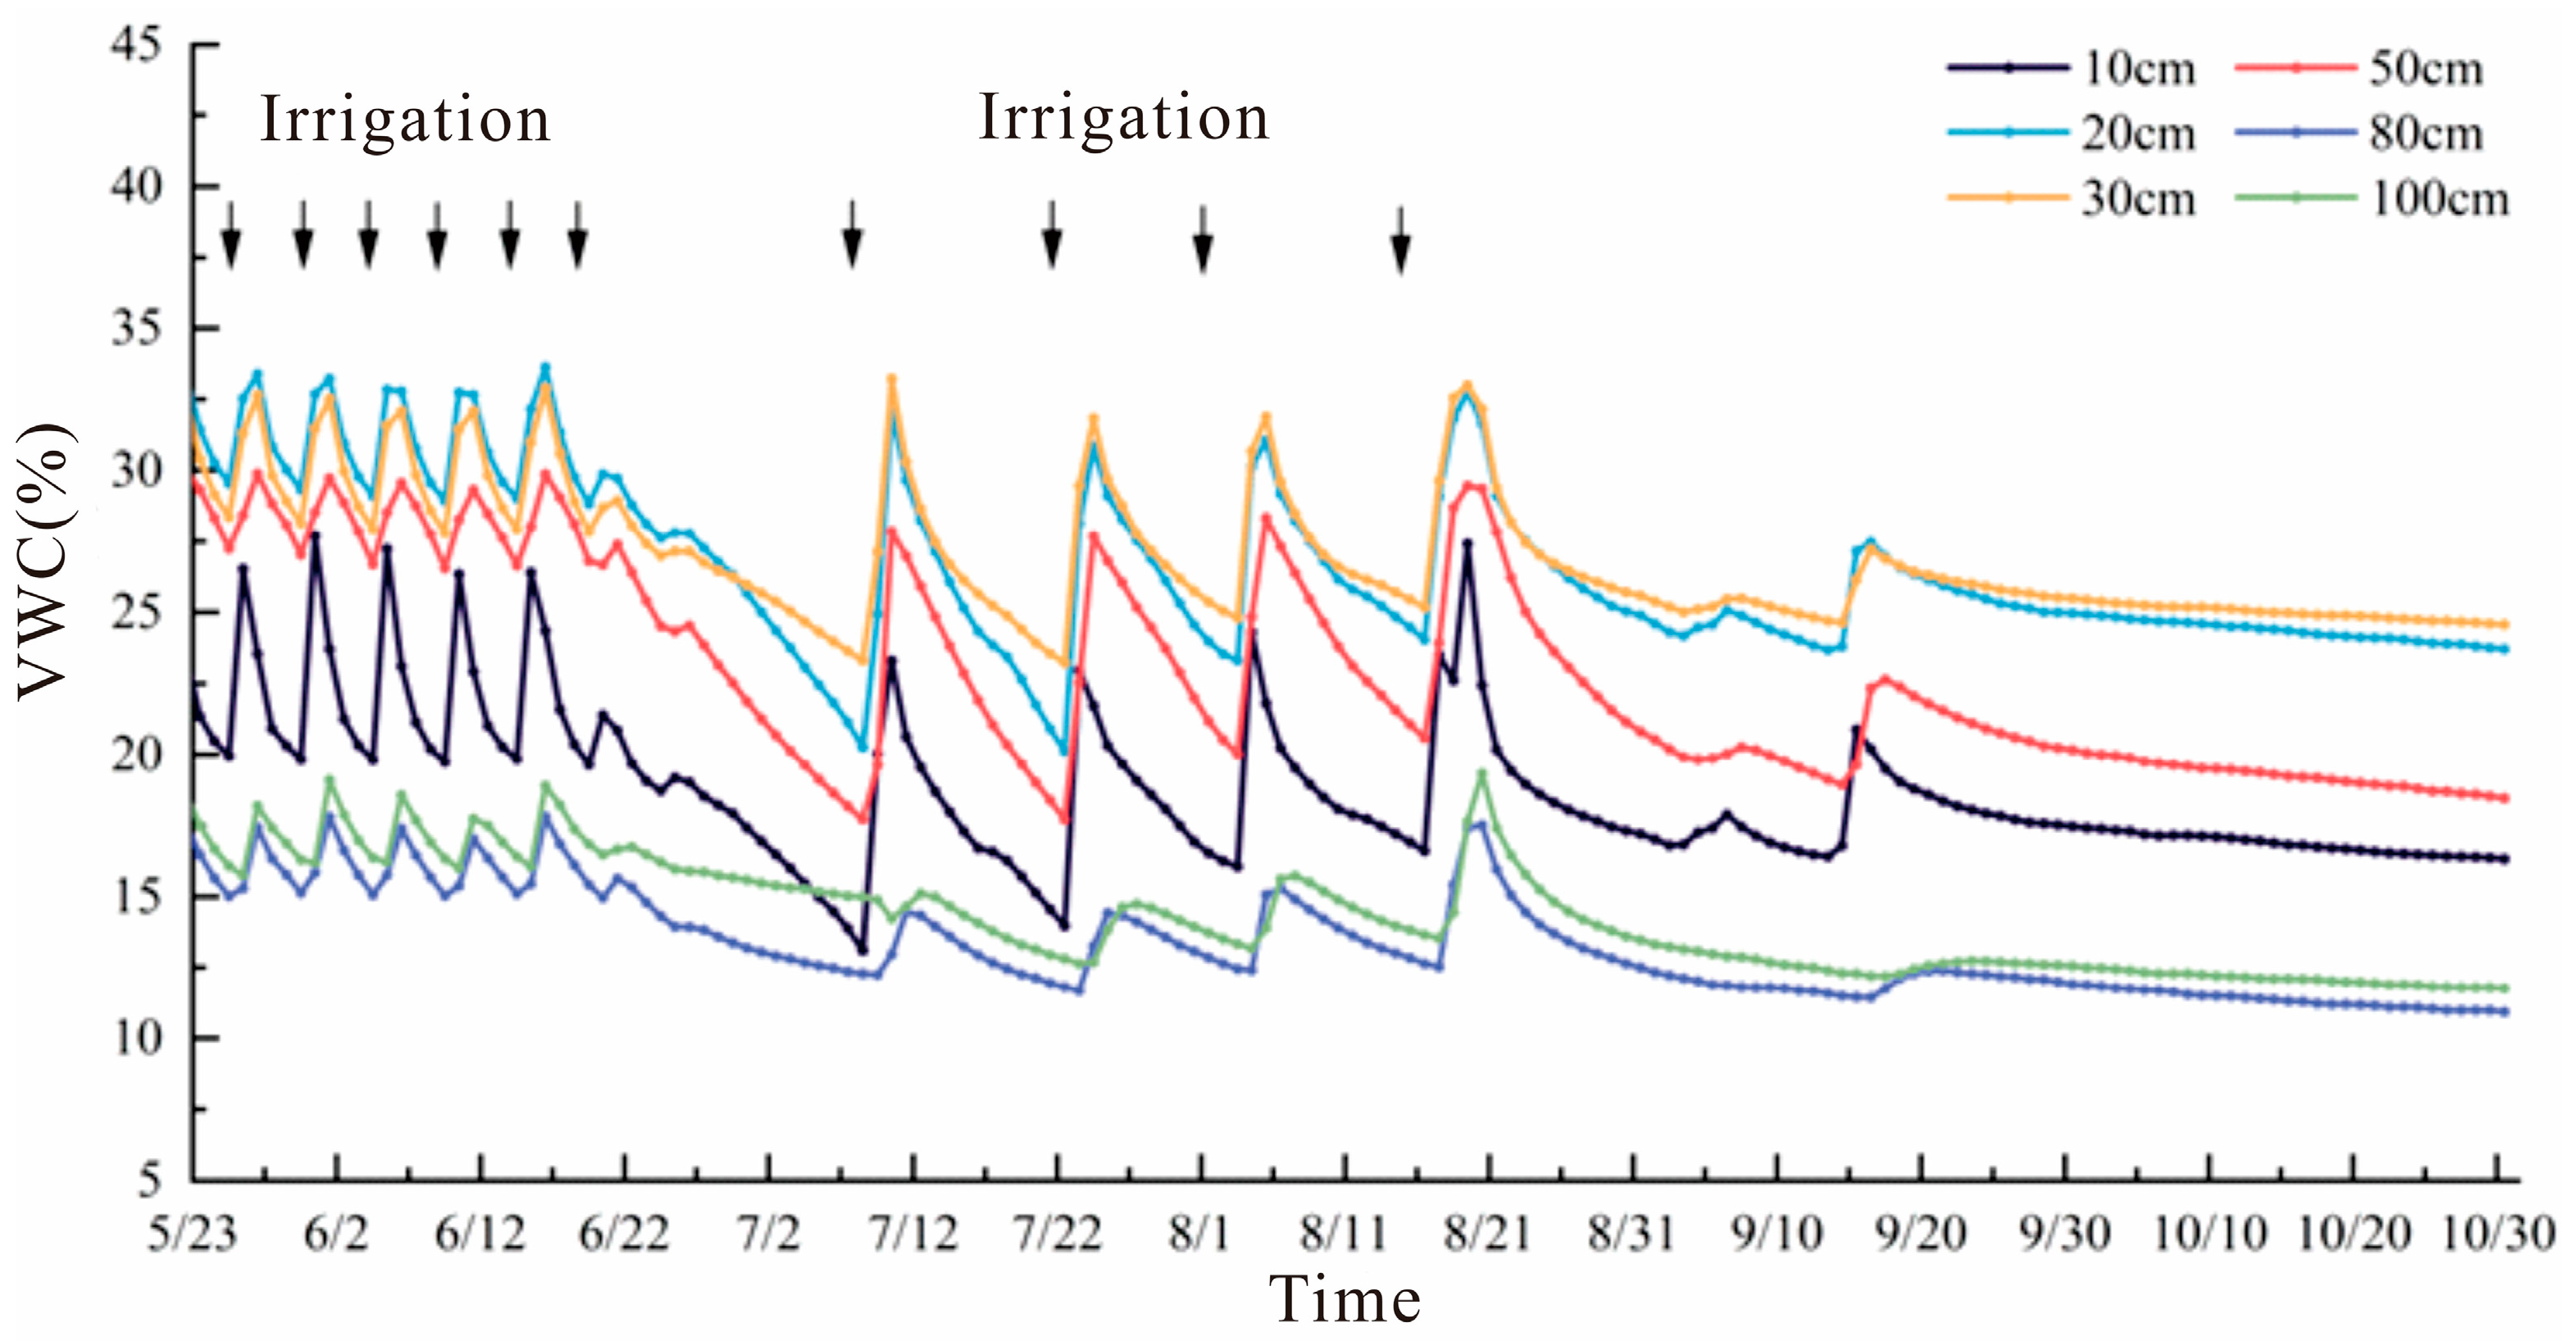
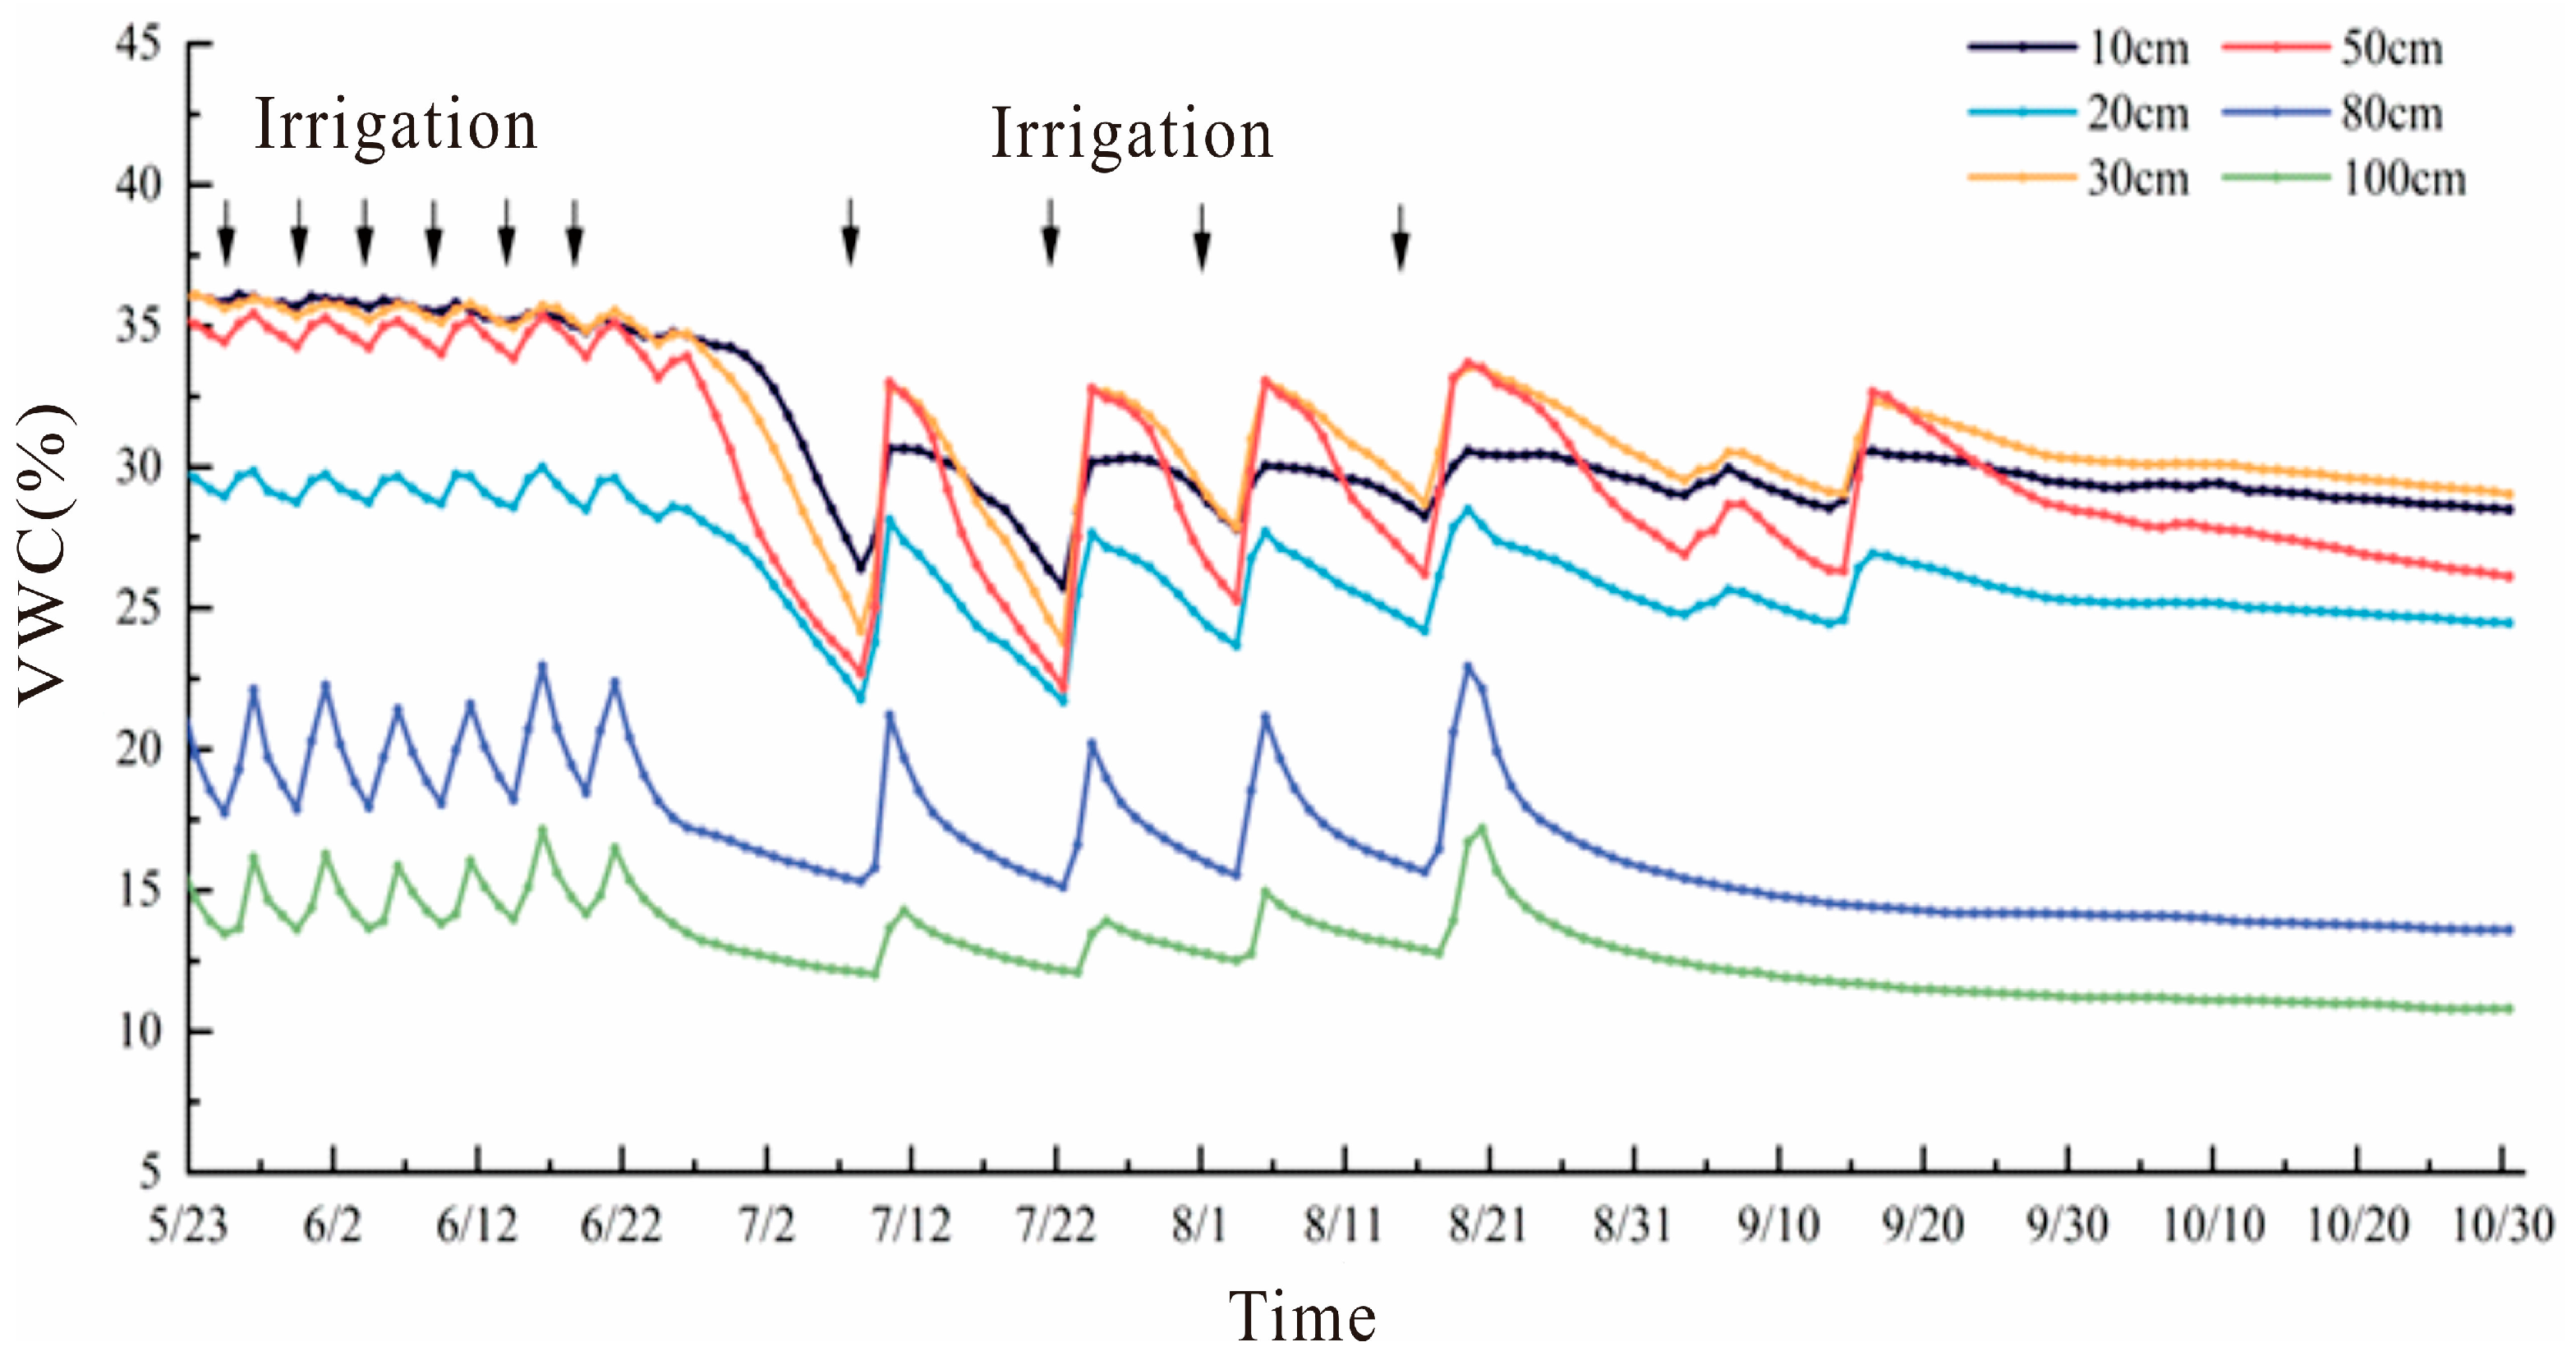
The climate of Yinchuan Plain is arid, the annual rainfall is less than 200 mm, and the main water source for crop growth is agricultural irrigation. In order to study the response of water in the aerated zone on the irrigation process in Yinchuan Plain, and reveal the law of water migration, simulation tests were conducted on the irrigation quadrat of the test site from May 2021 to October 2021. Irrigation tests were conducted on the intelligent irrigation quadrat and flood irrigation quadrat by means of intelligent irrigation and flood irrigation, and irrigation time and irrigation volume were recorded. The response of water in the aerated zone to the irrigation process under different irrigation methods was investigated. It can be seen from
Figure 13 and
Figure 14 that the soil moisture content of the intelligent irrigation quadrat and the flood irrigation quadrat is obviously corresponding to irrigation. The significant increase point in soil moisture content at each depth is consistent with the irrigation time point, and the response degree of soil moisture content at different depths to irrigation is different. For the intelligent irrigation quadrate (
Figure 13), the moisture content of the 10 cm soil fluctuated the most, and the maximum variation in moisture content reached 11%. Due to the large depth of the 80 cm and 100 cm soil layers, the moisture content did not respond significantly to irrigation, and the moisture content only increased by about 3% after each irrigation, which had a certain lag effect. That is, the shallow water content changes more, and the deep water content changes less. This is because intelligent irrigation automatically carries out low irrigation according to soil moisture content to achieve the purpose of water saving. The change in soil moisture content of the flood irrigation sample (
Figure 14) is similar to that of the intelligent irrigation sample, but the difference is that the range of the changes in soil moisture content at the buried depths of 10 cm, 20 cm, and 30 cm is smaller than that at the buried depth of 80 cm and 100 cm, which indicates that after irrigation activities, irrigation water begins to penetrate downward and the shallow soil moisture content increases. After the end of irrigation activities, the shallow soil water content was greater than the field water capacity, and the plant roots absorbed water while the soil water continued to move downward. However, it can be seen that in the case of intelligent irrigation, the recharge effect of irrigation water to deep soil water is weakened with the increase in depth, and the range of the changes in shallow soil water content under flood irrigation is smaller than that of deep soil water content.
To compare the groundwater recharge by irrigation under different irrigation methods, the vertical infiltration recharge coefficient of groundwater was calculated using the following equation [
31]:
where
γ is the soil moisture infiltration coefficient,
R is groundwater recharge (mm),
P is rainfall (mm), and
I is irrigation (mm).
The depth of groundwater in the Yinchuan Plain is generally shallow, with typical vertical infiltration characteristics. The groundwater level determines the thickness of the vadose zone. Areas with deep groundwater levels will form thick vadose zones, thereby altering the vertical infiltration and recharge process of groundwater.
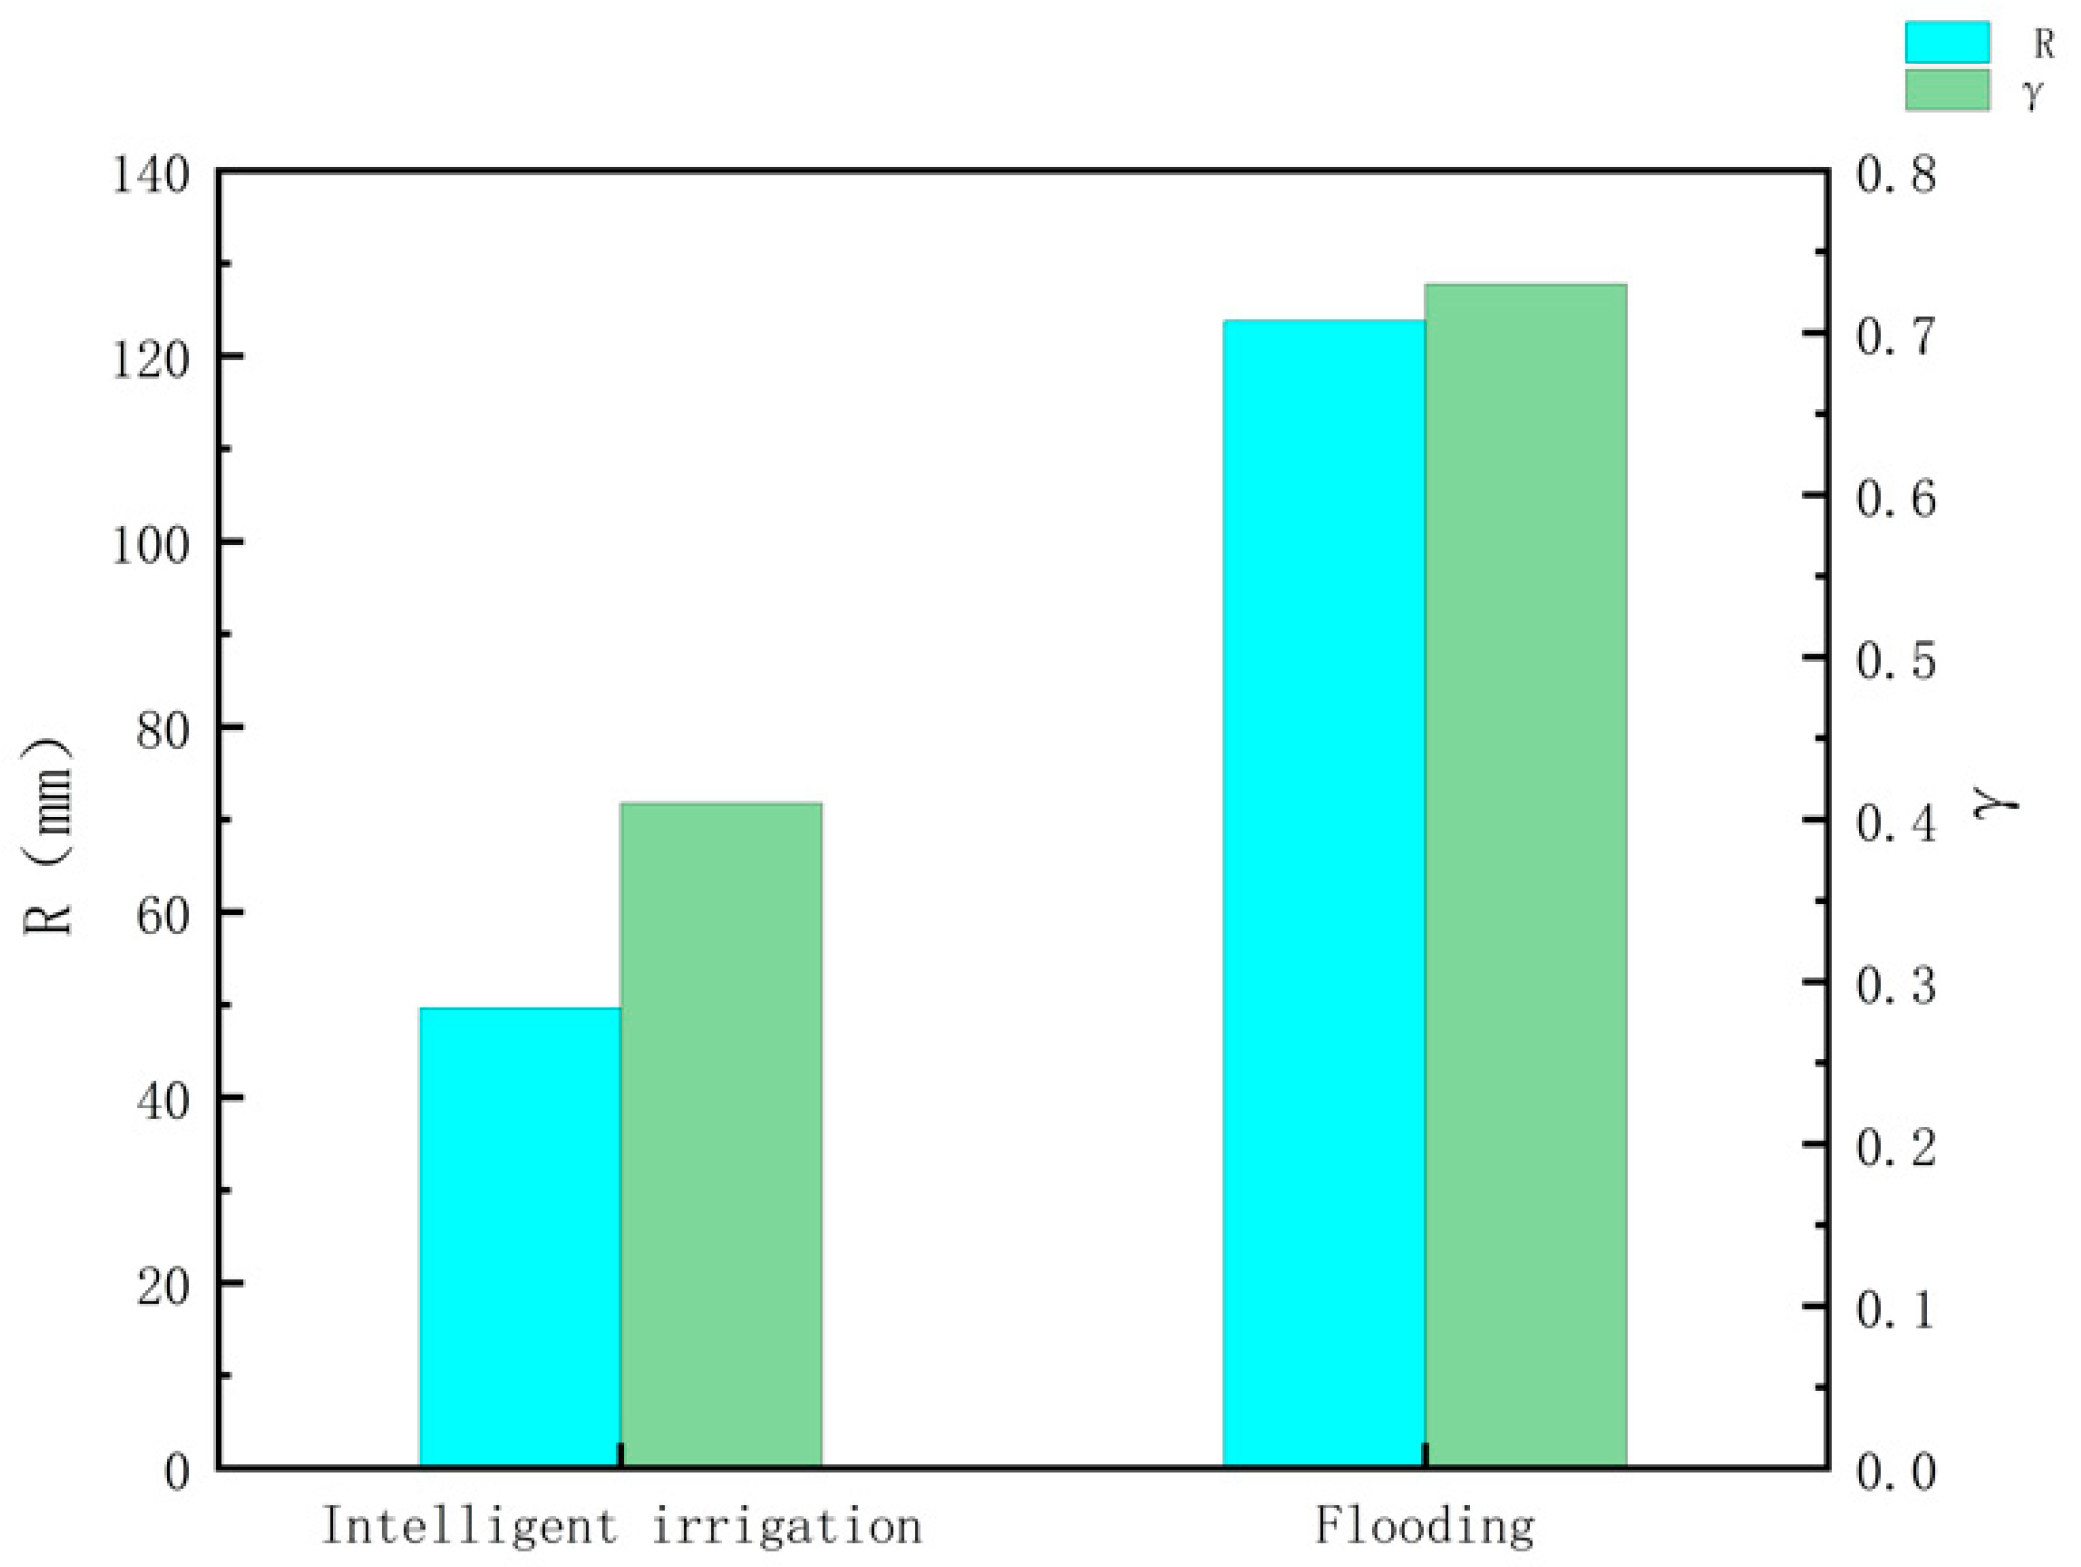
The recharge of the intelligent irrigation quadrat was 49.62 mm, and the vertical infiltration coefficient of groundwater was 0.41; the groundwater recharge of the flood irrigation quadrat was 123.78 mm, and the vertical infiltration coefficient of groundwater was 0.73 (
Figure 15). It was shown that during the simulation period of the study area, when small-scale rainfall reached the surface, it partially evaporated and recharged the soil pores. Only a small amount of groundwater recharge was possible.
Different groundwater levels were set according to the groundwater depth in the Yinchuan Plain. The specific simulation schemes are presented in
Table 3.
The simulation period was from 3 June to 15 November 2021, with an initial time step, maximum time step, and minimum time step of 1, 1, and 0.0001 d. The grid size of the vadose zone was set to 1 cm within the simulated depth, which was consistent with the depth of the groundwater level. The soil lithological structure of the simulation profile was consistent with that of the in situ analysis quadrat. The soil physical parameters of the model were identified through inversion optimization. The upper boundary condition was the atmospheric boundary, which is affected by rainfall, irrigation, and evaporation. Maize was chosen as the surface vegetation. The lower boundary was a free drainage boundary.
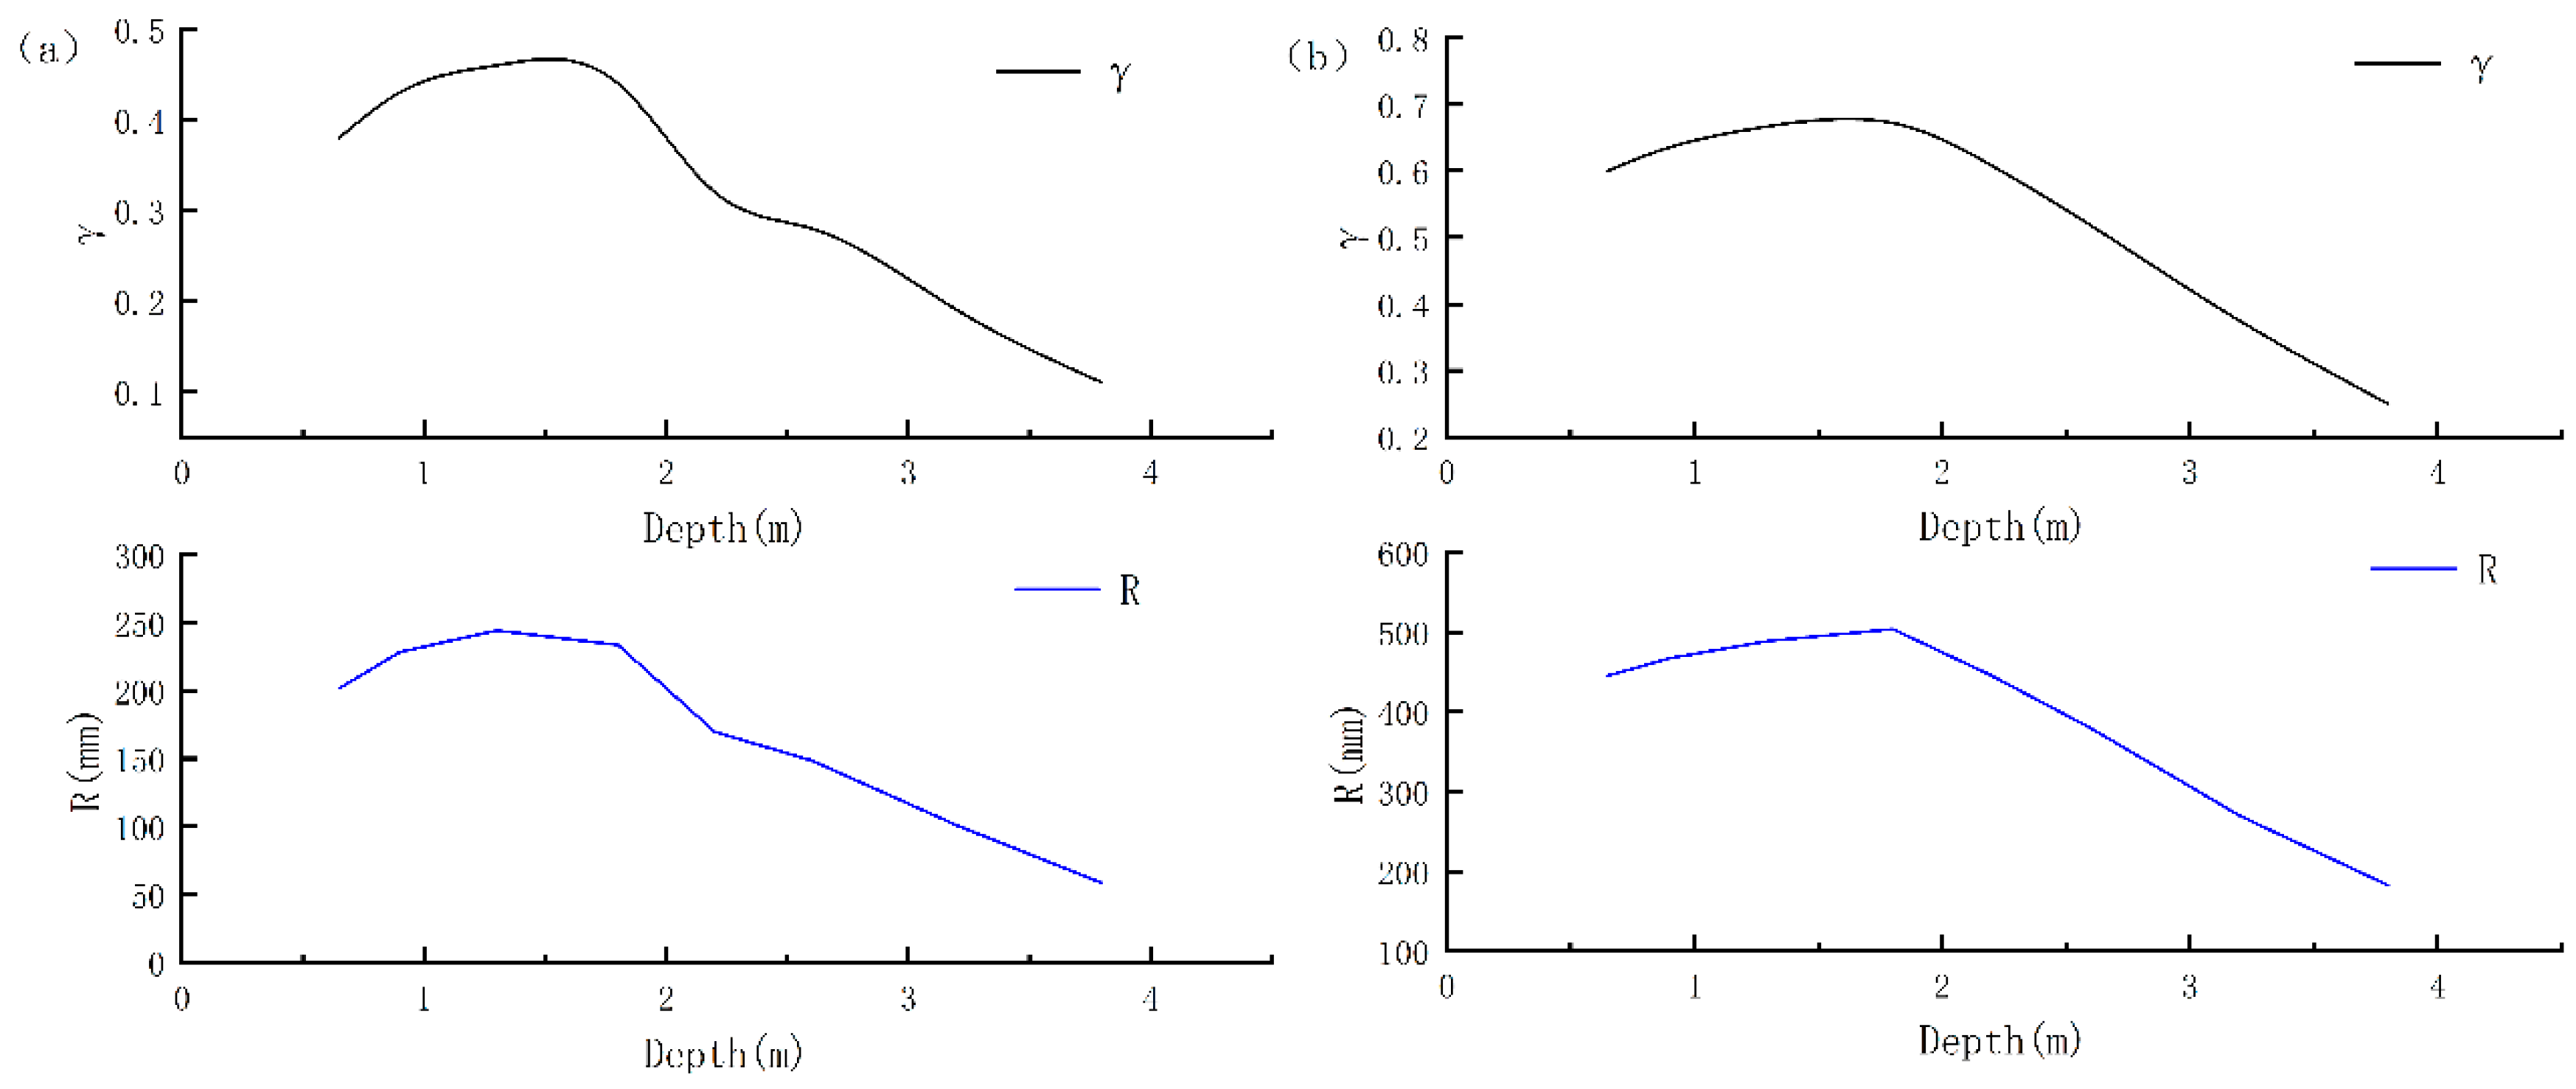
The groundwater infiltration was obtained by solving the model and calculating the groundwater infiltration recharge coefficient according to different depths of groundwater levels (
Figure 16). From the calculation results, the optimal depth of groundwater level for infiltration recharge varied among different irrigation methods. For intelligent irrigation, the infiltration recharge coefficient was the largest and groundwater recharge was favored when the depth of the groundwater level was 1.3 m. For the flood irrigation method, groundwater recharge was favored when the depth of the groundwater level was 1.8 m. The infiltration recharge coefficient reached 0.69.
5. Discussion
Numerical models of water infiltration in the vadose zone under different irrigation methods were constructed based on in situ analyses and numerical simulations. However, limitations in using the models to reveal the groundwater recharge mechanisms by irrigation methods remain.
The Hydrus-1D model is a method for simulating water infiltration in the soil. This model is currently mostly used for simulating water and solute infiltration in farmland and indoor soil columns. However, the infiltration of soil water in practice is complex and dependent on many factors, such as groundwater mineralization, lithological structure, soil temperature, and other indicators. This model cannot consider all these factors [
32]. Consequently, some errors occurred. However, the model, as a convenient and quick prediction tool, can reflect the variation trend in soil water over time to some extent [
33]. The vegetation distribution in the Yinchuan Plain is uneven and diverse and the landforms are complex. In addition, the climate is constantly changing. There were few related studies that have considered these field conditions. This study only focused on two typical irrigation methods in the Yinchuan Plain, which to some extent can reflect the law of soil water transport. But the complexity of the lithological structure, the irregularity of the vegetation distribution, and the variability in the meteorological conditions have a significant impact on the simulation results of the model. Therefore, future studies will focus on accurately defining the soil structure and physical indicators and improving the accuracy of vegetation indicator surveys based on the research area. In addition, optimizing the model resistance parameters to improve the applicability of the Hydrus-1D model in the research area is necessary. Furthermore, the law of water transport and groundwater vertical infiltration recharge in the vadose zone in complex lithological structures should be considered in future studies.
The experimental station has a large amount of equipment, a high frequency of observation, and a huge amount of data. All kinds of data acquired should be checked, archived, and statistically analyzed in a timely manner. For abnormal data found, instruments and equipment should be checked in a timely manner to ensure the integrity and reliability of observation data. Since the irrigation times have a certain impact on the change in soil water content, the response of soil water content to irrigation before and after the irrigation process was not further studied. The change in soil water content under the two irrigation methods was compared: With the soil moisture content of the day before irrigation as the background value, the changes in moisture content on the first, third, and fifth days after irrigation were observed, and whether there were similarities and differences in the curve of moisture content variation with depth of irrigation on the moisture content of aerated zone was analyzed, as well as whether irrigation had different degrees of influence on the moisture content of the aerated zone of each layer.
