Article

Study on the Influence of Urban Water Supply Pipeline Leakage on the Scouring Failure Law of Cohesive Soil Subgrade

School of Safety Engineering, Chongqing University of Science and Technology, Chongqing 401331, China
*
Authors to whom correspondence should be addressed.
Water 2024, 16(1), 93; https://doi.org/10.3390/w16010093
Submission received: 15 October 2023 / Revised: 23 December 2023 / Accepted: 24 December 2023 / Published: 26 December 2023

Abstract

:
Urban water supply pipelines serve as vital lifelines for urban operations. However, the occurrence of underground pipeline leakage, caused by various factors, results in significant water loss and gives rise to safety hazards such as pavement collapse due to the erosive action of leaking water on the overlying soil. To conduct a more comprehensive investigation into the erosion characteristics of the leaking jet on the soil, this study employed a custom-built soil-test system to investigate the erosive effects of leakage from the water supply pipe network on the clay roadbed above. The study considered water flow rate, leakage port size, and leakage angle as influential factors. The experimental results demonstrated that reducing the water flow rate significantly enhances the soil’s erosion resistance. There is a positive correlation between the caliber of pipe leakage, pipe diameter, and the erosion rate of the soil cavity. Under identical conditions, the erosion rate of the specimen increased consistently with an increase in the leakage port angle. The study also investigated and summarized the curve depicting the formation of soil cavities. The aforementioned findings offer valuable insights for the implementation of reinforcement measures using fine-grained cohesive soil backfill in urban water supply pipelines.

1. Introduction

The urban water supply pipe network plays a crucial role in the daily lives of individuals. However, underground pipe leakage commonly occurs due to factors such as material aging and the load from ground traffic. Pipeline leakage can primarily disrupt soil stability by influencing groundwater. This disturbance has the potential to escalate into catastrophic events like ground collapse [1,2,3], posing significant risks to both human life and the economy [4].
Field investigations indicate a direct correlation between underground pipelines and the majority of ground collapse accidents [5]. The concealed nature of buried pipelines makes it challenging to directly observe soil erosion resulting from seepage following rupture and other events. This limitation hinders the timely implementation of protective measures against ground collapse disasters [6]. Therefore, it is crucial to conduct research on the phenomenon of soil erosion caused by pipeline leakage of water flow. Summarizing the underlying laws governing this erosion is an urgent and essential area of investigation.
Currently, numerous scholars have conducted extensive research on ground subsidence disasters, yielding remarkable outcomes. For instance, in the realm of numerical modeling, Ben-Mansour et al. [7] carried out process simulations with the help of computational fluid dynamics (CFD) for different pipe leakage sizes. Li et al. [8] incorporated the frequently overlooked non-Darcy flow into the numerical simulation conditions. They conducted an investigation and derived the law governing foundation collapse using a coupled approach combining computational fluid dynamics (CFD) and the discrete element method (DEM). Tang et al. [9] conducted a secondary development using discrete element methods to establish a coupled three-dimensional discrete element model. They successfully predicted the continuous erosion of soil processes caused by water flow. Qi et al. [10] employed Fluent and PFC methods for simulating and calculating the formation process of underground cavities. Their findings indicate that water supply pipe breakage has a significant impact on ground collapse. Zhou et al. [11] implemented bidirectional coupling of CFD and DEM, resulting in the identification of soil-flow loss patterns and typical soil particle-flow processes during hydraulic erosion. Rahnema et al. [12] examined the formation characteristics of soil cavities by employing finite element analysis and integrating actual field data. Long et al. [13] integrated the validated finite difference method (FVM) with DEM to quantify the impacts of seepage erosion on the surrounding soil. Xiong et al. [14] employed a coupled CFD-DEM method to investigate microscopic soil erosion changes, but did not validate the method through experimental validation.
Several scholars also explored these aspects using physical models. For instance, Mohamed et al. [15] conducted experiments using a sandbox model to examine the impact of water flow from a ruptured water supply pipe on soil settlement. They also developed empirical formulas based on the theory of magnitude analysis to predict the depth and width of settlement. Zhang et al. [16] examined the impact of pipe defect shapes on the soil erosion rate of the fill above. Their findings revealed that circular defects result in a lower soil erosion rate compared to waist-shaped defects. Additionally, Ali et al. [17] conducted a study focusing on the shape of pipeline defects. They artificially created an irregular defect to provide a more realistic simulation of pipeline leakage, aligning it closely with real-world conditions. Moreover, hydraulic loading is a significant factor that influences soil erosion. Consequently, certain scholars approached the issue from a hydraulic perspective. For instance, Mukunoki et al. [18,19] conducted tests on three types of erosion: monotonous water intake, monotonous water discharge, and cyclic infiltration. Their findings revealed that the cyclic infiltration condition resulted in the most severe consequences for the soil above. Therefore, Guo et al. [20,21] conducted a study on head-on soil erosion through modeling tests. They varied the head discharge flow rate and ultimately concluded that the rate of water erosion exhibits a monotonically increasing trend with the increase in head flow rate. Wang et al. [22] conducted eight sets of indoor modeling tests to investigate the seepage effect of pipelines across various factors, ultimately unveiling the mechanism of surface collapse. Indiketiya et al. [23] introduced a novel method for examining the ground settlement resulting from erosion. They utilized an efficient erosion testing device to investigate the mechanism of soil erosion and ultimately confirmed the feasibility of their approach. Sato et al. [24] conducted indoor modeling tests to investigate the formation of erosion cavities in the soil caused by faulty pipes. Additionally, pipeline defects can easily lead to the occurrence of fluidization, which has a significant impact on soil erosion. Consequently, there have been detailed investigations [25,26,27] on the influential parameters of fluidization.
Previous research has primarily focused on investigating underground pipelines or soil bodies. Concerning underground cavities, most studies have concentrated on soil particle loss caused by water scouring and used numerical simulation software to analyze the stress and strain effects on the soil surrounding pipeline leaks. However, there is limited research on the composite condition of pipe–water–soil and the extent to which various factors influence the formation of underground cavities. Therefore, it is crucial to investigate the erosion patterns of the surrounding soil resulting from pipeline leaks. This research will contribute to a deeper understanding of the formation of underground cavities and the influencing factors. Building on previous research, a self-developed test set and test scheme were developed. The test scheme is innovative and easily implementable. This study further investigates the principles of soil cavity expansion and the effects of soil scour damage. These findings serve as a valuable reference for the comprehensive investigation of pavement collapse mechanisms.

2. Content and Methods of Testing

2.1. Test Soil Samples

To closely align the test conditions with the actual site, the experiment employed soil extracted from a specific section of the highway roadbed in Chongqing as the testing material. A random selection of samples was used to conduct particle size distribution tests using the Winner3002 laser particle sizer (capable of covering particle sizes from the nanometer to the millimeter level), as shown in Figure 1. The analysis indicated that the soil specimen had a particle size of 2.965 μm at a 10% particle size distribution. Moreover, the median particle size was 5.003 μm at a 50% particle size distribution, and the particle size measured 6.927 μm at a 90% particle size distribution. The test samples in this section exhibit uneven particle distribution and discontinuous grading curves, which are detrimental to roadbed stability.
To this end, the indoor triaxial test and direct shear test were carried out, and the basic physical parameters of the sample were obtained, as shown in Table 1.

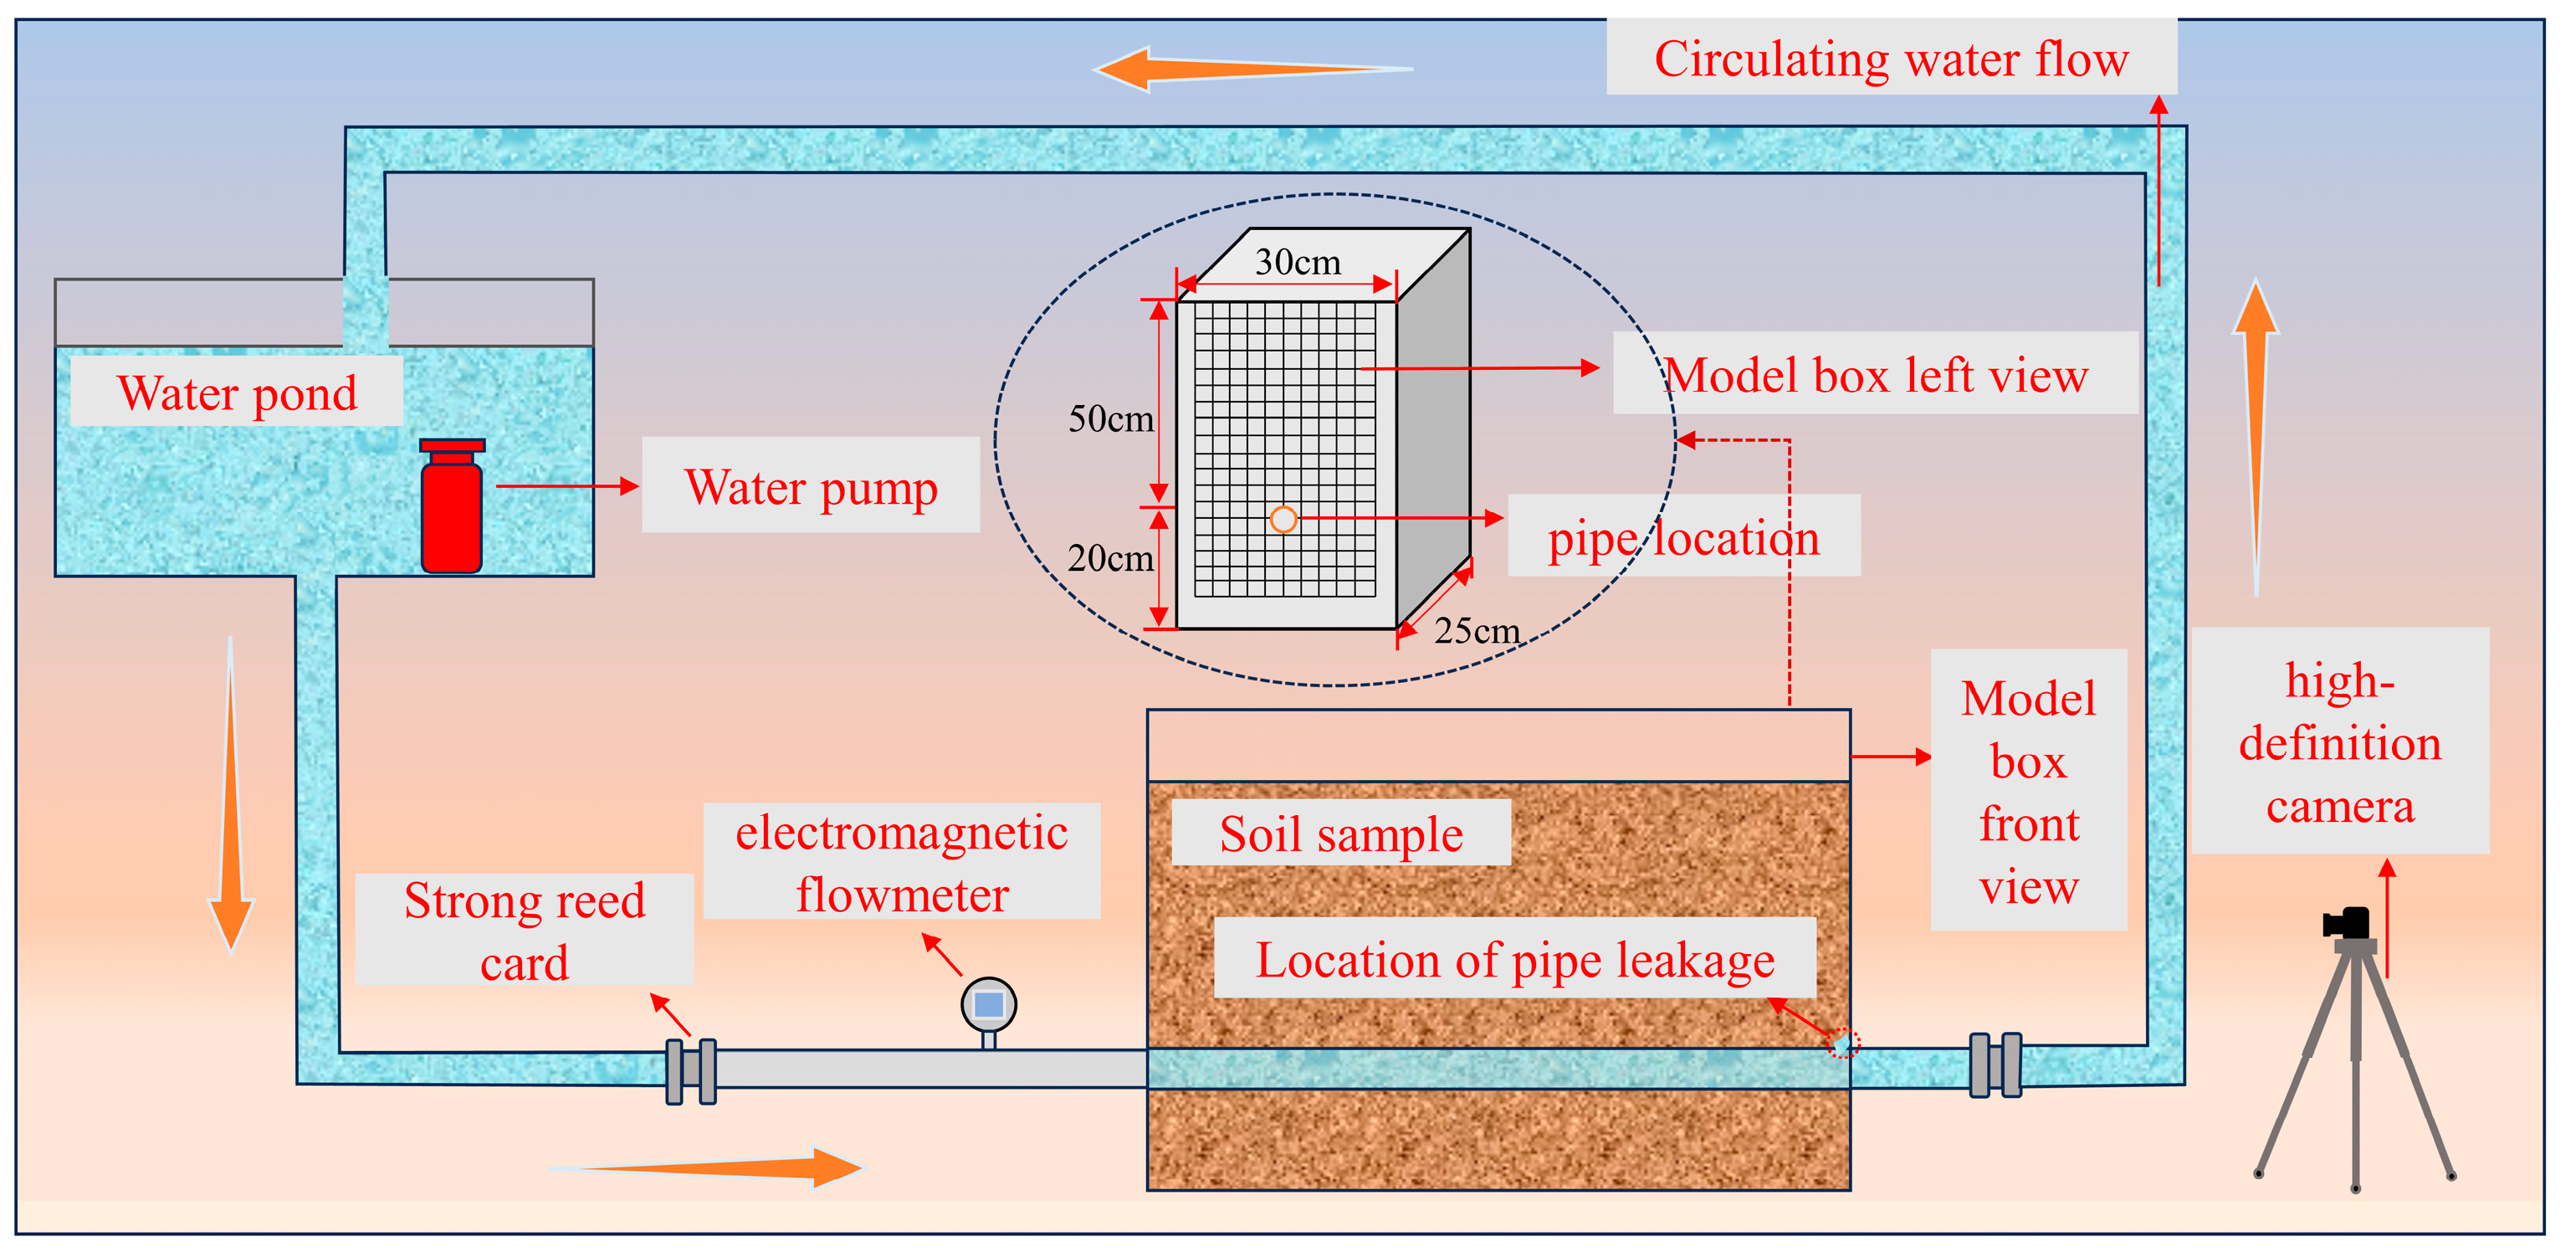
2.2. Testing Apparatus

The soil-testing system for investigating erosion damage caused by water supply network leakage, as illustrated in Figure 2, includes a transparent acrylic box (made of acrylic material with dimensions of 0.3 m × 0.25 m × 0.7 m), an electromagnetic flowmeter, a re-circulating water injection system, and a monitoring system. A transparent acrylic box is used to create the test area for the soil and water supply pipeline experiment. Moreover, a glass opener is used to create an opening in the test box. The water injection system consists of a water pump, a water tank, and a water supply pipe, which collectively facilitate the circulation of water within the test area. The visual recording equipment used is a high-definition camera provided by Sony, with a resolution of 1920 × 1080 pixels and a refresh rate of 50 frames per second.

2.3. Experimental Materials and Procedures

The preparation process of the test sample was as follows:
  • The soil samples were tiled and subsequently dried, after which they were crushed using a crusher (as shown in Figure 3a).
  • According to the geotechnical test method, the test sample particles were prepared with a water content of 15%. Subsequently, the samples were allowed to stand for 24 h (as shown in Figure 3b).
  • To prevent test delamination, the sample was compacted using a compaction hammer, and its surface subsequently polished once the compaction process was finished (as shown in Figure 3c).
  • Based on the principles of similarity theory, the pipeline was installed at ground level (20 cm) while the soil above it had a thickness of 10 cm (as shown in Figure 3d).

2.4. Test Scheme

In this experiment, a PVC (polyvinyl chloride) water pipe was utilized as the material for the leakage pipe to investigate the impact of water flow velocity, leakage port size, and angle on the rate of soil cavity development. The employed approach entailed conducting a matrix analysis of the similarity ratio scale. This analysis considered parameters such as density, permeability coefficient, geometry, flow rate, and others. Through this analysis, parameter factorization quantities were derived, and an exponential matrix table was utilized to determine the final five key similarity factors. To ascertain the primary factors influencing the development characteristics of soil voids, a single-factor test was conducted while maintaining the other three factors constant. The test involved progressively increasing the extent of damage associated with a specific factor. To investigate the impact of various testing values on the development characteristics of soil voids above the pipeline under identical background conditions, a test scheme was devised as outlined in Table 2. In this scheme, the meanings represented by the black bold font correspond to single-factor variables.

3. Analysis of Test Results

3.1. Pipeline Leakage Erosion Test Phenomenon

To investigate the impact of various testing values on the development characteristics of soil voids above the pipeline under identical background conditions, a test scheme was devised as outlined in Table 2. In this scheme, the black bold font corresponds to single-factor variables. To investigate the development characteristics of the soil filling above the pipeline during the process of water flow scouring, the soil development characteristics were recorded at key time nodes throughout the entire test. Figure 4 illustrates the progression of cavity development throughout the test. In this case, for enhanced visibility of soil erosion, the surface of the model box was measured and subdivided into a 2.5 cm × 2.5 cm square grid using white tape.
The results indicate that the development of soil voids above the pipeline occurs in three distinct stages as time progresses.
During the initial stage of pipeline leakage, seepage results in an elevation of water content in the soil surrounding the leakage point. As the water content in the surrounding soil increases, the potential energy of the matrix gradually rises, ultimately leading to the saturation of the soil around the leakage orifice. (as shown in Figure 4a).
  • Soil cavity development stage: as the erosion time progresses, the erosion cavity starts to form above the leakage point. Water flow infiltrates the soil particles in regions of weakness, leading to the formation of small cracks in localized areas. Initially, the cavity has a small volume and is filled with a mixture of water and soil. Meanwhile, the surrounding soil remains largely unchanged except for a slight increase in water content. The red curve represents the area of the cavity (as shown in Figure 4b–d).
  • Soil cavity expansion stage: the erosion rate of the soil cavity accelerates, leading to its expansion. Figure 4f–i depict a substantial removal of soil within the cavity due to extensive erosion. The formation of voids can be attributed to the displacement caused by water flow expelled from a leaky pipe, leading to the rearrangement of soil particles and subsequent void formation. The diagram reveals that, in the experimental group, the right side of the soil sustains more severe damage than the left side, particularly within the first 30 min. Similarly, other experimental groups also exhibited an imbalance in the volume development between the left and right cavities.

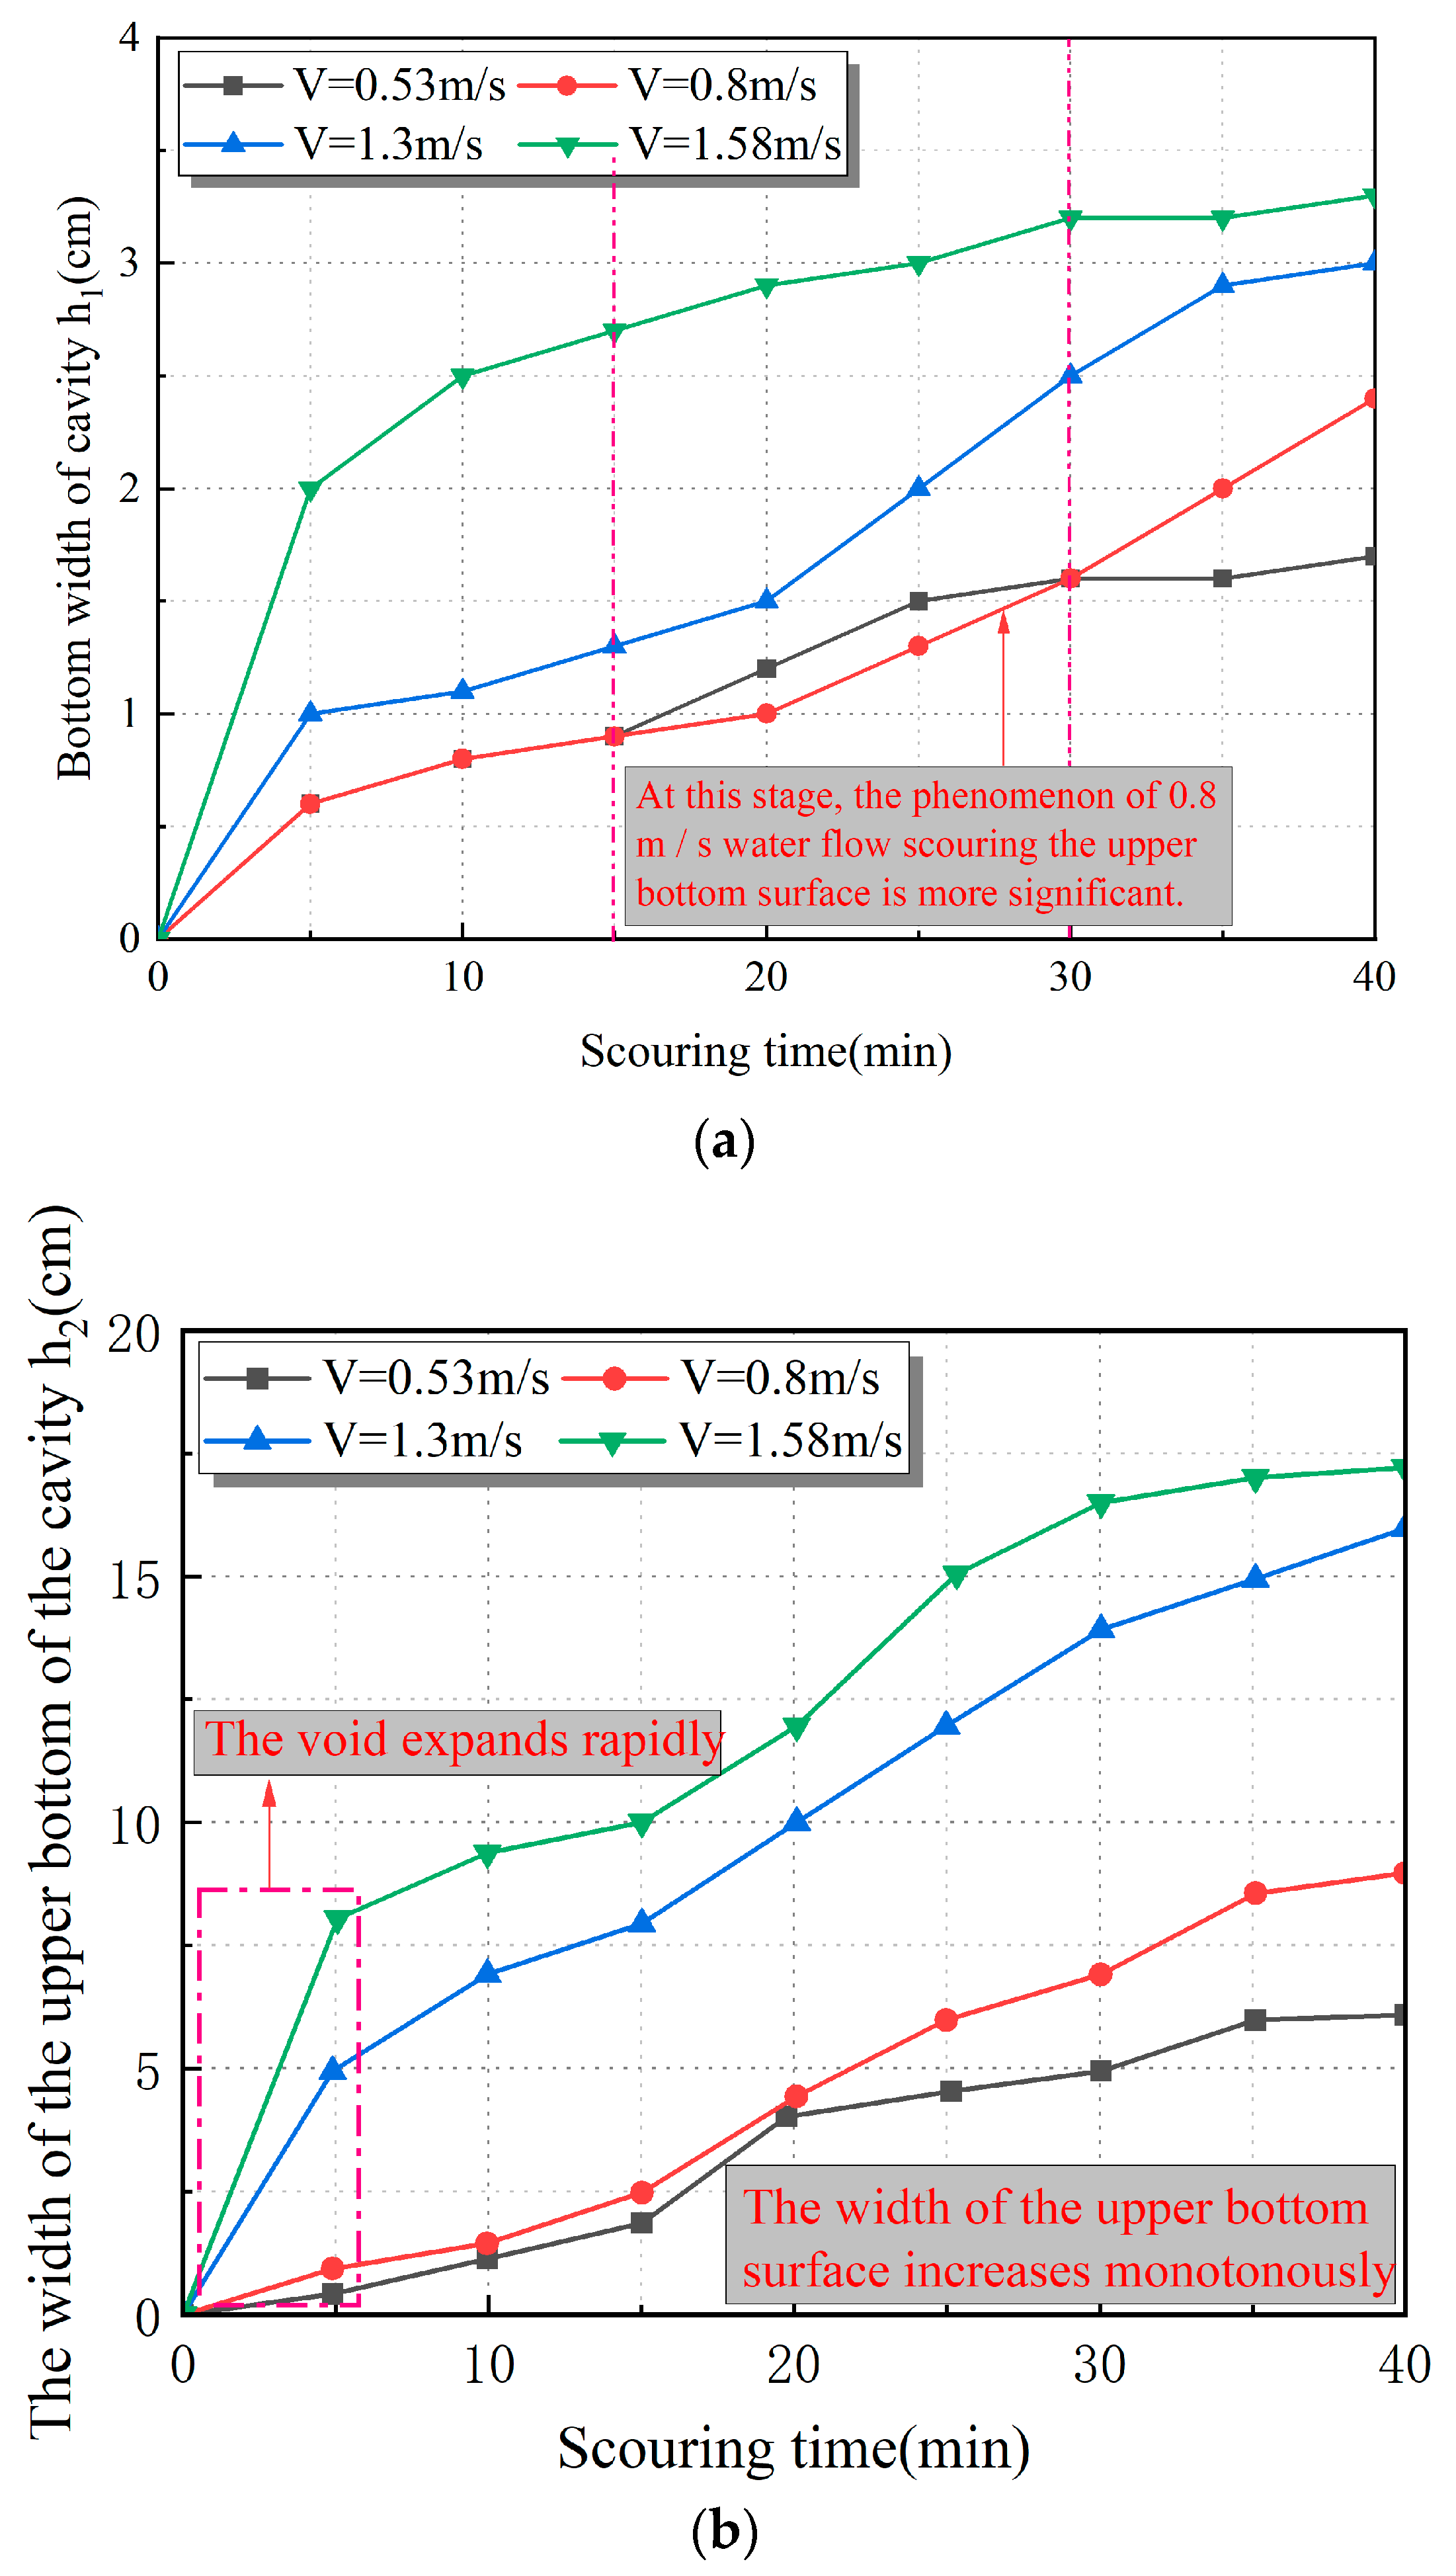
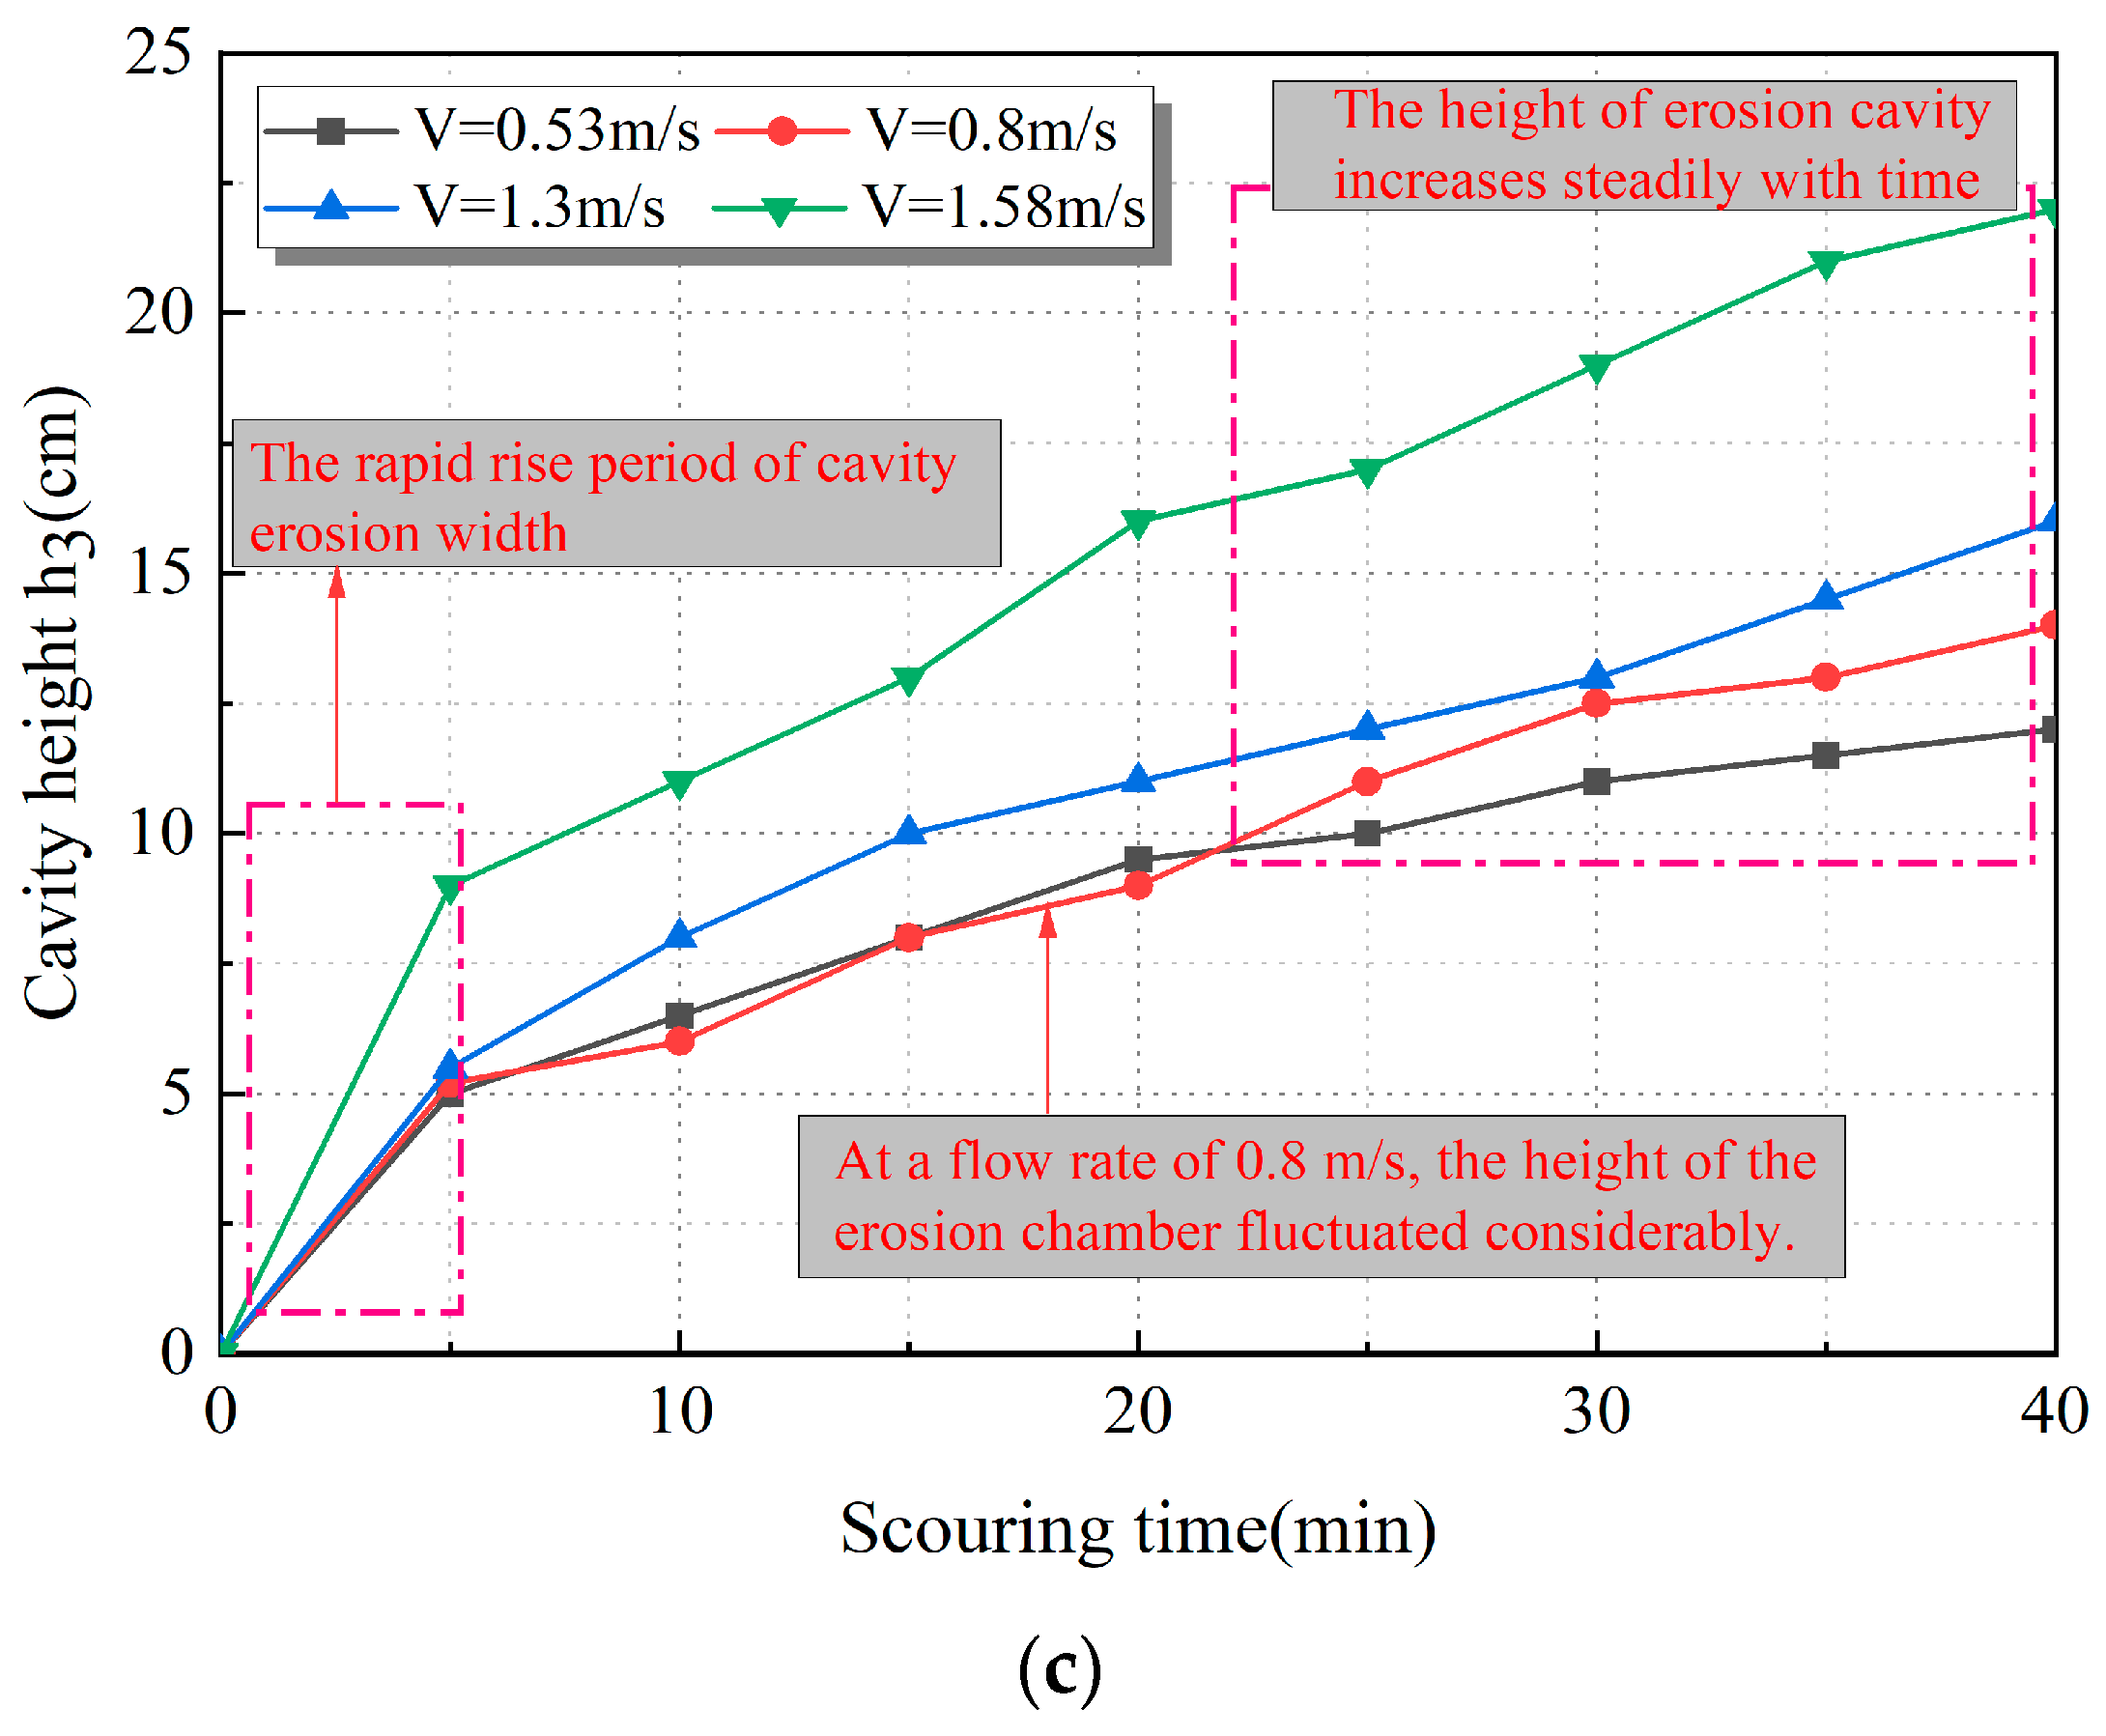
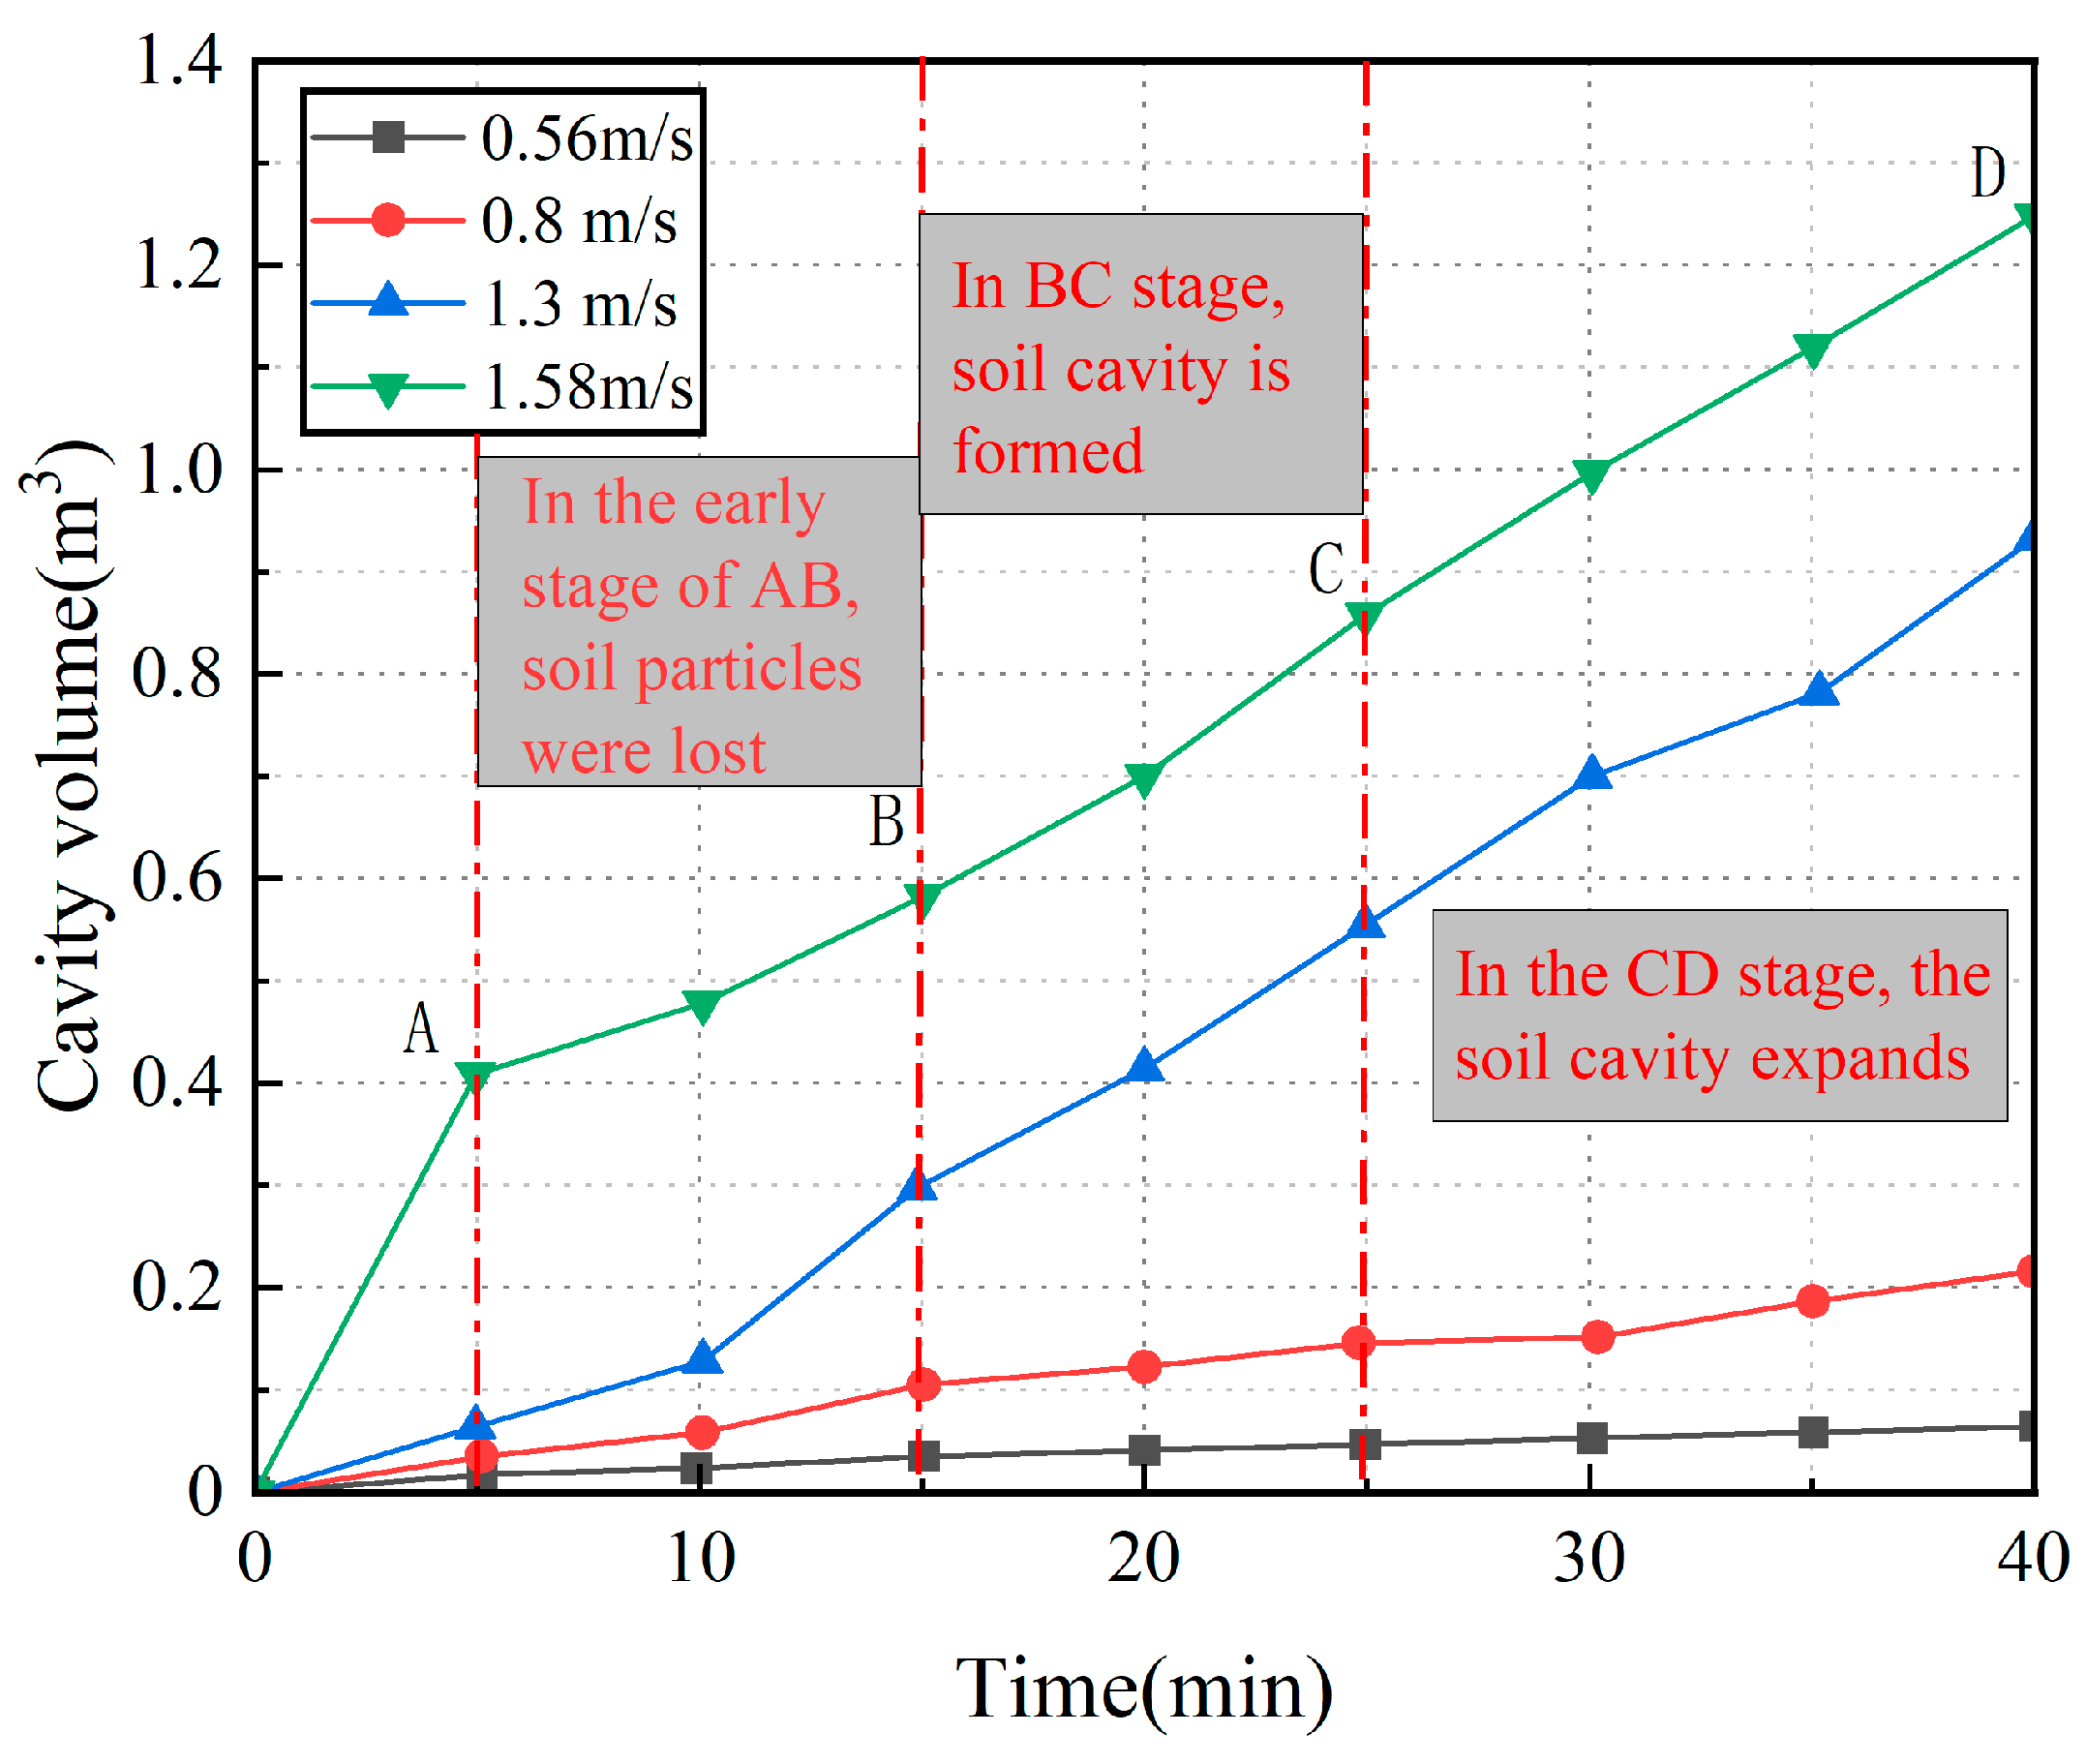
3.2. The Effect of Water Flow Velocity on Cavity Development

To analyze the impact of water flow velocity on the filling cavity above the pipeline, we recorded the relationship between cavity development and time throughout the entire test. Figure 5 illustrates the cavity development curve for different flow velocities (V = 0.53 m/s, 0.8 m/s, 1.3 m/s, 1.58 m/s). Figure 5a focuses on recording the diameter change in the bottom surface of the cavity; Figure 5b tracks the width of the upper surface of the cavity; and Figure 5c shows the process of the height change in the cavity in detail.
In the pipe leakage scouring test under varying water flow rate conditions, the erosion height was measured at the highest point of the cavity. The test was conducted for a fixed duration, and the average erosion rate was calculated based on the erosion rate at each time point. Similarly, the erosion rate for the width and volume of the cavity was determined using the same methodology as described above. The volume was calculated by removing the soil above the cavity. Due to the irregular shape of the cavity, calculus was employed to determine the volume of several cubic blocks. These volumes were then summed, and the average volumetric erosion rate was calculated based on the duration of the test.
The findings from the scour caused by pipe leakage indicated that the volume of the soil cavity increased with higher water velocity. This can be attributed to the rise in the starting pressure of the soil particles caused by water erosion. Within the cavity, the water flow diffuses, leading to a decrease in soil cohesion. Over time, the development rate of the upper and lower surfaces of the cavity gradually diminishes, although the height of the cavity continues to increase steadily at a constant rate. In summary, considering the single factor of water flow, the growth rate of the upper bottom width (h2) of the soil cavity surpasses that of the lower bottom width (h1), while the growth rate of width (h3) exceeds both of them.
The scouring process demonstrated that the resulting shape of the soil sample’s cavity remained relatively consistent. The cavity took on a balloon-like shape and could be divided into two distinct parts: a crown and an inverted round table. However, there were variations in the length and width of the scoured cavities. In the pipeline leakage erosion test conducted under different flow velocity conditions, the erosion height was determined by measuring the highest point of the cavity. The test was conducted for a fixed duration, and subsequently, the average erosion rate was calculated by considering the erosion rates recorded at each time interval (as presented in Table 3).
The results demonstrate a positive correlation between the erosion rate and the water flow velocity in the pipeline leakage erosion test conducted under varying water flow velocities. At a flow rate of 1.53 m/s, the height of the cavity and the erosion rate of the upper and lower bottom surfaces were the fastest. As the speed of water leakage increased, the change in the height of the cavity was significantly greater compared to the upper and lower bottom surfaces. From a vertical perspective, the soil erosion beneath the pipeline was minimal, indicating a safe condition. Conversely, the soil above the pipeline was heavily impacted, resulting in a significant reduction in stability. This observation aligns with the real-world scenario where soil collapse damage occurs.

3.3. The Effect of Leakage Orifice Size on Cavity Development

During the pipeline leakage erosion test, conducted with various leakage orifice sizes, data on the cavity formation process, cavity size, and water flow rate of the samples were recorded. Subsequently, the erosion speed and cavity development speed data were calculated (as shown in Figure 6). The pipeline leakage erosion test was performed on four test beds, each with a leakage orifice size of 2 mm, 4 mm, 6 mm and 8 mm. Data regarding the size of cavity development were obtained. Finally, the cavity development was analyzed and quantified based on the different leakage orifice sizes.
The results show that the erosion rate of pipeline leakage is positively correlated with the size of the leakage port. When the size of leakage port was 2 mm, the erosion rates (E1, E2, E3) of the lower bottom surface, upper bottom surface and height were 0.0125 mm/s, 0.0500 mm/s and 0.0684 mm/s, respectively, and the average volume erosion rate (E4) was 0.1258 mm/s. When the size of the leakage hole was 4 mm, the erosion rates of the lower bottom surface, the upper bottom surface and the height were 0.0129 mm/s, 0.0583 mm/s and 0.0829 mm/s, respectively, and the average rate of volume erosion was 0.1715 mm/s; when the size of the leakage port was 6 mm, the erosion rates of the lower bottom surface, the upper bottom surface and the height were 0.0133 mm/s, 0.0667 mm/s and 0.0936 mm/s, respectively, and the average volume erosion rate was 0.2278 mm/s. When the size of the leakage hole was 8 mm, the erosion rate of the lower bottom surface, the upper bottom surface and the height was 0.0158 mm/s, 0.0917 mm/s and 0.1593 mm/s, respectively, and the average rate of volume erosion was 0.5834 mm/s.
The reasons for analyzing the above conclusions are as follows: as the diameter of the leakage orifice increases, the volumetric flow rate through the orifice also progressively increases. The size of the leakage orifice has a profound impact on the ratio of soil and water flow rates. The test results additionally indicate that the fluidization of soil particles is contingent upon the conditions within the cavity, specifically the fluidization area, located above the leakage orifice. The size of this area is determined by the dimensions of the leakage orifice. This implies that as the size of the leakage orifice increases, the corresponding fluidization area also enlarges, thereby increasing the likelihood of soil particle flow.

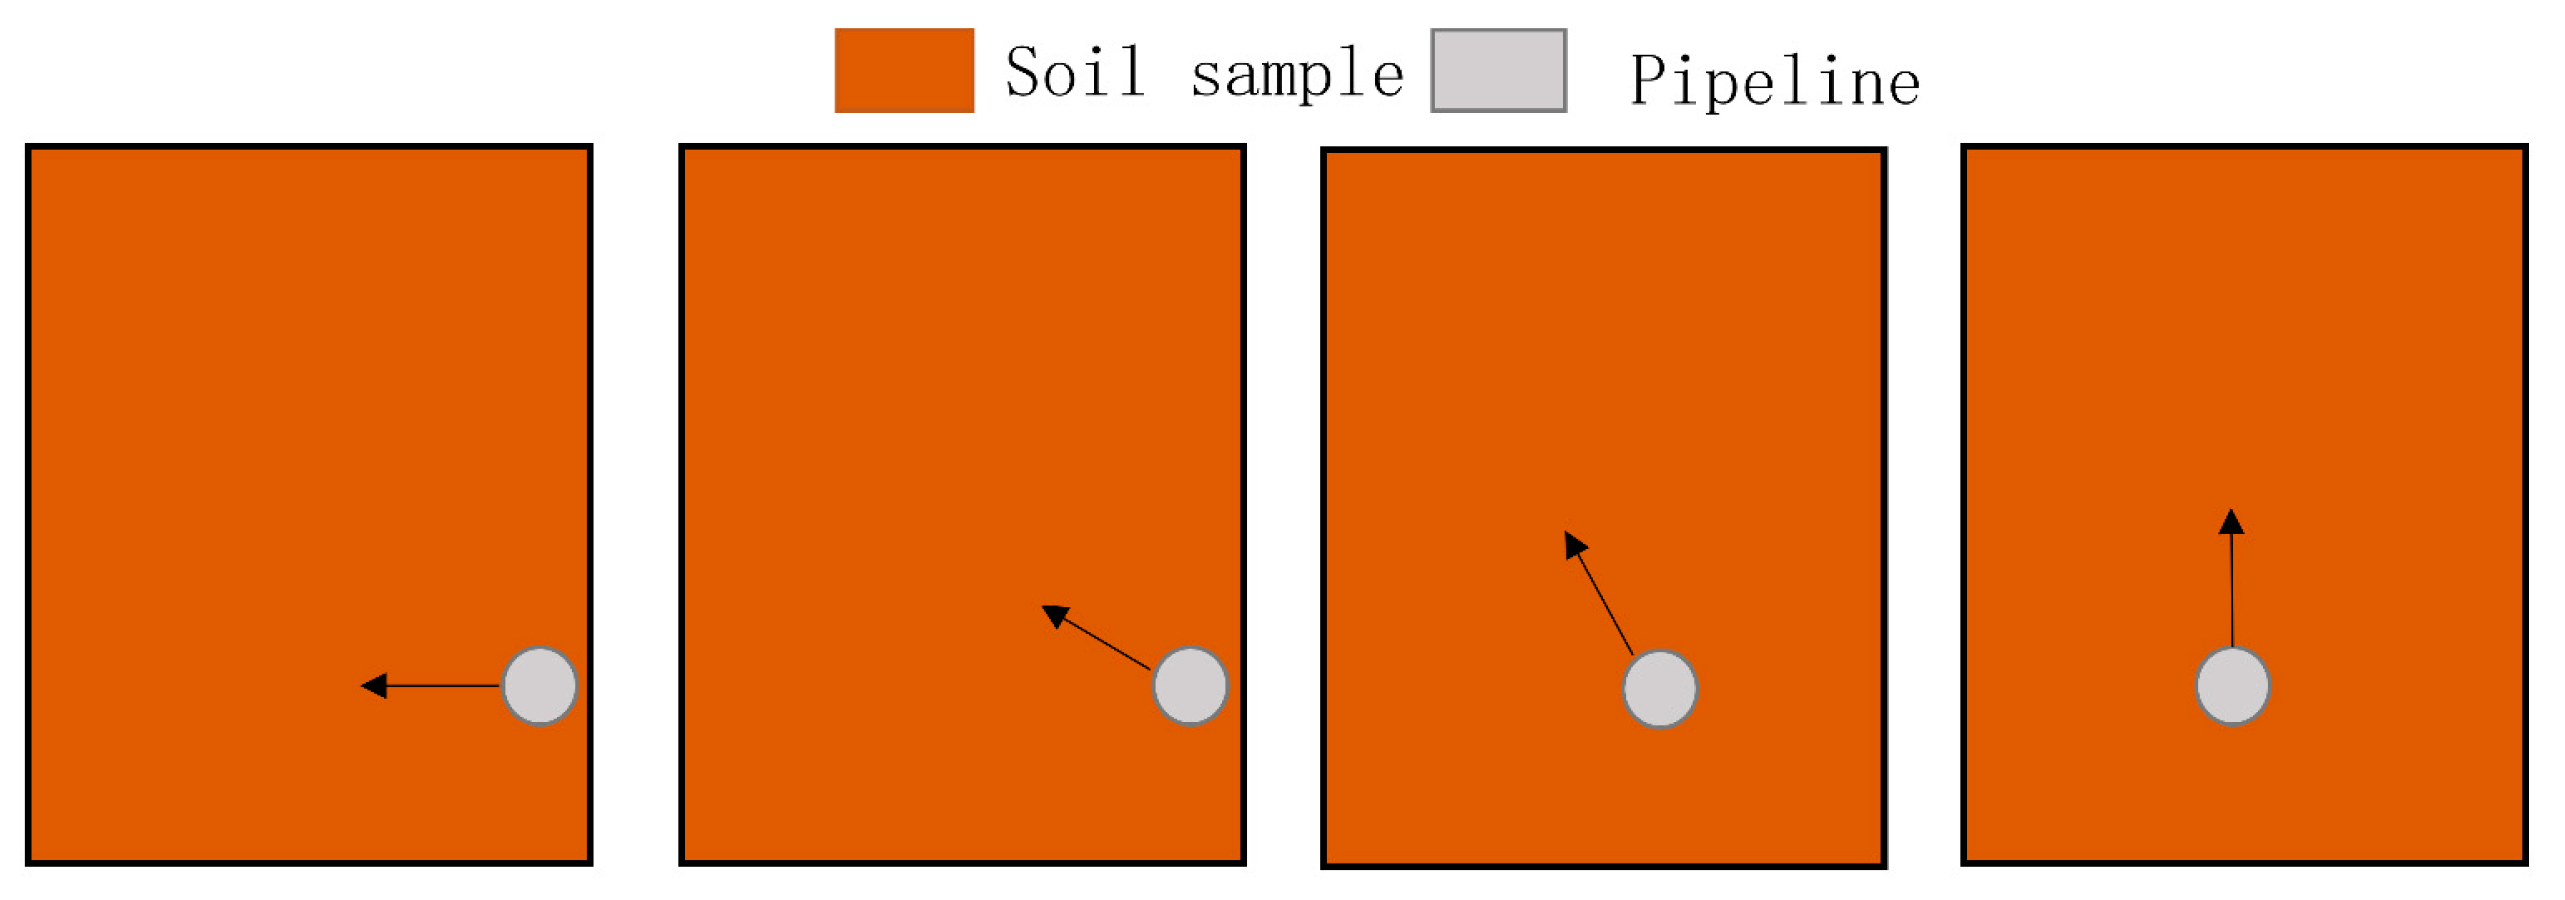
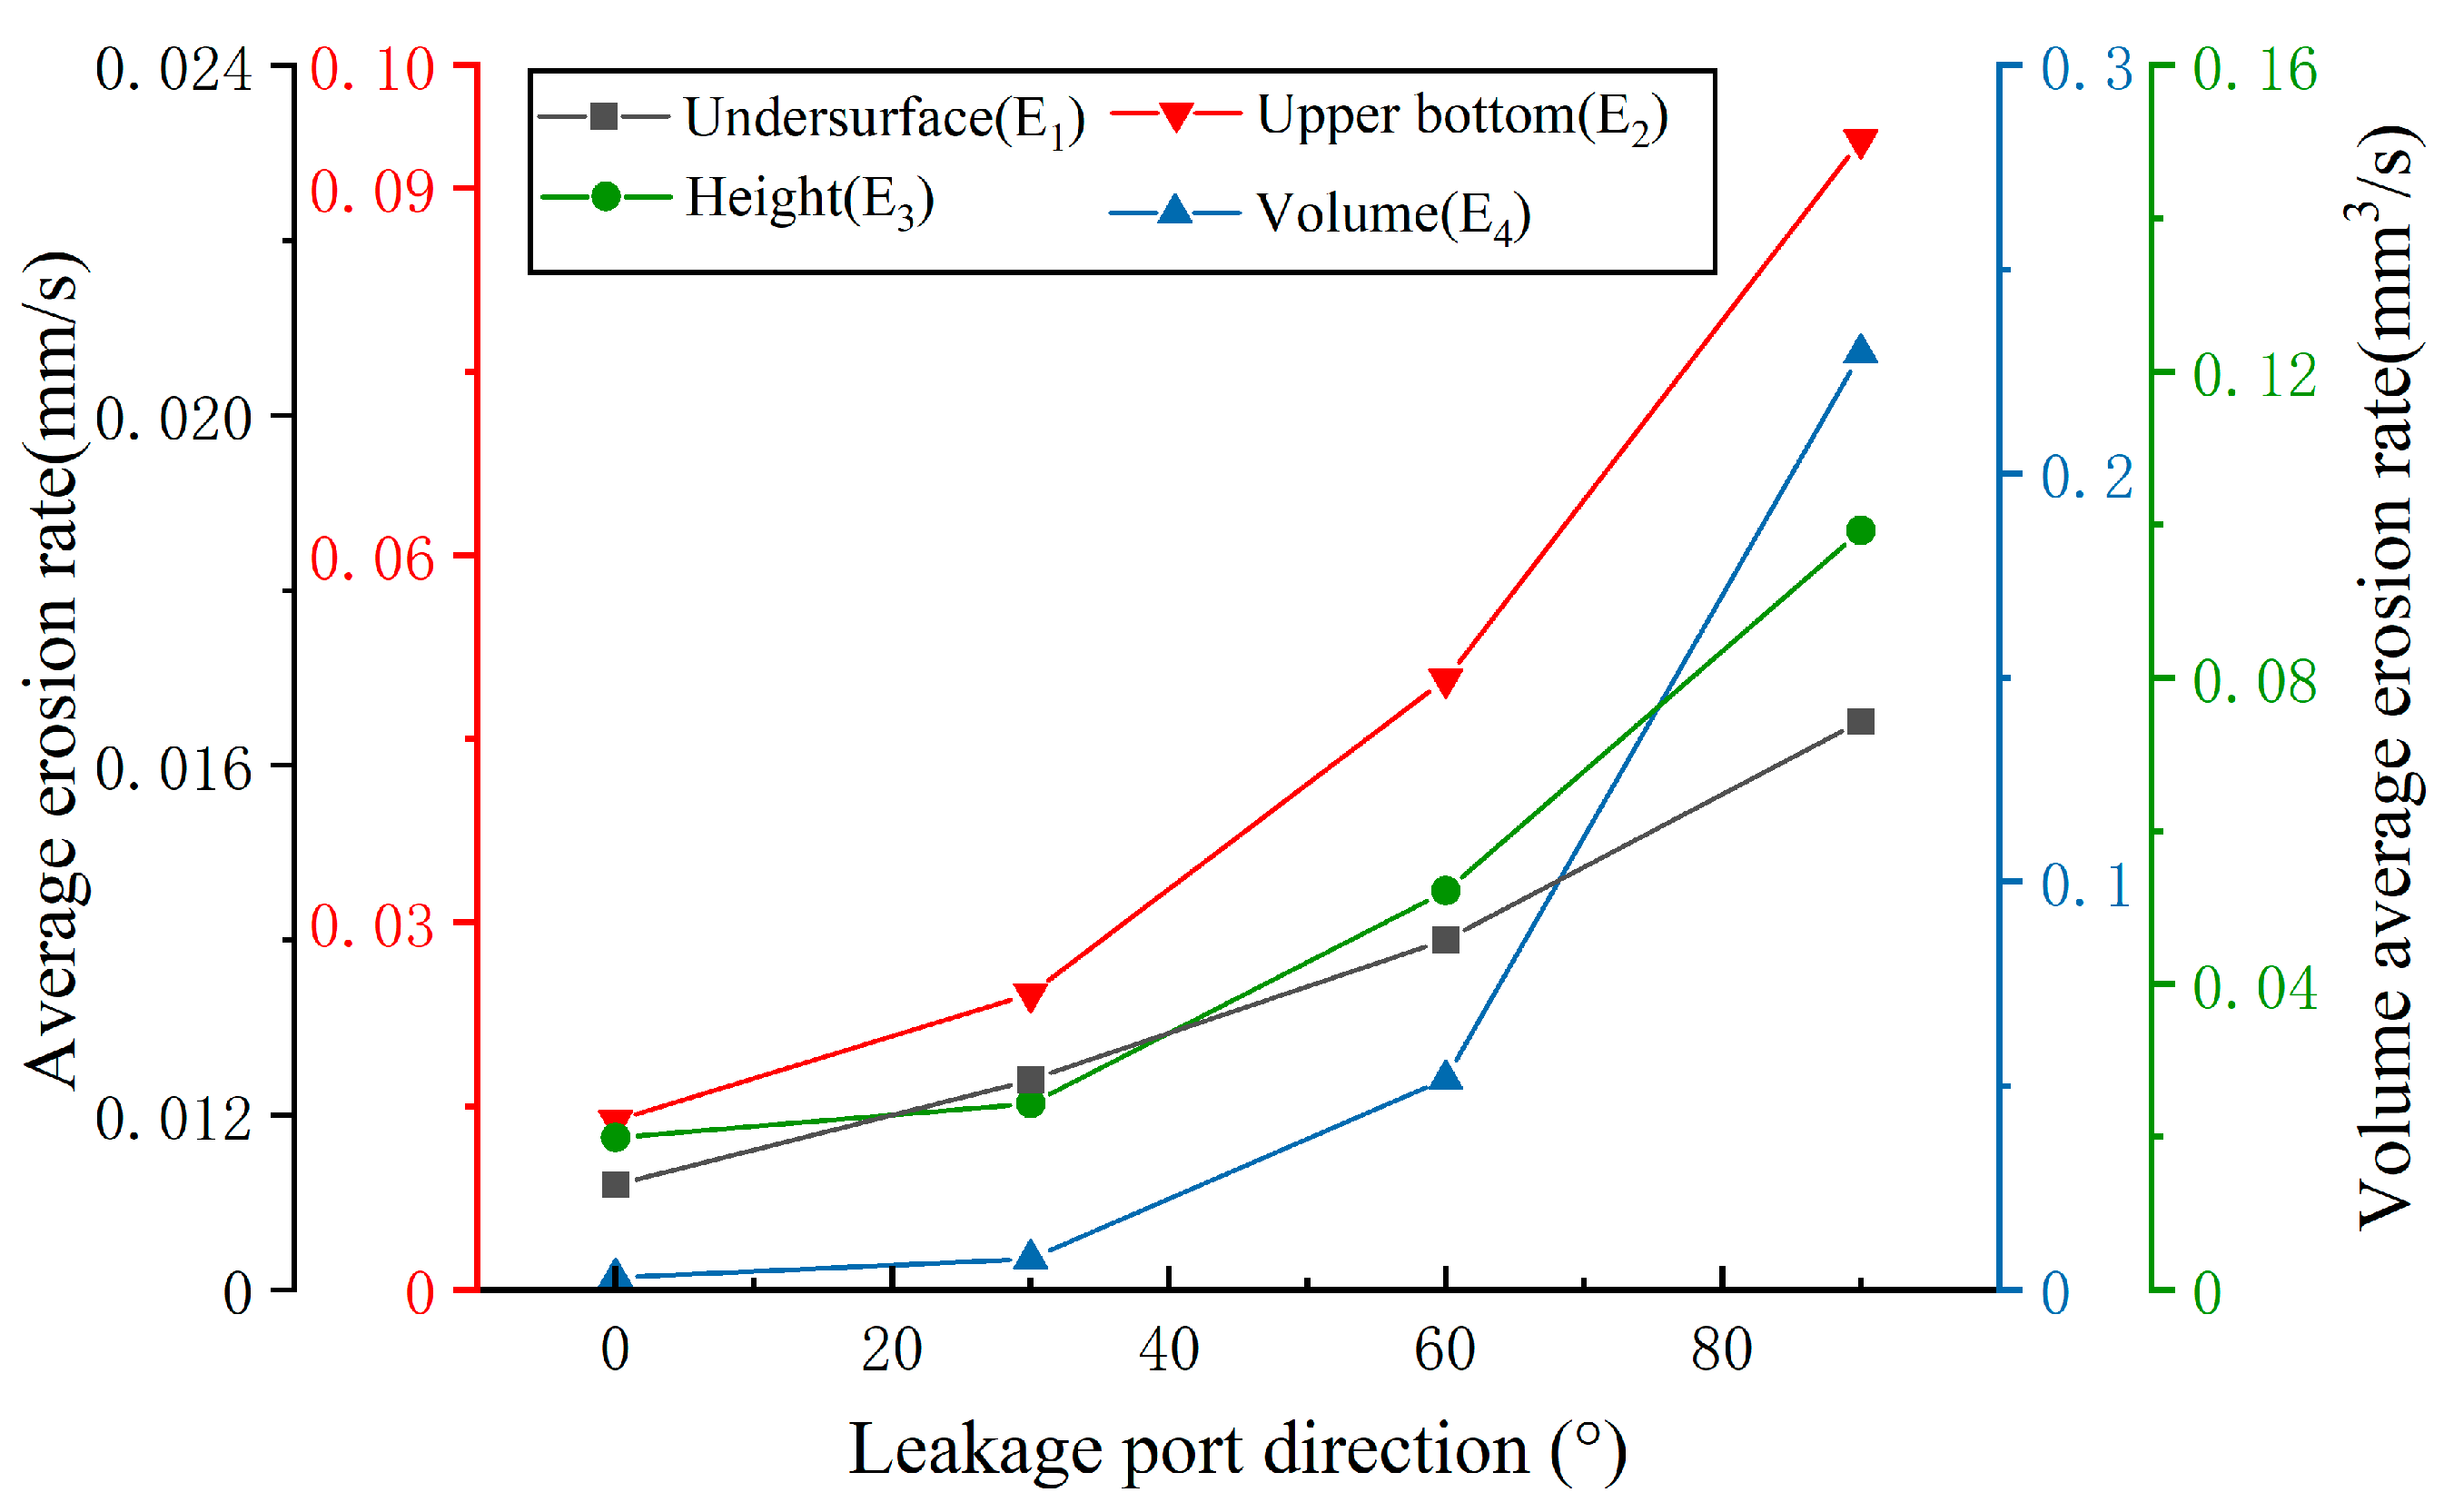
3.4. The Effect of Leakage Angle on Cavity Development

In this experiment, as illustrated in Figure 7, all other factors were held constant, and only the jet angle was varied, thus changing the direction of the scouring force applied to the soil particles.
Figure 8 illustrates the soil erosion curve based on the findings of the pipeline leakage erosion test conducted at various leakage port angles (0°, 30°, 60°, 90°), along with data pertaining to the cavity formation process, cavity size, and water flow rate.
The results indicate that the erosion caused by water flow differed across the surfaces of the soil cavity, with the highest erosion rate observed in the vertical direction (height) of the cavity, followed by the horizontal direction (width). With the increase in leakage angle, the ratio of erosion rate E3 to erosion rate E2 also increased. When the angle of the leakage port was 0°, E3:E2 was about 1.2; when the leakage angle was 30°, the E3:E2 was about 1.4. When the leakage angle was 60°, the E3:E2 was about 3.25. When the angle of the leakage port was 90°, E3:E2 was about 5.33. It is evident that the erosion rate of the cavity height (h3) was greater than that of the width of the cavity upper bottom (h2). Additionally, the erosion rate increased as the leakage port angle increased. Moreover, the height of the formed cavity progressively increased.
The primary cause of the aforementioned phenomenon is the variation in the turbulence direction formed by water flow within the cavity. This change in direction occurs due to different soil pressure and pipeline pressure conditions, leading to the diffusion of water flow into the surrounding area. As a result, the seepage direction and the transportation path of soil particles are also altered. When the leakage hole angle is 0°, the cavity experiences the combined influence of gravity and the pressure exerted by the soil layer above it. As soil particles are transported within the horizontal plane through particle pore channels, the rate of particle transport is hindered by gravity and pressure. Consequently, some particles settle at the bottom, resulting in a relatively small cavity volume.

4. Numerical Simulation Study

4.1. Test Properties of Samples

The cohesive soil was selected as the numerical simulation material. In this experiment, the particle size analysis curve obtained by the physical test was set at 6.42 μm, and the average bulk density was 1.75 g/cm3. The remaining parameters were assigned default values based on the cohesive soil parameters listed in Table 4, below. Based on the principles of similarity theory, the soil model was constructed using modeling software. The field model had dimensions of 9 m in length, 7.5 m in width, and 21 m in height. The pipeline, positioned 3 m above the ground, had a diameter of 4.5 m. To ensure a comprehensive full-scale test, the leakage port of the pipeline was centrally located within the soil, allowing for sufficient soil coverage around it. The sediment scour model in FLOW-3D was selected for calculation, the viscosity and turbulence module was opened, and the RNG k-ε turbulence model was selected as the erosion model. To enhance the accuracy of the conclusion, the grid size was set to 0.005 × 0.005 × 0.005 m, and the total number of grids was 8.45 million.

4.2. Conclusions and Analysis

As shown in Figure 9, the post-processing software FlowSight (v11.2) was employed to visualize the calculation results. During the initial stage of the experiment, the soil was subjected to erosion by the water jet, causing the displacement of the surrounding soil through small gaps near the leakage opening. This process initiated the formation of a balloon-shaped cavity, resulting in an uneven topography due to the scouring action of the water flow. This was in better contrast to the physics of the model test 0–10 min (as shown in Figure 9a). As the water flow persisted, a jet was generated around the leakage hole. This jet differed from the accumulated water flow within the cavity, thereby inducing the movement of stagnant water. The interaction between these two water layers, characterized by different velocities, led to the formation of a vortex. Consequently, soil particles adhering to the cavity wall were dislodged and permeated the surrounding soil through pores, resulting in an increase in water content. Simultaneously, the matrix potential energy also increased, ultimately causing soil block collapse and cavity expansion. This phenomenon contrasts with the physics observed during the model test conducted between 15 and 25 min (as shown in Figure 9b). When the cavity reached a certain size, the water flow completely filled the entire cavity, resulting in increased turbulence that carried away a growing quantity of soil particles. As a result, the excavated cavity gradually expanded in size. This phenomenon contrasts with the physics observed during the model test conducted between 30 and 40 min (as shown in Figure 9c).
As shown in Figure 10, the numerical simulation of the void formation process at water flow velocities of 0.56 m/s, 0.8 m/s, 1.3 m/s, and 1.58 m/s can be categorized into three stages. In the initial stage (Section AB), the water flow initiates soil scouring, primarily affecting the soil particles near the leakage orifice. However, due to the limited duration, a complete hollow balloon shape has not yet formed, and its size remains small. Consequently, the jet directly scours the surrounding soil, resulting in an increase in water content and subsequent soil softening, leading to a relative decrease in strength. During the rapid development stage (Section BC), the increase in water content in the surrounding soil leads to a decrease in the safety factor. Simultaneously, the cavity gradually takes shape, and water accumulates within it. Additionally, the erosion of soil from the cavity wall accelerates due to the reduced strength resulting from the previous stage (AB). Furthermore, the seepage process of water flow into the surrounding soil particles persists.
In order to bolster the validation of the physical model’s reliability, a comparison was made between the numerical simulation results and the results obtained from the reduced physical model test, utilizing the similarity ratio. The findings presented in Table 5 exhibit a substantial correlation between the soil cavity volume derived from the numerical simulation and the physical model test. Furthermore, it is observed that the error rate remains below 15%.

5. Conclusions

This study examines the mechanism and dynamic characteristics of scour failure resulting from underground pipeline leakage on the surrounding soil. It is based on the research background of scouring cohesive soil subgrade caused by underground water supply pipeline leakage. The research approach combines physical testing and numerical simulation, employing a self-developed test system. The study yielded the following conclusions:
  • The erosion rate exhibits a positive correlation with the water flow rate, with the largest underground cavity volume observed during the erosion test conducted at a flow rate of 1.58 m/s. Similarly, the erosion rate shows a positive correlation with the size of the leakage port, with the largest underground cavity volume observed when the leakage port size was 8 mm. In the range of 0 to 90° leakage angles, the erosion rate demonstrated a positive correlation with the leakage angle. Notably, the largest volume of the underground cavity occurred when the leakage angle was 90°.
  • After the pipeline is broken and leaks, the cohesive force of the soil sample near the leakage port gradually decreases due to the water flow. This decrease in cohesive force leads to an increase in the starting velocity of soil particles, the starting shear stress, and the discrete velocity of soil particles. Additionally, the soil loss rate gradually increases as the water flow within the cavity increases.
  • The numerical model of the underground cavity formed by leakage erosion was analyzed, and the development process of the cavity was summarized into three stages. The physical model test T-2 group and numerical simulation were employed to mutually verify each other. The results affirmed the reliability of the numerical simulation findings.

Author Contributions

Conceptualization, Y.W. and H.Z.; methodology, X.J.; validation, Y.W.; supervision, J.M.; writing—original draft preparation, X.J. and J.M. writing—review and editing, J.M. All authors have read and agreed to the published version of the manuscript.

Funding

This research was funded by the National Natural Science Foundation of China (No. 51974051; No. 51804051), Major Project of Science and Technology Research Program of Chongqing Education Commission of China. (KJZD-K202301506) and China Occupational Safety and Health Association (CXCY-2021-19).

Data Availability Statement

All data, models, or code that support the findings of this study are available from the corresponding author upon reasonable request.

Conflicts of Interest

The authors declare no conflicts of interest. The funders had no role in the design of the study; in the collection, analyses, or interpretation of data; in the writing of the manuscript; or in the decision to publish the results.

References

  1. Wang, X.W.; Xu, Y.S. Investigation on the phenomena and influence factors of urban ground collapse in China. Nat. Hazards 2022, 113, 1–33. [Google Scholar] [CrossRef]
  2. Wang, K.; Zhang, J.W.; Gao, G.Q.; Qiu, J.L.; Zhong, Y.J.; Guo, C.X.; Zhao, W.C.; Tang, K.J.; Su, X.L. Causes, risk analysis, and countermeasures of urban road collapse in China from 2019 to 2020. J. Perform. Constr. Facil. 2022, 36, 04022054. [Google Scholar] [CrossRef]
  3. Zhang, C.L.; Oh, J.; Park, K. Evaluation of sewer network resilience index under the perspective of ground collapse prevention. Water Sci. Technol. 2022, 85, 188–205. [Google Scholar] [CrossRef] [PubMed]
  4. Dong, X. Analysis of Environmental Factors Impact on Urban Underground Pipelines. Adv. Mater. Res. 2014, 1065–1069, 2570–2576. [Google Scholar] [CrossRef]
  5. Guo, S.; Jiang, Y.H.; Tang, Y.; Cheng, H.K.; Lv, Y.Z.; Li, M. Experimental study on the soil erosion through a defective pipe under the cyclic infiltration-exfiltration flow. Transp. Geotech. 2023, 42, 101085. [Google Scholar] [CrossRef]
  6. Tan, F.; Tan, W.F.Y.; Yan, F.F.; Qi, X.; Li, Q.H.; Hong, Z.K. Model Test Analysis of Subsurface Cavity and Ground Collapse Due to Broken Pipe Leakage. Appl. Sci. 2022, 12, 13017. [Google Scholar] [CrossRef]
  7. Ben-Mansour, R.; Habib, M.A.; Khalifa, A.; Youcef-Toumi, K.; Chatzigeorgiou, D. Computational fluid dynamic simulation of small leaks in water pipelines for direct leak pressure transduction. Comput. Fluids 2012, 57, 110–123. [Google Scholar] [CrossRef]
  8. Li, X.J.; Chen, R.; Liu, L.L.; Zhou, C.; Bate, B. A non-Darcy flow CFD–DEM method for simulating ground collapse induced by leakage through underground pipeline defect. Comput. Geotech. 2023, 162, 105695. [Google Scholar] [CrossRef]
  9. Tang, Y.; Chan, D.H.; Zhu, D.Z. A coupled discrete element model for the simulation of soil and water flow through an orifice. Int. J. Numer. Anal. Meth. Geomech. 2017, 41, 1477–1493. [Google Scholar] [CrossRef]
  10. Qi, G.; Wang, Z.Y.; Chen, Y.; Zhu, C.; Ren, D.Z.; Tian, T.; Yang, F. Analysis of instability mechanism and induced cause of urban pavement in Xining City, China. Adv. Mater. Sci. Eng. 2022, 2022, 3365402. [Google Scholar] [CrossRef]
  11. Zhou, H.T.; Liu, C.H.; Wang, G.H.; Kang, K.; Liu, Y.H. Study on drilling ground collapse induced by groundwater flow and prevention based on a coupled CFD-DEM method. KSCE J. Civ. Eng. 2022, 26, 2112–2125. [Google Scholar] [CrossRef]
  12. Rahnema, H.; Mirassi, S.; Dal Moro, G. Cavity effect on Rayleigh wave dispersion and P-wave refraction. Earthq. Eng. Eng. Vib. 2021, 20, 79–88. [Google Scholar] [CrossRef]
  13. Long, Y.Y.; Tan, Y. Soil arching due to leaking of tunnel buried in water-rich sand. Tunn. Undergr. Space Technol. 2020, 95, 103158. [Google Scholar] [CrossRef]
  14. Xiong, H.; Wu, H.; Bao, X.H.; Fei, J.B. Investigating effect of particle shape on suffusion by CFD-DEM modeling. Constr. Build. Mater. 2021, 289, 123043. [Google Scholar] [CrossRef]
  15. Mohamed, H.I.; Rabey, S.H.; Darweesh, M.S. Laboratory investigation of ground surface settlement caused by erosion around a leaking pipe. J. Pipeline Syst. Eng. Pract. 2022, 13, 04021080. [Google Scholar] [CrossRef]
  16. Zhang, D.M.; Du, W.W.; Peng, M.Z.; Feng, S.J.; Li, Z.L. Experimental and numerical study of internal erosion around submerged defective pipe. Tunn. Undergr. Space Technol. 2020, 97, 103256. [Google Scholar] [CrossRef]
  17. Ali, H.; Choi, J. Risk prediction of sinkhole occurrence for different subsurface soil profiles due to leakage from underground sewer and water pipelines. Sustainability 2019, 12, 310. [Google Scholar] [CrossRef]
  18. Mukunoki, T.; Kumano, N.; Otani, J.; Kuwano, R. Visualization of three dimensional failure in sand due to water inflow and soil drainage from defective underground pipe using X-ray CT. Soils Found. 2009, 49, 959–968. [Google Scholar] [CrossRef]
  19. Mukunoki, T.; Kumano, N.; Otani, J. Image analysis of soil failure on defective underground pipe due to cyclic water supply and drainage using X-ray CT. Front. Struct. Civ. Eng. 2012, 6, 85–100. [Google Scholar] [CrossRef]
  20. Guo, S.; Shao, Y.; Zhang, T.Q.; Zhu, D.Z.; Zhang, Y.P. Physical modeling on sand erosion around defective sewer pipes under the influence of groundwater. J. Hydraul. Eng. 2013, 139, 1247–1257. [Google Scholar] [CrossRef]
  21. Guo, S.; Zhu, D.Z. Soil and groundwater erosion rates into a sewer pipe crack. J. Hydrol. Eng. 2017, 143, 06017008. [Google Scholar] [CrossRef]
  22. Wang, Y.X.; Shi, G.; Tian, X.W.; Li, C.Y.; Cheng, H.Y. Experimental study on city road collapse under vibrating load. Shock Vib. 2020, 2020, 6074658. [Google Scholar] [CrossRef]
  23. Indiketiya, S.; Jegatheesan, P.; Rajeev, P. Evaluation of defective sewer pipe-induced internal erosion and associated ground deformation using laboratory model test. Can. Geotech. J. 2017, 54, 1184–1195. [Google Scholar] [CrossRef]
  24. Sato, M.; Kuwano, R. Influence of location of subsurface structures on development of underground cavities induced by internal erosion. Soils Found. 2015, 55, 829–840. [Google Scholar] [CrossRef]
  25. He, Y.X.; Zhu, D.Z.; Zhang, T.Q.; Shao, Y.; Yu, T.C. Experimental observations on the initiation of sand-bed erosion by an upward water jet. J. Hydraul. Eng. 2017, 143, 06017007. [Google Scholar] [CrossRef]
  26. Helal, E. Experimental evaluation of changes in channel bed morphology due to a defective pressure flow pipe. J. Irrig. Drain. Eng. 2019, 145, 04019022. [Google Scholar] [CrossRef]
  27. Zhao, A.H.; Ma, Y.K.; Liu, J.; Li, Y.B.; Zhong, Q.; Yuan, H.Y.; Fu, M. Morphological Characteristics of Overlying Soil Eroded by Leakage Gas from Buried Pipelines. J. Pipeline Syst. Eng. Pract. 2021, 12, 04021063. [Google Scholar] [CrossRef]
Figure 1. Cumulative curve of particle size distribution of samples.
Water 16 00093 g001
Figure 2. Leakage erosion-damage soil-test system for water supply pipe network.
Water 16 00093 g002
Figure 3. Preparation process of test soil: (a) crushing soil samples; (b) configuration 15% moisture content; (c) compacted samples; (d) laying pipes.
Water 16 00093 g003
Figure 4. Leakage erosion process of pipeline (a) before test; (b) after 5 min; (c) after 10 min; (d) after 15 min; (e) after 20 min; (f) after 25 min; (g) after 30 min; (h) after 35 min; (i) after 40 min.
Water 16 00093 g004
Figure 5. The effect of flow velocity on cavity development. (a) The change in the diameter of the bottom surface of the cavity under different flow rates. (b) The change in the width of the upper bottom surface of the cavity at different flow rates. (c) The change in cavity height under different flow rates.
Water 16 00093 g005aWater 16 00093 g005b
Figure 6. Effect of leakage size on erosion rate.
Water 16 00093 g006
Figure 7. Piping placement of different leakage port angles.
Water 16 00093 g007
Figure 8. Effect of leakage direction on erosion rate.
Water 16 00093 g008
Figure 9. The process of water flow scouring soil to form cavity. (a) Early stage. (b) Rapid development stage. (c) Hollow expansion stage.
Water 16 00093 g009
Figure 10. Numerical calculation of cavity volume change.
Water 16 00093 g010
Table 1. Physical and mechanical parameters of undisturbed soil samples.
Density
(g/cm3)
Median Diameter D50 (um)Water Content
(%)
Force of Cohesion
c (kPa)
Angle of Internal Friction
φ (°)
Void RatioPermeability Coefficient
(m/s)
1.756.4216.821. 520.160.655 × 10−6
Table 2. Experimental scheme.
Test NumberNumberFlow Velocity
v1 (m/s)
Leakage Port Size
d2 (mm)
Leakage Port Angle
φ (°)
T-110.56690
20.8690
31.3690
41.58690
T-251.3290
61.3490
71.3690
81.3890
T-391.360
101.3630
111.3660
121.3690
Table 3. The average erosion rate of cavity under different flow velocities.
Water Flow Velocity
v1 (m/s)
Test
Number
Time
t (s)
Lower Bottom Erosion Average Rate
E1 (mm/s)
Average Erosion Rate of Upper Bottom Surface
E2 (mm/s)
Height Average
Erosion Rate
E3 (mm/s)
Volume Erosion
Average Rate
E4 (mm3/s)
0.53124000.01080.03120.02550.0145
0.8224000.01120.05190.03510.0484
1.3324000.01650.09030.09390.2200
1.58424000.02860.09500.12260.3015
Table 4. Numerical simulation parameters of sample characteristics.
Median Particle Size (μm)Density (g/cm3)Critical Shields NumberUnderwater Repose AngleBed Load
Coefficient
Carryover Coefficient
6.421.750.038236°80.018
Table 5. Comparison of cavity volume between T-2 numerical simulation and physical model test.
T-2Cavity Volume (m3)Error Rate (%)
Physical ModelNumerical Simulation
1-10.07840.092113.5
1-20.35450.37598.8
1-31.11451.13269.8
1-41.34561.484510.3
Disclaimer/Publisher’s Note: The statements, opinions and data contained in all publications are solely those of the individual author(s) and contributor(s) and not of MDPI and/or the editor(s). MDPI and/or the editor(s) disclaim responsibility for any injury to people or property resulting from any ideas, methods, instructions or products referred to in the content.

